Abstract
In this study, molecular-genetic analyses were carried out to identify resistance to yellow rust (Puccinia striiformis f. sp. tritici) in soft wheat (Triticum aestivum L.) samples. Yellow rust is one of the most destructive diseases of wheat worldwide, causing significant yield losses and posing a serious threat to global food security, particularly under changing climatic conditions. The disease is also highly prevalent in Central Asian countries, including Uzbekistan and Tajikistan, where wheat is a staple crop and ensuring stable production is of strategic importance. A total of 68 wheat genotypes were examined and genotyped using 42 highly polymorphic DNA markers. Based on the obtained phenotypic and genotypic data, association analysis was performed using the TASSEL and STRUCTURE programs. To identify genetic associations, GLM (General Linear Model) and MLM (Mixed Linear Model) statistical models were applied. The analysis revealed that the following markers showed significant and reliable associations with yellow rust resistance: Barc0187 (p=0.0040), Gwm340 (p=0.0043), Barc008 (p=0.0132), and Gwm111 (p=0.0147). These markers are recommended as reliable molecular indicators for identifying yellow rust-resistant genotypes and for improving marker-assisted selection (MAS) strategies in future wheat breeding programs.
-
Key words: Wheat (Triticum aestivum L.), DNA markers, yellow rust, genetic polymorphism, resistance alleles, GLM
Introduction
Wheat (
Triticum aestivum L.) is one of the world’s most important staple crops, grown on over 219 million hectares with an annual production exceeding 760 million tons. It supplies about 20% of the global daily caloric intake. However, climate change has intensified biotic and abiotic stresses, including heat, drought, and rust diseases, which pose major threats to wheat cultivation. Among these, rusts caused by biotrophic fungi are the most destructive, contributing together with insect pests to an estimated 21.5% annual yield loss worldwide. Stripe rust is especially harmful, as it can attack wheat at all growth stages—from seedlings to maturity—and is now reported in more than 60 countries across every continent except Antarctica (
Schadt et al. 2010).
The disease has significantly reduced both yield and quality. Two races of
P. striiformis (PstS5 and PstS9) have caused widespread outbreaks in Tajikistan, Uzbekistan, and other countries of Central Asia since 2009, with the fungus accounting for more than 90% of the Central Asian population (
Rahmatov 2016). In the United States, up to 137 races of yellow rust have been identified, 59 of which were detected before 2000, while the remaining races were identified after 2000. In recent years, many new races have been recorded due to the further spread of the pathogen (
Miller 1983).
Wheat is one of the three most widely cultivated cereal crops in the world (
Neupane et al. 2022). However, its productivity is constrained by various abiotic and biotic factors. Among the most harmful is yellow rust (
Puccinia striiformis Westend. f. sp.
tritici), which has a substantial negative impact on wheat yield. The disease drastically reduces the photosynthetic area of leaves, resulting in significant losses in both yield and grain quality. The extent of these losses depends on environmental conditions, pathogen virulence, and the genotype of the host plant. According to (
Bhardwaj et al. 2019), yield reduction can sometimes exceed 50%. Although fungicides are widely used to control the disease, the cultivation of resistant varieties is considered a more environmentally friendly and sustainable approach (
Kuraparthy et al. 2007).
In wheat, resistance to yellow rust is determined by Yr genes. Research conducted to date has identified numerous genes and DNA loci that confer resistance to various pathogen races. Using molecular studies, more than 70 Yr genes have been characterized (
Peng et al. 2017). DNA fragments detectable through PCR markers are often reported as reliable molecular indicators of disease resistance (
Elyasi-Gomari et al. 2009) Mapping the locations of resistance genes in wheat has greatly contributed to the development of markers and the rapid identification of resistant varieties using molecular methods.
In a study conducted by Turkish researchers (
Palabıyık et al. 2022), the efficiency of molecular markers associated with nine resistance genes against yellow rust (Yr9, Yr10, Yr15, Yr26, Yr29, Yr36, Yr48, Yr51, and YrCH52) was investigated using the PCR method. The set of markers included Xgwm582, RgaYr10a, Xgwm413, Xgwm11, Wmc44, Barc101, Cfa2149, Sun104, and Xgwm273. Twenty bread wheat varieties were used as experimental material. The results demonstrated that the major resistance genes could be successfully identified by these markers, and their efficiency was evaluated according to homozygous and heterozygous states. Furthermore, it was revealed that markers such as RgaYr10a, Xgwm413, Barc101, and Cfa2149, which produced positive results in all tested varieties, exhibited relatively low efficiency.
Pathogenicity of wheat yellow rust disease; varies from year to year and from region to region, depending on the susceptibility of the varieties, the race of the pathogen, and environmental conditions, especially humidity and precipitation (
Chen 2005).
According to the results of yellow rust resistance evaluations conducted in the YRTN isogenic line nursery, wheat genotypes carrying the Yr5, Yr10, Yr15, and YrSp genes demonstrated complete resistance. Genotypes with the Yr3, Yr4, Yr32, and Yr27 genes showed moderate resistance, while those with the Yr2, Yr7, Yr25, and YrND genes exhibited moderate susceptibility. As a result of this study, highly resistant genotypes were identified, providing a foundation for further molecular investigations (To‘Raqulov et al. 2024).
In recent years, the spread of yellow rust across key wheat-growing regions has caused considerable yield reductions. The development of molecular marker technologies has provided powerful tools to tackle such complex issues. Among these, DNA-based molecular markers utilizing the polymerase chain reaction (PCR) present clear advantages compared to conventional selection methods based solely on phenotypic traits (
Chen 2005). Marker-assisted selection (MAS) has therefore been extensively adopted to identify and incorporate rust resistance genes across different breeding generations. This approach enhances the efficiency of plant breeding programs, particularly by addressing limitations inherent in traditional phenotypic screening. Furthermore, applying MAS in the early generations of hybrids allows the simultaneous use of multiple DNA markers, enabling the detection of several resistance genes in a single analysis.
Materials and Methods
Molecular research was conducted at the Bioresources and Stress Biology Laboratory of the Institute of Genetics and Experimental Plant Biology, Academy of Sciences of Uzbekistan. The list of samples taken from this collection is presented in
Plant Materials. Within the scope of this study, the soft wheat (
Triticum aestivum L.) samples listed in the table below were used as plant materials for analysis (
Table 1).
The genomic DNA from young leaves of wheat seedlings was isolated using the CTAB method according to (
Sun et al. 2002) with minor modifications (
Sun et al. 2002). This method was optimized to ensure maximum yield and purity of DNA suitable for downstream molecular applications.
For the molecular characterization of wheat genotypes, a panel of 11 well-documented and highly reproducible simple sequence repeat (SSR) markers associated with resistance to yellow rust was employed. These markers were carefully selected based on previously validated studies published in high-impact international journals. PCR amplifications were conducted on a T100 Thermal Cycler (BIO-RAD, USA) using the “Hot Start” PCR protocol, which significantly improves amplification efficiency and specificity by minimizing non-specific binding and primer-dimer formation.
PCR amplification for microsatellite primers was carried out in a total reaction volume of 25 μl containing 10 ng of template DNA, 1X Taq polymerase reaction buffer, 2 mm MgCl2, 0.1 mm each of dNTPs (dATP, dCTP, dGTP, and dTTP), 0.2 mM primer and 1 U of Taq DNA polymerase (Fermentas). Amplifications were performed in a Techne TC Plus thermocycler (Techne Inc.) programmed as follows: 3 minutes denaturation at 94℃ and 35 cycles of 1 minutes. each denaturation at 94℃, 1 minutes annealing at 50-60℃ for SSR amplification, and a 2 minutes extension at 72℃, followed by a final extension at 72℃ for 7 minutes. Primer sequence information was obtained from the Grain Genes database. Grain Genes A Database for Triticeae and Avena.
https://wheat.pw.usda.gov (29.11.2022).
Amplified PCR products were resolved according to their molecular size through agarose gel electrophoresis. Electrophoretic separation was carried out using 2.5-3.0% high-resolution agarose gels (CondaLab, Spain), which enabled clear discrimination of allele sizes. Visualization and digital documentation of banding patterns were achieved using the GelDoc Go Gel Imaging System (BIO-RAD, USA), providing precise genotyping data for further analysis.
Population structure analysis and TASSEL
To determine the population structure (Q) and subpopulations (K), analyses were performed using the program Structure v.2.3.4 (
Pritchard et al. 2000). A total of 280 independent runs were conducted across a range of K values from 2 to 10, with each run consisting of 100,000 Markov Chain Monte Carlo (MCMC) iterations. To ensure reliability, each K value was tested through ten independent replicates. The most appropriate K value was identified using the ΔK method proposed by (
Evanno et al. 2005). The output from Structure was further processed and visualized using the Structure Selector online platform (
https://lmme.ac.cn/StructureSelector/), which provided clearer interpretation of the population structure and clustering patterns among genotypes.
For the assessment of genetic relationships and the execution of association analyses, the program TASSEL v.5.0 was employed (
Smith et al. 2007) Using both the General Linear Model (GLM) and the Mixed Linear Model (MLM), phenotypic data on yellow rust resistance and genotypic information derived from molecular markers were jointly analyzed. This approach enabled the identification of markers significantly associated with resistance traits, thus providing a solid scientific basis for their application in breeding programs. A significance threshold of
p<0.05 was used as the statistical criterion for marker-trait associations.
The genetic variation among bread wheat and wild wheat genotypes was assessed using GenAlex version 6.5 (
Peakall et al. 2006). In accordance with the methodology described by (
Nei et al. 1979), several genetic diversity parameters were calculated, including the total number of alleles per locus (Na), the number of effective alleles per locus (Ne), Shannon’s information index (I), observed gene diversity (h), and unbiased gene diversity (uh).
Results
To assess the genetic polymorphism of the wheat varieties using the panel of DNA markers, genomic DNA was extracted using the CTAB method. The quality and quantity of DNA samples were evaluated using 0.9% agarose gel electrophoresis and spectrophotometric analysis, after which PCR amplification was performed.
Molecular identification of Yr5 gene. The
Yr5 gene, which confers resistance to stripe rust in wheat, was first reported to have been derived from
Triticum spelta var. album (
Macer 1963). This gene provides effective resistance from the seedling to the adult plant stage and is classified as a resistance gene located on chromosome 2BL (
Law 1976). Among the molecular markers closely linked to
Yr5, three belong to the SSR type (Xgwm501, Barc349;
Sun et al. 2002), and five are STS markers (S19M93, S23M41 - (
Smith et al. 2007); STS7/8, STS-9/10, Yr5STS-9/10 - (
Murphy et al. 2009). The diagnostic significance of these markers has been confirmed in various wheat genotypes.
In our experiments, the markers Barc349, S19M93, S23M41, STS7/8, STS-9/10, and Yr5STS-9/10 exhibited monomorphic patterns. The SSR marker Xgwm501 was found to be located 10.5-13.3 cM away from the
Yr5 gene (
McGrann et al. 2014). In our results, bands of different sizes (100 bp, 180 bp, 190 bp, and 200 bp) were detected. Among them, nine genotypes (13.2%) produced the expected 100 bp band, indicating the probable presence of the
Yr5 gene.
Yr9. To identify the
Yr9 gene, primers previously reported in the literature were used. The primer pair P6M12P recommended by (
Mago et al. 2005) amplifies fragments of 250 bp and 350 bp, which have been confirmed to be linked with the
Yr9 gene in earlier studies (
Gebreslasie et al. 2020). In our results, amplification using the P6M12P marker also produced 250 bp and 350 bp fragments, which were detected in 14 genotypes, suggesting the possible presence of the
Yr9 gene in these samples.
Yr10. The dominant stripe rust resistance gene
Yr10 was initially identified in wheat line PI 178383 and the cultivar Moro (
Chen et al. 2009). This gene is located on chromosome 1BS, approximately 2 cM from the
Rg1 locus, which determines the brown color of the glume (
Metzger et al. 1970), and 5 cM from the
Gli-1B locus (
Payne et al. 1986). The
Yr10 gene has also been mapped to different loci on chromosome groups 1 and 6 of wheat. (
Bariana et al. 2002) confirmed a close linkage between the
Yr10 gene and the
Gli-B1 locus through genetic analysis of the Moro cultivar. Today,
Yr10 remains an important source of effective resistance to stripe rust in many regions worldwide.
The SSR marker
Xpsp3000, located in the distal region of chromosome 1BS, is linked to
Yr10 at a distance of 1.2 (
Hasan 2013). This marker amplifies a 260 bp fragment, which serves as a diagnostic band closely linked to
Yr10 and is widely used in breeding programs. Due to its codominant inheritance,
Xpsp3000 allows clear differentiation of genotypes at various developmental stages and is highly effective for marker-assisted selection (MAS;
Bariana et al. 2002).
In our study, a 240 bp fragment was detected in 31 genotypes, indicating the possible presence of the
Yr10 gene. In the remaining 37 genotypes, this gene was not observed. Furthermore, the
Yr10SCAR marker, located 0.5 cM from
Yr10 and closely linked to it (
Smith et al. 2007), was also tested. Using this marker, a specific 240 bp fragment was recorded as a diagnostic band associated with
Yr10. The
Yr10 genotype was used as a positive control. As a result, six genotypes (15, 16, 21, 24, 31, 38) were identified as
Yr10 carriers, showing the characteristic band corresponding to the
Yr10SCAR marker.
Yr15. The
Yr15 gene was originally derived from wild wheat (
Triticum dicoccoides) and has been characterized by several researchers (
Murphy et al. 2009;
Peng et al. 2017;
Sun et al. 2002). This gene is located at a distance of 6.4 cM, flanked proximally by the markers
Xgwm413 (2.5 cM) and
Xgwm273. These markers have been reported to possess high diagnostic accuracy in different genetic backgrounds (
Murphy et al. 2009). Researchers from Kazakhstan have also successfully used these markers in their studies (
Kokhmetova et al. 2021).
In our investigation, the markers
Barc008,
Xgwm413, and
Xgwm273 were used to identify
Yr15 in 68 samples. The
Barc008 marker amplified a 220 bp fragment corresponding to the resistant allele of
Yr15. Among the tested genotypes, two samples (5, 12, 13, 29, 37 and 65) produced the expected PCR product. When using
Xgwm413, a 100 bp diagnostic band was detected in nine genotypes (5, 10, 16, 21, 24, 35, 42, 45, 68). The
Xgwm273 marker amplified a 125 bp fragment in 42 genotypes. These results confirm the presence of the
Yr15 gene in some genotypes and demonstrate the efficiency of these markers for molecular identification (
Fig. 1).
Yr18. In studies conducted by Ethiopian researchers using gene-specific markers (
L34DINT9F and
L34PLUSR), the
Yr18 gene was identified in 27% of wheat genotypes (
Gebreslasie et al. 2020); Similarly, (
Evanno et al. 2005) reported that
Yr18 was present in 89.6% of 231 Chinese wheat varieties and in 6.1% of 422 local cultivars. In our study,
Yr18 was detected using the SSR markers
Xgwm295,
Xgwm268, and
Gwm340, which amplified fragments of 250 bp, 240 bp, and 250 bp, respectively. Ten genotypes (5, 37, 39, 42, 43, 44, 54, 56, 60, 68) produced bands with all three markers, suggesting the possible presence of the
Yr18 gene. The
Yr18/3 Avocet S genotype was used as a positive control.
Yr29. In Ethiopia, the
Yr29 gene was identified using the STS marker
Bac17R and the SSR marker
Wmc44 (
Ren et al. 2012). Similarly, studies conducted in Turkey revealed that the wheat cultivars
Kirgiz-95 and
Bolal-2973 showed a positive 242 bp band when analyzed with
Wmc44 (
Palabıyık et al. 2022).
In our study, the primer pairs Gwm140 and Wmc44 were used to detect the presence of Yr29. Molecular analysis revealed that Gwm140 amplified a 225 bp diagnostic fragment, while Wmc44 produced a 245 bp fragment. These results confirm that the markers can be effectively used for the identification of the Yr29 gene.
YrJ22. Currently, three stripe rust resistance genes expressed at the seedling stage have been identified on the long arm of chromosome 2A. Two of them have been officially designated as
Yr1 and
Yr32, while another is conditionally referred to as
YrJ22 (
Bansal et al. 2009;
Chen et al. 2009). The marker
Wmc658 has been used to detect
YrJ22, and its presence has been confirmed in 29 isogenic lines and wheat cultivars.
Yr32. The
Yr32 gene was first identified in the cultivar
Carstens V (
Stubbs 1985) and is located on chromosome 4D. One of the markers closely linked to this gene is
WMC198, located 0.2 cM away, which amplifies a 280 bp allele (
Eriksen et al. 2004) In our study, the markers
Wmc382,
Xgwm311, and
Wmc198 amplified diagnostic alleles of 180 bp, 110 bp, and 280 bp, respectively. The results obtained with these three markers were consistent and mutually supportive. Based on this, 17 genotypes (4, 5, 7, 8, 12, 14, 18, 23, 26, 28, 32, 33, 34, 36, 37,42,66)—representing 25% of all samples—were identified as carriers of the
Yr32 gene.
Yr62. In the study conducted by (
Liu et al. 2013), two SSR markers (
Gwm192 and
Gwm251) closely linked to the
Yr62 gene were identified and mapped. These markers amplify diagnostic bands of 200 bp and 300 bp, respectively. According to our results, the presence of the
Yr62 gene was confirmed in 40 analyzed samples. According to the results of the PCR analyses, products specific to
Yr genes were detected in all the studied cultivars. Based on these findings, it can be concluded that most wheat varieties are likely to carry these resistance genes. However, the susceptibility reactions observed in some cultivars under field conditions can be explained by two factors. First, resistance is often controlled by multiple genes or their combinations; therefore, the presence of a single gene detected by one marker may not ensure complete resistance. Second, the diagnostic efficiency of markers may decline over time, or the emergence of new pathogen races may reduce their effectiveness (
Ren et al. 2012).
Analysis of Population Structure
To identify genetic markers associated with stripe rust resistance, association analyses were performed based on genotypic and phenotypic data. In such studies, analyzing the population structure is crucial for determining the true relationship between markers and traits. Therefore, the genetic composition of 68 wheat genotypes was examined using the
STRUCTURE v.2.3.4 software package (
Pritchard et al. 2000).
This program, which applies a
Bayesian approach, allowed the assessment of genetic similarity and differentiation levels among individuals within the population. The analysis was performed using a predefined number of clusters (K) ranging from
K = 1 to K = 10. The optimal number of clusters was determined using the
Evanno test (
Evanno et al. 2005), which showed a peak value of
ΔK = 3. This result indicated that the population could be divided into
three subpopulations.
The results obtained from the STRUCTURE analysis were further processed using the
Structure Selector online platform (
https://lmme.ac.cn/StructureSelector/), and the clustering patterns identified served as the basis for the subsequent
marker-trait association analysis (
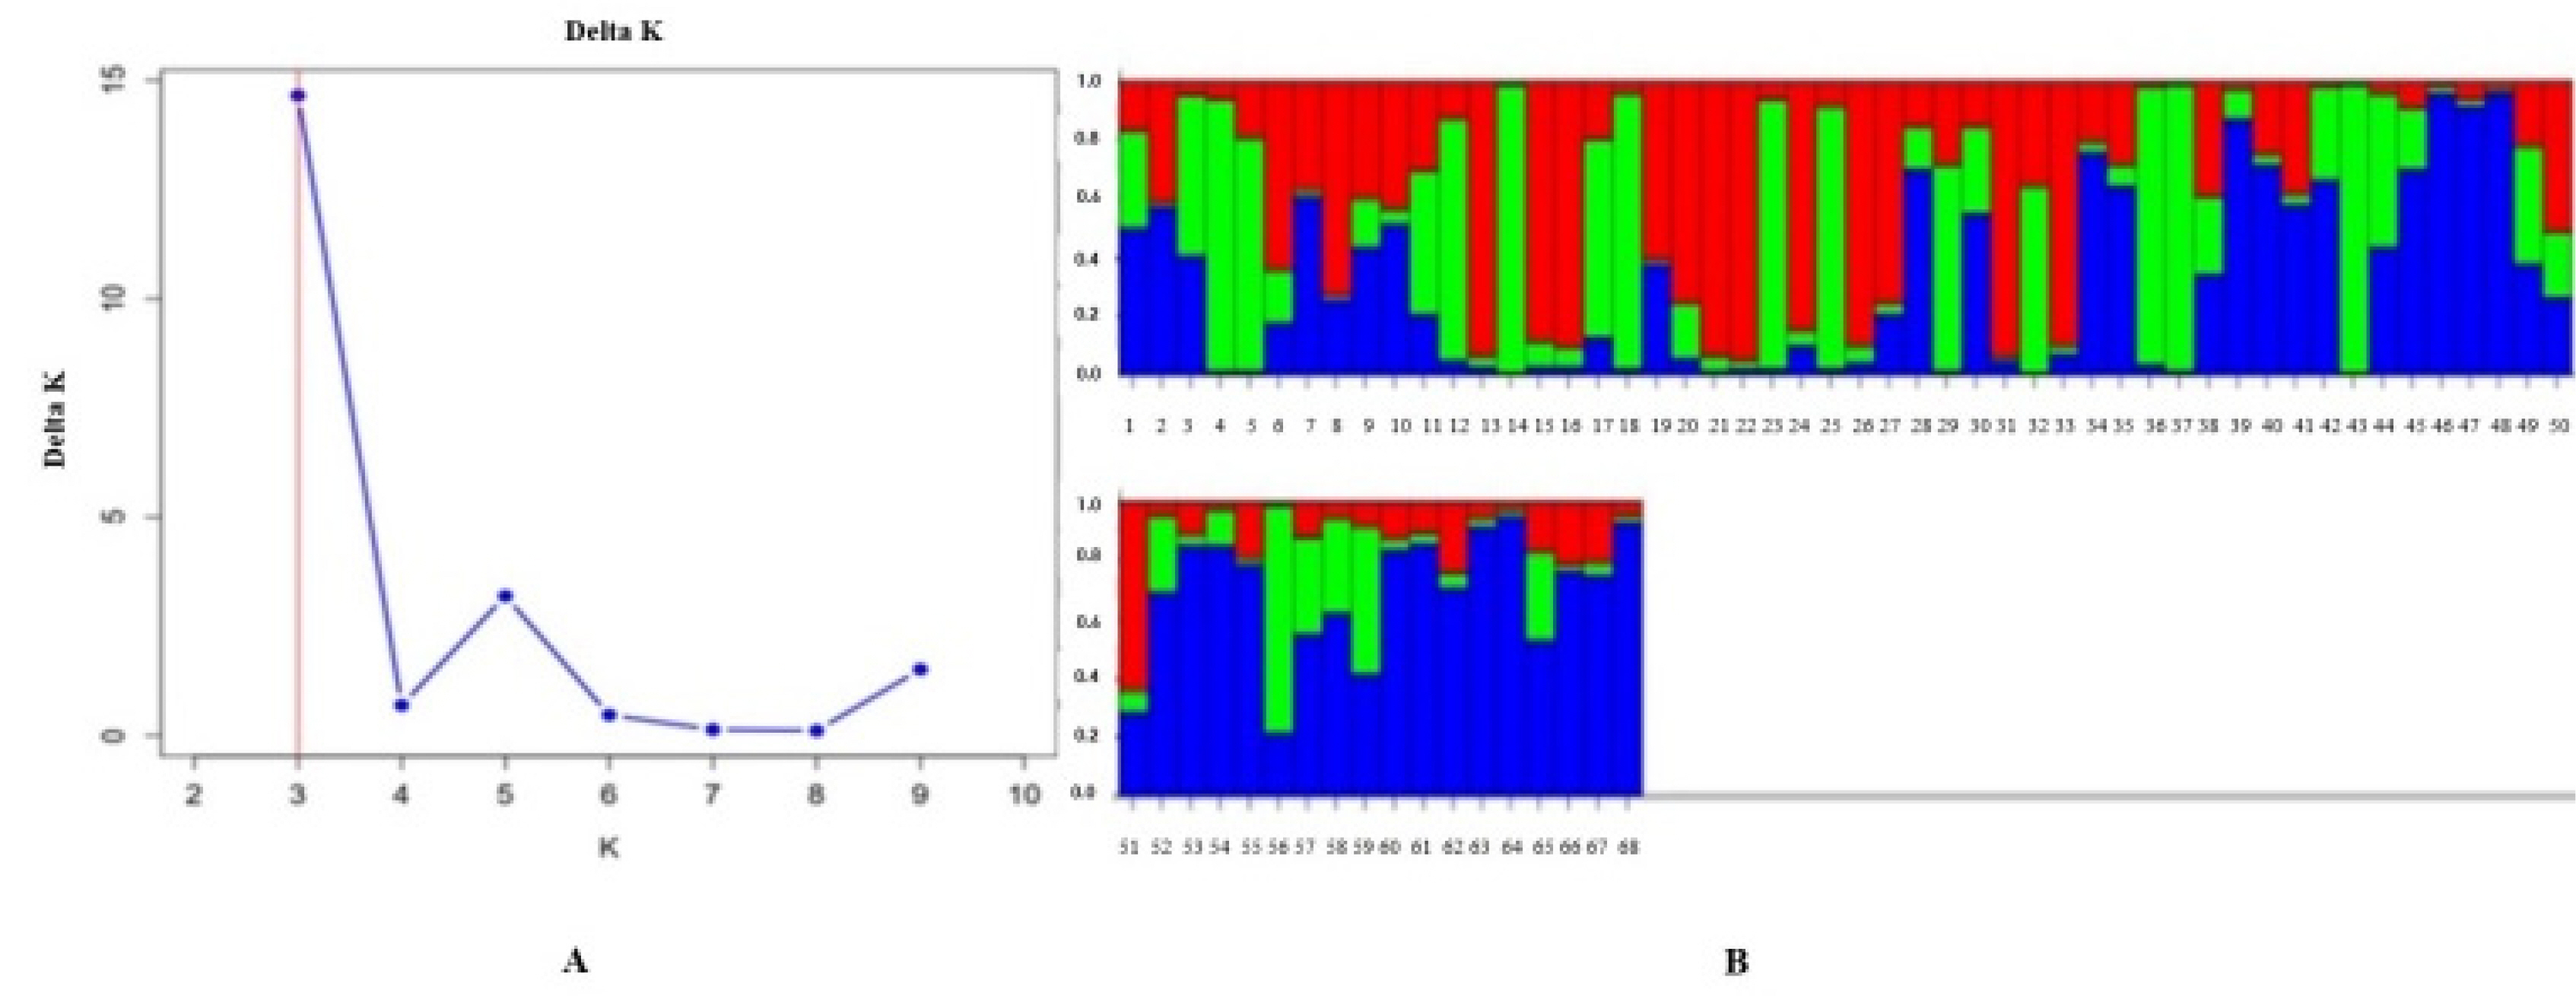
Fig. 2).
Resistance to stripe rust, along with phenotypic and genotypic data and the kinship matrix, was considered, and analyses were conducted using both the General Linear Model (GLM) and Mixed Linear Model (MLM). The data included the disease severity scores for stripe rust and information from 42 highly polymorphic markers identified in backcross progenies.
To determine significant associations between markers and phenotypic traits, association analyses were conducted in the TASSEL software using both GLM and MLM models. When markers associated with stripe rust resistance showed consistent results across both models, their genetic associations were considered reliable.
The analyses revealed that markers with a
p-value<0.05 were statistically significant. In the GLM analysis, R
2 values ranged from 0.0869 to 0.1169, while in the MLM analysis, they ranged from 0.0709 to 0.0909, indicating a clear and stable genetic association between the markers and the trait for stripe rust resistance (
Table 2).
GLM and MLM analyses associated with stripe rust resistance were performed on wheat genotypes, and the results were visualized in the form of a Manhattan plot. During the analysis, the threshold p-value was set at 1.7. In both models, significant genetic associations were observed between the trait and the Barc0187, Gwm340, and Barc0008 markers. The Barc0187 primer showed a p-value of 0.0040 in the GLM analysis and 0.0162 in the MLM analysis, indicating a statistically significant association of this marker with the stripe rust resistance trait.
The R2 value of the Barc0187 marker was 0.1162 in the GLM analysis and 0.0909 in the MLM analysis. Moreover, the LOG10(P) position for this marker in the GLM model was 2.4, further confirming its statistically significant association with stripe rust resistance.
For the Gwm340 primer, the p-value was 0.0043 in the GLM analysis and 0.0174 in the MLM analysis, indicating a stable and significant association of this marker with the trait. Similarly, the Barc0008 primer showed p-values of 0.0132 (GLM) and 0.0179 (MLM), demonstrating a reliable association between this marker and the stripe rust resistance trait.
Based on the results of the GLM and MLM analyses, the identified markers can serve as effective tools for early selection of stripe rust-resistant wheat varieties through marker-assisted selection (MAS). The use of these markers provides an accurate and rapid assessment of the resistance level of genotypes to stripe rust. These findings confirm the importance of marker-based identification of stripe rust-resistant plants in breeding programs.
The Analysis of Molecular Variance (AMOVA)
The Analysis of Molecular Variance (AMOVA) was conducted to evaluate genetic variability both among and within populations. This method was applied to assess genetic differences and diversity between wheat cultivars and isogenic lines using statistical parameters. As presented in the table, the genetic variance among populations accounted for 22%, indicating that only a small proportion of the total variation was attributable to differences between populations. In contrast, the genetic variance within populations was 78%, reflecting a high level of genetic diversity among individuals within the populations (
Fig. 3).
In addition, the fact that the variance Among Individuals accounted for 0% indicates that while there is a high level of genetic variation within populations, no significant genetic differences were detected among individuals (
Table 3).
The Fst (genetic differentiation) value was estimated at 0.373, indicating a relatively high level of genetic divergence among populations. The corresponding P-value of 0.01 confirmed that this differentiation was statistically significant. The Fis (inbreeding coefficient) was calculated as -0.1000, and this negative value suggests an excess of homozygosity, reflecting substantial genetic variation within individuals. However, the p-value of 1.000 implies that this variation was not statistically significant. The Fit (total inbreeding coefficient) was -0.222, which indicates low levels of genetic differentiation within populations, while its p-value of 0.987 further supports the lack of statistical significance in overall genetic divergence.
The maximum FST value observed was 0.604, representing a pronounced degree of genetic differentiation, while the mean FST value of 0.527 reflected a moderate level of genetic divergence among populations.
Overall, the AMOVA analysis demonstrated that genetic variation was relatively low among populations but considerably higher within individuals. Based on Fst and Nm estimates, population differentiation and gene flow were evaluated, providing valuable insights into the genetic structure and relationships among the studied wheat varieties.
Discussion
In this study, an association analysis was performed to identify molecular markers linked to yellow rust (
Puccinia striiformis f. sp. tritici) resistance in soft wheat (
Triticum aestivum L.) genotypes. A total of 68 wheat samples were genotyped using 42 highly polymorphic SSR markers, and statistical analyses were conducted in the TASSEL software using the GLM (General Linear Model) and MLM (Mixed Linear Model) approaches. As a result, the markers Barc0187 (
p=0.0040), Gwm340 (
p=0.0043), Barc0008 (
p=0.0132), and Gwm111 (
p=0.0147) were identified as significantly associated with yellow rust resistance. These results are consistent with previous studies, confirming the reliability and scientific validity of the findings. (
Peng et al. 2017) conducted a GWAS using 9,858 SNP markers and identified 110 significant associations, of which 28 were stable across multiple environments. Their use of both GLM and MLM models is methodologically comparable to our approach. In both studies, markers that remained significant across models were considered highly reliable—an observation that aligns with our results. (
Herrera-Foessel et al. 2012), using the MLM model on Chinese landraces, identified 32 loci significantly associated with yellow rust resistance. Their loci were found in chromosomal regions close to those where Gwm340 and Barc0187 are located in our study. This suggests that these markers may reside near previously reported QTLs conferring resistance to yellow rust, further supporting their reliability. Similarly, (
Smith et al. 2007) identified 70 marker-trait associations for yellow rust resistance in pre-breeding germplasms using both GLM and MLM models. The consistency of results between these models in their research and ours reinforces the stability of the identified markers and their potential value in breeding programs. (
Bariana et al. 2002) reported that the SSR marker linked to the
Yr5 gene showed a high correlation with resistance to yellow rust. The markers used in their study (such as Xgwm120 and Wmc175) may be genetically close to our Gwm111 marker, suggesting that Gwm111 could be located near genomic regions harboring rust resistance genes. (
Liu et al. 2013) identified alleles associated with yellow rust (YR), leaf rust (LR), and stem rust (SR) resistance through GWAS, highlighting multiple genetic components involved in rust resistance. Consistent with their findings, our results also indicate that yellow rust resistance is a polygenic trait controlled by multiple loci, with several markers contributing to the overall resistance mechanism. (
Elyasi-Gomari et al. 2009) used the GLM model to detect 14 SNP markers significantly associated with yellow rust resistance. However, since they relied solely on the GLM approach, some false-positive associations were reported. In contrast, by integrating both GLM and MLM models, our study minimized false associations and improved the accuracy of marker detection. (
Bhardwaj et al. 2019) and (
Elyasi-Gomari et al. 2009) employed DArT markers to identify genomic regions associated with yellow rust resistance, incorporating population structure into their MLM analyses. Although our study was conducted on a smaller sample size, it followed a similar methodological framework and produced reliable marker-trait associations. (
Sun et al. 2002) combined GWAS and transcriptomic data to identify genes associated with yellow rust resistance using 3,475 SNP markers. This integrative approach helped clarify the relationship between gene expression and molecular markers. Although transcriptomic analysis was not included in our current study, incorporating such data in future research could provide deeper insight into the functional basis of resistance-associated markers.
Overall, our results are in strong agreement with numerous international studies and confirm that the combined use of GLM and MLM models enhances the reliability of association mapping. In particular, the low p-values obtained for Barc0187 and Gwm340 (p<0.005) indicate their strong association with yellow rust resistance.
In conclusion, these markers can serve as reliable molecular indicators for marker-assisted selection (MAS) in breeding programs aimed at developing resistant cultivars. Future research should focus on validating these markers across broader populations and diverse environments. Integrating SNP genotyping and gene expression data will also be valuable for unraveling the complex genetic mechanisms underlying durable resistance to yellow rust in wheat.
Conclusion
In conclusion, the present study successfully identified significant molecular markers associated with yellow rust resistance in soft wheat (Triticum aestivum L.). The markers Barc0187, Gwm340, Barc008, and Gwm111 demonstrated consistent and reliable associations with resistance traits based on both GLM and MLM analyses. These markers can be effectively utilized in marker-assisted selection (MAS) to accelerate the development of yellow rust-resistant wheat genotypes. The findings provide valuable insights and genetic resources for improving wheat breeding programs, particularly under the agro-climatic conditions of Central Asia, where yellow rust remains a major constraint to sustainable wheat production.
Acknowledgments
This research was carried out within the framework of the budget program of the Institute of Genetics of the Academy of Sciences of the Republic of Uzbekistan. The authors express their gratitude to this organization.
Fig. 1Representative agarose gel electrophoresis profile showing the evaluation of yellow rust resistance in 68 wheat genotypes using SSR marker Barc008 associated with the Yr15 resistance gene. M: molecular weight marker. The sequence of varieties and lines (lanes 1-68) corresponds to the order presented in
Table 1.
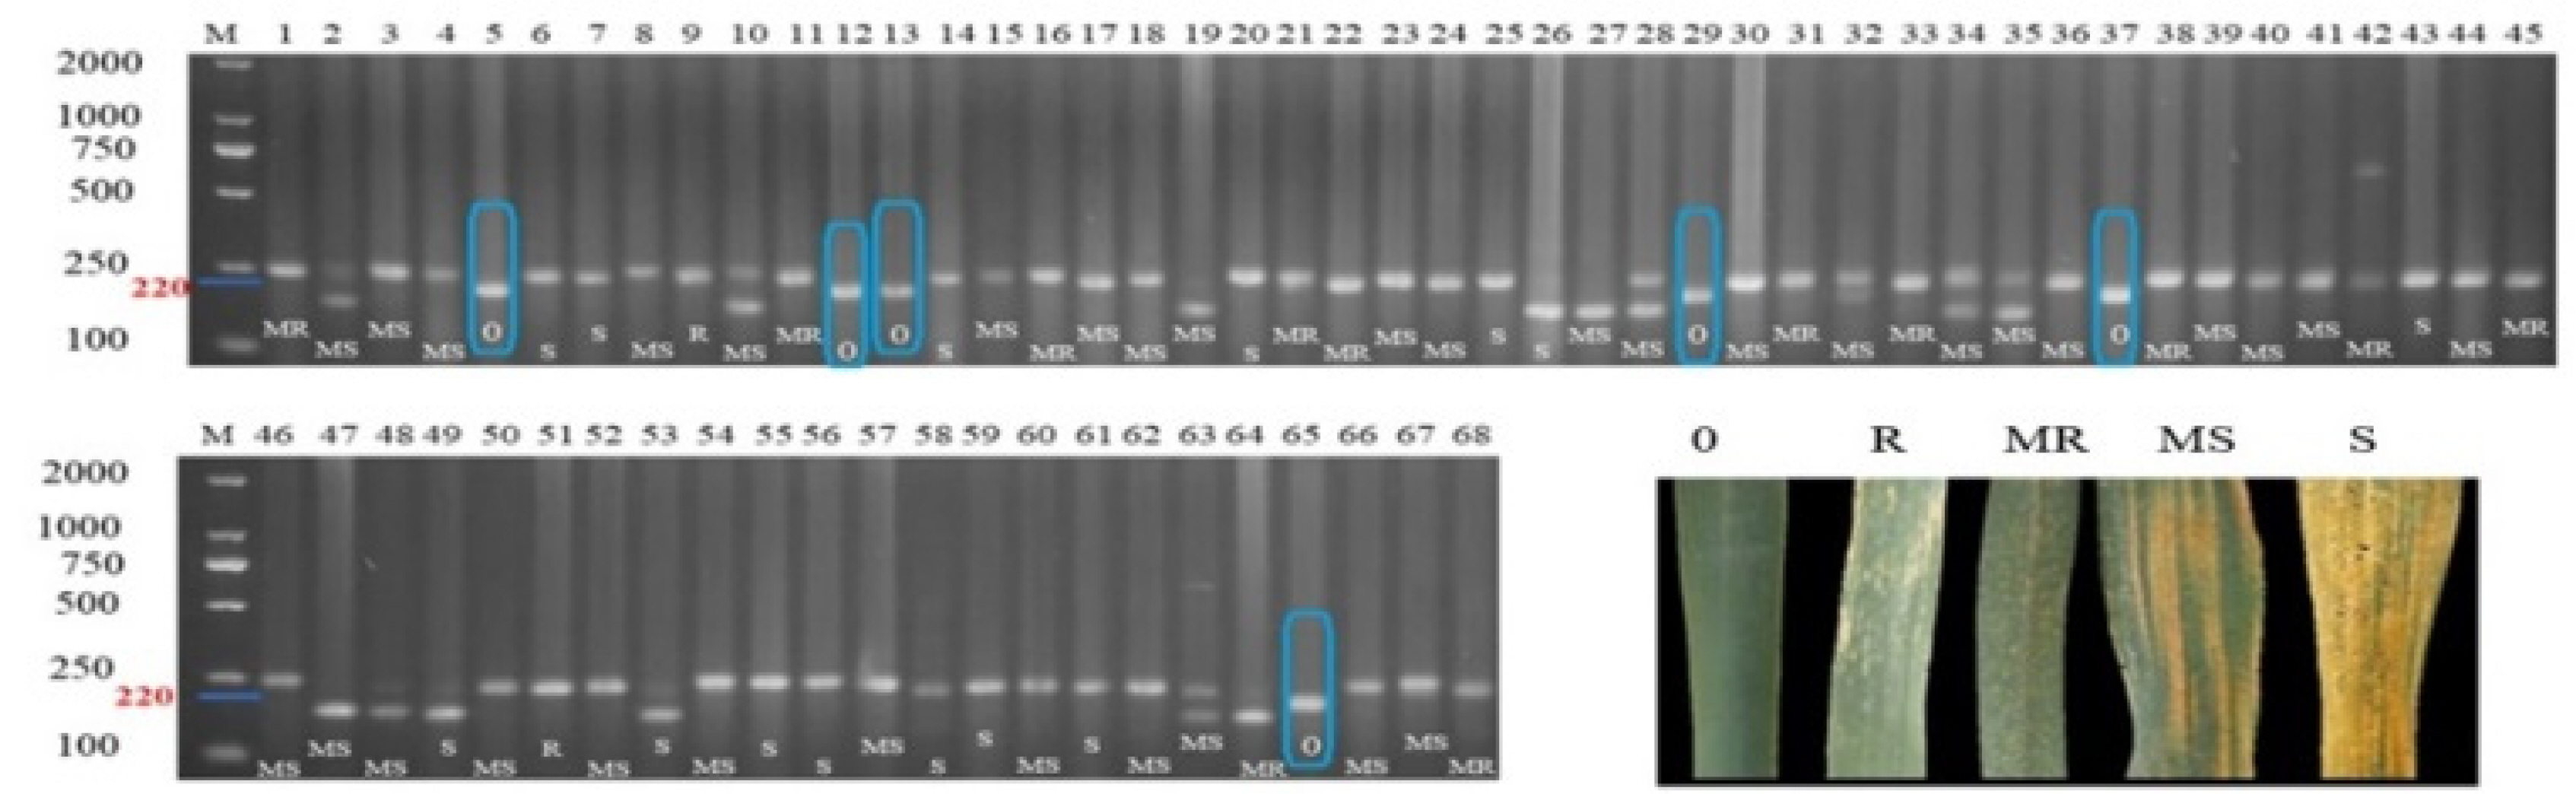
Fig. 2Population structure analysis of wheat genotypes. (A) The most probable number of subpopulations based on Delta K values. (B) Genetic structure of the population based on Q-values.

Fig. 3Percentage distribution of molecular variance among and within wheat populations based on AMOVA.
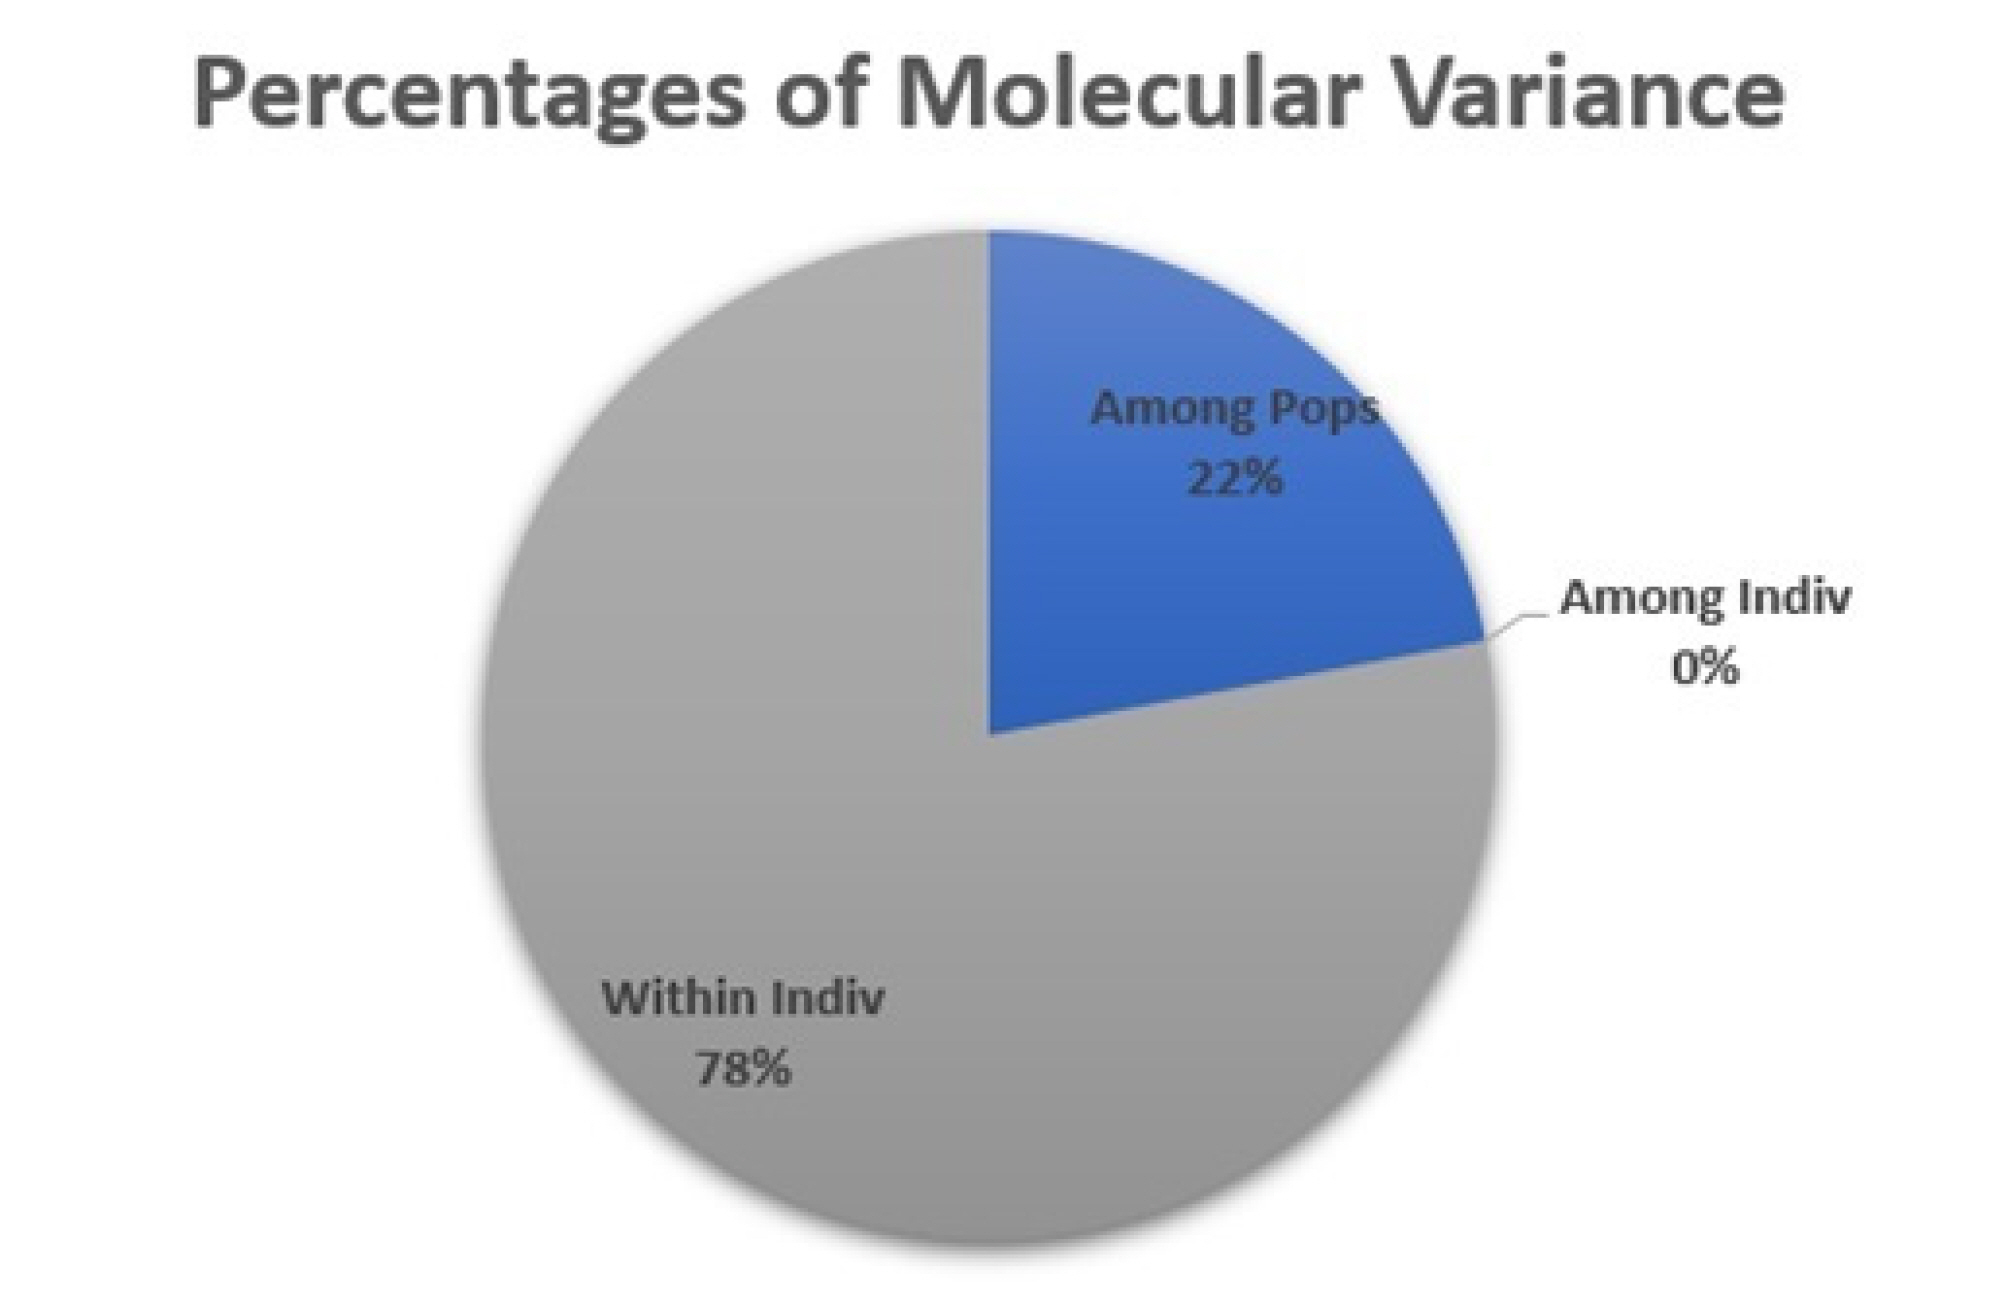
Table 1List of soft wheat (Triticum aestivum L.) varieties and samples used in the study.
Table 1
|
№ |
Research samples |
№ |
Research samples |
№ |
Research samples |
№ |
Research samples |
№ |
Research samples |
|
1 |
Ezoz |
15 |
Heine’s Kolben (S;Yr6+1) |
29 |
Yr10/6 Avoset S |
43 |
Yr18/3 Avoset S |
57 |
Krasnadar |
|
2 |
Pervitsa |
16 |
Heine’s Peko (S;Yr6+?) |
30 |
Bobur |
44 |
Zamin 1 |
58 |
Lal Bahadur/Pavon 1BL |
|
3 |
Yr 1/6 avocet S |
17 |
Fielder |
31 |
Moro (W;Yr10) |
45 |
Hamkor |
59 |
AVOCET YRA*3/PASTOR |
|
4 |
Yr 1/6 avS |
18 |
Yr7/6 Avoset S |
32 |
Yr17/6 Avoset S |
46 |
Vexa |
60 |
Pastor |
|
5 |
Yr 15 |
19 |
Tanya |
33 |
Do’stlik |
47 |
Evelena |
61 |
Davr |
|
6 |
216 |
20 |
Morocco |
34 |
Yuka |
48 |
Bezostoya |
62 |
Temiryazovka 150 |
|
7 |
Kalyansoma (S) |
21 |
Reichersberg 42 (W;Yr7+?) |
35 |
Yr32/6 Avoset S |
49 |
Lemhi |
63 |
Antanina |
|
8 |
Grom |
22 |
Thatcher |
36 |
Carstens (W;Yr32) |
50 |
TP 981 |
64 |
Sabrbosh |
|
9 |
Xisorach |
23 |
Yr8/6 Avoset S |
37 |
Yr SP/6 Avoset S |
51 |
TP 1295 |
65 |
Andijon 2 |
|
10 |
Vassa |
24 |
Compair (S;Yr8) |
38 |
Spaldings prolific W;Yr SP |
52 |
Yr27/6 Avoset S |
66 |
G’ozg’on |
|
11 |
Hybrid 46 (W;Yr4) |
25 |
Yr9/6 Avoset S |
39 |
Asr |
53 |
Ciano 79 |
67 |
Andijon 4 |
|
12 |
Yr 5/6 Avocet S |
26 |
Fed4/Kavkaz (Yr9) |
40 |
Yaksart |
54 |
ATTILA CM 85836-50Y |
68 |
Alekseyevich |
|
13 |
TRITICUM spelta (Inter Yr 5) |
27 |
Clement (W;Yr9+ Yr2+?) |
41 |
Starshina |
55 |
OPATA 85 |
|
|
|
14 |
Yr 6/6 Avocet S |
28 |
Grut |
42 |
Yelanchik |
56 |
Avocet-YRA 3/3/ ALTAR84/ AESQ//APATA |
|
|
Table 2Results of GLM and MLM analyses.
Table 2
|
MARKER |
GLM |
|
MLM |
|
|
|
p-value |
R2
|
p-value |
R2
|
|
Barc0187 |
0.0040 |
0.1162 |
|
0.0162 |
0.0909 |
|
Gwm340 |
0.0043 |
0.1169 |
|
0.0174 |
0.0889 |
|
Barc0008 |
0.0132 |
0.0894 |
|
0.0179 |
0.0880 |
|
Gwm111 |
0.0147 |
0.0869 |
|
0.0328 |
0.0709 |
Table 3Analysis of Molecular Variance (AMOVA) Results for Wheat Varieties.
Table 3
|
Source |
Df |
SS
Sum of Squares |
MS |
Estimated Variance |
% of Total Variance |
|
Among Pops |
4 |
51,331 |
22,833 |
2,456 |
22%**
|
|
Among individuals |
65 |
0,000 |
0,000 |
0,000 |
0% |
|
Within Indiv |
70 |
212,432 |
17,500 |
11,984 |
78% |
|
Total |
139 |
263,763 |
|
14,440 |
100% |
References
- Bansal U, Hayden M, Keller B, Wellings C, Park R, Bariana H. 2009. Relationship between wheat rust resistance genes Yr1 and Sr48 and a microsatellite marker. Plant Pathol. 58(6): 1039-1043.
- Bariana H, Brown G, Ahmed N, Khatkar S, Conner R, Wellings C, et al. 2002. Characterisation of Triticum vavilovii-derived stripe rust resistance using genetic, cytogenetic and molecular analyses and its marker-assisted selection. Theor. Appl. Genet. 104(2): 315-320.
- Bhardwaj SC, Singh GP, Gangwar OP, Prasad P, Kumar S. 2019. Status of wheat rust research and progress in rust management-Indian context. Agronomy. 9(12): 892
- Chen W, Wu L, Liu T, Xu S, Jin S, Peng Y, et al. 2009. Race dynamics, diversity, and virulence evolution in Puccinia striiformis f. sp. tritici, the causal agent of wheat stripe rust in China from 2003 to 2007. Plant Dis. 93(11): 1093-1101.
- Chen X. 2005. Epidemiology and control of stripe rust [Puccinia striiformis f. sp. tritici] on wheat. Can. J. Plant Pathol. 27(3): 314-337.
- Elyasi-Gomari S, Lesovaya G. 2009. Harmfulness of wheat leaf rust in the eastern part of forest-steppe of Ukraine. Arch. Phytopathol. Plant Prot. 42(7): 659-665.
- Eriksen L, Afshari F, Christiansen M, McIntosh R, Jahoor A, Wellings C. 2004. Yr32 for resistance to stripe (yellow) rust present in the wheat cultivar Carstens V. Theor. Appl. Genet. 108(3): 567-575.
- Evanno G, Regnaut S, Goudet J. 2005. Detecting the number of clusters of individuals using the software STRUCTURE: A simulation study. Mol. Ecol. 14(8): 2611-2620.
- Gebreslasie ZS, Huang S, Zhan G, Badebo A, Zeng Q, Wu J, et al. 2020. Stripe rust resistance genes in a set of Ethiopian bread wheat cultivars and breeding lines. Euphytica. 216(2): 17
- Hasan A. 2013. Çukurova koşullarında pas hastalıklarının bazı ekmeklik buğday çeşitlerine etkisi. Int. J. Agric. Sci. 6(1): 50-55.
- Herrera-Foessel SA, Singh RP, Huerta-Espino J, Rosewarne GM, Periyannan SK, Viccars L, et al. 2012. Lr68: A new gene conferring slow rusting resistance to leaf rust in wheat. Theor. Appl. Genet. 124(8): 1475-1486.
- Kokhmetova A, Rsaliyev A, Malysheva A, Atishova M, Kumarbayeva M, Keishilov Z. 2021. Identification of stripe rust resistance genes in common wheat cultivars and breeding lines from Kazakhstan. Plants. 10(11): 2303
- Kuraparthy V, Chhuneja P, Dhaliwal HS, Kaur S, Bowden RL, Gill BS. 2007. Characterization and mapping of cryptic alien introgression from Aegilops geniculata with new leaf rust and stripe rust resistance genes Lr57 and Yr40 in wheat. Theor. Appl. Genet. 114(8): 1379-1389.
- Law C. 1976. Genetic control of yellow rust resistance in T. spelta album. Annu. Rep. Plant Breed. Inst. 1975: 108-109.
- Liu J, Chang Z, Zhang X, Yang Z, Li X, Jia J, et al. 2013. Putative Thinopyrum intermedium-derived stripe rust resistance gene Yr50 maps on wheat chromosome arm 4BL. Theor. Appl. Genet. 126(1): 265-274.
- Macer R. 1963. The formal and monosomic genetic analysis of stripe rust (Puccinia striiformis) resistance in wheat. Proc. 2nd Int. Wheat Genet. Symp.. Lund, Sweden.
- Mago R, Miah H, Lawrence G, Wellings C, Spielmeyer W, Bariana H, et al. 2005. High-resolution mapping and mutation analysis separate the rust resistance genes Sr31, Lr26 and Yr9 on the short arm of rye chromosome 1. Theor. Appl. Genet. 112(1): 41-50.
- McGrann GR, Smith PH, Burt C, Mateos GR, Chama TN, MacCormack R, et al. 2014. Genomic and genetic analysis of the wheat race-specific yellow rust resistance gene Yr5. J. Plant Mol. Breed. 3(2.
- Metzger R, Silbaugh B. 1970. Inheritance of resistance to stripe rust and its association with brown glume color in Tritieum aestivum L., 'PI 178383'1. Crop Sci. 10(5): 567-568.
- Miller ME. 1983. Relationships between onion leaf age and susceptibility to Alternaria porri. Plant Disease. 67(3): 284-286.
- Murphy LR, Santra D, Kidwell K, Yan G, Chen X, Campbell KG. 2009. Linkage maps of wheat stripe rust resistance genes Yr5 and Yr15 for use in marker-assisted selection. Crop Sci. 49(5): 1786-1790.
- Nei M, Li W-H. 1979. Mathematical model for studying genetic variation in terms of restriction endonucleases. Proc. Natl. Acad. Sci. U.S.A. 76(10): 5269-5273.
- Neupane D, Adhikari P, Bhattarai D, Rana B, Ahmed Z, Sharma U, et al. 2022. Does climate change affect the yield of the top three cereals and food security in the world? Earth. 3(1): 45-71.
- Palabıyık GA, Poyraz İ. 2022. The efficacity investigation for some markers detecting yellow rust resistance genes in bread wheat varieties. Bilecik Şeyh Edebali Univ. Fen Bilim. Derg. 9(2): 1026-1034.
- Payne P, Holt L, Johnson R, Snape J. 1986. Linkage mapping of four gene loci, Glu-B1, Gli-B1, Rg1 and Yr10 on chromosome 1B of bread wheat. 1986: pp. 231-242.
- Peakall R, Smouse PE. 2006. GENALEX 6: Genetic analysis in Excel. Population genetic software for teaching and research. Mol. Ecol. Notes. 6(1): 288-295.
- Peng FY, Yang R-C. 2017. Prediction and analysis of three gene families related to leaf rust (Puccinia triticina) resistance in wheat (Triticum aestivum L.). BMC Plant Biol. 17(1): 108
- Pritchard JK, Stephens M, Donnelly P. 2000. Inference of population structure using multilocus genotype data. Genetics. 155(2): 945-959.
- Rahmatov M. 2016. Genetic characterisation of novel resistance alleles to stem rust and stripe rust in wheat-alien introgression lines. Acta Univ. Agric. Suec. 78.
- Ren R, Wang M, Chen X, Zhang Z. 2012. Characterization and molecular mapping of Yr52 for high-temperature adult-plant resistance to stripe rust in spring wheat germplasm PI 183527. Theor. Appl. Genet. 125(5): 847-857.
- Schadt EE, Linderman MD, Sorenson J, Lee L, Nolan GP. 2010. Computational solutions to large-scale data management and analysis. Nat. Rev. Genet. 11(9): 647-657.
- Smith P, Hadfield J, Hart N, Koebner R, Boyd L. 2007. STS markers for the wheat yellow rust resistance gene Yr5 suggest a NBS-LRR-type resistance gene cluster. Genome. 50(3): 259-265.
- Stubbs R. 1985. Stripe rust. In Diseases. distribution, epidemiology, and control (pp. 61-101). Elsevier.:
- Sun Q, Wei Y, Ni Z, Xie C, Yang T. 2002. Microsatellite marker for yellow rust resistance gene Yr5 in wheat introgressed from spelt wheat. Plant Breed. 121(6): 539-541.