Abstract
Genetic diversity among 20 Azerbaijani grape (Vitis vinifera L.) accessions was assessed using 10 Inter-Simple Sequence Repeat (ISSR) markers to elucidate relationships among samples and identify a convenient marker for determining genetic diversity. Based on the polymorphic information parameters such as PIC, EMR, MI, and RP were critically analyzed for utilizing these ISSR primers for genetic variability and 4 ISSR (UBC 811, UBC 812, UBC 815, UBC 857) markers were selected for future germplasm management. The total number of identified bands varied between 2-5. The maximum PIC value was observed in UBC 857 (0.478). Among genotypes, Ag oval kishmish and Yumru kishmish cultivars had the closest genetic similarity index (0.913), while Ag oval kishmish and Marandi, Yerli Muskat and Yabani uzum 1, Yerli Muskat and Yumru kishmish cultivars had the most distant genetic similarity index (0.406). These findings highlight both the complexity of grapevine genetic structure and the value of ISSR markers for detecting non-obvious relationships.
-
Key words: Grapevine, ISSR, Polymorphism, Cluster analysis, Effective multiplex ratio, Marker index
Introduction
The grapevine (
Vitis vinifera ssp.
vinifera) has great economic value in the world, taking into account the products obtained from it. The countries most engaged in the production of grapes are China, Italy, Spain, France and the United States, respectively and half of the world’s total production of grapes is produced in these five countries (
Atak 2023). According to the most recent published data, the global vineyard surface area is 7.3 million hectares, with a total yield of 77.8 million tons that supports global wine production, fresh grape and dried grape markets. There are around 6000-10.000 distinct
Vitis vinifera L. cultivars worldwide (
Tello et al. 2023). The autochtonous species of grapevine distributed in Europe and in some regions of the Near East are
Vitis vinifera ssp.
vinifera and also its wild specie
Vitis vinifera ssp.
sylvestris which are essentially native to the Mediterranean basin. Viticulture has been one of the oldest and widespread fields in the economic life of the Azerbaijani farmers. According to the results of various studies and researches such as archaeological excavations, paleobotanical, ampelographic data, Azerbaijan has been identified as one of the cultural centers of viticulture (
Salimov et al. 2024).
The genetic and phenotypic characterization of cultivars is very important for essential stage in the certification of cultivars, germplasm conservation and supporting of the genetic purity (
Alizade et al. 2023). For this purpose, characterization descriptors include quantitative traits which are highly heritable and able to be equally expressed in different environmental conditions. DNA genetic markers provide precise evaluation results for evaluation of polymorphism. Monitoring of grapevine population using Inter-Simple Sequence Repeat Polymorphic markers is quick technique to determine polymorphism level within plant material (
Hassan et al. 2011).
The use of multilocus DNA markers as a tool for genotyping has become widespread in research practice. The ability to conduct a quick and efficient genetic analysis of germplasm material determines the demand for multilocus DNA markers at the present time (
Mammadova et al. 2024a). ISSR markers are among the most important multilocus marker systems. Since ISSRs are regions in the genome flanked by microsatellite sequences on both sides, they reflect the polymorphism of the genome regions located between the microsatellite regions (
Mammadova et al. 2024b). ISSR markers can help identify grape varieties with desirable traits, like disease resistance or specific flavor profiles. Breeders can use this information to select parent plants for crosses, aiming to combine desirable traits in offspring. ISSR markers can also be used to identify duplicates or synonym names among grape varieties. They can help determine the parentage of hybrid grapes and track the introgression of traits from wild species into cultivated varieties. In essence, ISSR markers are a valuable tool for grape breeders, providing insights into the genetic makeup of grapes and facilitating the development of new and improved varieties. The study of polymorphism with the use of ISSR markers in the grape plant has been proven by many genetic studies (
Basheer-Salimia et al. 2019).
Germplasm characterization in gene found garden of the Scientific-Research Institute of Viticulture and Winemaking of Azerbaijan is mainly based on morphological descriptors and genetic diversity of Azerbaijani grape varieties are not completely evaluated by using genetic markers. The objectives of this work is studying the molecular characteristics of twenty Azerbaijani grape varieties (Vitis spp.) using ISSR genetic markers.
Materials and Methods
Plant Material
Twenty genotypes belonging
Vitis vinifera L. were evaluated for genetic diversity using ISSR markers to elucidate their relationships. Eighteen cultivated varieties were collected from the gene found garden of the Research Institute of Viticulture and Winemaking under the Ministry of Agriculture of the Republic of Azerbaijan, while two wild accessions—Yabanı uzum 1 and Yabanı uzum 2 were collected from the Fuzuli and Quba districts, respectively (
Table 1).
DNA extraction was performed using fresh plant material. Genomic DNA was extracted and purified using DNeasy plant Mini Kit (QIAGEN, CA., Cat. No. / ID: 69106). Concentration and purification of DNA was determined by NanoDrop 2000/2000c Spectrophotometer (Thermo Scientific™ Cat. No.: ND2000CLAPTOP).
PCR was performed in 20 μL containing 10.3 μL ddH2O, 2 μL 10xBuffer, 3 μL 25 mM MgCl2, 0.5 μL dNTP 10 mM, 2 μL primer, 1 unit of DNA Taq polymerase and 2 μL template DNA (50 ng). 10 UBC (University of British Columbia. Vancouver, Canada) markers (UBC 808, UBC 810, UBC 811, UBC 812, UBC 815, UBC 827, UBC 834, UBC 840, UBC857, UBC868) were used for identification polymorphism level of samples.
After 3 min at 95℃ pre-denaturation, PCR (35 cycles) were performed with denaturation stage at 95℃ for 1 minute, primer-specific annealing for 1 minute followed by extension stage at 72℃ for 2 minutes, and final extension stage at 72℃ for 5 minutes.
DNA amplification with each ISSR primer was repeated at least three times to ensure reproducibility and accuracy bands were provided for each primer before analysis.
Gel Electrophoresis
Amplified ISSR products were analyzed in 1.8% agarose gel with 1X TBE buffer. As a standard marker 50 bp DNA ladder was used. For gel visualization were used Biorad Gel Doc XR+ Imaging System (Cat. No. 170-8195). Only clear and consistent bands were considered for further analysis.
Data Analysis
Well-separated bands were scored as present (1) and absent (0) accordingly. PIC values were determined for each ISSR primer using the following formula (
Roldán-Ruiz et al. 2000):
where fi indicates the frequency of amplified fragments;
(1 − fi) indicates the frequency of the non amplified fragments.
The genetic diversity coefficient was calculated using the Weir formula (
Weir 1990)
Pi indicates the frequency of occurrence of alleles.
The effective multiplex ratio (EMR) is determining the product of the total number of polymorphic loci and the proportion of polymorphic loci which was calculated by using the following formula:
where np is the number of polymorphic loci; nt is the total number of loci;
The marker index (MI) was calculated according the following formula:
Resolving power of primers was calculated by using the following formula (
Prevost et al. 1999):
bI = 1 - [2 × |0.5 – p|] is the band informativeness; p is the proportion of genotypes in which amplicon I was detected.
Mean resolving power (MRp) was calculated using the following formula:
Results and Discussion
Polymorphism Analysis
A total of ten UBC ISSR primers were used for identification polymorphism degree among the 20 Azerbaijani grape genotypes. ISSR markers were selected based on robustness, higher level of polymorphism, technical simplicity, and easy adaptability to any plant species. All used ISSR primers produced polymorphic amplification pattern and were used in molecular profiling. A total 39 bands were observed for 10 ISSR primers and 29 of them were polymorphic. The maximum number of amplicons and at the same time polymorphic fragment was detected for primers UBC 811, UBC 812, UBC 815. The number of bands for primers varied between 2-5 and the average score was 3.9. The number of polymorphic loci varies depending of the primer. This variation was determined from 50% to 100% and the average polymorphism degree was equal to 73% in our study (
Table 2).
The genetic similarity index of the studied genotypes was 0.913 among the closest genotypes and 0.406 among the most distant genotypes. Varieties Ag oval kishmish and Yumru kishmish showed the closest (0.913) and varieties Ag oval kishmish and Marandi the most distant (0.406) genetic similarity index respectively (
Table 3). The similarity index between wild genotypes was 0.800. Yerli Muskat variety which differs in its flavour from the other studied genotypes had the closest (0.769) genetic similarity index to Agadayi and this genotype also showed the furthest similarity index with Yabani uzum 1 (0.406) and Yumru kishmish (0.406).
Genetically distant varieties are often a goldmine for plant breeding because they bring in novel alleles and traits that may not be present in closely related cultivars. Distant varieties also may carry unique alleles for traits such as: disease, pest resistance, abiotic stress tolerance (drought, salinity, heat) and novel quality attributes (nutritional content, flavor, etc.) These alleles can be introduced into elite lines to improve them. In addition, greater genetic distance between parents often leads to higher heterosis in hybrids.
Marker systems are distinguished by the degree of their informativeness, which depends on the degree of their polymorphism (
Chesnokov et al. 2015). The main parameter that determine the degree of informativeness of markers is the value of informational polymorphism. For dominant markers, the PIC value varies from 0 to 0.5. Since for this type of marker only two alleles per locus are allowed and their values are influenced both by the allele number and allele frequency (
Aliyeva et al. 2017). Among the primers were used in the study a maximum PIC value was observed with of 0.478 in UBC 857 and a minimum of 0.320 in UBC 827 primer and an average of 0.435. In this study, genetic diversity index (GDI) was also calculated for each ISSR locus and the average value of IGD for analysed collection was 0.65. High value of GDI was detected by primer UBC 815.
MI and EMR are one of the main characteristics of marker systems to reveal the potential informativeness of molecular markers (
Kumar et al. 2022). Indicators MI and EMR of selected primers varied from 0.16 to 1.47 and from 0.5 to 3.2. with an average of 1 and 2.2, respectively. The maximum values of MI and EMR index of primers were detected by the UBC 811 primer. indicating its informativeness and the minimum value was detected by the UBC 827 primer. RP quantifies the ability of a marker to distinguish between different individuals or genotypes. Higher RP values suggest that the marker can differentiate between more genotypes (
Venkatesan et al. 2021). Resolving power of each primer is the ability to identify the level of variation between genotypes and the average value of this parameter was equal to 2.06. The maximum value of this parameter was detected by the UBC 812 primer and the minimum value was detected by the UBC 827 primer. MRp are used to represent the overall discriminatory power of a marker system, especially when multiple markers are used. It combines information from multiple markers to assess their combined ability to differentiate between genotypes. High MI/MRp values indicate that the marker set is effective at distinguishing between a large number of genotypes (
Venkatesan et al. 2021). Mean resolving power (MRp) of selected primer ranged from 0.4 (UBC 827) to 0.85 (UBC 857) with an average value of 0.69.
Dhanorkar et al. (
Dhanorkar et al., 2005) obtained 139 total band which 96 were polymorphic in 43 grape genotypes by using 13 informative UBC markers. Basheer-Salimia (
Basheer-Salimia et al. 2019) conducted research using 20 ISSR primers on 36 grape genotypes and 16 primers showed 100% polymorphism. The number of bands obtained by primers varied from 1-10 and the genetic distance for genotypes. varied between 0.05-0.76.
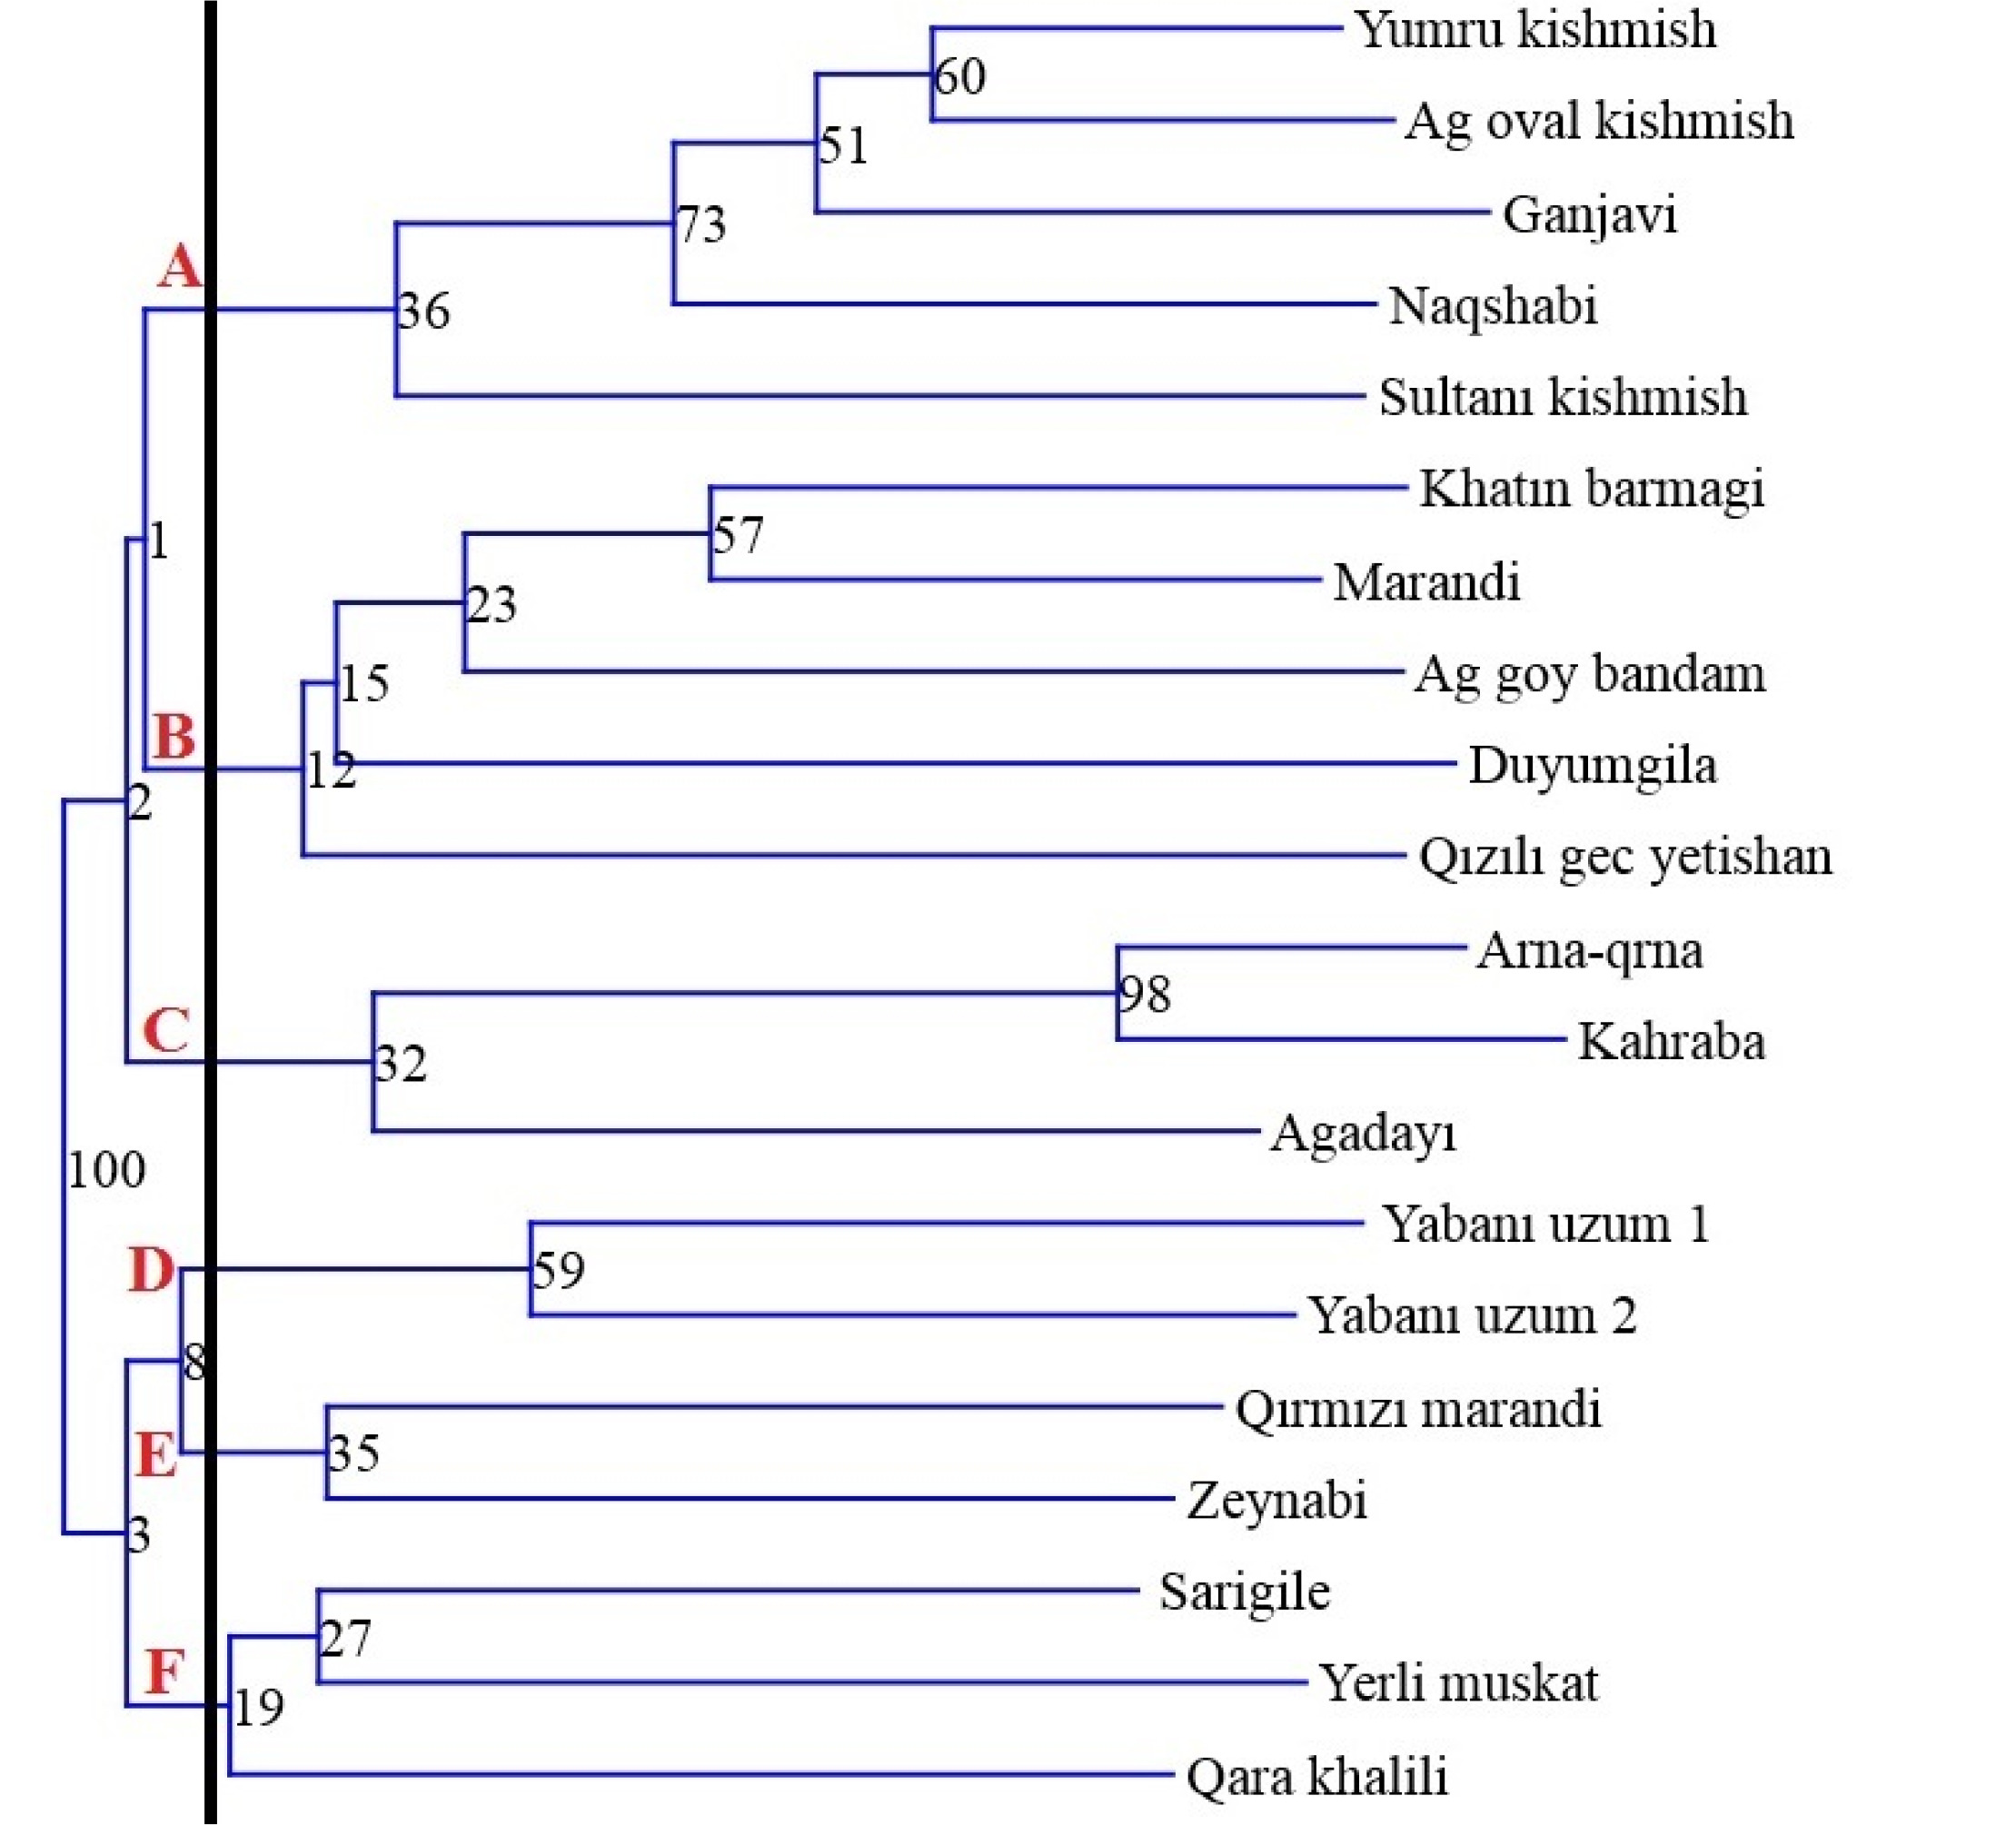
According to the results of the cluster analysis, the varieties are grouped into 6 large groups (
Fig. 1). Subclusters A and B comprised five genotypes, subclusters C and F comprised three genotypes, and subclusters D and E comprised two genotypes, respectively. In subcluster A, the genotypes Sultanı Kishmish, Yumru Kishmish, Ganjavi, Naqshabi, and Ag Oval Kishmish were similar in terms of fruit color (white). Subcluster C comprised the genotypes Arna-Qrna, Kahraba, and Agadayı, which were similar in both berry color (white) and berry shape (round). The 2 wild grape genotypes (Yabanı uzum 1 and Yabanı uzum 2) in cluster D were similar in terms of flavor (sour-sweet), berries shape (round), and berries size (very small). In subcluster E, the Qırmızı Marandi and Zeynabi genotypes were similar in berry color (red), berry shape (oval), and berry size (large). At the same time, all samples collected in subclusters A and C were similar in terms of fruit color, and all samples collected in subclusters C and D were similar in terms of berry shape.
Identifying genetically distant genotypes can be exploited broaden the genetic base, and strengthen resilience in future breeding programs in Azerbaijan. To enhance precision in trait introgression, ISSR markers could be complemented with co-dominant marker systems (e.g., SSRs or SNPs) in future studies, enabling fine-mapping of desirable traits such as disease resistance, abiotic stress tolerance, and fruit quality. This combined molecular approach will facilitate marker-assisted selection (MAS), accelerating the development of resilient, high-quality grapevine cultivars adapted to changing environmental conditions. In addition, future research should focus on integrating the ISSR marker data with broad agronomic evaluations of grapevine accessions to identify genetically diverse and agronomically superior parental lines.
Conclusion
Based on the analysis of the obtained data and values of the main parameters of the markers, it can be concluded that UBC 811, UBC 812, UBC 815, UBC 857 stood out from tested primers showing up high indicators for analyzed parameters of the markers which allows them to be recommended for identification and characterization of grape genotypes.
The efficiency of using ISSR markers were evident in the detection of polymorphism between different gemotypes. Although ISSR markers are widely used for genetic diversity, phylogenetic, and population structure studies, they have some major limitations: lack of allelic information, lower throughput, limited cross-species transferability. In addition, they cannot differentiate between homozygous dominant and heterozygous genotypes. To overcome these limitations, combining ISSRs with Complementary Marker Systems such as Simple Sequence Repeats (highly polymorphic, codominant and highly reproducible), Single Nucleotide Polymorphisms (extremely abundant in the genome, high mapping precision) in future studies may improve resolution and data quality.
Fig. 1Dendrogram of 20 grapevine genotypes derived using UPGMA cluster analysis based on ISSR data by using Past v4.16

Table 1Morphometric descriptors of grape varieties used for analysis
Table 1
|
No |
Genotype |
Species |
Colour |
Flavor |
Berries shape |
Berries size |
|
1 |
Khatın barmagi |
V.vinifera L.
|
white |
neutral |
oblong |
very large |
|
2 |
Sarigile |
V.vinifera L
|
white |
sweet |
round |
large |
|
3 |
Arna-qrna |
V.vinifera L
|
white |
slight sweet |
round |
very large |
|
4 |
Duyumgila |
V.vinifera L
|
red |
slight sweet |
oblong |
very large |
|
5 |
Marandi |
V.vinifera L
|
black |
slight sweet |
oblong |
large |
|
6 |
Yerli muskat |
V.vinifera L
|
white |
sweet. aromatic |
oblong |
large |
|
7 |
Kahraba |
V.vinifera L
|
white |
sweet |
round |
medium |
|
8 |
Ag goy bandam |
V.vinifera L
|
white |
slight sweet |
round |
medium |
|
9 |
Qara khalili |
V.vinifera L
|
black |
sweet |
round |
medium |
|
10 |
Agadayı |
V.vinifera L
|
white |
slight sweet |
round |
large |
|
11 |
Qırmızı marandi |
V.vinifera L
|
red |
sweet |
oval |
large |
|
12 |
Zeynabi |
V.vinifera L
|
red |
neutral |
oval |
large |
|
13 |
Qızılı gec yetishan |
V.vinifera L
|
light purple |
neutral |
round |
medium |
|
14 |
Yabanı uzum 1 |
Ssp. sylvestris Gmell. |
black |
sour-sweet |
round |
very small |
|
15 |
Yabanı üzüm 2 |
Ssp. sylvestris Gmell. |
dark purple |
sour-sweet |
round |
very small |
|
16 |
Sultanı kishmish |
V.vinifera L
|
white |
very sweet |
oval |
small |
|
17 |
Yumru kishmish |
V.vinifera L
|
white |
very sweet |
round |
small |
|
18 |
Ag oval kishmish |
V.vinifera L
|
white |
very sweet |
oval |
small |
|
19 |
Naqshabi |
V.vinifera L
|
white |
sweet |
round |
medium |
|
20 |
Ganjavi |
V.vinifera L
|
white |
sweet |
round |
large |
Table 2Polymorphism of selected ISSR markers
Table 2
|
No |
Primer name |
Number of total bands |
Number of polymorphic bands |
Percentage of polymorphic fragments |
Index of genetic diversity |
Polymorphic information content |
Effective multiplex ratio |
Marker index |
Resolving power |
Mean resolving power |
|
1 |
UBC 808 |
4 |
3 |
75% |
0.675 |
0.45 |
2.3 |
1.01 |
2.2 |
0.73 |
|
2 |
UBC 810 |
3 |
3 |
100% |
0.66 |
0.46 |
3 |
1.38 |
2.2 |
0.73 |
|
3 |
UBC 811 |
5 |
4 |
80% |
0.71 |
0.458 |
3.2 |
1.47 |
3 |
0.75 |
|
4 |
UBC 812 |
5 |
4 |
80% |
0.745 |
0.454 |
3.2 |
1.45 |
3.3 |
0.83 |
|
5 |
UBC 815 |
5 |
4 |
80% |
0.755 |
0.448 |
3.2 |
1.43 |
2.2 |
0.55 |
|
6 |
UBC 827 |
2 |
1 |
50% |
0.32 |
0.32 |
0.5 |
0.16 |
0.4 |
0.4 |
|
7 |
UBC 834 |
4 |
2 |
50% |
0.615 |
0.375 |
1 |
0.38 |
1.2 |
0.6 |
|
8 |
UBC 840 |
4 |
3 |
75% |
0.748 |
0.455 |
2.3 |
1.02 |
2.3 |
0.77 |
|
9 |
UBC 857 |
3 |
2 |
67% |
0.605 |
0.478 |
1.3 |
0.64 |
1.7 |
0.85 |
|
10 |
UBC 868 |
4 |
3 |
75% |
0.665 |
0.455 |
2.3 |
1.02 |
2.1 |
0.7 |
|
Total:
|
39
|
29
|
|
|
|
|
|
|
|
|
Mean:
|
3.9
|
2.9
|
73%
|
0.65
|
0.435
|
2.2
|
1
|
2.06
|
0.69
|
Table 3Similarity matrix of studied grape genotypes
Table 3
|
Jaccard similarity matrix |
|
KB |
SA |
AQ |
DU |
YM |
QK |
KA |
AGB |
MA |
AGA |
QM |
ZE |
QGY |
YU1 |
YU2 |
SK |
YK |
AOK |
NA |
GA |
|
KB |
.000 |
.455 |
.581 |
.586 |
.741 |
.621 |
.633 |
.655 |
.516 |
.741 |
.600 |
.643 |
.536 |
.438 |
.469 |
.500 |
.438 |
.484 |
.455 |
.382 |
|
SA |
|
.000 |
.633 |
.586 |
.567 |
.469 |
.581 |
.412 |
.621 |
.516 |
.778 |
.643 |
.720 |
.484 |
.469 |
.645 |
.586 |
.533 |
.714 |
.679 |
|
AQ |
|
|
.000 |
.621 |
.600 |
.600 |
.613 |
.581 |
.412 |
.600 |
.633 |
.621 |
.517 |
.469 |
.600 |
.486 |
.516 |
.567 |
.441 |
.548 |
|
DU |
|
|
|
.000 |
.607 |
.552 |
.516 |
.533 |
.500 |
.500 |
.704 |
.630 |
.519 |
.467 |
.406 |
.531 |
.571 |
.517 |
.484 |
.552 |
|
YM |
|
|
|
|
.000 |
.586 |
.600 |
.567 |
.643 |
.769 |
.679 |
.552 |
.615 |
.406 |
.484 |
.563 |
.406 |
.364 |
.424 |
.438 |
|
QK |
|
|
|
|
|
.000 |
.778 |
.679 |
.643 |
.643 |
.621 |
.607 |
.556 |
.552 |
.484 |
.429 |
.500 |
.552 |
.516 |
.586 |
|
KA |
|
|
|
|
|
|
.000 |
.633 |
.714 |
.548 |
.690 |
.621 |
.517 |
.469 |
.500 |
.486 |
.382 |
.424 |
.531 |
.455 |
|
AGB |
|
|
|
|
|
|
|
.000 |
.621 |
.679 |
.412 |
.484 |
.433 |
.484 |
.621 |
.594 |
.533 |
.586 |
.500 |
.516 |
|
MA |
|
|
|
|
|
|
|
|
.000 |
.586 |
.621 |
.500 |
.615 |
.500 |
.484 |
.667 |
.452 |
.406 |
.679 |
.533 |
|
AGA |
|
|
|
|
|
|
|
|
|
.000 |
.567 |
.552 |
.615 |
.552 |
.586 |
.515 |
.452 |
.500 |
.424 |
.484 |
|
QM |
|
|
|
|
|
|
|
|
|
|
.000 |
.769 |
.720 |
.484 |
.424 |
.545 |
.484 |
.438 |
.600 |
.567 |
|
ZE |
|
|
|
|
|
|
|
|
|
|
|
.000 |
.640 |
.571 |
.500 |
.531 |
.517 |
.571 |
.643 |
.552 |
|
QGY |
|
|
|
|
|
|
|
|
|
|
|
|
.000 |
.577 |
.500 |
.484 |
.577 |
.519 |
.654 |
.615 |
|
YU1 |
|
|
|
|
|
|
|
|
|
|
|
|
|
.000 |
.800 |
.531 |
.571 |
.630 |
.586 |
.667 |
|
YU2 |
|
|
|
|
|
|
|
|
|
|
|
|
|
|
.000 |
.613 |
.500 |
.552 |
.516 |
.586 |
|
SK |
|
|
|
|
|
|
|
|
|
|
|
|
|
|
|
.000 |
.581 |
.531 |
.759 |
.613 |
|
YK |
|
|
|
|
|
|
|
|
|
|
|
|
|
|
|
|
.000 |
.913 |
.704 |
.800 |
|
AOK |
|
|
|
|
|
|
|
|
|
|
|
|
|
|
|
|
|
.000 |
.643 |
.731 |
|
NA |
|
|
|
|
|
|
|
|
|
|
|
|
|
|
|
|
|
|
.000 |
.741 |
|
GA |
|
|
|
|
|
|
|
|
|
|
|
|
|
|
|
|
|
|
|
.000 |
References
- Aliyeva A, Aliyev R, Babayeva S, Abbasov M, Gurbanova G, Seferzade Z. 2017. Evaluation of genetic diversity of local varieties and forms of apples of Azerbaijan with the use of ISSR-markers. Agrarnyy Nauchnyy Zhurnal. (10): 9-14.
- Alizade S, Mammadova R, Sirajli N. 2023. Evaluation of morphometric traits of upland cotton genotypes under different concentration of NaCl. Adv. Bio. Earth Sci. 8(3): 301-307.
- Atak A. Wang H., 2023. New Perspectives in Grapevine (Vitis spp.) Breeding. editor. Case Studies of Breeding Strategies in Major Plant Species. IntechOpen.
- Basheer-Salimia R, Mujahed A. 2019. Genetic diversity of grapevine (Vitis vinifera L.) as revealed by ISSR markers. J. Plant Biotechnol. 46(1): 1-8.
- Chesnokov YV, Artemyeva A. 2015. Evaluation of the measure of polymorphism information of genetic diversity. Selskokhozyaistvennaya Biologiya. 5(eng): 571-578.
- Dhanorkar V, Tamhankar S, Patil S, Rao V. 2005. ISSR-PCR for assessment of genetic relationships among grape varieties cultivated in India. VITIS-GEILWEILERHOF-. 44(3): 127.
- Doulati-Baneh H, Mohammadi SA, Labra M. 2013. Genetic structure and diversity analysis in Vitis vinifera L. cultivars from Iran using SSR markers. Sci Hortic. 160: 29-36.
- Hassan NA, El-Homosany A, Gomma AH, Shaheen MA. 2011. Morphological and ISSR polymorphisms in some Egyptian grapes (Vitis vinefera L.) collection. World Appl. Sci. J. 15(10): 1369-1375.
- Kumar SPJ, Susmita C, Sripathy KV, Agarwal DK, Pal G, Singh AN, et al. 2022. Molecular characterization and genetic diversity studies of Indian soybean (Glycine max (L.) Merr.) cultivars using SSR markers. Mol. Biol. Rep. 49(3): 2129-2140.
- Mammadova R, Akparov Z, Amri A, Bakhsh A, Alo F, Alizade S, et al. 2024a. Genetic diversity analysis of Azerbaijani bread wheat (Triticum aestivum L.) genotypes with simple sequence repeat markers linked to drought tolerance. Genet. Resour. Crop Evol. 72(1): 315-323.
- Mammadova R, Amri A, Akparov Z, Alo F, Sheikhzamanova F, Abbasov M, et al. 2024b. Evaluation of genetic diversity using SSR markers and link with drought response of Azerbaijani durum wheat (Triticum durum Desf.) genotypes. Genet. Resour. Crop Evol. 71(5): 2203-2212.
- Prevost A, Wilkinson MJ. 1999. A new system of comparing PCR primers applied to ISSR fingerprinting of potato cultivars: Theor. Appl. Genet. 98(1): 107-112.
- Roldán-Ruiz I, Dendauw J, Van Bockstaele E, Depicker A, De Loose M. 2000. AFLP markers reveal high polymorphic rates in ryegrasses (Lolium spp). Mol. Breed. 6(2): 125-134.
- Salimov V, Mammadova R, Burak M, Alizade S, Sharifova S, Bakhsh A, et al. 2024. Inter simple sequence repeat (ISSR) based genetic and morphological polymorphism of Azerbaijani grape (Vitis vinifera) genotypes. Genet. Resour. Crop Evol. 2711-2723.
- Tello J, Ibáñez J. 2023. Review: Status and prospects of association mapping in grapevine. Plant Sci. 327: 111539
- Venkatesan J, Ramu V, Sethuraman T, Sivagnanam C, Doss G. 2021. Molecular marker for characterization of traditional and hybrid derivatives of Eleusine coracana (L.) using ISSR marker. J. Genet. Eng. Biotechnol. 19(1): 1-12.
- Weir BS. 1990. Genetic data analysis. Methods for discrete population genetic data. Sinauer Associates, Inc. Publishers, Sunderland. Massachusetts: pp. 377.
- Venkatesan J, Ramu V, Sethuraman T, Sivagnanam C, Doss G. 2021. Molecular marker for characterization of traditional and hybrid derivatives of Eleusine coracana (L.) using ISSR marker. Journal of Genetic Engineering and Biotechnology. 19(1): 178