Abstract
Black sapote (Diospyros digyna Jacq.) is a fruit that is rich in benefits and has high economic value. However, the sex of this plant is difficult to determine early, and data on the plant is still very limited. This qualitative quantitative research was conducted to identify the genetic diversity of black sapote based on RAPD marker to determine the sex of black sapote plants. The sample used consisted of seven black sapote accessions with sample codes including P, M1, M2, M3, F1, F2, and F3. This research consists of several stages, namely DNA extraction and PCR amplification using six RAPD primers (OPA 02, OPA 05, OPA 08, OPA 09, OPC 09, and OPD 15), including electrophoresis to visualize amplified DNA. Data were analyzed using NTSYS 2.02 software and dendogram were obtained using the UPGMA method in the SAHN function. The results of the analysis showed that the polymorphism resulting from the seven black sapote accessions ranged from 50–80%, with PIC (Polymorphic Information Content) values ranging from 0.28–0.50. The closest related accessions are M1 with F2, while accession P with F2 has the highest genetic diversity. The OPA 02 primer with a band measuring 380 bp can be used as a putative marker in the determination of the female sex and hermaphrodite of black sapote plants.
-
Key words: Diospyros digyna Jacq., Genetic divesity, Molecular markers, Polymorphism
Introduction
Diospyros digyna Jacq., often known as the black sapote, is a fruit with several health advantages and a high market value. This fruit has a high economic value because of its excellent organoleptic properties and high nutritional content. Black sapote comes from the Ebenaceae family. This plant is native to Mexico and Guatemala, and in the Middle Ages was brought by Spanish colonialists to the Philippines, where it then spread to Sulawesi and Maluku (
Saidin 2023). The pulp of black sapote has a similar texture to the persimon, which is soft, fibrous, and not gritty (
Yuniastuti et al. 2021). Black sapote is a dioecious plant which have three types of sex expression, namely female, male, and hermaphroditic. The hermaphrodite is a flower that has both male (stamen) and female (pistil) reproductive organs in one flower (
Aonuma et al. 2021).
Black sapote plants are not widely cultivated by Indonesian people, one of the reasons is the lack of availability of seeds. Black sapote plants usually grow in the fields or yards of local residents' houses, just like the persimmon plants (
Diospyros kaki), and function as windbreaks (
Delfianti et al. 2019). Furthermore, it is also difficult to differentiate the sex of black sapote plants during the vegetative period. Information regarding black sapote plants is also still very limited. Therefore, there is a need for plant breeding program efforts to improve plant characteristics and increase productivity, one of which is through genetic diversity analysis. Increasing of black sapote productivity can be done by provision of quality seeds (
Yuniastuti 2017). Therefore, there is a need for plant breeding program efforts to improve plant characteristics and increase productivity, one of which is through genetic diversity analysis. Genetic diversity information can be used as a basis for sustainable plant conservation efforts.
Genetic diversity can be determined based on morphological, physiological, biochemical, and molecular characters. Genetic diversity based on molecular markers is considered more effective because the number is unlimited, is not influenced by the environment, and has a high ability to describe characters between individuals (
Laosatit et al. 2022). The RAPD (Random Amplified Polymorphic DNA) molecular marker is a DNA-based approach. RAPD markers have met the criteria of an ideal marker system because of their high polymorphism, ease and speed, and relative economy. RAPD markers to determine the genetic diversity of plants from the genus Diospyros have been successfully identified, for example, in Diospyros melanoxylon Roxb (
Kumari et al. 2021). In its application, molecular markers using RAPD have been successfully applied for various things, including identifying species, analyzing genetic diversity, determining sex or identifying hybrids (
Bardakci 2000). The use of RAPD markers in black sapote is still limited, so primer information on polymorphic RAPD is needed to carry out further research on genetic variations of black sapote to obtain derivatives that have superior characteristics.
Materials and Methods
Plant material and DNA extraction
The DNA extraction method used is the CTAB (cetyltrimethyl ammonium bromide) method developed by
Doyle (1990). In this study, used fresh young leaves from seven (7) accessions of black sapote. Young leaves are used because they contain more DNA and have a softer texture than old leaves (
Barta et al. 2017). The seven accessions include one parental (P), three male plants (M1, M2, M3), and three female plants (F1, F2, F3). Each sampel was taken from a different tree. The purified DNA is then stored in a refrigerator at 4℃ for isolation. The results of DNA isolation are then quantified to determine the concentration and purity values of DNA samples based on light absorption with A260/A280 waves using a Gene Quant Spectrophotometer (
Shinde et al. 2021).
DNA amplification is carried out by PCR reaction in a total volume of 12.5 µL for each PCR tube using PCR system BIO-RAD T100. Each PCR reaction consists of 6.25 µL GoTaq Green Master Mix (Promega), 1 µL 10 µM primer IDT-(Integrated DNA Technologies), 2.5 µL DNA templates and 2.75 µL nuclease-free water. PCR Optimization was done for getting PCR optimal condition. Several variables such as primer concentration, concentration DNA mold, and primer adhesive were exploited for PCR learning and trial for getting an optimal PCR product (
Khoiriyah et al. 2018). The primers used are OPA 02 (TGCCGAGCTG), OPA 04 (AATCGGGCTG), OPA 08 (GTGACGTAGG), OPA 09 (GGGTAACGCC), OPC 09 (CTCACCGTCC), and OPD 15 (CATCCGTGCT). The initial denaturation stage was performed at 94℃ for 3 minutes, 35 cycles of 94℃ for 1 minute, annealing at 37℃ for 1 minute, annealing at 72℃ for 1 minute 30 seconds, final annealing at 72℃ for 8 minutes, and inactivation at 12℃. The DNA resulting from the PCR is then electrophoresed at a voltage of 100 volts and an electric current of 400 mA for 70 minutes. The results are visualized using the Gel Documentation System which is equipped with a UV transilluminator.
The gel electrophoresis image results were scored using binary data based on the appearance of a DNA band, whether there was a DNA band (1) or no DNA band (0). Next, the data was analyzed using Gel Analyzer software to produce DNA band sizes and NTSYS 2.02 to produce a dendrogram (phylogenetic analysis). Phylogenetic analysis was visualized in the form of a dendogram using the Unweighted Pair Group with Arithmetic Mean (UPGMA) method at the function of SAHN (Sequential, Agglomerative, Hierarchical, and Nested) based on the Simple Matching similarity index value (
Sokal et al. 1958).
Results
DNA quantification
DNA quantity testing is a process carried out with the aim of ensuring the purity and concentration of DNA extraction results. The DNA results varied from 1.79 to 2.15. The highest purity value is in sample P, while the lowest purity value is in sample F3.
Xu et al. (2020) stated that at 260 and 280 nm raiso absorbance, DNA isolation results can be said to be pure if they are on a scale of 1.8 to 2.0. Previous research has stated that a ratio value below 1.8 indicates the presence of protein contamination, while a ratio above 2.0 indicates the presence of RNA contamination (
Yu et al. 2024). The isolated DNA concentration was quite high, ranging from 1898 to 3397 ng/µl (
Table 1). The highest concentration value is in sample F1, while the lowest concentration value is in sample F2.
The PCR (Polymerase Chain Reaction) technique is a technique that can be used to amplify more DNA segments in just a few hours. According to
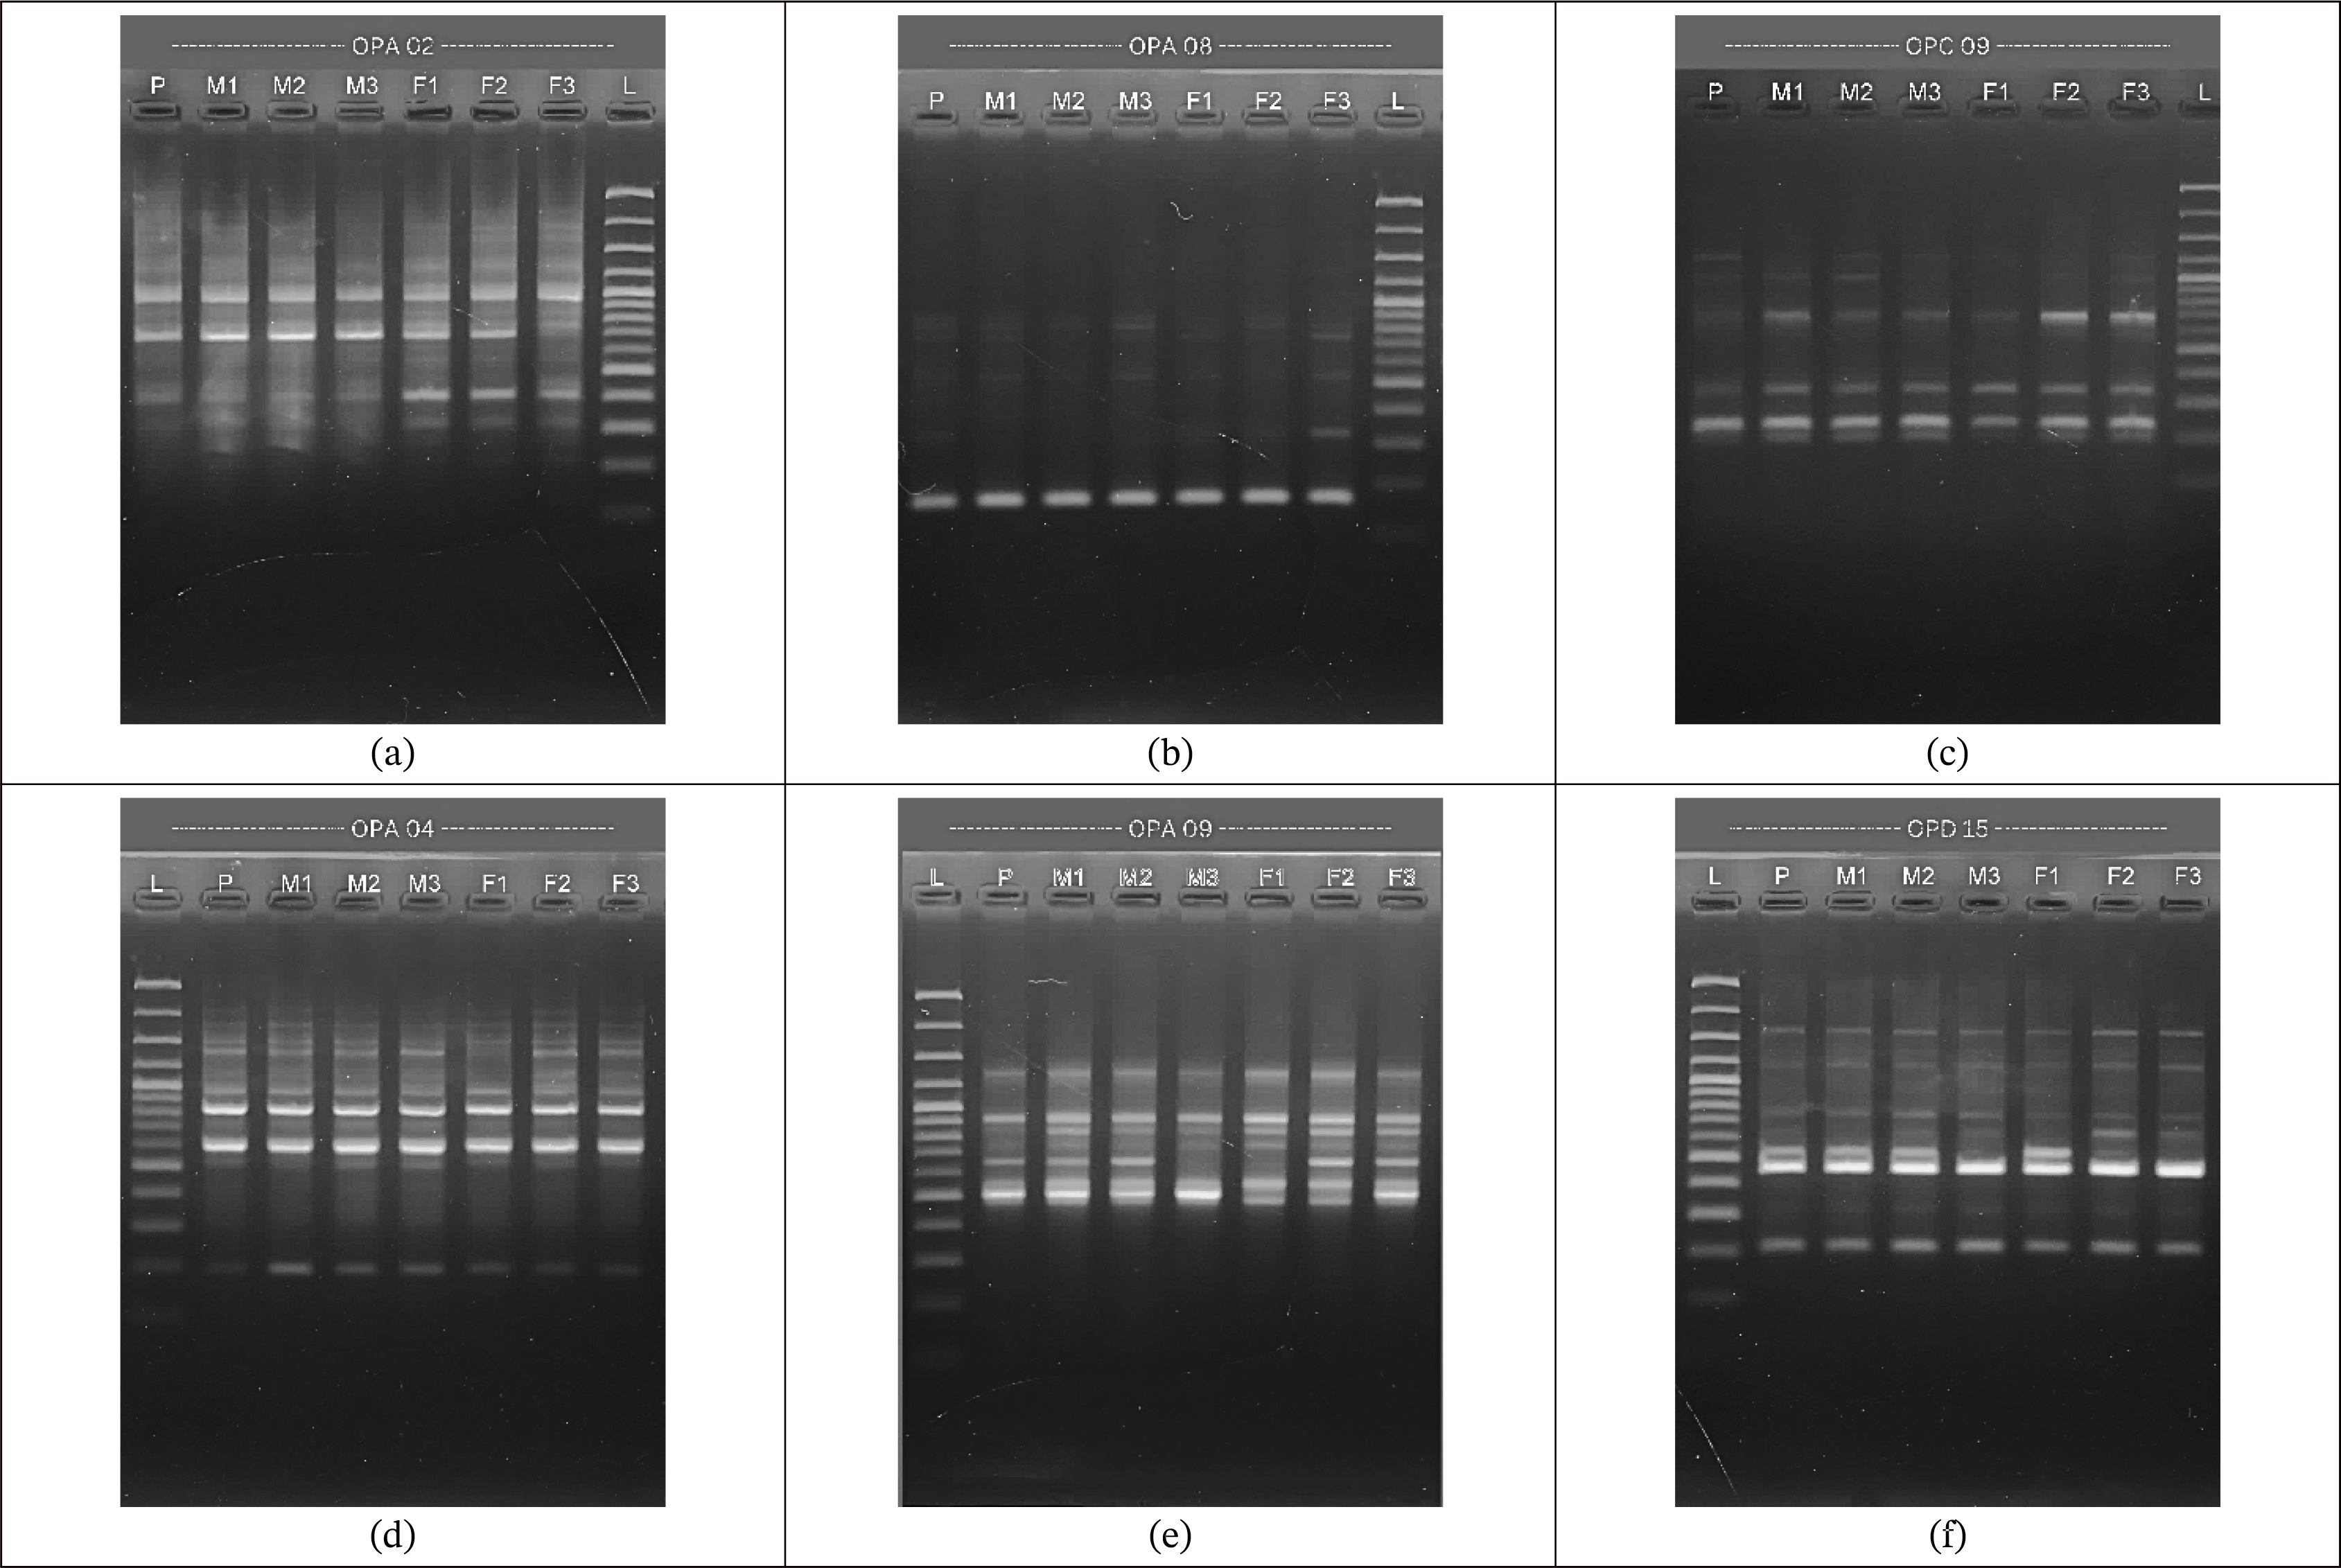
Esiobu et al. (2022), replication occurs when there is a single strand of DNA that acts as a template and nucleotide base (dNTP). The enzyme DNA polymerase helps in the formation of other strands of DNA. Meanwhile, a primer is a short piece of DNA consisting of 20-30 nucleotides that hybridize bands in pairs with specific sequences that flank the amplified target DNA region on each DNA band. The results of PCR amplification with RAPD markers showed band sizes in the range 210–1670 bp. The intensity of each marker is different, some are very clear but some are very thin (
Fig. 1). The success of DNA amplification using the RAPD technique is determined by various factors, such as the quantity of primers contained in the PCR, the primer sequence, the suitability of PCR conditions, as well as the annealing temperature and DNA extension.
The amplification of the OPA 02 primer exhibited a smear beneath the main DNA band, which is a clear indication of compromised DNA quality. According to
Setiati et al. (2020), such smearing typically signifies DNA degradation, characterized by fragmented DNA molecules rather than intact, high-molecular-weight strands. Furthermore, the presence of a smear near the bottom of the gel suggests possible RNA contamination, as RNA, being of lower molecular weight, migrates further than intact DNA. Maintaining high-quality DNA is essential for successful PCR, as degraded DNA may impair primer binding efficiency, leading to faint or absent amplification bands.
Makmur et al. (2020) reported that the failure of some primers to produce visible bands can be attributed to several technical factors. One significant cause is the inadequate homogenization of the DNA template within the PCR mixture, which can result in inconsistent DNA distribution and hinder primer attachment to the target regions. Additionally, other factors such as the degradation of PCR components, suboptimal DNA polymerase performance, or inappropriate annealing temperatures may further reduce amplification efficiency, ultimately affecting the reliability of the results.
Discussion
Percentage of polymorphism
The PCR product results with a total of 6 RAPD primers used in the analysis of black sapote genetic diversity produced 36 loci with polymorphic patterns. A total of 23 of the 36 loci are polymorphic bands, while the other 13 loci are monomorphic bands. The average polymorphism resulting from the six primers was 64.5%. The highest PIC value of 0.5 was obtained with the OPA 08 primer, while the lowest PIC value of 0.28 was obtained with the OPA 04 primer. Differences in the number and size of fragments greatly determine the level of polymorphism.
Anwar et al. (2020) stated that there are several possible results of DNA amplification, namely polymorphic amplification, monomorphic amplification, or not amplification. The presence of this band indicates that the RAPD primer used has succeedded to attach and amplified the DNA region from black sapote. The PIC (Polymorphic Information Content) value is defined as a value that describes the level of informativeness of the loci used to analyze the level of diversity of the alleles. PIC values are grouped into three classes, namely PIC > 0.5 indicates very informative, 0.25 > PIC > 0.5 indicates moderately informative and PIC < 0.25 indicates less informative (
Botstein et al. 1980). However, according to
Raza et al. (2020), the maximum PIC value for dominant markers is 0.5. The average PIC value in this study was 0.32, indicating that most of the loci used were quite capable of explaining genetic diversity in the seven black sapote accessions. The greater the PIC value of a marker, the better the marker is to be used as a molecular marker.
Table 2 presents the polymorphism results of seven black sapote (
Diospyros digyna Jacq.) accessions using Random Amplified Polymorphic DNA (RAPD) markers. Six distinct primers (OPA 02, OPA 04, OPA 08, OPA 09, OPC 09, and OPD 15) were utilized, each generating DNA fragments of varying sizes, ranging from 210 bp to 1670 bp. These primers were selected to amplify multiple loci, revealing genetic diversity among the accessions through the presence of polymorphic and monomorphic bands. The loci amplified by these primers ranged from four to eight, with OPA 09 producing the highest number of loci (eight), and OPA 02 generating the lowest (four). This variation in locus generation indicates the differential efficiency of the primers in amplifying diverse genetic regions.
The polymorphism percentage for each primer was determined by comparing the number of polymorphic loci to the total loci, with values ranging from 50% to 80%. Notably, primer OPA 08 exhibited the highest polymorphic percentage at 80%, indicating its superior ability to detect genetic variation among the accessions, followed by OPA 02 and OPA 09, both with 75%. Conversely, primers OPA 04 and OPC 09 indicated the lowest polymorphic percentages (50%), reflecting their limited capacity to reveal genetic diversity. The average polymorphism percentage across all primers was calculated at 64.5%, indicating a moderate to high level of genetic variation within the studied accessions. In addition to polymorphism percentage, the Polymorphic Information Content (PIC) was calculated for each primer, providing a measure of the informativeness of the RAPD markers. PIC values ranged from 0.28 to 0.50, with primer OPA 08 having the highest PIC value (0.50), emphasizing its effectiveness in distinguishing genetic differences. In contrast, primer OPA 04 had the lowest PIC value (0.28), indicating limited capacity for detecting genetic variation. A total of 36 loci were amplified, of which 23 were polymorphic (63.9%) and 13 were monomorphic (36.1%). These findings confirm that RAPD markers are effective for assessing genetic diversity in black sapote, with primers exhibiting higher PIC values proving more informative. The detailed insights provided by this study are essential for guiding future breeding and conservation strategies for this species.
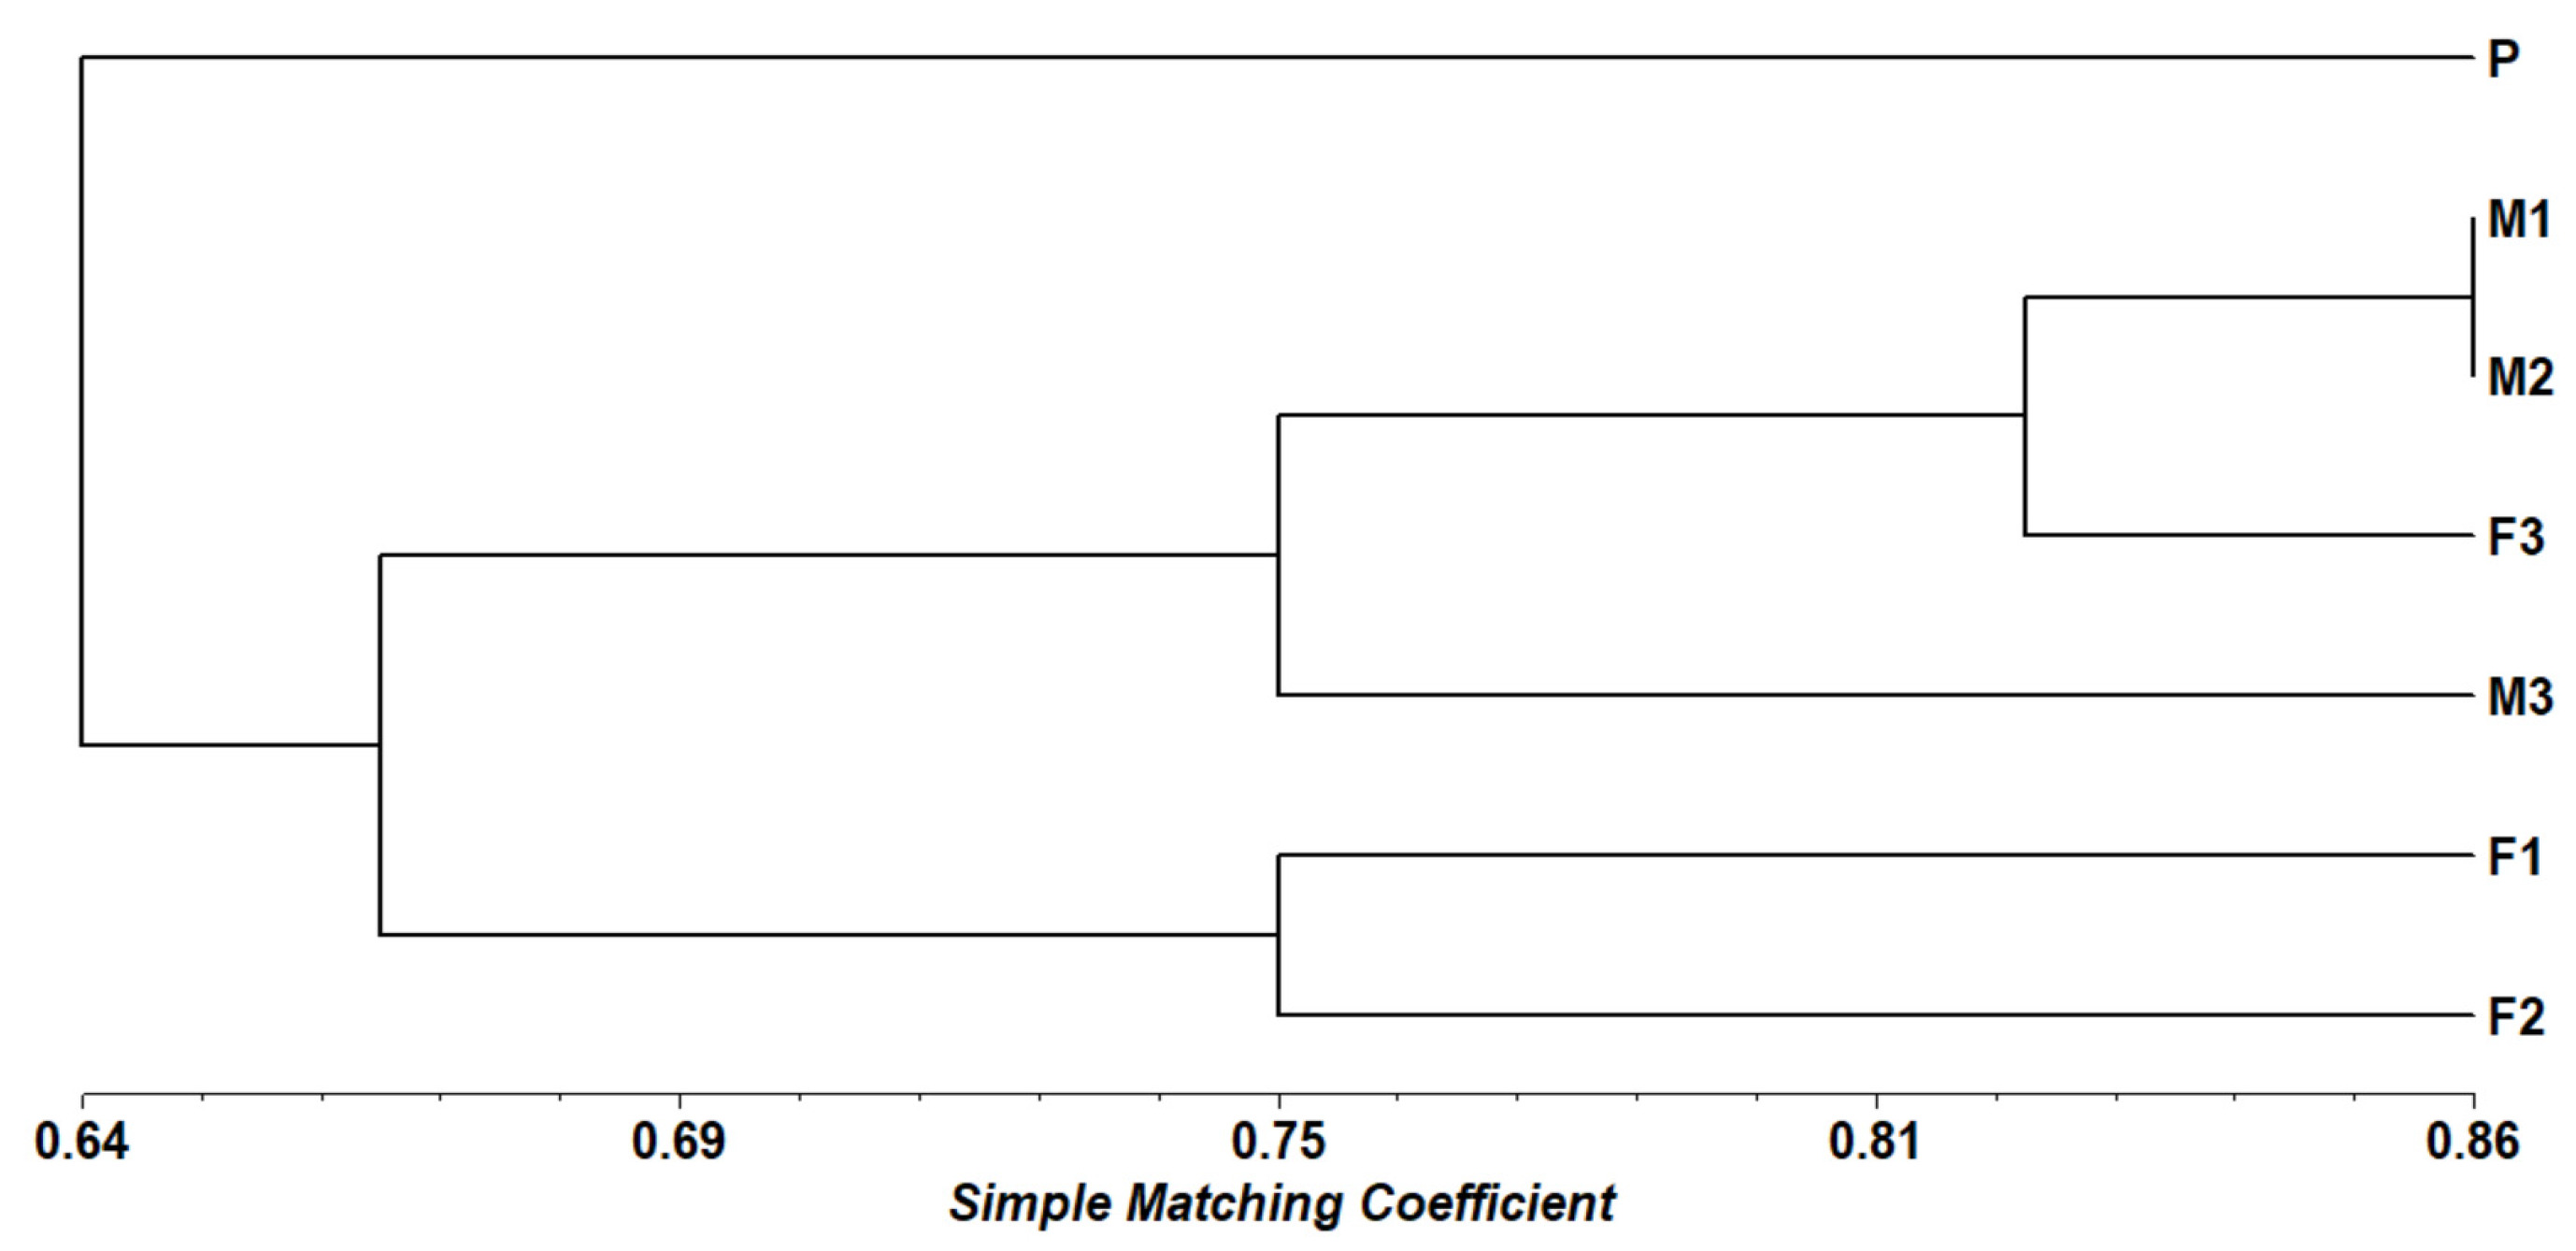
The dendrogram generated using the Simple Matching coefficient provides a clear understanding of the genetic relationships among seven black sapote genotypes, labeled as P (Parental), M (Male), and F (Female). The clustering observed in the dendrogram is further validated by the genetic similarity matrix (
Table 3), which presents the genetic similarity values between each pair of genotypes. According to
Sari et al. (2002), when the Simple Matching (SM) similarity value approaching 1 indicates that the samples are genetically very similar or nearly identical. Conversely, values closer to 0 indicate a high level of genetic variation. Genotype P is distinctly separated from the other accessions, displaying the lowest similarity values, ranging from 0.528 to 0.694. This separation indicates that P is genetically unique compared to the other genotypes, making it a potential source of novel genetic variation for breeding programs. Its genetic distinctiveness underscores its value as a parental line capable of contributing unique traits to progeny. Genotypes M1 and M2 exhibit the highest similarity value (0.861), indicating a close genetic relationship. This high similarity suggests that these two male genotypes may share a common genetic origin or have been subjected to similar selection pressures. Their close genetic relationship suggests that they are suitable for maintaining trait consistency within a breeding program. Similarly, female genotypes F1 and F2 demonstrate a relatively high similarity value of 0.750, indicating a shared genetic background. This similarity may result from a common female parent or similar selection criteria. Their grouping suggests they can serve as reliable sources for stable genetic traits, which is advantageous for targeted breeding objectives.
In contrast, genotypes F3 and M3 are grouped separately, showing moderate genetic divergence. F3 exhibits a high similarity with M1 (0.861), implying some shared genetic characteristics, while M3 presents a broader range of similarity values (0.556 to 0.778), suggesting a more diverse genetic background. This moderate divergence makes F3 and M3 promising candidates for introducing new genetic combinations, thereby enhancing genetic diversity. From a plant breeding perspective, these findings provide valuable insights. Genotype P should be prioritized for introducing genetic diversity, while M1 and M2 can be used to maintain uniformity in male parent lines. F1 and F2 are ideal for stabilizing specific female traits, and F3 and M3 offer opportunities to explore unique genetic combinations, enriching the genetic pool of breeding populations (
Fig. 2).
The sex of the black sapote plant is only visible after the plant flowers as it is very difficult to know the sex of the plant early on. Therefore, it is necessary to detect the sex of black sapote plants, potentially through molecular markers. Black sapote gender markers can also be useful, especially in plant gender detection for fruit production. Based on the results of the OPA 02 primer amplification, a band of 380 bp was only amplified in samples P, F1, F2, and F3. This indicate molecular marker potentially can be used to identify the sex of female plants and hermaphrodites from male black sapote plants. However, repeated amplification is needed to determine the consistency of the primers in detecting the sex of black sapote plants.
Although RAPD markers are widely used due to their cost-effectiveness and ease of use in assessing genetic diversity, they have notable limitations that need to be considered. One major issue with RAPD is its reproducibility, which can be affected by variations in PCR conditions such as template quality, primer concentration, and thermal cycling parameters. This sensitivity often results in inconsistent banding patterns between experiments, making RAPD less reliable compared to more recent molecular markers like SSRs and SNPs, which offer higher specificity and reproducibility. Additionally, RAPD markers are dominant markers and do not allow differentiation between homozygous and heterozygous genotypes, which limits their genetic resolution. Therefore, additional testing involving larger sample sizes or diverse populations will confirm the specificity and reliability of the markers for sex determination of black sapote.
Acknowledgments
This study was financially supported by the DIPA Directorate of Research, Technology, and Community Service; Directorate General of Higher Education, Research, and Technology; and Ministry of Education, Culture, Research, and Technology, Indonesia.
Fig. 1Electrophorogram of PCR amplification results using primers: a) OPA 02, b) OPA 04, c) OPA 08, d) OPA 09 e) OPC 09, and f) OPD 15.

Fig. 2Dendogram of seven black sapote accessions based on SM coefficient using the UPGMA method

Table 1Purity values and concentration of Black sapote DNA
Table 1
|
Sample Code |
Purity (l260/l280) |
Concentration (ng/µl) |
|
P |
2.15 |
2797 |
|
M1 |
1.94 |
3291 |
|
M2 |
1.89 |
3383 |
|
M3 |
1.89 |
3192 |
|
F1 |
1.89 |
3397 |
|
F2 |
1.90 |
1898 |
|
F3 |
1.79 |
2498 |
Table 2Polymorphism results from amplification of seven black sapote accessions based on RAPD markers
Table 2
|
No |
Primer |
Fragment Size (bp) |
Locus |
Band Type |
Polymorphic Percentage (%) |
PIC |
|
|
Polymorphic |
Monomorphic |
|
1 |
OPA 02 |
310-930 |
4 |
3 |
1 |
75 |
0.44 |
|
2 |
OPA 04 |
230-1380 |
6 |
3 |
3 |
50 |
0.28 |
|
3 |
OPA 08 |
210-780 |
5 |
4 |
1 |
80 |
0.50 |
|
4 |
OPA 09 |
470-1340 |
8 |
6 |
2 |
75 |
0.38 |
|
5 |
OPC 09 |
240-1270 |
6 |
3 |
3 |
50 |
0.36 |
|
6 |
OPD 15 |
230-1670 |
7 |
4 |
3 |
57 |
0.32 |
|
|
Total |
36 |
23 |
13 |
|
|
|
|
Average |
6 |
3.8 |
2.2 |
64.5 |
0.32 |
Table 3Genetic similarity matrix for seven black sapote accessions based on the Simple Matching coefficient
Table 3
|
Sample |
P |
M1 |
M2 |
M3 |
F1 |
F2 |
F3 |
|
P |
1.000 |
|
|
|
|
|
|
|
M1 |
0.694 |
1.000 |
|
|
|
|
|
|
M2 |
0.667 |
0.861 |
1.000 |
|
|
|
|
|
M3 |
0.611 |
0.750 |
0.778 |
1.000 |
|
|
|
|
F1 |
0.667 |
0.639 |
0.611 |
0.556 |
1.000 |
|
|
|
F2 |
0.528 |
0.722 |
0.750 |
0.694 |
0.750 |
1.000 |
|
|
F3 |
0.667 |
0.861 |
0.778 |
0.722 |
0.611 |
0.750 |
1.000 |
References
- Anwar GM, Mahmoud MA, Ata AM, Ragab RA, Bakry HSH. 2020. Studies of Molecular Variation Sources Using RAPD and SSR Markers in Two Garlic Clones. J. Mod. Res. 2: 115-122.
- Aonuma W, Kawamoto H, Kazama Y, Ishii K, Abe T, Kawano S. 2021. Male/Female Trade-Off in Hermaphroditic Y-Chromosome Deletion Mutants of the Dioecious Plant Silene latifolia. Cytologia. 86(4): 329-338.
- Bardakci F. 2000. The Use of Random Amplified Polymorphic DNA (RAPD) Markers in Sex Discrimination in Nile Tilapia, Oreochromis niloticus (Pisces: Cichlidae). Turkish Journal of Biology. 24(2): 169-175.
- Barta CE, Bolander B, Bilby SR, Brown JH, Brown RN, Duryee , et al. 2017. In Situ Dark Adaptation Enhances the Efficiency of DNA Extraction From Mature Pin Oak (Quercus palustris) Leaves, Facilitating the Identification of Partial Sequences of the 18S rRNA and Isoprene Synthase (Isps) Genes. Plants. 6(4): 52
- Botstein D, White RL, Skolnick M, Davis RW. 1980. Construction of a Genetic Linkage Map in Man Using Restriction Fragment Length Polymorphisms. Am. J. Hum. Genet. 32: 314-331.
- Delfianti MNI, Yuniastuti E, Cahyani VR. 2019. Propagation and Growth of Persimmon (Diospyros kaki L.) in Indonesia. IOP Conference Series: Earth and Environmental Science. 012037.
- Doyle JJ. 1990. Isolation of Plant DNA from Fresh Tissues. Focus. 12: 13-15.
- Esiobu ND, Ezeonu IM, Nwaokorie F. 2022. Principles and Techniques for Deoxyribonucleic Acid (DNA) Manipulation. In Medical Biotechnology, Biopharmaceutics, Forensic Science and Bioinformatics. CRC Press. pp. 3-32.
- Khoiriyah N, Yuniastuti E, Purnomo D. 2018. Genetic Diversity of Pigeon Pea (Cajanus Cajan (L.) Millsp.) based on Molecular Characterization using Randomly Amplified Polymorphic DNA (RAPD) Markers. IOP Conference Series: Earth and Environmental Science PAPER.
- Kumari A, Kumar A. 2021. Assessment of Genetic Diversity of Diospyros Melanoxylon Roxb. (Kendu) Growing in Jharkhand, India using RAPD Markers. J. Plant Sci. Res. 36(2): 15-22.
- Laosatit K, Amkul K, Somta P, Kerdsri C, Mongkol W. 2022. Genetic Diversity of Sweet Corn Inbred Lines of Public Sectors in Thailand Revealed by SSR Markers. CBAB. 22(4): 1-8.
- Makmur MF, Larekeng SH, Restu M. 2020. Genetic Diversity of Eight Types of Bamboo based on Random Amplified Polymorphic DNA (RAPD) Markers. Plant Arch. 20(2): 2333-2337.
- Raza A, Sohail R, Khan A. 2020. Polymorphic Information and Genetic Diversity in Brassica Species Revealed by RAPD Markers. Biocell. 44(4): 769-776.
- Saidin I. 2023. Malaysian Edible Fruits. IIUM Press.
- Sari RM, Achyar AA, Ahda Y, Putri DH. 2022. Genotyping of Sumatera local variety of citrus using random amplified polymorphism DNA (RAPD) technique. Tropical Genetics. 2(2): 56-65.
- Setiati N, Partaya , Hidayah N. 2020. The Use of Two Pairs Primer for CO1 Gene Amplification on Traded Stingray at Fish Auction Tasik Agung Rembang. Conference Series. 1567(3): 032056.
- Shinde N, Shinde NA, Bharose AA, Sarode DK, Swathi RS, Pimpale PA, Shinde SS. 2021. Assessment of Hybrid Purity in Maize (Zea mays L.) Using RAPD and SSR Markers. The Pharma Innovation Journal. 870(4): 870-874. http://www.thepharmajournal.com.
- Sokal RR, Michener CD. 1958. A statistical method for evaluating systematic relationships. University of Kansas.
- Xu Y, Zhang Z, Su Z, Zhou X, Han X, Liu Q. 2020. Continuous Microfluidic Purification of DNA Using Magnetophoresis. Micromachines. pp. 1-11.
- Yu Y, Wang X, Qu R, Ouyang Z, Guo J, Zhao Y, Huang L. 2024. Extraction and Analysis of High-Quality Chloroplast DNA with Reduced Nuclear DNA for Medicinal Plants. BMC Biotechnol. 24(20): 1-10.
- Yuniastuti E, Saputro M, Nandariyah , Delfianti M. 2021. Characterization of Persimmon (Diospyros kaki L.) as Biodiversity Originated from Indonesia Characterization of Persimmon (Diospyros kaki L.) as Biodiversity Originated from Indonesia. IOP Conference Series: Earth and Environmental Science. pp. 1-7.
- Yuniastuti E. 2017. Approach Grafting of Durian Seedling with Variation of Multiple Rootstock. Bulgarian Journal of Agricultural Science. 23(2): 232-237.