Abstract
The faba bean produces medicinally useful phenolic compounds naturally, and is also a good source of food and animal feed. This study quantified the functional compounds and antioxidant activities of five faba bean genotypes selected on the basis of their seed yield and L-dopa content. The highest total tannin content (TTC) and total proanthocyanidin content (TPAC) were observed in the PI252004 genotype and the lowest content in the PI366039 genotype. The total phenolics content (TPC) and total flavonoid content (TFC) of the PI430715 genotype were higher than those of the other genotypes. LC-MS analyses identified 22 different phenolic compounds in the faba bean genotypes. The most abundant proanthocyanidin compounds were prodelphinidin and catechin and the predominant flavonols and flavones were myricetin, quercetin, apigenin, kaempferol, and luteolin-free aglycones or glycosides. The TFC was correlated with ferric-reducing antioxidant power activity (FRAP) (P ≤ 0.05), Trolox equivalent antioxidant capacity (TEAC) (P ≤ 0.01), and DPPH radical scavenging activity (P ≤ 0.01). The results indicated that the PI430715 genotype contained the highest TPC and TFC and exhibited the highest FRAP, TEAC and DPPH radical scavenging activities. These results may help determine the optimal genotypes for breeding new cultivars of faba bean with potentially greater health benefits.
-
Key words: Antioxidants activities, Correlation analysis, Faba bean, Phenolic compounds
INTRODUCTION
The faba bean (
Vicia faba L.) is one of the most important legume crops for human and animal consumption in many countries (
Goyoaga et al. 2008), particularly for people in East Asia, Europe and Latin America (
Adsule and Akpapunam 1996). The color of faba beans can vary from white to green, light brown, dark brown, purple and black (
Shazali 1990;
Ryu et al. 2017). Faba beans are rich in many nutrients such as protein, starch, dietary fiber and fatty acids (
Goyoaga et al. 2008;
Crepon et al. 2010;
Ryu et al. 2017) and also contain many functional phenolic and flavonoid compounds such as tannin, proanthocyanidins, L-3,4-dihydrophenylalanine (L-dopa), flavonols and flavones which possess antioxidant activity (
Shetty et al. 2003;
Baginsky et al. 2013;
Siah et al. 2014;
Boukhanouf et al. 2016). Phenolic compounds have the advantage of reducing the risk of hypertension, cancer and mutagenic activity and L-dopa compounds have anticancer properties and can be used to treat Parkinson’s disease (
Shetty et al. 2003;
Oomah et al. 2011;
Hu et al. 2015). The tannin content in the seed coat is an important factor affecting the feed value of the grain, because it can adversely affect the metabolizable energy in the grain and the protein available for animals (
Nozzolillo et al. 1989;
Gunawardena et al. 2010;
Kosinska et al. 2011). Tannins have also been considered as a health-promoting component in foods and beverages (
Baginsky et al. 2013;
Siah et al. 2014).
Thus, the objective of the present study was to investigate and compare the physicochemical characteristics and antioxidant activity of selected faba bean genotypes to help determine which would be suitable for further study regarding their potential health benefits.
MATERIALS AND METHODS
Plant materials and extraction
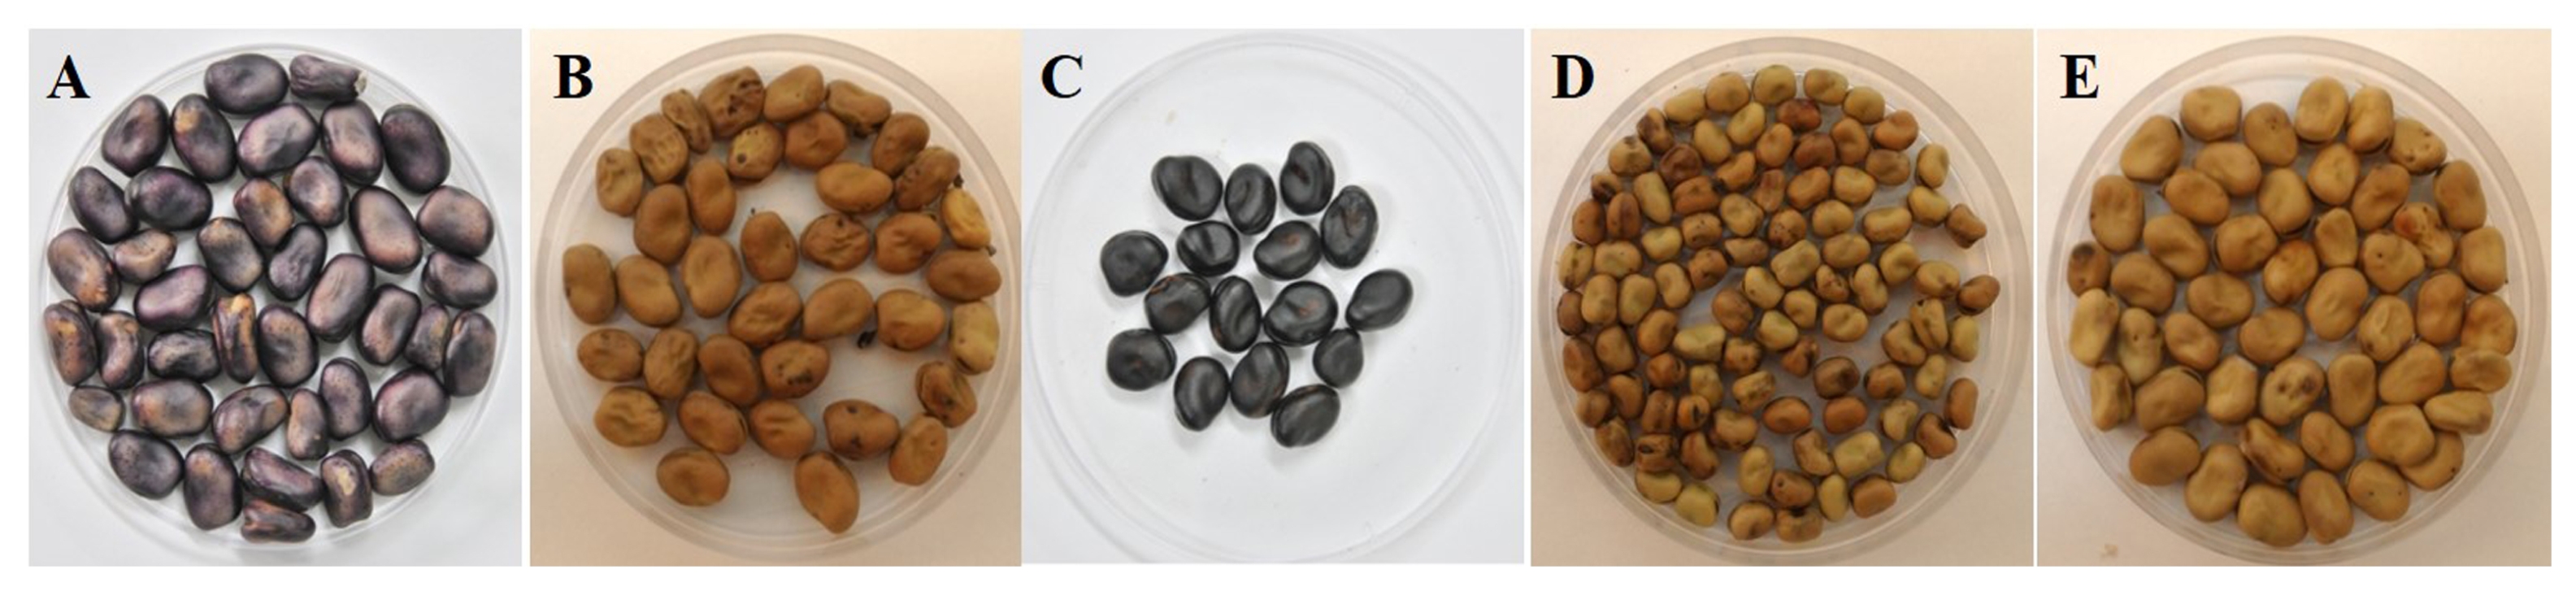
Five faba bean genotypes (
Fig. 1), selected on the basis of their seed yield, seed coat color, and L-dopa and linolenic acid contents (
Ryu et al. 2017), were obtained from the United States Department of Agriculture (
Table 1). The color of the seeds was purple, brown or black. These lines were cultivated from 2014 to 2015 at the breeding farm of the Advanced Radiation Technology Institute at the Korean Atomic Energy Research Institute, Jeong-eup, Republic of Korea. For each of the five genotypes, the grains of the faba bean were harvested from three biological replicates. Extracts were taken from a 10 g grain sample using 50 mL of methanol for 24 hours. The extract samples were then used to determine total tannin content (TTC), total polyphenol content (TPC), total flavonoid content (TFC), total proanthocyanidin content (TPAC), Trolox equivalent antioxidant capacity (TEAC), ferric-reducing antioxidant power (FRAP), and 2, 2-diphenyl-1-picrylhydrazyl (DPPH) radical scavenging activity and analyzed using ultra-high performance liquid chromatography mass spectrometry (UPLC-MS).
The TTC was determined using a modified vanillin-hydrochloric acid assay (
Price et al. 1978). The absorbance level was measured at 500 nm using a UV-spectrophotometer (UV-1800, Shimadzu, Kyoto, Japan). Standard curves were used to express TTC as catechin equivalents.
The TPC was determined using a modified Folin–Ciocalteu colorimetric method (
Ryu et al. 2016). Each extract (0.2 mL) was mixed thoroughly with 1.5 mL of Folin-Ciocalteu reagent (20% v/v). After adding 7% sodium carbonate (4 mL), the mixture was made up to 10 mL with double-distilled water. The mixture was then kept in the dark at room temperature for 90 minutes. The absorbance was measured at 760 nm using a UV-spectrophotometer (UV-1800, Shimadzu, Kyoto, Japan). TPC was calculated using a calibration curve of tannic acid.
The TFC of the grain of the faba bean was determined as described by
Zhishen et al. (1999). Each extract sample (0.2 mL) was added to 4 mL of water in a flask then 0.3 mL of 5% sodium nitrite was added. The samples were allowed to stand for 5 minutes then 0.3 mL of 10% aluminum chloride was added. After adding 2 mL of sodium hydroxide, the mixture was made up to 10 mL with double-distilled water. The absorbance was then measured at 510 nm using a UV-spectrophotometer (UV-1800, Shimadzu, Kyoto, Japan). TFC was calculated using a calibration curve expressed as quercetin equivalents.
The TPAC was determined as described by
Boukhanouf et al. (2016) with some modifications. The extract was mixed with 2 mL of iron sulfate solution. The mixture was then incubated at 95°C for 15 minutes. The absorbance was determined at 540 nm using a UV-spectrophotometer (UV-1800, Shimadzu, Kyoto, Japan). The results were calculated and expressed as cyanidin equivalents.
The TEAC was measured as described
Siah et al. (2014) with a minor modification. For the measurements, the 2,2′-azinobis (3-ethylbenzothiazoline-6-sulfonic acid) diammonium salt (ABTS) solution was diluted with 80% methanol then the absorbance measured at 734 nm using a UV-spectrophotometer (UV-1800, Shimadzu, Kyoto, Japan). TEAC was calculated using a calibration curve of the Trolox standard curve.
FRAP was assayed according to the method of
Benzie and Strain (1996) with some modification. The FRAP reagent was prepared with 10 mM of 2,4,6-tris(2-pyridyl)-s-triazine solution in hydrochloric acid (40 mM), 20 mM of iron chloride solution, and 0.3 M acetate buffer (pH 3.6) in the proportions of 1:1:10 (v/v). Fifty μL of each diluted ethanolic extract were mixed with 3 mL of freshly prepared FRAP reagent. The absorbance was measured at 593 nm using a UV-spectrophotometer (UV-1800, Shimadzu, Kyoto, Japan). The FRAP values were calculated and expressed as iron chloride/g dry weight of faba bean powder.
The DPPH radical scavenging activity was measured as described by
Ryu et al. (2016). Each different concentrations of extract were added to 0.15 mM DPPH, then after 30 minutes, the DPPH radicals remaining were quantified using a plate reader (Benchmark Plus; Bio-Rad, Hercules, CA, USA) at 517 nm. The DPPH radical scavenging activity was calculated as follows:
Where: As: absorbance value with sample extract solution; Ac: absorbance value without sample extract solution.
UPLC-MS analysis
Each sample extract was analyzed using a 1260 series high-performance liquid chromatography system, a 380 evaporative light scattering detector, and a 6130 quadrupole mass spectrometry system (Agilent Technologies Inc., Santa Clara, CA, USA) equipped with a Poroshell 120 SB-C18 column (150 mm × 4.6 mm internal diameter, 2.7 μm particle size; Agilent Technologies Inc., Santa Clara, CA, USA) with a compatible C18 guard column (4 mm × 3 mm internal diameter, 3 μm particle size; Phenomenex, Torrance, CA, USA). The mobile phase was composed of water (A, 0.05% formic acid) in acetonitrile (B, 0.05% formic acid). The following gradients were used: 0–3 minutes, 95% A and 5% B; 3–28 minutes, 100% B; and 28–36 minutes, 100% B. The flow rate of the mobile phase was adjusted to 0.5 mL/minute, and the column temperature was set at 24°C. The injection volume was 20 μL. The mass parameters were as follows: drying gas pressure, 12.0 L/minute; positive and negative capillary voltage, 3000 V; drying gas temperature, 350°C; and nebulizer gas pressure, 35 psig (Lb/in2). The mass selective detector (MSD) signal settings in the positive/negative mode were as follows: mass range (m/z), 100 1000; fragmentor, 70 V; and scan mode.
Data analysis
All data were subjected to analysis of variance using the multiple comparisons method of SPSS version 12 (SPSS Inc., Chicago, IL, USA). The correlation analyses were based on Pearson’s correlation coefficient. Any test results were determined to be statistically significant at P < 0.05. When the treatment effect was significant, the means were separated using Duncan’s multiple range tests.
RESULTS
Phytochemical analysis
The phytochemical contents (TTC, TFC, TPC, and TPAC) of the grain samples from each of the five faba bean genotypes are shown in
Table 1. The results revealed significant differences (
P < 0.05) in the data between the different genotypes. The highest TTC was observed in the PI252004 and the lowest in the PI366039 genotypes. The TFC was highest in PI430715 (16.40 mg/g); followed by PI252004 (10.41 mg/g), PI614810 (10.01 mg/g), PI284345 (9.98 mg/g) and PI366039 (8.18 mg/g). The TPC obtained from the different genotypes also varied significantly, except for PI252004 and PI430715 which did not differ significantly. The TPC of all genotypes ranged from 24.82 to 29.71 mg/g, the highest values being observed for the PI252004 and PI430715 genotypes. The PI252004 genotype had the highest TPAC and PI366039 the lowest.
Representative HPLC-MS fingerprint chromatograms of the selected faba bean genotypes are shown in
Table 2 and
Supplementary Fig. S1. Twenty-two compounds were detected in the grain of the five faba bean genotypes. Fourteen compounds were detected in the PI252004 genotype; prodelphinidin (348.3 mg/kg), epicatechin (207.1 mg/kg), epicatechin isomer 1 (2.7 mg/kg), epicatechin isomer 2 (1.6 mg/kg), 6,8-C-diglucosylapigenin (6.0 mg/kg), quercetin 3-O-rutinoside (3.4 mg/kg), quercetin 3-O-rutinoside isomer 1 (28.6 mg/kg), quercetin 3-O-rutinoside isomer 2 (1.8 mg/kg), kaempferol-3-O-rhamnosylgalactoside (9.9 mg/kg), kaempferol-3-rutinoside (8.1 mg/kg), apigenin 7-O-galactoside (7.5 mg/kg), procyanidin dimer 1 (2.4 mg/kg), procyanidin dimer 2 (5.2 mg/kg), and myricetin-3-O-glucoside dimer (9.5 mg/kg); sixteen compounds in PI284345: prodelphinidin (350.6 mg/kg), epicatechin (176.6 mg/kg), epicatechin isomer 1 (1.9 mg/kg), epicatechin isomer 2 (0.6 mg/kg), 6,8-C-diglucosylapigenin (5.9 mg/kg), quercetin 3-O-rutinoside (3.8 mg/kg), quercetin 3-O-rutinoside isomer 1 (15.2 mg/kg), quercetin 3-O-rutinoside isomer 2 (1.5 mg/kg), gallotannin (10.1 mg/kg), kaempferol 3-O-acetyl-dirhamnosylhexoside (4.1 mg/kg), luteolin-7-O-hexosyl-8-C-(6″-acetyl)-hexoside (7.0 mg/kg), luteolin-7-O-hexosyl-8-C-(6″-acetyl)-hexoside isomer (0.4 mg/kg), apigenin 7-O-galactoside (5.3 mg/kg), procyanidin dimer 1 (2.1 mg/kg), procyanidin dimer 2 (2.3 mg/kg), and myricetin-3-O-glucoside dimer (6.8 mg/kg); nine compounds in PI366039: prodelphinidin (353.2 mg/kg), epicatechin (132.1 mg/kg), epicatechin isomer 1 (1.5 mg/kg), quercetin 3-O-rutinoside isomer 1 (13.4 mg/kg), kaempferol-3-O-rhamnosylgalactoside (2.7 mg/kg), kaempferol 3-O-acetyl-dirhamnosylhexoside (2.1 mg/kg), apigenin 7-O-galactoside (10.2 mg/kg), procyanidin dimer1 (2.2 mg/kg), and procyanidin dimer 2 (1.8 mg/kg); sixteen compounds in PI614810: prodelphinidin (350.9 mg/kg), epicatechin (170.2 mg/kg), epicatechin isomer 1 (2.8 mg/kg), epicatechin isomer 2 (1.1 mg/kg), 6,8-C-diglucosylapigenin (6.0 mg/kg), quercetin 3-O-rutinoside isomer 1 (28.1 mg/kg), quercetin 3-O-rutinoside isomer 2 (2.0 mg/kg), gallotannin (2.8 mg/kg), luteolin-7-O-hexosyl-8-C-(6″-acetyl)-hexoside (2.2 mg/kg), apigenin 7-O-galactoside (5.4 mg/kg), procyanidin dimer 1 (2.1 mg/kg), procyanidin dimer 2 (3.8 mg/kg), 1,2,6-trigalloylglucose dimer (0.4 mg/kg), myricetin-3-O-glucoside (82.9 mg/kg), myricetin-3-O-glucoside dimer (2.4 mg/kg), and kaempferol-3-O-p-coumaroylhexoside (1.2 mg/kg); and fifteen compounds in PI430715: prodelphinidin (349.5 mg/kg), epicatechin (204.4 mg/kg), epicatechin isomer 1 (11.4 mg/kg), epicatechin isomer 2 (5.7 mg/kg), 6,8-C-diglucosylapigenin (3.6 mg/kg), quercetin 3-O-rutinoside isomer 1 (50.3 mg/kg), quercetin 3-O-rutinoside isomer 2 (1.8 mg/kg), Kaempferol-3-O-rhamnosylgalactoside (2.1 mg/kg) kaempferol 3-O-acetyl-dirhamnosylhexoside (10.6 mg/kg), kaempferol 3-O-acetyl-dirhamnosylhexoside dimer (0.8 mg/kg), apigenin-7-O-galactoside (6.0 mg/kg), procyanidin dimer 1 (2.2 mg/kg), procyanidin dimer 2 (3.4 mg/kg), myricetin-3-O-glucoside (2.9 mg/kg), and myricetin-3-O-glucoside dimer (1.8 mg/kg).
The results of analyzing the antioxidant activity of the five selected faba bean genotypes are shown in
Fig. 2. The FRAP activity of all the genotypes ranged from 17.5 to 22.3 μmol/g with the highest activity being observed in the PI430715 genotype. This genotype also showed the highest TEAC activity, but there were no significant differences in TEAC activity between the PI252004, PI284345, PI366039 and PI614810 genotypes. The PI430715 genotype also exhibited the greatest DPPH radical scavenging activity followed by the PI252004, PI284345, PI614810 and PI366039 genotypes.
DISCUSSION
Faba bean seeds are rich in many functional components such as phenolic and flavonoid compounds (
Baginsky et al. 2013). However, there have been few studies on the phenolic and flavonoid contents of faba beans grown in Korea. The results of the present study have revealed the presence of phytochemical compounds in the grain of selected faba beans with a high yield, and high contents of L-dopa and linolenic acid. These genotypes could potentially be used in faba bean breeding programs.
Tannins are an important nutritive component of faba bean for use as food and feed (
Shazali 1990;
Goyoaga et al. 2008;
Kosinska et al. 2011) and are present mainly in the seed coat (
Papadopoulos et al. 1985;
Shazali 1990). It was found that faba beans with black seed coats contained lower tannin content than those with brown and purple seed coats. Similarly,
Shazali (1990) reported that faba beans with a black seed coat exhibited a lower tannin content than those with dark brown, brown, light brown or white seed coats.
Papadopoulos et al. (1985) reported that faba beans with a white seed coat were tannin-free but the darker the color, the greater the tannin content in the faba bean. This variability in faba bean tannin content has been assumed to be influenced by the genotype and by environmental factors (
Kosinska et al. 2011;
Baginsky et al. 2013). Previously, the predominant pigment in beige, black, brown, green, red, and violet faba bean seeds was found to be myricetin and anthocyanin (
Nozzolillo et al. 1989). Our results suggest that seed coat color is not a good indicator of the tannin content of faba beans.
We observed significant differences in TPC and TFC between the different faba bean genotypes. The TFC and TPC in the seed of the PI430715 genotype were higher than those from the other genotypes. The TFC and TPC of all genotypes were also higher than those reported in the grain of faba beans by
Boukhanouf et al. (2016), TFC (0.167 mg quercetin equivalent/g) and TPC (12 mg gallic acid equivalent/g). These differences may be related to the different genotypes and the analytical method (gallic acid equivalent) used.
Ryu et al. (2017) have also reported that the PI430715 genotype is potentially the most suitable material for helping treat Parkinson’s disease because of its high levels of L-DOPA. L-DOPA, a phenolic compound with two hydroxyl groups, has been reported as the predominant secondary metabolite detected in faba beans (
Shetty et al. 2003;
Oomah et al. 2011;
Hu et al. 2015). In additions, the PI430715 genotype was selected on the basis of high seed and biomass production after spring sowing in early March (
Ryu et al. 2017). Our results suggest that PI430715 is potentially the most appropriate of the five faba bean genotypes for improving health benefits because of its high levels of TPC and TFC.
In a previous study, proanthocyanidins have been shown to provide effective antioxidant activity in faba bean (
Boukhanouf et al. 2016). These condensed tannins (proanthocyanidins) are oligomers or polymers of flavan-3-ols linked by carbon–carbon bonds (
Shazali 1990;
Kosinska et al. 2011;
Baginsky et al. 2013). In the present study, the TPAC ranged from 0.162 (PI366039) to 0.271 mg/g (PI252004) with an average of 0.207 mg/g. These results were similar to those reported by
Siah et al. (2014) for faba beans (0.13–0.23 mg/g). The most notable of the results of the present study were the high TPAC in the PI252004 and PI430715 genotypes. There was also a significant difference between TPC and TPAC for PI284345, which may have distorted the spectrophotometric analysis of the faba bean (
Baginsky et al. 2013).
The phenolic compounds in faba beans, phenolic acids, catechin, flavonols, proanthocyanidins and anthocyanins, exhibit a great range of different structures (
Siah et al. 2014). In the present study, the predominant compounds identified by LC-MS analysis in all faba bean genotypes were proanthocyanidins (prodelphinidin and catechin). Proanthocyanidins, phenolic compounds, are widely distributed in legume crops. Previous studies have reported that proanthocyanidins were the main phenolic compound in legume crops such as faba bean (
Baginsky et al. 2013), soybean (
Takahashi et al. 2005;
Ito et al. 2013) and lentil bean (
Xu and Chang 2007). Flavonols and flavones are important compounds because of their strongly antioxidative activity (
Majewska et al. 2011). The predominant flavonols and flavones in the selected faba bean genotypes were myricetin, quercetin, apigenin, kaempferol, and luteolin-free aglycones or glycosides. This agreed with other studies on faba beans where the flavonols were mainly myricetin, kaempferol, and quercetin derivatives (
Nozzolillo et al. 1989; Biginsky
et al. 2013). The concentration and presence of phenolic compounds in crops is influenced by genetic and environment factors (
Baginsky et al. 2013;
Ryu et al. 2016). In the present study, all the genotypes were grown in the same field during the same season, so any differences observed in the levels of phenolic compounds between the genotypes probably reflected genotypic variation. Further studies that take account annual and environmental variation would be needed to quantify their influence on the phenolic composition of these genotypes.
The phenolic and flavonoid compounds are responsible for the antioxidant activities of plant materials (
Majewska et al. 2011;
Ryu et al. 2016). The Pearson’s correlation coefficients listed in
Table 3 provide an indication of the strength of the relationship between the contents of these compounds and the different types of measured antioxidant activity. The TFC was correlated with FRAP activity (
P ≤ 0.05), TEAC activity (
P ≤ 0.01) and DPPH radical scavenging activity (
P ≤ 0.01), the FRAP activity with TEAC activity and DPPH radical scavenging activity (
P ≤ 0.05) and the TEAC activity with DPPH radical scavenging activity (
P ≤ 0.01). Similarly,
Boukhanouf et al. (2016) have reported that the DPPH radical scavenging activity and oxygen uptake inhibition activity of faba bean were highly correlated with TPC and TFC. Strong correlations between antioxidant activity and total flavonoid or total phenolic contents of faba beans have also been reported elsewhere (
Adsule and Akpapunam 1996;
Baginsky et al. 2013;
Siah et al. 2014).
The use of faba beans as materials providing antioxidant activity may increase demand for them. In addition, breeding to achieve higher concentrations of functional compounds in crops is important for improving human health (
Ryu et al. 2017). Our results suggest that the PI430715 genotype is the most suitable source for food and feed because it contained higher levels of functional compounds with greater antioxidant activity. The PI430715 genotype also exhibited higher levels of epicatechin isomer, quercetin 3-O-rutinoside isomer and kaempferol 3-O-acetyl-dirhamnosylhexoside than the other genotypes.
These results will be useful to help identify antioxidant compounds with enhanced qualities and potentially greater health benefits when faba beans are included in the human diet.
Supplementary Information
ACKNOWLEDGEMENTS
This work was supported by Radiation Technology R&D program (NRF-2017M2A2A6A05018538) through the National Research Foundation of Korea funded by the Ministry of Science and ICT.
Fig. 1Seed coat color profiles of five selected faba bean genotypes bred in Korea. (A) PI252004, (B) PI284345, (C) PI366039, (D) PI614810, (E) PI430715.

Fig. 2Antioxidant activity of five selected faba bean genotypes bred in Korea. (A) Ferric-reducing antioxidant power (FRAP) activity, (B) Trolox equivalent antioxidant capacity (TEAC), (C) DPPH radical scavenging activity. zDifferent letters indicate a significant difference at the 0.05 probability level (Duncan’s multiple range tests, n = 3).
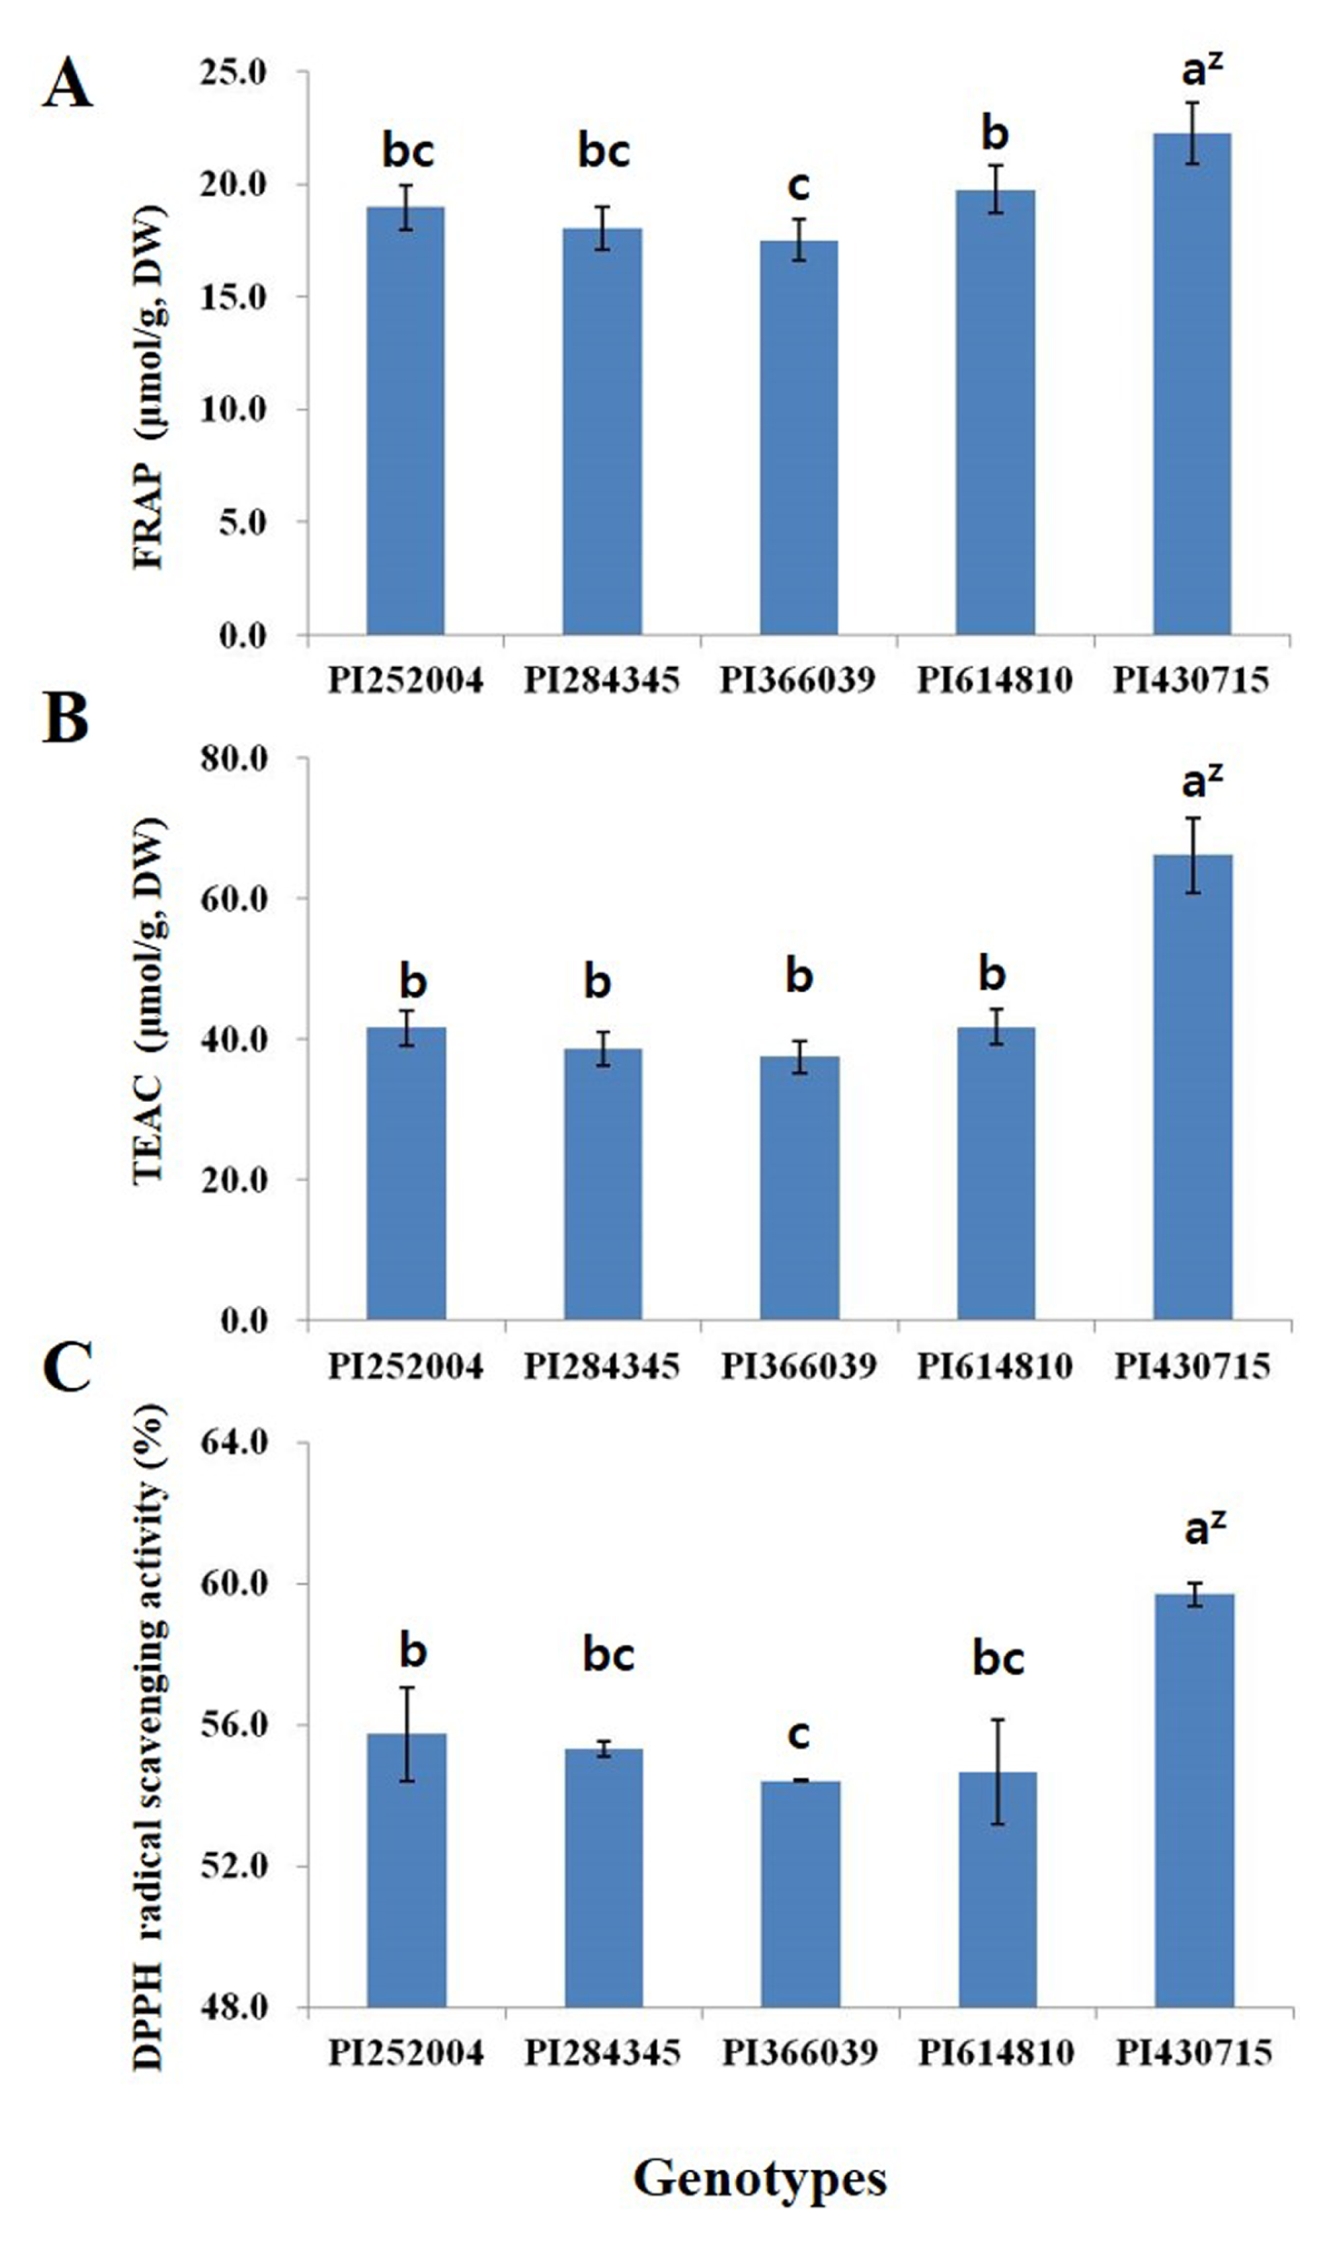
Table 1Origin and phytochemical content of faba bean.
Table 1
|
No. |
Accession number |
Origin |
Seed coat color |
Total tannin content (mg/g) |
Total flavonoid content (mg/g) |
Total phenolics content (mg/g) |
Total proanthocyanidin content (mg/g) |
|
1 |
PI252004 |
Turkey |
Purple |
0.65 ± 0.02az)
|
10.41 ± 0.77b |
29.71 ± 0.85a |
0.271 ± 0.004a |
|
2 |
PI284345 |
Italy |
Brown |
0.58 ± 0.03b |
9.98 ± 0.86b |
26.73 ± 1.79b |
0.182 ± 0.006d |
|
3 |
PI366039 |
Argentina |
Black |
0.21 ± 0.01d |
8.18 ± 0.24c |
24.82 ± 1.04c |
0.162 ± 0.010e |
|
4 |
PI614810 |
USA |
Brown |
0.41 ± 0.01c |
10.01 ± 0.64b |
26.12 ± 0.52b |
0.201 ± 0.001c |
|
5 |
PI430715 |
Hungary |
Brown |
0.58 ± 0.06b |
16.40 ± 1.09a |
29.10 ± 1.04a |
0.220 ± 0.008b |
Table 2Phenolic compound constituents (mg/kg) in selected faba bean genotypes by LC-MS.
Table 2
|
No. |
RT (min) |
λmax (nm) |
M-H+/ M-H− (m/z) |
Tentative identification |
PI252004 |
PI284345 |
PI366039 |
PI614810 |
PI430715 |
|
1 |
7.64 |
277 |
− /593 |
Prodelphinidiny)
|
348.3az)
|
350.6a |
353.2a |
350.9a |
349.5a |
|
2 |
10.77 |
279 |
291/289 |
Epicatechiny)
|
207.1a |
176.6b |
132.1c |
170.2b |
204.4a |
|
3 |
10.84 |
279 |
291/289 |
Epicatechin isomer1y)
|
2.7b |
1.9c |
1.5c |
2.8b |
11.4a |
|
4 |
10.93 |
279 |
291/289 |
Epicatechin isomer2y)
|
1.6b |
0.6c |
−d |
1.1bc |
5.7a |
|
5 |
11.09 |
334 |
595/593 |
6,8-C-diglucosylapigeninx)
|
6.0a |
5.9a |
−c |
6.0a |
3.6b |
|
6 |
11.57 |
354 |
611/609 |
Quercetin 3-O-rutinosidey)
|
3.4a |
3.8a |
−b |
−b |
−b |
|
7 |
11.58 |
354 |
611/609 |
Quercetin 3-O-rutinoside isomer1y)
|
28.6b |
15.2c |
13.4c |
28.1b |
50.3a |
|
8 |
11.67 |
354 |
611/609 |
Quercetin 3-O-rutinoside isomer2y)
|
1.8a |
1.5a |
−b |
2.0a |
1.8a |
|
9 |
11.89 |
|
− /797 |
Gallotanninx)
|
−c |
10.1a |
−c |
2.8b |
−c |
|
10 |
12.12 |
|
595/593 |
Kaempferol-3-O-rhamnosylgalactosidex)
|
9.9a |
−c |
2.7b |
−c |
2.1b |
|
11 |
12.20 |
|
595/593 |
Kaempferol-3-rutinosidex)
|
8.1a |
−b |
−b |
−b |
−b |
|
12 |
12.20 |
|
637/781 |
Kaempferol 3-O-acetyl-dirhamnosylhexosidex)
|
−c |
4.1b |
2.1b |
−c |
10.6a |
|
13 |
12.29 |
|
637/781 |
Kaempferol 3-O-acetyl-dirhamnosylhexoside dimerx)
|
−b |
−b |
−b |
−b |
0.8a |
|
14 |
12.41 |
|
653/651 |
Luteolin-7-O-hexosyl-8-C-(6″-acetyl)- hexosidex)
|
−c |
7.0a |
−c |
2.2b |
−c |
|
15 |
12.49 |
|
653/651 |
Luteolin-7-O-hexosyl-8-C-(6″-acetyl)- hexoside isomerx)
|
−b |
0.4a |
−b |
−b |
−b |
|
16 |
12.74 |
339 |
433/431 |
Apigenin 7-O-galactosidey)
|
7.5b |
5.3c |
10.2a |
5.4c |
6.0bc |
|
17 |
12.82 |
280 |
− /577 |
Procyanidin dimer1y)
|
2.4a |
2.1a |
2.2a |
2.1a |
2.2a |
|
18 |
12.90 |
280 |
− /577 |
Procyanidin dimer2y)
|
5.2a |
2.3c |
1.8c |
3.8b |
3.4b |
|
19 |
12.97 |
|
− /635 |
1,2,6-trigalloylglucose dimerx)
|
−b |
−b |
−b |
0.4a |
−b |
|
20 |
14.35 |
349 |
481/479 |
Myricetin-3-O-glucosidey)
|
−c |
−c |
−c |
82.9a |
2.9b |
|
21 |
14.37 |
349 |
481/479 |
Myricetin-3-O-glucoside dimery)
|
9.5a |
6.8b |
−e |
2.4c |
1.8d |
|
22 |
21.07 |
|
595/593 |
Kaempferol-3-O-p-coumaroylhexosidex)
|
−b |
−b |
−b |
1.2a |
−b |
Table 3Correlation analysis between phytochemical content and antioxidant activity in faba bean genotypes.
Table 3
|
Trait |
P-value |
R2
|
|
Total flavonoid content and FRAP activity |
*
|
0.939 |
|
Total flavonoid content and TEAC activity |
**
|
0.984 |
|
Total flavonoid content and DPPH radical scavenging activity |
**
|
0.986 |
|
FRAP activity and TEAC activity |
*
|
0.941 |
|
FRAP activity and DPPH radical scavenging activity |
*
|
0.882 |
|
TEAC activity and DPPH radical scavenging activity |
**
|
0.977 |
References
- Adsule RN, Akpapunam M. 1996. Faba bean (Vicia faba L.). pp. 197-202. Nwokolo E, Smartt J, editors. Food and feed from legumes and oilseeds. Springer. Boston, MA, USA:
- Agung S, McDonald GK. 1998. Effects of seed size and maturity on the growth and yield of faba bean (Vicia faba L.). Aust J Agr Res. 49: 79-88.
- Baginsky C, Pena-Neira A, Caceres A, Hernandez T, Estrella I, Morales H, et al. 2013. Phenolic compound composition in immature seeds of fava bean (Vicia faba L.) varieties cultivated in Chile. J Food Compost Anal. 31: 1-6.
- Benzie IFF, Strain JJ. 1996. The ferric reducing ability of plasma (FRAP) as a measure of “antioxidant power”: The FRAP assay. Analytical Biochem. 239: 70-76.
- Boukhanouf S, Louaileche H, Perrin D. 2016. Phytochemical content and in vitro antioxidant activity of faba bean (Vicia faba L.) as affected by maturity stage and cooking practice. International Food Research Journal. 23: 954-961.
- Crepon K, Marget P, Peyronnt C, Carrouee B, Arese P, Duc G. 2010. Nutritional value of faba bean (Vicia faba L.) seeds for feed and food. Field Crops Res. 115: 329-339.
- Chaieb N, Gonzalez JL, Lopez-Mesas M, Bouslama M, Valiente M. 2011. Polyphenols content and antioxidant capacity of thirteen faba bean (Vicia faba L.) genotypes cultivated in Tunisia. Food Res Inter. 44: 970-977.
- Goyoaga C, Burbano C, Cuadrado C, Varela A, Guillamon E, Pedrosa MM, et al. 2008. Content and distribution of vicine, convicine and L-DOPA during germination and seedling growth of two Vicia faba L. varieties. Eur Food Res Technol. 227: 1537-1542.
- Gunawardena CK, Zijlstra RT, Beltranena E. 2010. Characterization of the nutritional value of air-classified protein and starch fractions of field pea and zero-tannin faba bean in grower pigs. J Animal Sci. 88: 660-670.
- Hu J, Kwon SJ, Park JJ, Landry E, Mattinson DS, Gang DR. 2015. LC-MS determination of L-DOPA concentration in the leaf and flower tissues of six faba bean (Vicia faba L.) lines with common and rare flower colors. Functional Foods in Health and Disease. 5: 243-250.
- Kosinska A, Karamac M, Penkacik K, Urbalewicz A, Amarowicz R. 2011. Interactions between tannins and proteins isolated from broad bean seeds (Vicia faba Major) yield soluble and non-soluble complexes. Eur Food Res Technol. 233: 213-222.
- Ito C, Oki T, Yoshida T, Nanba F, Yamada K, Toda T. 2013. Characterisation of proanthocyanidins from black soybeans: Isolation and characterisation of proanthocyanidin oligomers from black soybean seed coats. Food Chem. 141: 2507-2512.
- Majewska M, Skrzycki M, Podsiad M, Czeczot H. 2011. Evaluation of antioxidant potential of flavonoids: an in vitro study. Acta Pol Pharm. 68: 611-615.
- Nozzolillo C, Ricciardi L, Lattanzio V. 1989. Flavonoid constituents of seed coats of Vicia faba (Fabaceae) in relation to genetic control of their color. Can J Bot. 67: 1600-1604.
- Oomah BD, Luc G, Leprelle C, Drover JCG, Harrison JE, Olson M. 2011. Phenolics, phytic acid, and phytase in Canadian-grown low tannin faba bean (Vicia faba L.) genotypes. J Agric Food Chem. 59: 3763-3771.
- Papadopoulos CH, Tsaflaris AS, Roupakias DG. 1985. Correlation between tannin content and testa colour in faba beans (Vicia faba L.). Fabis. 13: 38-40.
- Price ML, Scoyoc SV, Butler LG. 1978. Critical evaluation of vanillin reaction as an assay for tannin in sorghum grain. J Agric Food Chem. 26: 1214-1218.
- Ryu J, Kim DG, Lee MK, Kim JM, Hong MJ, Kang KY, et al. 2017. Fatty acid composition, isoflavone and L-3,4-dihydroxyphenylalanine (L-dopa) contents in different parts of faba bean (Vicia faba) genotypes. Plant Breed Biotech. 5: 314-324.
- Ryu J, Kwon SJ, Jo YD, Jin CH, Nam BM, Lee SY, et al. 2016. Comparison of phytochemicals and antioxidant activity in blackberry (Rubus fruticosus L.) fruits of mutant lines at the different harvest time. Plant Breed Biotech. 4: 242-251.
- Shazali MEH. 1990. Faba bean (Vicia faba L.) seed coat colour tannin content and susceptibility to bruchids. Int J Trop Insect Sci. 11: 855-859.
- Shetty P, Atallah MT, Shetty K. 2003. Stimulation of total phenolics, L-DOPA and antioxidant activity through proline-linked pentose phosphate pathway in response to proline and its analogue in germinating fava beans (Vicia faba). Process Biochem. 38: 1707-1717.
- Siah S, Konczak I, Wood JA, Agboola S, Blanchard CL. 2014. Effects of roasting on phenolic composition and in vitro antioxidant capacity of Australian grown faba beans (Vicia faba L.). Plant Foods Hum Nutr. 69: 85-91.
- Takahashi R, Ohmori R, Kiyose C, Momiyama Y, Ohsuzu F, Kondo K. 2005. Antioxidant activities of black and yellow soybeans against low density lipoprotein oxidation. J Agric Food Chem. 53: 4578-4582.
- Xu BJ, Chang SK. 2007. A comparative study on phenolic profiles and antioxidant activities of legumes as affected by extraction solvents. J Food Sci. 72: 159-166.
- Zhishen J, Mengcheng T, Jianming W. 1999. The determination of flavonoid contents in mulberry and their scavenging effects on superoxide radicals. Food Chem. 64: 555-559.