Abstract
We performed a molecular marker-based analysis of quantitative trait loci (QTLs) for the traits that determine appearance quality of the grains using 120 double haploid (DH) lines developed by anther culture from F1 hybrid of a cross between Cheongcheong (Oryza sativa L. ssp. Indica) and Nagdong (Oryza sativa L. ssp. Japonica). The traits studied included grain length, grain width, grain thickness, length to width ration and thousand grain weight. This experiment was conducted with two replications of 2013 and 2014. A linkage map with 217 DNA markers was constructed spanning across 2,067.1 centiMorgans (cM) at an average interval of 9.5 cM between markers and covering 12 rice chromosomes. Interval mapping procedure was used to identify the QTLs controlling five grain traits and QTLs detected were further confirmed using composite interval mapping. A total of 24 QTLs affecting grain appearances were identified and mapped on all the twelve chromosomes for 2 years at grain quality. Nine of the 24 QTLs were reproducibly detected in two year trials. Major QTL for grain length was detected on chromosome 5 in 2013 with a phenotypic variation of 64% and chromosome 7 in 2014 that explained 55% of the phenotypic variation. The QTL findings in this study will in future faciltate the gene isolation and breeding application for improvement of rice grain shape and yield.
-
Key words: Quantitative trait loci, Double haploid, Grain quality, Rice
INTRODUCTION
Rice is one of the most important cereal crops and a staple food for 40% of the world population. More than 90% of rice is produced and consumed in Asia (
Khush 2004). The current world population of 7.4 billion is expected to reach 8.5 billion by 2030 and rice production must increase by 50% in order to meet the growing demand. High yield is an important consideration for commercial and private producers, but demand for superior grain quality is increasingly a priority for international export markets in all rice producing areas of the world (
Juliano et al. 1990). Grain yield in rice is determined by three major components; number of panicles per plant, number of grains per panicle and grain weight (
He et al. 1999;
Huang et al. 2013). Grain weight is the most reliable trait of rice grain yield and is conditioned by quantitative trait locus (QTL). Grain shape, a typical complex quantitative trait, is closely associated with grain weight and usually measured by grain length, width, thickness and length-to-width ratio (
Tan et al. 2000). Besides its contribution to grain yield, grain shape is an important quality trait that has a major impact on the market values of rice grain products. A long, slender grain of rice is generally preferred by consumers in Southern China, the USA and South and Southeast Asian countries, whereas consumers in Japan, Korea and Northern China prefer a rice grain that is short and round (
Juliano and Villareal 1993). Since these characteristics related to grain appearance are quantitatively inherited, it is difficult for breeders to efficiently achieve improvement by using convectional selection methods (
Qin et al. 2008). The identification of major quantitative trait loci (QTLs) for grain shape and grain weight is an important objective of rice genetic research and breeding programs, this has led to development of DNA markers and linkage maps which have provided new opportunities for genetic improvement of rice grain quality with physical and chemical properties (
Cho et al. 2010). Quantitative traits like the grain size in rice has been studied extensively and QTLs governing this important trait identified (
Redoña and Mackill 1998;
Tan et al. 2000).
Redoña and Mackill (1998) found seven, four and three QTLs for grain length, width and shape respectively and reported that the grain length/width ratio was mostly controlled by loci on chromosome 3 and 7 that coincided with the most important QTLs identified for grain length and grain width. Similarly in this study a locus on chromosome 7 and was found to have a major control on the grain length, grain width was majorly controlled by a locus on chromosome 2. The length/width ratio was controlled by loci on chromosome 2 and 7, as reported by
Redoña and Mackill (1998), these loci coincided with the ones identified for grain length and width. In the present study, we performed a molecular marker-based analysis of QTLs for the traits that determine appearance quality of the grains using 120 double haploid (DH) lines developed by anther culture from F
1 hybrid of a cross between Cheongcheong (
Oryza sativa L. ssp. Indica) and Nagdong (
Oryza sativa L. ssp. Japonica). The traits studied included grain length, grain width, grain thickness, length to width ration and thousand grain weight. The objective of this study was to determine the genetic control of these traits in this cross in order to formulate a strategy for improving the appearance quality of this hybrid.
MATERIALS AND METHODS
Materials and field arrangement
A population of 120 DH lines derived from a cross between Cheongcheong and Nagdong (CNDH) was used in this study. This was conducted on the experimental farm of Kyungpook National University in 2013 and 2014. Thirty plants were planted in each row with 15 cm between plants within each row and 30 cm between rows. The parental lines of Cheongcheong and Nagdong were planted in ten plots as controls.
Phenotypic measurements
Grains were harvested from different replications and kept at room temperature for at least three months before testing. Brown rice was used in this study. Five yield-related trait including grain length, grain width, ratio of grain length to width, grain-thickness, and 1,000-grain weight were examined from twenty randomly selected unbroken rice grains. Grains of each DH lines and parents were lined up lengthwise along a vernier caliper (Mitutoyo, Kawasaki, Japan) to measure length, after which the grains were arranged in the breadth to measure the width and thickness. The values were averaged and used as the measurements of length, width and thickness of individual grains. The length width ratio of the grains was calculated as grain length divided by width, a measurement which reflects the shape of the grains. The weight of 1,000-grain weight was measured using the Electronic scale (Ohaus, Parsippany, NJ, USA). All experiments were replicated at least three times, and all data were analysed using the SPSS program (IBM SPSS Statistics ver. 22; IBM Co., Armonk, NY, USA).
Quantitative trait loci analysis
A genetic map consisting of 217 DNA markers was constructed using MAPMAKER/EXP ver. 3.0. Distances between the markers were presented in centiMorgans (cM) using the Kosambi function. The completed genetic map used by the Plant Molecular Breeding Laboratory at the school of Applied Biosciences in Kyungpook National University. To identify the putative QTLs, composite interval mapping was employed using WinQTL Cartographer 2.5. A logarithm of odds deviation (LOD) value of 3.0 was used as the significant threshold for claiming a QTL at
P<0.05. QTL mapper 1.6 was used to detect the main effects QTLs, epistatic interactions and their environmental interaction with a threshold of
P≤0.005. The QTLs locations identified in the current research were compared with previously reported QTLs affecting rice grain size and related traits using a genomic database. The markers prefixes RM were named according to
Temnykh et al. (2000;
2001). The whole genome spanned across 2,067.1 cM with an average interval of 9.5 cM. The frequency distribution and correlation coefficients of traits were analyzed using the SPSS program (IBM SPSS Statistics ver. 22).
RESULTS
Phenotypic evaluations
Phenotypic grain length and ratio of grain length to width of the female parent Cheongcheong were more than the male parent Nagdong for the two years. Grain length for Cheongcheong was 0.83 mm and 0.96 mm more than Nagdong in 2014 and 2013, respectively. Ration of grain length/width was 0.41 mm and 0.46 mm more than that of Nagdong for 2014 and 2013, respectively. The Cheong-cheong grain was significantly longer and heavier than that of Nagdong for the two years. Due to almost similar performance of grain width and grain-thickness, the heavier 1,000-grain weight of Cheongcheong grain was mainly raised by the longer grain length, as shown in
Table 1.
Among the DH population, the five traits exhibited wide variation with the mean values of performance nearly falling into the range between that of the two parents. All the five traits showed high broad heritability in both years. The phenotypic distributions for the five traits in DH population are shown in
Fig. 1. Trait distributions were normal distribution confirming quantitative inheritance of the traits studied.
Phenotypic values of the traits studied showed both significantly positive and negative correlations (
P<0.001) as shown in
Table 2. Highly significant correlations were observed between grain width and grain thickness (r=0.767
**, r=0.784
**) or the ratio of grain length to width (r=−0.811
**, r =−0.827
**) for the two years respectively. Grain weight showed significantly positive correlation to the grain width (r=0.583
**, r=0.558
**) and grain thickness (r=0.677
**, r=0.603
**), but negative correlation to the ratio of grain length to width (r=−0.110
**, r=−0.080), respectively for the two years. Negative correlations also existed in both grain length and grain thickness.
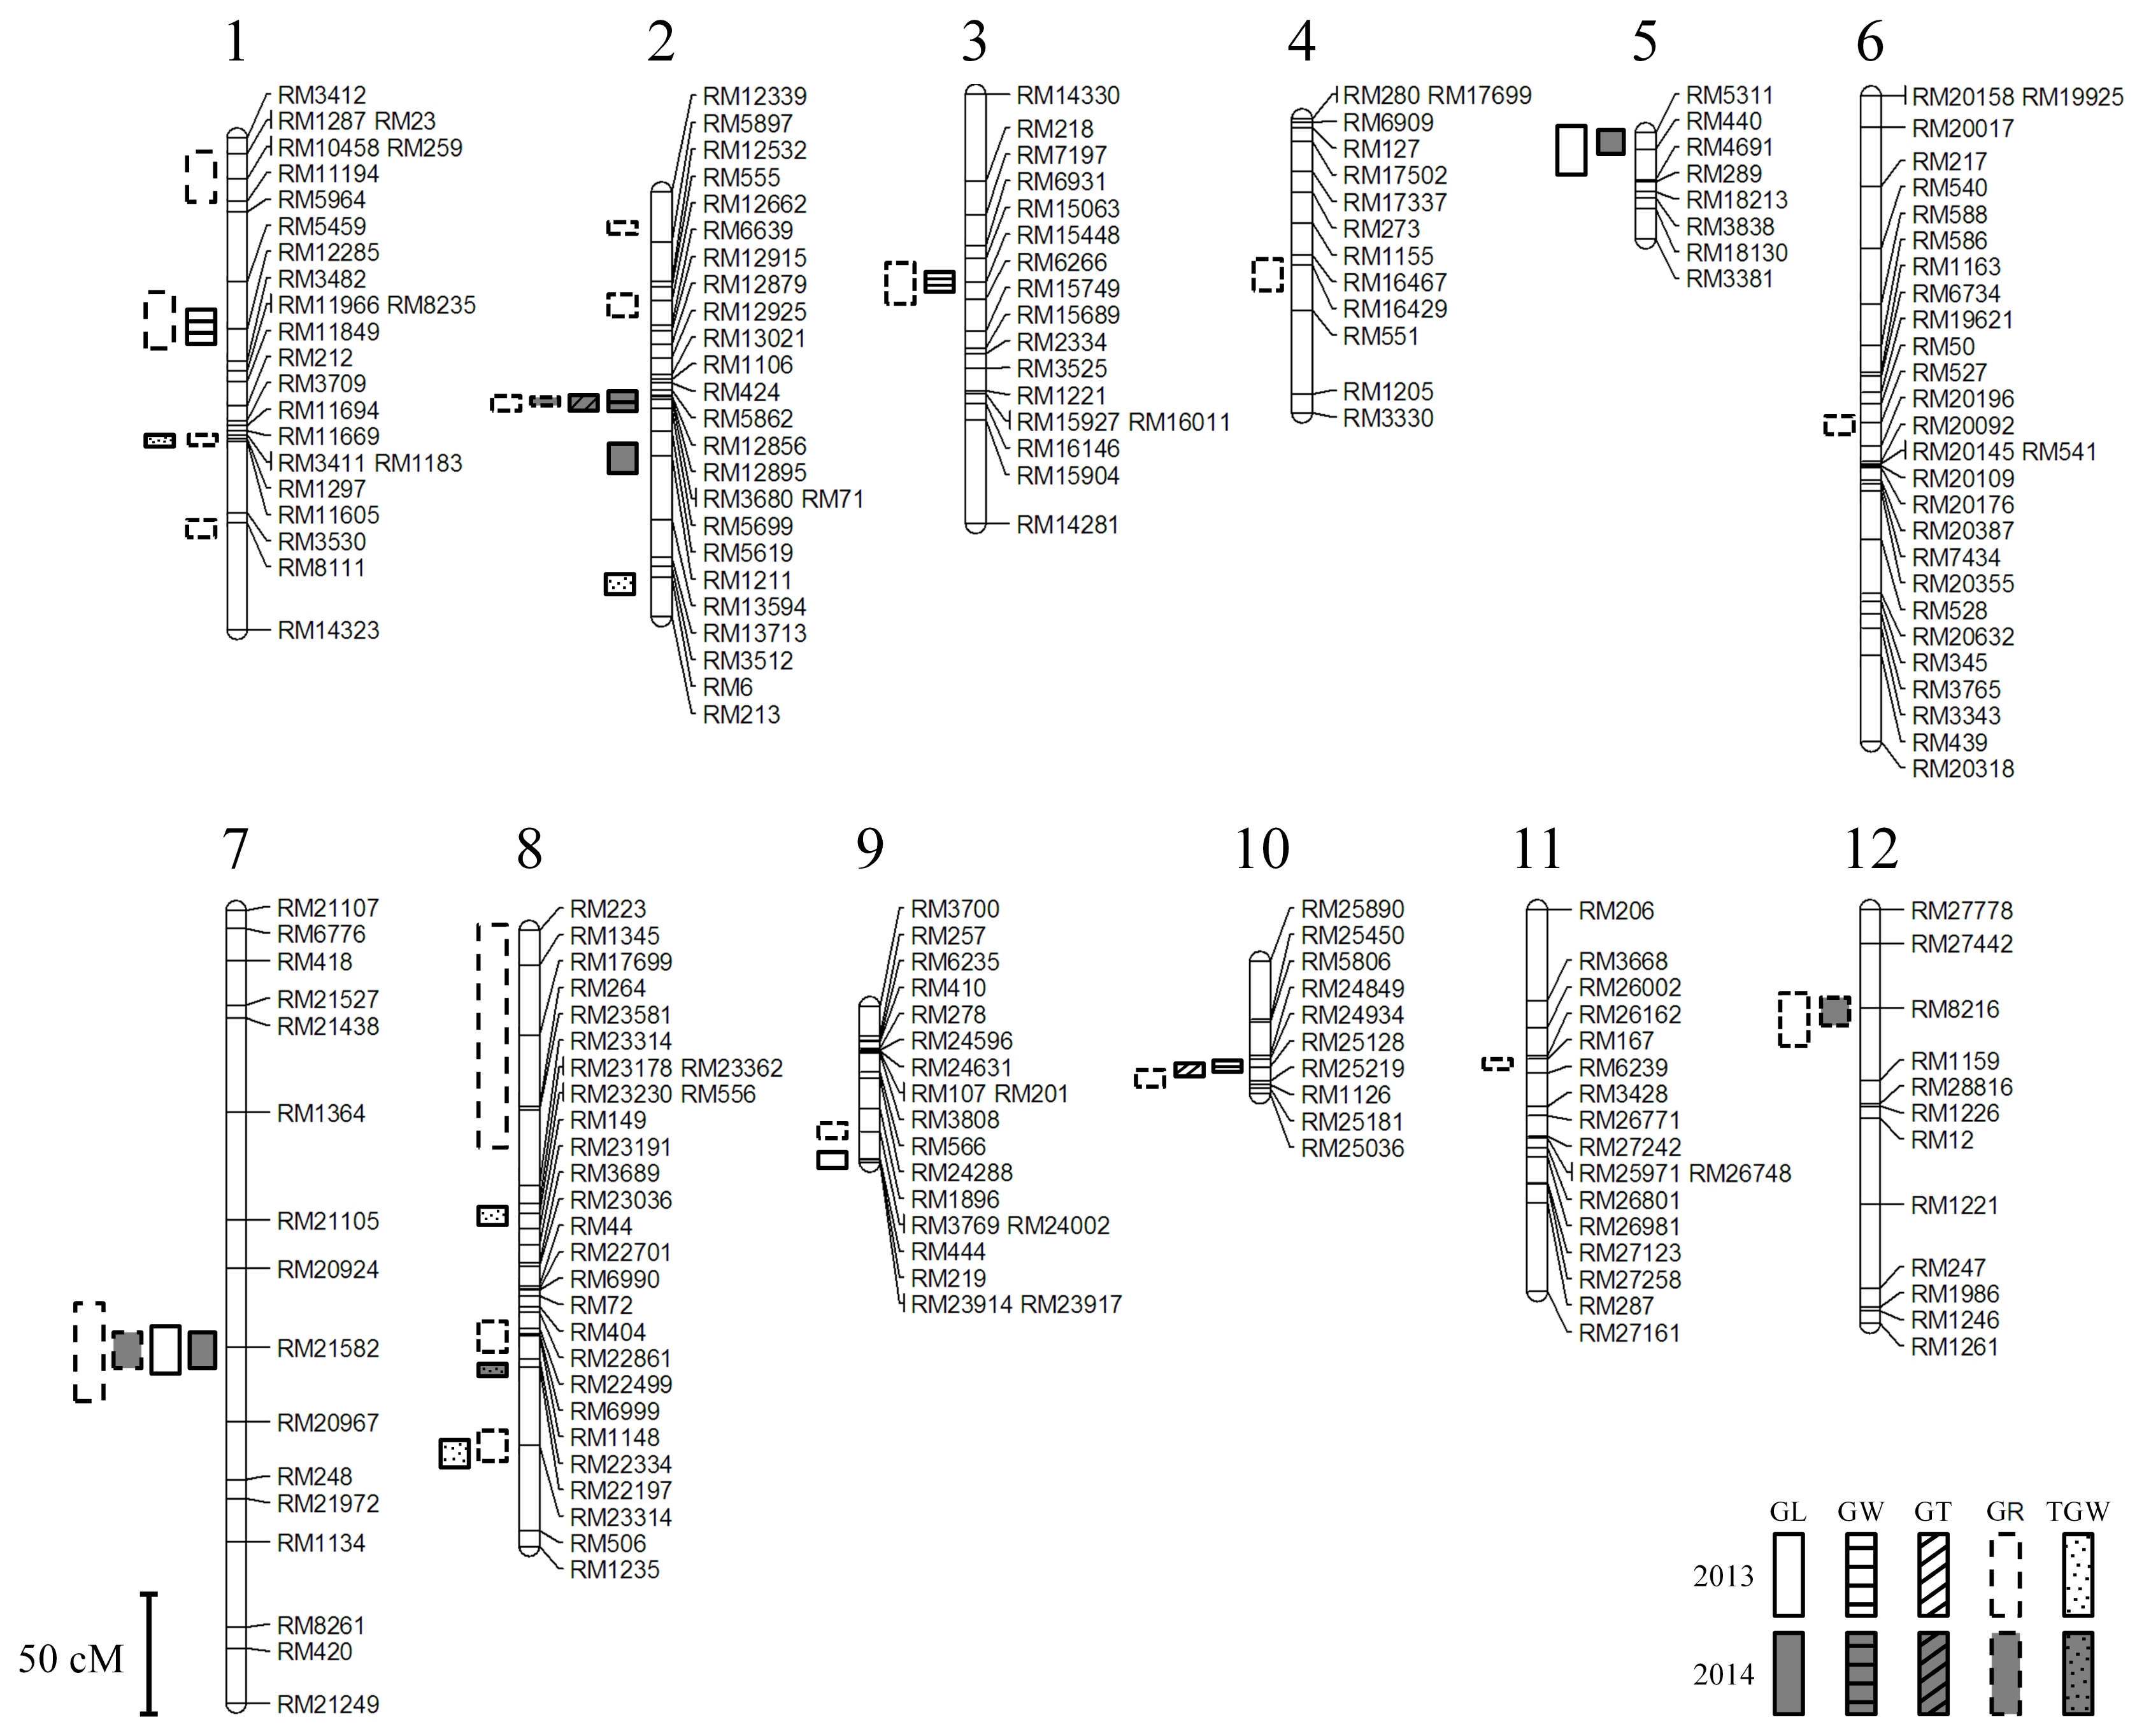
A linkage map of 217 SSR markers from 12 linkages groups was constructed (
Fig. 2).
A total of 24 QTLs affecting grain appearances were identified and mapped on all the twelve chromosomes (
Table 3), 47 QTLs were mapped in 2013 and 14 QTLs were mapped in 2014 (data not shown).
Among them five QTLs, qGR2, qGL7, qGR7, qGR12, and qTWG8, were located on the same regions of chromosomes under the two years. The Cheongcheong alleles contributed to 36 QTLs for grain length, ratio of length to width and thousand grain weight in 2013 whereas the remaining 11 QTLs were contributed by Nagdong alleles for grain width, weight, thickness, grain length and ratio of length to width. In 2014, Cheongcheong alleles contributed 8 QTLs for grain length and ratio of length to width whereas Nagdong alleles contributed to 6 QTLs for ratio of length to width and thousand grain weight (data not shown).
Grain length
Three QTLs; qGL2, qGL5, qGL7 were identified in 2014 for grain length at the regions RM1211 on chromosome 2, RM5311 on chromosome 5, RM21582 on chromosome 7 and qGL5, qGL7 and qGL9 (RM23914) were identified in 2013. Two QTLs, qGL5 and qGL7 were detected in both years at the same loci. The QTL located on chromosome 7 (qGL7) RM21582 showed the largest effect in 2014 with an LOD score of 5.18 and phenotypic variation of 55%, while in 2013, QTL located on chromosome 5 (qGL5) RM5311 showed the largest effect on the grain length, with an LOD of 10.11 and explaining 64% of the total phenotypic variation. Cheongcheong alleles showed increased effect on grain length for all the QTLs, (qGL2, qGL5, and qGL7) in both years except qGL9 whose Nagdong alleles increased the grain length effects.
Grain width
Three QTLs were mapped for the grain width, qGW1 (RM12285), qGW3 (RM15448), and qGW10 (RM24934) in 2013 and one QTL in 2014; qGW2 (RM12895). The additive effect of a single QTL ranged from 6% to 24%. In all the putative QTLs, alleles for increased grain width were from Nagdong. In 2014, all the three QTLs were detected on chromosome 2 with qGW2 (RM12895) showing the largest effect with an LOD score of 6.64, phenotypic variation of 31% and increasing additive effect of 24% from Nagdong allele. QTLs were detected on chromosome 1, 3, and 10. qGW3 (RM15448) on chromosome 3 showed the largest effect with an LOD score of 3.59, phenotypic variation of 55% and an increasing additive effect of 8% from Nagdong allele.
Grain thickness
Two QTLs were detected for grain-thickness, qGT2 and qGT10, on chromosome 2 and 10 in 2014 and 2013 respectively. Both QTLs had an LOD score of 3.36, additive effect of 4% and phenotypic variations of 33%. They both showed increased effect from Nagdong alleles.
Ratio of grain length/width
Eleven QTLs were identified for the ratio of grain length to width on all the chromosomes expect chromosome 5. Ten of them showed increased effect from Cheongcheong alleles and the remaining one showed increased effect from Nagdong alleles. These QTLs were detected 11 chromosome with an LOD score ranging from 3.34 to 49.33 and additive effects ranging from 4% to 22%. One QTL was detected on chromosome 4 with an LOD score of 3.34 and an additive effect of 4% from Nagdong allele with phenotypic variation of 61% in. One QTL was detected on chromosome 7 for both years at RM21582, its additive increasing effect was from Cheongcheong allele. qGR10 and qGR11 were detected on chromosomes 10 and 11 respectively in 2013 and they both showed increasing effect from Cheongcheong allele. QTL qGR12 (RM8216) was detected in both years with an additive increasing effect from Cheongcheong allele. Three QTLs showed increased effects from Cheongcheong allele and one from Nagdong allele. qGR2 (RM12895), qGR7 (RM21582), and qGR12 (RM8216) were repeatedly detected across the two years.
One thousand-grain weight
Three QTLs were mapped for 1,000-grain weight, consisting of one QTL identified in both years and three QTLs only in 2013 and 2014. A QTL qTGW8 detected for two years was located on chromosome 8 at RM23230 at an average LOD value of 4.04 and 3.15 for 2013 and 2014 respectively. The qTGW1, and qTGW2 were mapped on chromosome 1, and 2 with LOD scores of 4.23, 3.94 and phenotypic variations of 48%, 45%, respectively. qTGW2 and qTGW8 showed increased additive effect from Cheongcheong allele and qTGW1 from Nagdong allele.
DISCUSSION
Grain shape is the main attribute that determine the appearance quality of the rice grains. Rice grain shape or size is highly correlated with yield and appearance quality. The present study has characterized the genetic bases of the five studied QTLs traits which are related to the appearance quality of rice grains using populations from a cross between the parents Cheongcheong and Nagdong. In this study a total of 24 QTLs affecting grain appearances were identified and mapped on all the twelve chromosomes, 47 QTLs were mapped in 2013 and 14 QTLs were mapped in 2014. Five of the 24 QTLs were reproducibly detected in two year trials. The number of QTLs per trait identified in the present study ranged from one to six except for ratio of grain length to width which exhibited a total of 11 QTLs from eleven chromosomes in both years. When two or more QTLs were found for the same trait, alleles with similar effect either increasing or decreasing at all loci could be present in the two parents in two different ways: dispersed (one parent having increasing allele at some loci but decreasing allele at others and vice versa for the other parent;
Xu et al. 2002) or associated (one parent having all increasing alleles and the other having all decreasing alleles.) Allele association resulted in significant differences between the parents. For instance, all the alleles from Cheongcheong at three QTLs of grain width had decreasing effects, whereas all the alleles from Cheongcheong at three QTLs of grain length loci in 2014 had increasing effects. As a result a significant phenotypic difference was found between the two parents for these two traits. In contrast three and eleven QTLs were found for 1,000-grain weight and ratio of grain length to width respectively and cumulatively they exhibited high phenotypic variations; however QTLs alleles with increasing effects at these loci were dispersed between the two parents. The increasing and decreasing allelic effects from each parent counteracted each other, resulting in no significant difference between the parents. This has been supported by the fact that numerous QTLs have been identified using two parents without a significant phenotypic difference (
Xu et al. 2002). The major QTLs for grain length in this study were mapped at chromosome 5 and 7 in both years. QTL of grain length were commonly located on the chromosome 1 to 8 and 10 in the earlier researches using different mapping population consisting of RIL from a cross Zhenshan97/Shanyou63 or Lemont/Teqing or Zhenshan97/Mighui63 or Asominori/IR24 (
Tan et al. 2000;
Xu et al. 2004;
Ge et al. 2005;
Wan et al. 2005;
Zheng et al. 2007).
Rabiei et al. (2004) reported a QTL of
qgl2 flanked by RM434 and RM341,
qGL2 was also mapped at RM1211 in this study.
Tan et al (2000) earlier identified QTL on chromosome 7 that affected grain length. Further the locus identified on chromosome 7 in this study
qGL7 (RM21582) was found to be different locus compared to the earlier mapped. The QTLs of grain width located on chromosome 2 had been reported in earlier researches. For
qwi2.1 and
qwi2.2,
Rabiei et al. (2004) and
Xu et al. (2004) had identified the same chromosomal regions as identified in the present study. The
qgw2-2 averagely explaining 31% of phenotype variation with increasing effect from Nagdong, was regarded as a major QTL which could be useful in marker assisted selection.
Zhang et al. (2004) presented two QTLs,
qgw-2a and qgw-2b in the intervals of GA120-G357 and CT565-RG171, which were detected in two different environmental conditions with higher LOD values and contributions of phenotype variation explained. It is however difficult to confirm whether those two QTLs were located on the same position as
qgw2-1 and qgw2-2. QTLs qgw1 and qgw10 were new loci associated with grain width that were detected in the present study in the year 2013 trial. QTLs for grain thickness have already been mapped on eleven chromosomes except chromosome 7 (
Yoshinda et al. 2002;
Xu et al. 2004;
Jiang et al. 2005;
Zheng et al. 2007). In this study two QTLs were identified on chromosome 2 and 10 in 2014 and 2013 respectively and they both had an increasing effect from Nagdong. Detection of a major QTL controlling grain-thickness on chromosome 2 by several researchers was found to be similar to
qGT2 locus at RM12895, suggesting that it is important and prevalence in other populations. Twenty-four QTLs were identified for the ratio of ratio of grain length to width on all the chromosomes expect chromosome 5 in 2013 and six QTLs on chromosomes 2, 7, and 12 in 2014. Five QTLs were reproducibly repeated over the two years of the study. The highest LOD achieved in 2013 was 49.33 which was detected on RM 12895 on chromosome 2 (qGR2). This indicates that the markers in 2013 were more precise and these markers can be used in identifying the marker gene. There was a large difference on the number of QTLs of ratio of grain length to ratio identified in the two years; this again might have been caused by difference in various environmental conditions experienced like weather, soil aeration, soil nutrition etc.
Several QTLs associated with the ratio of length to width have been reported earlier.
Yan et al. (2003) reported a major QTL for length and width ratio on chromosome 7 and minor QTLs on chromosomes 2 and 6. However in this study, major QTLs were detected on chromosome 2 in both years. Ratio of grain length to width was mostly controlled by loci on chromosomes 2 and 7 that coincided with the most QTLs identified for width and length. Three QTLs were mapped for 1,000-grain weight; consisting of one QTL identified in both years and two QTLs only in 2013. The major QTL was detected on chromosome 8 in 2014 accounting for 31% of the total phenotypic variation. In 2013,
qtgw1 was the major one with an LOD of 4.23 and a total phenotypic variation of 48%. The QTL identified by
Redoña and Mackill (1998) on chromosome 8 might be allelic to a locus near RM23230 in this study. However other QTLs by
Redoña and Mackill (1998),
Xiao et al. (1996), and
Lin et al. (1996) on chromosome 4 were not associated with any of the markers detected. QTLs detected on chromosome 3 were found to affect four traits of the five investigated traits namely; grain width, ratio of grain length to width, grain-thickness, and 1,000-grain weight (
Yan et al. 2014). In this study, the QTLs around chromosome 2 pleitropically affected four of the five investigated traits namely; grain length, grain width, grain-thickness, and ratio of grain length to width. This explains that marker aided introgression of this QTL can be used in developing genetic backgrouds in rice breedind for these traits. Transgressive segregates were observed for all the traits examined in the current study (
Fig. 1). For those traits in which two or more significant QTLs were detected, both parents were found to possess QTL alleles which increased phenotypic values (
Table 3). The occurrence of such transgerssion could be directly associated with the inheritance of complementary QTL alleles from the two parents. For example four significant QTLs were detected for grain length, Cheongcheong allelles were associated with an increase in grain length at three of the four QTLs and Nagdong alleles on the other remaining one. As demostrated by
Veldboom and Lee (1994), correlated traits often have QTLs mapping on the same chromosomal locations. The same trend was observed in the current study, for example, grain length and ratio of grain length to width were highly correlated (r=0.864 and 0.859 in 2014 and 2013, respectively) and had one QTL with large effects which were found at the same map locations. grain width and ratio of grain length to width showed highly negative correlation (r=−0.811 and r=−0.827 for 2014 and 2013, respectively) and each had three similar QTLs in similar locations. In this case, the QTLs acting on both traits had opposite effects. This study identified several QTLs from both parents that control the size and shape of rice grains. Marker aided introgression of these QTLs into desired genetic backgrounds would be a more effective approach in breeding for these traits in rice. The results presented in the present study should facilitate rice breeding, especially for improved hybrid rice quality.
ACKNOWLEGEMENTS
This work was supported by a grant from the Next-Generation BioGreen21 Program (No. PJ011257012016), Rural Development Administration, Republic of Korea.
Fig. 1Frequency distributions of five traits associated with grain appearance in Cheongcheong/Nagdong doubled haploid population. ‘C’ and ‘N’ indicate mean values of Cheongcheong and Nagdong in 2013 and 2014, respectively.
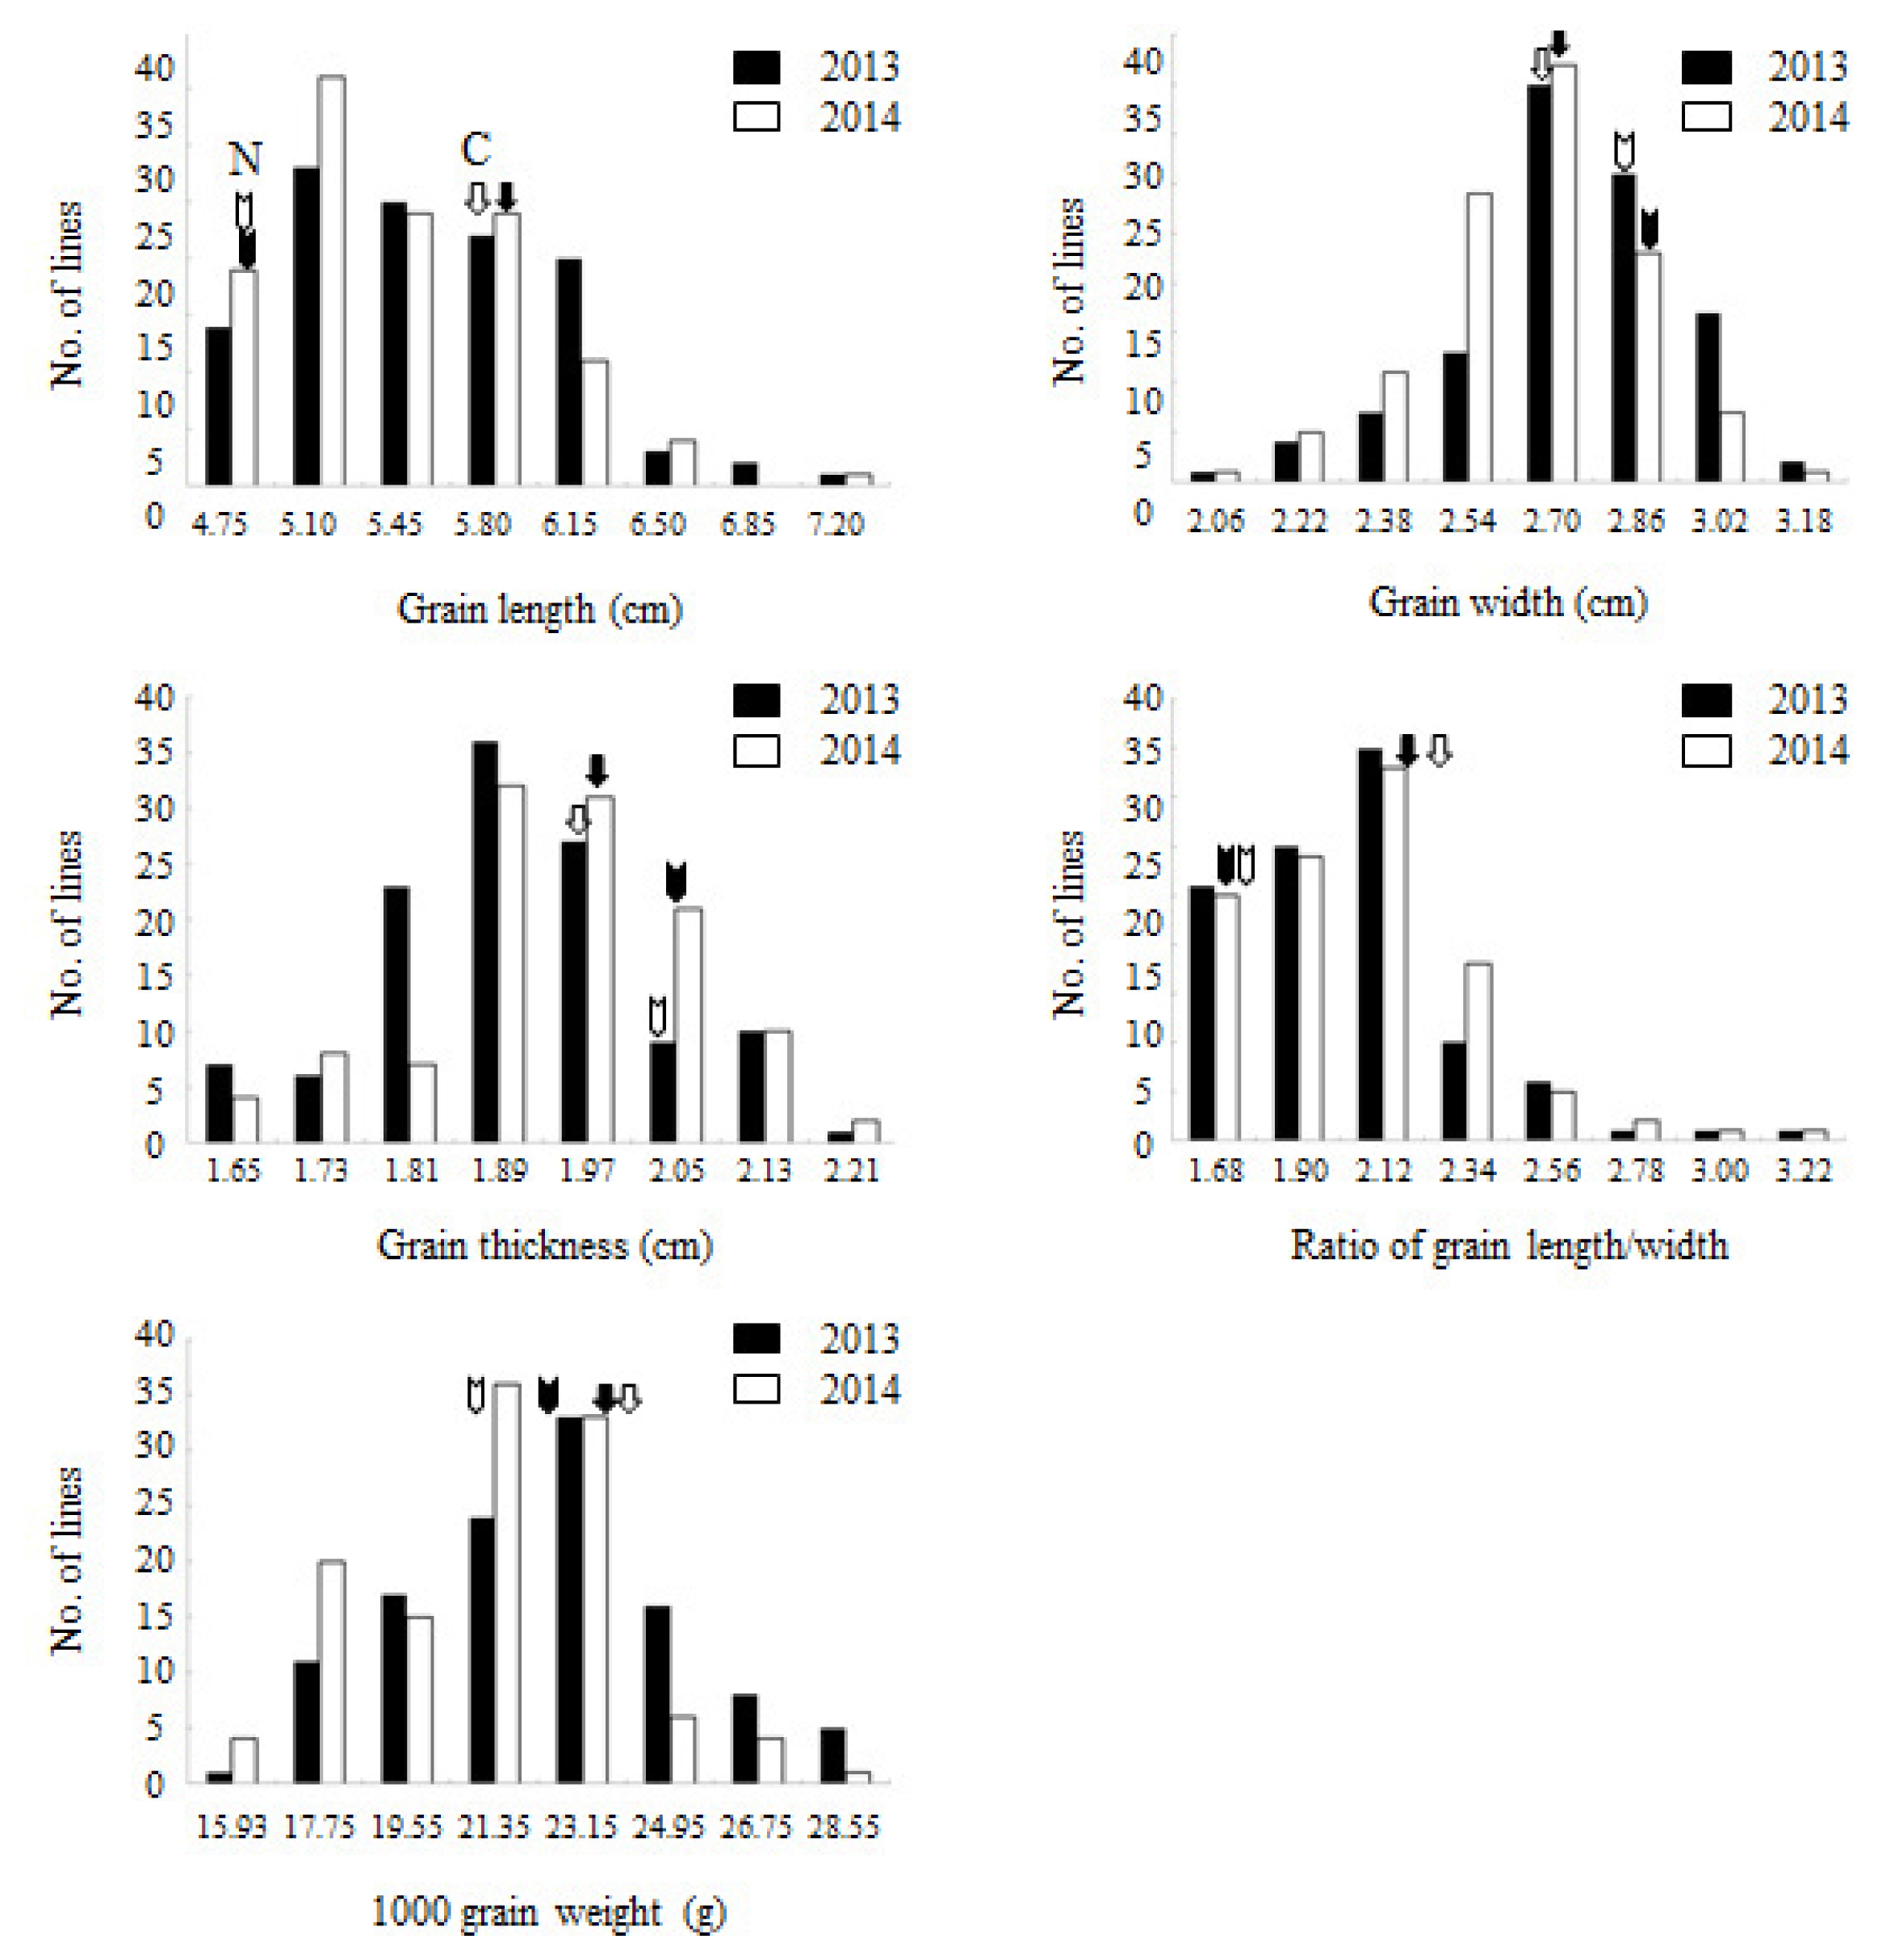
Fig. 2The genetic regions associated with the grain length for 2 years in Cheongcheong/Nagdong doubled haploid. cM: centiMorgans, GL: grain length, GW: grain width, GT: grain thickness, GR: Ratio of grain length/width, TGW: 1,000-grain weight.

Table 1The grain phenotypes of 120 DH lines from a cross of Cheongcheong and Nagdong.
Table 1
|
Grain trait |
Year |
Parent |
DHz) population |
|
|
|
Cheongcheong |
Nagdong |
Range |
Mean |
Heritability |
|
Grain length (mm) |
2014 |
5.74±0.15 |
4.91±0.09 |
4.27–7.26 |
5.41±0.18 |
98.0 |
|
2013 |
5.88±0.14 |
4.92±0.12 |
4.75–7.37 |
5.31±0.16 |
100.0 |
|
Grain width (mm) |
2014 |
2.66±0.15 |
2.80±0.09 |
2.14–3.05 |
2.66±0.11 |
100.0 |
|
2013 |
2.71±0.07 |
2.87±0.07 |
2.12–3.15 |
2.74±0.09 |
99.4 |
|
Grain thickness (mm) |
2014 |
1.96±0.07 |
2.00±0.10 |
1.61–2.19 |
1.90±0.09 |
95.0 |
|
2013 |
1.99±0.06 |
2.04±0.05 |
1.65–2.22 |
1.94±0.08 |
98.2 |
|
Ratio of length to width (%) |
2014 |
2.16±1.63 |
1.75±1.49 |
1.59–3.32 |
2.05±1.93 |
99.5 |
|
2013 |
2.17±0.02 |
1.71±0.54 |
1.57–3.17 |
2.04±1.76 |
97.8 |
|
Grain weight (g) |
2014 |
23.50±0.41 |
21.00±1.26 |
15.00–26.50 |
20.94±3.13 |
94.0 |
|
2013 |
23.83±0.29 |
22.0±0.50 |
29.50–16.50 |
22.37±2.86 |
100.0 |
Table 2Correlation analysis among five grain traits of 120 DH lines from CNDH from a cross Cheongcheong and Nagdong.
Table 2
|
Grain trait |
GLz)
|
GW |
GT |
GR |
TGW |
|
|
|
|
|
|
2014 |
2013 |
2014 |
2013 |
2014 |
2013 |
2014 |
2013 |
2014 |
2013 |
|
GL |
1.00 |
1.00 |
|
|
|
|
|
|
|
|
|
GW |
−0.425**
|
0.441**
|
1.00 |
1.00 |
|
|
|
|
|
|
|
GT |
−0.255**
|
0.337**
|
0.767**
|
0.784**
|
1.00 |
1.00 |
|
|
|
|
|
GR |
0.864**
|
0.859**
|
−0.811**
|
0.827**
|
−0.563**
|
−0.632**
|
1.00 |
1.00 |
|
|
|
TGW |
0.317**
|
0.367**
|
0.583**
|
0.558**
|
0.677**
|
0.603**
|
−0.110 |
−0.080 |
1.00 |
1.00 |
Table 3The main effect quantitative trait loci (QTLs) of the grain appearance for 2 years in Cheongcheong/Nagdong doubled haploid population.
Table 3
|
Characteristic |
QTLs |
Chromosome |
Peak closed markerz)
|
LODy)
|
Add (%)x)
|
R2 (%)w)
|
Increasingv) effect |
|
Grain length |
qGL2 |
2 |
RM1211 |
3.17 |
17 |
50 |
Cheongcheong |
|
qGL5 |
5 |
RM5311 |
10.11 |
24 |
64 |
Cheongcheong |
|
qGL7 |
7 |
RM21582 |
7.86 |
21 |
63 |
Cheongcheong |
|
qGL9 |
9 |
RM23914 |
3.34 |
−13 |
62 |
Nagdong |
|
Grain width |
qGW1 |
1 |
RM12285 |
3.44 |
−7 |
50 |
Nagdong |
|
qGW2 |
2 |
RM12895 |
6.64 |
−24 |
−31 |
Nagdong |
|
qGW3 |
3 |
RM15448 |
3.59 |
−8 |
55 |
Nagdong |
|
qGW10 |
10 |
RM24934 |
3.01 |
−6 |
51 |
Nagdong |
|
Grain thickness |
qGT2 |
2 |
RM12895 |
3.36 |
−4 |
−33 |
Nagdong |
|
qGT10 |
10 |
RM12895 |
3.36 |
−4 |
33 |
Nagdong |
|
Ratio of grain length/width |
qGR1 |
1 |
RM12285 |
6.39 |
9 |
68 |
Cheongcheong |
|
qGR2 |
2 |
RM12895 |
49.33 |
22 |
69 |
Cheongcheong |
|
qGR3 |
3 |
RM15063 |
12.84 |
11 |
69 |
Cheongcheong |
|
qGR4 |
4 |
RM16429 |
3.34 |
−4 |
61 |
Nagdong |
|
qGR6 |
6 |
RM527 |
3.53 |
4 |
63 |
Cheongcheong |
|
qGR7 |
7 |
RM21582 |
16.15 |
8 |
61 |
Cheongcheong |
|
qGR8 |
8 |
RM223 |
11.49 |
9 |
68 |
Cheongcheong |
|
qGR9 |
9 |
RM24002 |
3.45 |
6 |
62 |
Cheongcheong |
|
qGR10 |
10 |
RM25128 |
5.50 |
5 |
63 |
Cheongcheong |
|
qGR11 |
11 |
RM167 |
6.96 |
5 |
63 |
Cheongcheong |
|
qGR12 |
12 |
RM8216 |
7.72 |
6 |
63 |
Cheongcheong |
|
Thousand grain weight |
qTGW1 |
1 |
RM1297 |
4.23 |
−1.07 |
48 |
Nagdong |
|
qTGW2 |
2 |
RM6 |
3.94 |
1.0 |
45 |
Cheongcheong |
|
qTGW8 |
8 |
RM23230 |
4.04 |
0.99 |
41 |
Cheongcheong |
References
- Cho YG, Kang HJ, Lee YT, Jong SK, Eun MY, McCouch SR. 2010. Identification of quantitative trait loci for physical and chemical properties of rice grain. Plant Biotechnol Rep. 4: 61-73.
- Ge XJ, Xing YZ, Xu CG, He YQ. 2005. QTL analysis of cooked rice grain elongation, volume expansion, and water absorption using a recombinant inbred population. Plant Breed. 124: 121-126.
- He P, Li SG, Qian Q, Ma YQ, Li JZ, Wang WM, et al. 1999. Genetic analysis of rice grain quality. Theor Appl Genet. 98: 502-508.
- Huang R, Jiang L, Zheng J, Wang T, Wang H, Huang Y, et al. 2013. Genetic bases of rice grain shape: so many genes, so little known. Trends Plant Sci. 18: 218-226.
- Jiang GH, Hong XY, Xu CG, Li XH, He YQ. 2005. Identification of quantitative trait loci for grain appearance and milling quality using a double-haploid rice population. J Integr Plant Biol. 47: 1391-1403.
- Juliano BO, Perez CM, Kaosa-Ard M. 1990. Grain quality characteristics of export rices in selected markets. Cereal Chem. 67: 192-197.
- Juliano BO, Villareal CP. 1993. Grain quality evaluation of world rice. International Rice Research Institute. Manila, Philippines.
- Khush GS. 2004. Harnessing science and technology for sustainable rice-based production systems. In: Proc. of the FAO rice conference; International Rice Conference; Plant Production and Protection Div, Rome, Italy. pp 17-23.
- Lin HX, Qian HR, Zhuang JY, Lu J, Min SK, Xiong ZM, et al. 1996. RFLP mapping of QTLs for yield and related characters in rice (Oryza sativa L.). Theor Appl Genet. 92: 920-927.
- Qin Y, Kim SM, Sohn JK. 2008. Detection of main-effect QTLs, epistatic QTLs and QE interactions for grain appearance of brown rice (Oryza sativa L.). J Crop Sci Biotech. 11: 151-156.
- Rabiei B, Valizadeh M, Ghareyazie B, Moghaddam M, Ali AJ. 2004. Identification of QTLs for rice grain size and shape of Iranian cultivars using SSR markers. Euphytica. 137: 325-332.
- Redoña ED, Mackill DJ. 1998. Quantitative trait locus analysis for rice panicle and grain characteristics. Theor Appl Genet. 96: 957-963.
- Tan YF, Xing YZ, Li JX, Yu SB, Xu CG, Zhang Q. 2000. Genetic bases of appearance quality of rice grains in Shanyou 63, an elite rice hybrid. Theor Appl Genet. 101: 823-829.
- Temnykh S, DeClerck G, Lukashova A, Lipovich L, Cartinhour S, McCouch S. 2001. Computational and experimental analysis of microsatellites in rice (Oryza sativa L.): frequency, length variation, transposon associations, and genetic marker potential. Genome Res. 11: 1441-1452.
- Temnykh S, Park WD, Ayres N, Cartinhour S, Hauck N, Lipovich L, et al. 2000. Mapping and genome organization of microsatellite sequences in rice (Oryza sativa L.). Theor Appl Genet. 100: 697-712.
- Veldboom LR, Lee M. 1994. Molecular-marker-facilitated studies of morphological traits in maize. II: Determination of QTLs for grain yield and yield components. Theor Appl Genet. 89: 451-458.
- Wan XY, Wan JM, Weng JF, Jiang L, Bi JC, Wang CM, et al. 2005. Stability of QTLs for rice grain dimension and endosperm chalkiness characteristics across eight environments. Theor Appl Genet. 110: 1334-1346.
- Xiao J, Li J, Yuan L, Tanksley SD. 1996. Identification of QTLs affecting traits of agronomic importance in a recombinant inbred population derived from a subspecific rice cross. Theor Appl Genet. 92: 230-244.
- Xu JL, Yu SB, Luo LJ, Zhong DB, Mei HW, Li ZK. 2004. Molecular dissections of the primary sink size and its related traits in rice. Plant Breed. 123: 43-50.
- Xu JL, Xue QZ, Luo LJ, Li ZK. 2002. Genetic dissection of grain weight and its related traits in rice (Oryza sativa L.). Chinese J Rice Sci. 16: 6-10.
- Yan B, Liu R, Li Y, Wang Y, Gao G, Zhang Q, et al. 2014. QTL analysis on rice grain appearance quality, as exemplifying the typical events of transgenic or backcrossing breeding. Breed Sci. 64: 231-239.
- Yan CJ, Liang GH, Chen F, Li X, Tang SZ, Yi CD, et al. 2003. Mapping quantitative trait loci associated with rice grain shape based on an indica/japonica backcross population. Yi Chuan Xue Bao. 30: 711-716.
- Yoshida S, Ikegami M, Kuze J, Sawada K, Hashimoto Z, Ishii T, et al. 2002. QTL analysis for plant characters of sake-brewing rice using a double haploid population. Breed Sci. 52: 309-317.
- Zhang GH, Zhang GP, Qian Q, Xu LP, Zeng DL, Teng S, et al. 2004. QTL analysis of grain shape traits in different environments. Chin J Rice Sci. 18: 16-22.
- Zheng TQ, Xu JL, Li ZK, Zhai HQ, Wan JM. 2007. Genomic regions associated with milling quality and grain shape identified in a set of random introgression lines of rice. Plant Breed. 126: 158-163.