Abstract
The genus Brassica is an important resource for major agricultural products such as oils, vegetable and fodder. The Brassiceae tribe-specific whole-genome triplication that occurred ~15.9 million years ago influenced the speciation and morphological diversification that has been exploited in agriculture, making Brassica an excellent model system for studying polyploidization-mediated evolution. Genome sequencing and comparative genome analysis have revealed conserved structures and uncovered the genome evolution of Brassica species. While chromosome shuffling and asymmetric subgenome gene retention are widely reported in Brassica species, limited information is available about the dynamics of repetitive elements (REs), which are central to epigenetic mechanisms and thus play a pivotal role in plant genome adaptation and evolution. The assembled reference genome sequences of B. rapa (AA) and B. oleracea (CC), and their derived allotetraploid, B. napus (AACC), cover 58%, 86%, and 75% of their respective estimated genome sizes. The remaining non-assembled genome portions vary between these three genome sequences, and the major components remain hidden in each genome. Here, we review the dynamics of the major Brassica repeats that have played roles in speciation of the AA, CC, and AACC genomes. We show that 10 major Brassica repeats appear to occupy more than 50% of each respective unassembled genome sequence, yet represent less than 1% of assembled reference genome sequences. We have estimated their genome proportions using whole-genome Illumina reads and cytogenetic analyses in an attempt to understand the role of these repeats in genome evolution.
-
Key words: Brassica, Whole-genome sequence, Repeatomics, Evolution, Fluorescence in situ hybridization, Polyploidy
INTRODUCTION
About 39 species and numerous morphologically distinct varieties comprise the genus
Brassica (
http://www.theplantlist.org/tpl1.1/search?q=brassica). While many are considered weeds, three diploids (
B. rapa, AA;
B. nigra, BB; and
B. oleracea, CC) and three allotetraploids (
B. juncea, AABB;
B. carinata, BBCC; and
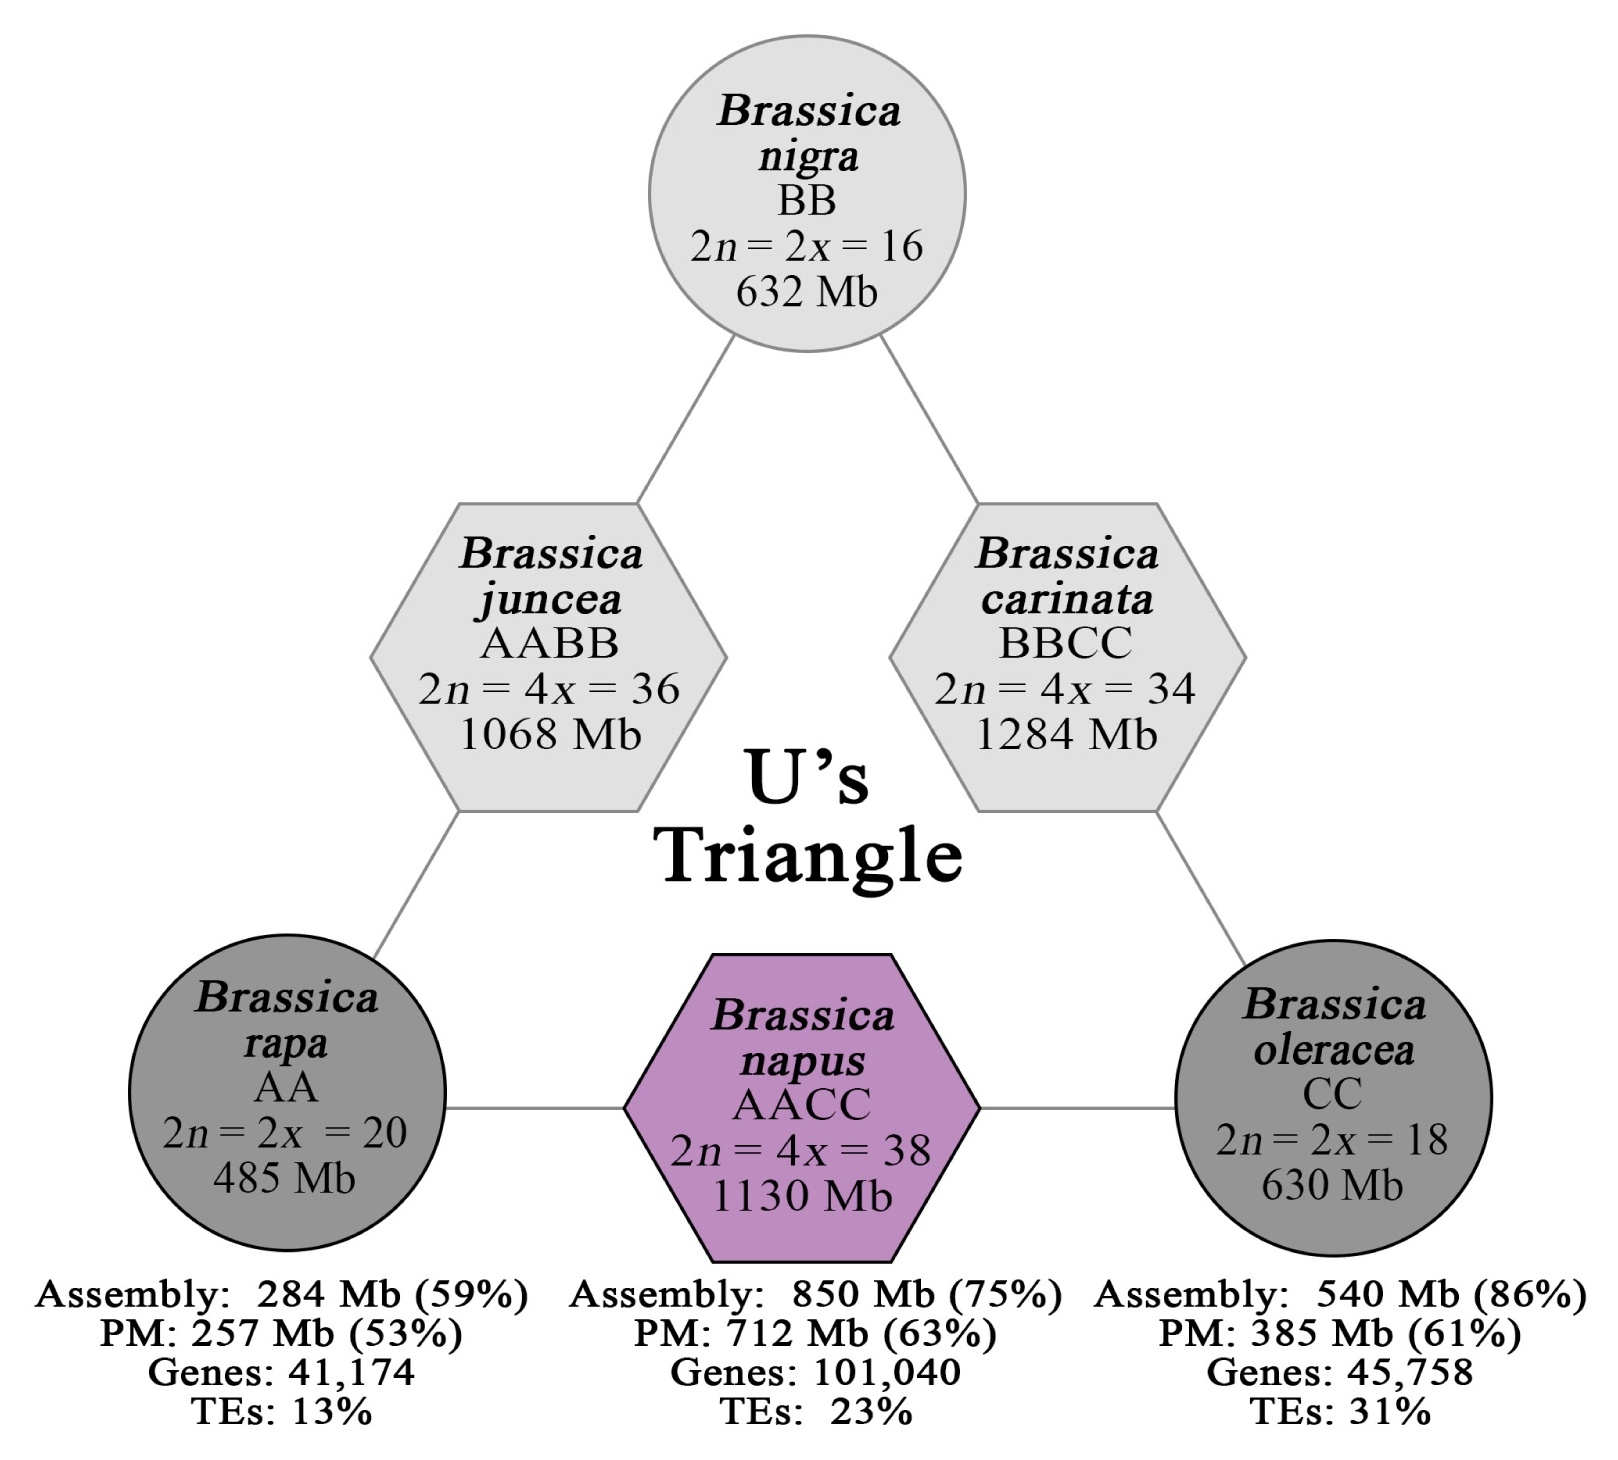
B. napus, AACC) comprising the U’s triangle (
Fig. 1), receive more attention owing to their economic impact as sources of vegetable, condiments, fodder, and oil (
Nagaharu 1935;
Cheng et al. 2015a).
The genomes of the three diploid species are highly syntenic and can be traced back to a whole-genome triplication (WGT) event after the divergence of the tribe Brassiceae and
Arabidopsis lineages (
Fig. 2) (
Lysak et al. 2005;
Panjabi et al. 2008;
Cheng et al. 2015a). However, several rounds of genomic rearrangements and re-diploidization have resulted in genomic downsizing and several chromosome fission/fusion events, leading to the current states of 2
n=20, 2
n=16, and 2
n=18 in the extant AA, BB, and CC genomes, respectively. This conclusion has been supported by the observation of more rapid chromosomal evolution in
Brassica genomes than in animals and other plants (
Lagercrantz 1998).
In addition to biased gene loss, genomic data have revealed that the fluctuating total genomic content of REs has influenced the reduction/amplification of the genome sizes of these three species (
Wang et al. 2011b;
Navabi et al. 2013;
Chalhoub et al. 2014;
Liu et al. 2014). REs are actively involved in shaping these genomes. In fact, they play roles in the formation of subgenome dominance in
B. rapa (
Cheng et al. 2015b) and are central to the epigenetic mechanisms that maintain cellular homeostasis (
Fedoroff 2012).
Despite their importance, REs are often responsible for bottlenecks in the genome assembly of short whole-genome sequence (WGS) reads. Most plant genome assemblies reported so far cover the euchromatic or non-repetitive fractions, leaving the repetitive fractions relatively unassembled (
Michael and Jackson 2013). This situation arises not because there is little interest in the repetitive fractions, but rather due to the difficulty of anchoring REs into assemblies because of limitations inherent in current sequencing technologies and assembly algorithms (
Pop 2009;
VanBuren et al. 2015). Along with polyploidy, REs greatly influence the quality of genome assemblies and ultimately the generation of high-resolution pseudo-molecules (
Michael and Jackson 2013). Consequently, densely heterochromatic regions such as the centromere and peri-centromere are rarely represented in assemblies, even for model plants such as rice and
Arabidopsis (
Gao et al. 2015).
The release of the AA, CC, and AACC reference genomes has provided a foundation for deeper understanding of the dynamics of Brassica REs through comparative studies. Moreover, the presence of inter-crossing species, numerous morphological variants within each species, and a relatively recent WGT make Brassica an excellent model system for studying polyploid evolution.
The aim of this review is to focus on the utility of WGS data in understanding the roles of REs in the evolution of the AA, CC, and AACC
Brassica genomes. We survey the abundance, distribution, diversity, and dynamics of the 10 major
Brassica repeats in the AA, CC, and AACC
Brassica genomes (
Table 1). We discuss how the tribe Brassiceae-specific WGT could have affected these features, and how they could have contributed to the diversification of
Brassica species and morphotypes during evolution.
EVOLUTIONARY HISTORIES OF THE AA, CC, AND AACC Brassica GENOMES
Whole-genome duplications (WGDs), regarded as drivers of speciation, can promote (but not cause) increased diversification (
Tank et al. 2015). Like most extant angiosperm species, the
Brassica AA, CC, and AACC genomes have undergone numerous cycles of genome expansion and contraction through segmental or WGDs, followed by genome downsizing (
Bowers et al. 2003;
Yang et al. 2006;
Barker et al. 2009). These cycles are stimulated by environmental stresses, natural hybridization, or artificial selection (
Kalendar et al. 2000;
Fedoroff 2012;
Cheng et al. 2015b). Often, large DNA segments – even whole chromosomes – are lost during this process (
Koo and Jiang 2008). Extant species like
B. rapa,
B. oleracea, and
B. napus are therefore survivors of several great genomic struggles.
An ancient γ WGT, and β and α WGD, is shared by many eudicots and
Brassica species, but a more recent and tribe Brassiceae-specific WGT has greatly influenced the diversification of genomes of the extant
Brassica species (
Fig. 2). Although estimates differ for genome duplication events and species divergence times (
Lysak et al. 2005;
Bell et al. 2010;
Jiao et al. 2012), a 2014 study estimated that this WGT occurred around 15.9 million years ago (
Liu et al. 2014), after the split of the tribe Brassiceae from
Arabidopsis (
Lysak et al. 2005;
Yang et al. 2006). Comparison of the
Brassica diploid genomes to that of
Arabidopsis revealed 24 common syntenic genomic blocks (GBs) named A–X, which are triplicated (72 GBs) in the
Brassica diploid genomes (
Cheng et al. 2015a). Comparative analysis of orthologous genes in these GBs showed that the BB genome is more distantly related to AA or CC genomes. This was further corroborated by the discovery of a major chromosomal rearrangement in the BB genome (
Navabi et al. 2013).
Despite several potential WGT scenarios, the generally accepted hypothesis involves a two-step triplication similar to that explaining the evolution of hexaploid wheat (
Liu et al. 2009;
Cheng et al. 2015c). In this process, a diploid ancestral genome with seven chromosomes, known as translocation Proto-Calepineae Karyotype (tPCK), likely hybridized via an allopolyploidization event to form a tetraploid with subgenomes, referred to as medium fractionated (MF
1) and most fractionated (MF
2) (
Cheng et al. 2012;
Tang et al. 2012;
Cheng et al. 2015a). This was followed by another allopolyploidization with another diploid tPCK genome, least fractionated (LF), resulting in a genome with three sets of tPCK subgenomes, each with different levels of fractionation and reflecting different evolutionary timescales (
Cheng et al. 2015a;
2015b;
2015c). Eventually, independent rounds of genome reorganizations resulted in different chromosome numbers, genome sizes, genes and RE content, and gene retention and expression in different diploid
Brassica species (
Wang et al. 2011b;
Chalhoub et al. 2014;
Liu et al. 2014;
Cheng et al. 2015b). Finally, recurrent merging of the AA and CC genomes occurred fewer than 1.0 million years ago, resulting in the allotetraploid AACC genome (
Mun et al. 2009;
Chalhoub et al. 2014).
GENOME STRUCTURES OF THE Brassica AA, CC, AND AACC GENOMES
Reference genome assemblies were obtained from one accession each for
B. rapa and
B. napus, and from two for
B. oleracea (
Table 2). These assemblies covered 58, 86 and 76, and 75% of the estimated genome sizes of
B. rapa, the two
B. oleracea accessions, and
B. napus, respectively (
Wang et al. 2011b;
Chalhoub et al. 2014;
Liu et al. 2014;
Parkin et al. 2014). In most analyses, we used the 02-12
B. oleracea accession because of high total assembly coverage.
Most of the assembled fractions comprised non-repetitive DNA, representing 45, 54, and 52% of each genome, respectively (
Fig. 3). Compared with
B. oleracea,
B. rapa has fewer genes (41,174 vs. 54,475) and a smaller genome size (485 Mb vs. 630 Mb) (
Fig. 1,
Table 2) (
Wang et al. 2011b;
Liu et al. 2014).
Sequences anchored to pseudo-molecules have even lower values of 53, 61 and 69, and 63% relative to whole genome sizes (
Table 2) (
Wang et al. 2011b;
Chalhoub et al. 2014;
Liu et al. 2014). REs occupy a space representing 13, 32, and 23% of the reference genome assemblies (
Fig. 3), with transposable elements (TEs) occupying up to 97% of the total REs in the assemblies (
Fig. 3). Class I TEs represented 10, 24 and 22, and 20%, and Class II represented 12, 15 and 15, and 14% of the assemblies with N-gaps removed (
Table 2). Additionally, about 42, 14, and 25% were not included in the reference genome assemblies. A survey of the unassembled fractions revealed an abundance of tandem repeats (TR) compared to TEs (
Fig. 3), corroborating the observation that REs, particularly TRs, are difficult to assemble (
Treangen and Salzberg 2011).
MAJOR REPEATS IN THE GENUS Brassica
Most plant genomes contain a large proportion of class I TEs, mainly of the LTR superfamily (
Michael and Jackson 2013), while many nuclear TRs are of centromeric origin (
Melters et al. 2013). The 10 major repeats included in this review represent Class I and Class II TEs, structural satellite repeats, and housekeeping ribosomal RNA genes. These include
Brassica centromeric satellite repeats (CentB1 and CentB2), rDNA tandem repeats (5S and 45S),
Brassica subtelomeric repeats (BSTRa and BSTRb), a centromeric retrotransposon in
Brassica (CRB;
Lim et al. 2007), a pericentromeric retrotransposon specific to
B. rapa (i.e., significantly abundant in
B. rapa, but relatively negligible in
B. oleracea) (pCRBr;
Lim et al. 2007), and dispersed LTR and TIR elements, BoCop-1 and BoCACTA, respectively, specific to the
B. oleracea genome. The presence, absence, and differences in abundance of these repeats in the
Brassica genomes can be exploited to understand their evolutionary dynamics, and perhaps the roles they play in stabilizing their respective genomes.
REPRESENTATION OF REPEATS IN THE AA, CC, AND AACC GENOMES
REs occupy a considerable proportion of both the assembled and unassembled genomic fractions of
B. rapa,
B. oleracea, and
B. napus. Of the total genome sizes of
B. rapa (485 Mb),
B. oleracea (630 Mb), and
B. napus (1,130 Mb), only 58, 86, and 75% were assembled to scaffolds, respectively (
Fig. 3) (
Wang et al. 2011b;
Chalhoub et al. 2014;
Liu et al. 2014). Within these sequences, repetitive DNA sequences accounted for 23, 41, and 35% (
Wang et al. 2011b;
Chalhoub et al. 2014;
Liu et al. 2014), representing 13, 32, and 23% of each corresponding genome (
Fig. 3). On the other hand, non-REs representing euchromatic regions covered 45, 54, and 52% of total estimated genome sizes of
B. rapa,
B. oleracea, and
B. napus, respectively (
Fig. 3).
Transposable elements (TEs) represented up to 97% of total REs in the assembly (
Fig. 3). By contrast, tandem repeats (TRs) occupied only up to 3% (
Fig. 3). Of the TEs, retrotransposons or Class I TEs were more abundant than DNA transposons or Class II TEs in
B. oleracea and
B. napus, but not in
B. rapa, which has a reverse pattern (
Waminal et al. 2016b). Class I TEs were mostly represented by LTR retrotransposons, with
Ty1/
Copia more abundant than
Ty3/
Gypsy in both diploids (4.13 versus 3.42% in
B. rapa, and 10.85 versus 8.86% in
B. oleracea), while present at comparable levels in
B. napus (8.05 versus 8.18%). Both diploid progenitors had different major Class II TEs. Helitrons were more abundant than CACTA elements in
B. rapa (3.74 versus 1.94%), but the reverse was observed in
B. oleracea (3.96 versus 5.55%). Accordingly, both elements had a similar representation in
B. napus (3.69 versus 3.83%).
TRs covered a much greater proportion of REs in the unassembled genome fraction than TEs, although a considerable proportion of TEs was also captured (
Fig. 3). By mapping assembly sequences and WGS reads of each
Brassica species to the 10 RE families used in this analysis, a genomic proportion (GP) was estimated for the assembled and unassembled fractions, respectively. In all three species, the 10 repeats in the current assembly had less than a 1% GP. On the other hand, these repeats had GPs of 19, 11, and 11% when WGS reads of
B. rapa,
B. oleracea, and
B. napus (
Table 1), respectively, were analyzed. This suggests that these 10 repeats were not included in the original assemblies, but rather were mostly left in the unassembled genome fraction.
Overall in the three species, while TEs tended to be more abundant than TRs in the assembly, the opposite was observed in the unassembled fraction. Accordingly, TRs represent about 41, 47 and 35% of the unassembled genome fractions of the AA, CC, and AACC genomes, respectively (
Fig. 3).
ABUNDANCE OF THE MAJOR REPEATS IN Brassica
Of the three
Brassica species,
B. rapa had the highest total GP of the 10 major repeats covering about 99 Mb (19% of the genome), while
B. oleracea and
B. napus covered 68 Mb (11%) and 124 Mb (11%), respectively (
Table 1). Of the 10 repeat families, CentB1 had the highest GP in all three species, representing about 7, 3, and 4% of the total genome size of the AA, CC, and AACC genomes (
Table 1). While the 45S nrDNA had the second highest GP in
B. rapa and
B. napus, CentB2 was second in
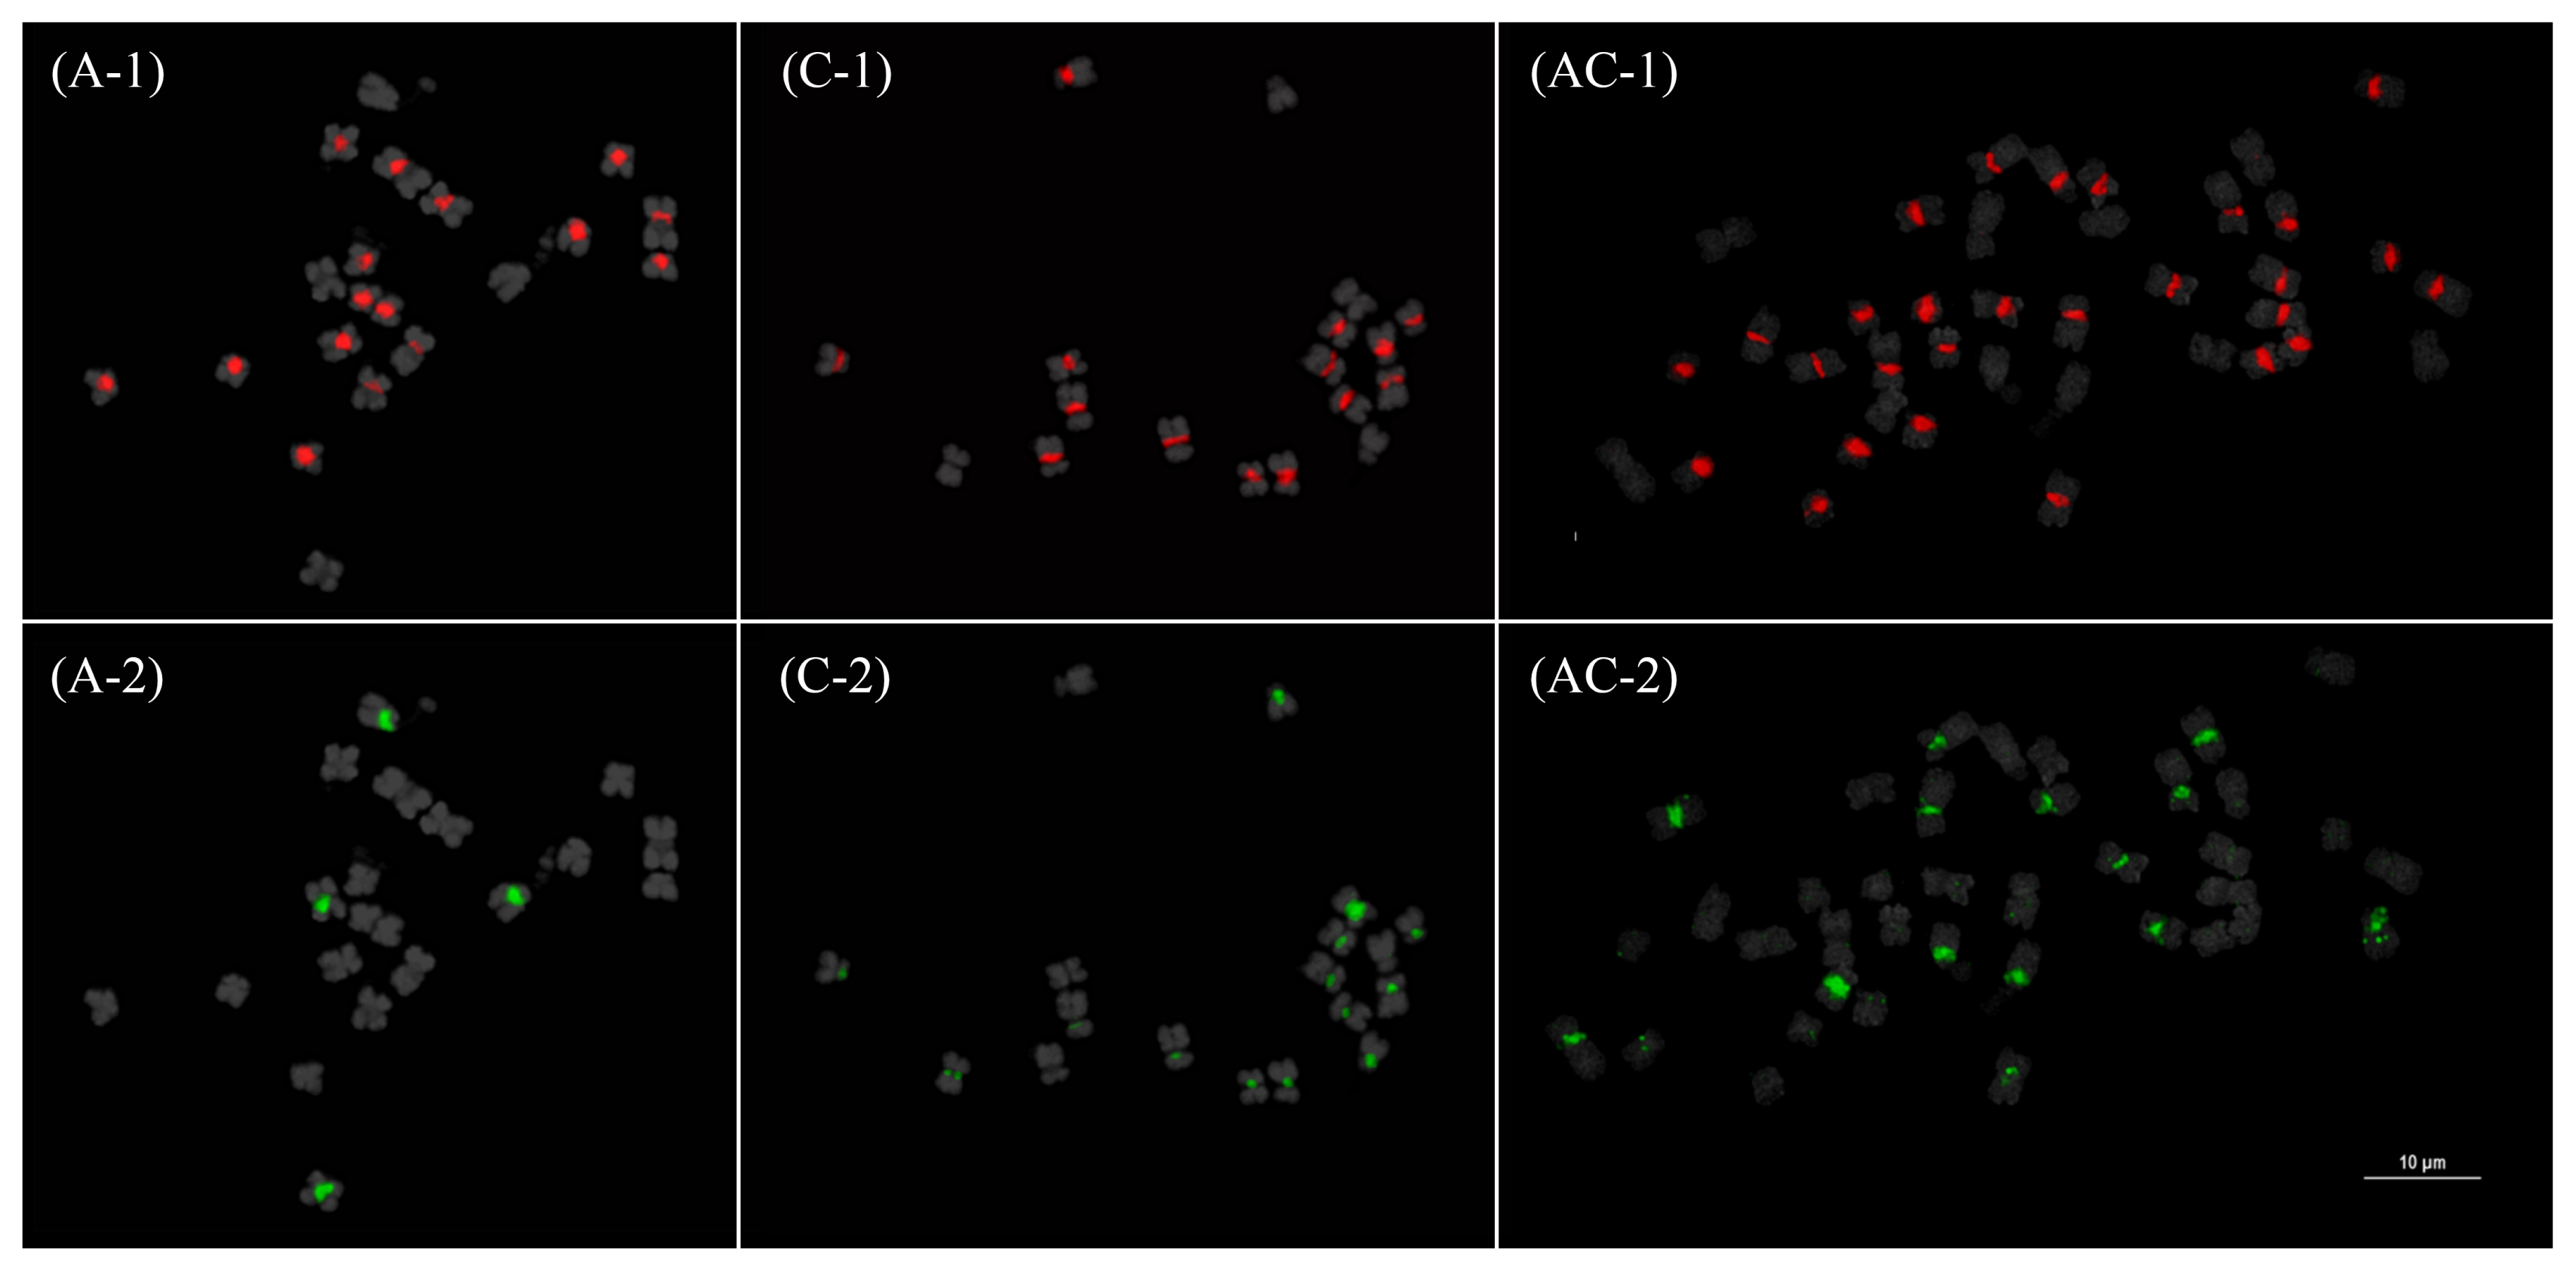
B. oleracea. These in silico mapping results were corroborated by fluorescence in situ hybridization (FISH) data, which showed more nrDNA array loci in
B. rapa and
B. napus than in
B. oleracea (
Fig. 4).
TRs had greater copy numbers than TEs. The shortest elements, CentB1 and CentB2, had the highest genomic representation (GR) in all three species (
Table 1). Although there is stark difference between the GR of CentB1 and CentB2 in the AA and AACC genomes, a much smaller difference was observed in the CC genome. Again, FISH data corroborated this observation (
Fig. 5). The next most abundant repeat, in terms of copy number, was the BSTR family. It is noteworthy that although BSTRa was prominent in the AA genome, BSTRb was more abundant in CC. Consequently, the abundances of BSTRa and BSTRb were comparable within the AACC genome.
The GP of the CRB TE was comparable among the three species. However, pCRBr and BoCACTA/BoCop-1 retained their A-genome and C-genome specificity, respectively, even in the AA and CC subgenomes in the AACC genome. These distributions of the 10 major repeats demonstrate the dynamic amplification or contraction of REs according to repeat family and host genome.
REPEATOMICS FOR IDENTIFICATION OF SUBGENOMES AND INDIVIDUAL CHROMOSOMES
FISH analysis and calculation of signal-to-whole-chromosome area ratio allowed estimation of the 10 major repeats to account for about 31% in all three genomes, although individual repeats varied in abundance in each genome (
Table 1). FISH mapping revealed an abundance of each repeat family that was proportional, despite being higher in value, to that obtained from WGS read mapping. It is, however, important to note that FISH signals could be wider in area than the actual locus; thus, it is likely that these values are overestimated. There is room for the development of more accurate RE quantification techniques, but both WGS read mapping and FISH used in this analysis are plausible approaches towards this objective.
Identification of
B. napus subgenomes has proven difficult because of high homology between the AA and CC subgenomes (
Snowdon et al. 1997;
Howell et al. 2008). Meanwhile, genomic distribution of major repetitive DNA has shown potential for identifying individual chromosomes and in resolving subgenomes without genomic in situ hybridization (GISH) (
Macas et al. 2007;
Alix et al. 2008;
Hribova et al. 2010;
Choi et al. 2014). The CC genome-specific hybridization of BoCACTA and BoCop-1 elements enabled easy and accurate discrimination between AA and CC subgenomes without the need for block DNA (
Fig. 6) (
Alix et al. 2008; Perumal
et al. in preparation). This was particularly useful in discriminating the shorter CC chromosomes from the longer AA chromosomes. It is important to note that although CC chromosomes are generally longer than AA, shorter CC chromosomes such as CC09 could be difficult to distinguish from those in AA such as AA07 (
Fig. 7).
Another important method to accurately identify chromosomes is multicolor-FISH (
Koo et al. 2004;
Wang et al. 2012). This technique allows the mapping of several probes (five probes in this case) in one FISH experiment (e.g.,
Kato et al. 2004). Furthermore, if chromosomes are in good condition, slides can be reprobed (
Jiang and Gill 2006) four or five times, which increases the number of probes (5 × 4~5 = 20~25) to be analyzed in a short period of time while allowing more accurate characterization of individual chromosomes from a single chromosome spread. In this approach, illegitimate recombinations involving REs may easily be detected by comparing signal patterns from different probes. For example, the apparent loss of a 45S rDNA locus in one AA05 homolog resulted in a hemizygous 45S rDNA AA05 locus (
Fig. 4 and
7). Another 45S rDNA locus at CC08 had an unbalanced copy number between the two homologs, as manifested by a significantly reduced signal in one homolog. Similar patterns were observed in some 5S rDNA loci (AA09 and AA10) (
Fig. 7). Compared with diploid
B. rapa, the AA06 STRa locus was more greatly reduced (
Waminal et al. 2015). These physically observed changes in locus size could be explained by a recombination hotspot of repetitive DNAs (
Kolomietz et al. 2002;
Plohl et al. 2012).
Genome specificity of some TEs, as observed in diploid progenitors, has been retained within the
B. napus genome. C-genome specificity is retained in BoCop-1 and BoCACTA, and pCRBr retained its A-genome specificity (
Fig. 6). How certain elements are retained in different subgenomes, in the context of allopolyploidization, can be explained by epigenetic control mechanisms (
Fedoroff 2012;
Plohl et al. 2012).
DYNAMICS OF MAJOR REPEATS IN Brassica AND EVOLUTIONARY IMPLICATIONS
Whole genome duplication and dynamic response of REs
The seven-chromosome ancient karyotype of
Brassicaceae was subjected to several rounds of genome duplication and subsequent lineage-specific rearrangements. This eventually resulted in nine
B. oleracea and 10
B. rapa chromosomes, with
B. oleracea having larger chromosomes than
B. rapa (
Lysak et al. 2006;
Liu et al. 2014;
Cheng et al. 2015a). Comparative analysis of the major repeats in
B. oleracea and
B. rapa genomes provides two scenarios of RE dynamics for speciation of each species. The first suggests a continuous amplification of TEs and TRs in the
B. oleracea genome over time, after its divergence with
B. rapa about 4.6 million years ago, thus increasing the genome size of
B. oleracea (630 Mbp) to more than that of
B. rapa (485 Mbp) (
Liu et al. 2014). The second posits a rapid loss of transposable elements, e.g., BoCACTA, from
B. rapa during divergence from
B. oleracea, which was possibly driven by a slower reestablishment of epigenetic control. This could have prevented homology-dependent, illegitimate recombination-induced repeat loss in
B. rapa (
Fedoroff 2012;
Kelly et al. 2015).
The merging of two genomes often results in genomic shock (
Fedoroff 2012;
Fedoroff and Bennetzen 2013;
Renny-Byfield et al. 2013). This genomic shock initiates genome reprogramming by altering the epigenetic makeup that sometimes results in subgenome dominance, which is observed in some plants (
Paterson et al. 2012;
Renny-Byfield et al. 2012) including of the LF subgenome of
B. rapa, compared to its MF
1 and MF
2 subgenomes (
Cheng et al. 2012). Although the exact mechanisms and timeframe by which these events happen is not yet fully understood (
Fedoroff 2013a), we know that they often lead to genome downsizing through elimination of DNA segments (often repetitive DNA fragments) (
Renny-Byfield et al. 2013;
Renny-Byfield and Wendel 2014), a process aimed at reestablishing stable meiotic pairing and fertility in incipient allopolyploids (
Fedoroff 2012;
Renny-Byfield and Wendel 2014). In the absence of genome downsizing and element amplification in allopolyploids, an additive number of elements relative to the diploid progenitors can be expected. However, although increased genome sizes have been reported (
Renny-Byfield et al. 2013), genome downsizing after allopolyploidization seems to be a rule rather than an exemption (
Marhold and Lihová 2006). Consequently, the resulting allopolyploid has a unique genomic makeup relative to the diploid progenitors. REs are, indeed, important players in a genome’s activity in the onset of WGD.
Compared with its diploid progenitors, the assembled
B. napus centromeric repeats were the most greatly reduced, followed by 45S rDNA, pCRBr, 5S rDNA, BoCACTA, BoCop-1, and CRB (
Table 1). BSTRs showed amplification in the
B. napus genome compared with its diploid progenitors, and BSTRb had more copies than BSTRa. Satellite DNA regions are amplified/contracted in a very short evolutionary time (for review on satellite DNA evolution,
Plohl et al. 2012). Moreover, 45S rDNA loci are often targets of rapid locus elimination and reorganization among polyploids (
Pellicer et al. 2010b;
2010c). An increase of BSTRs in
B. napus may have added benefits and, consequently, could have undergone positive selection, whereas other extra elements of other repeat families may not be necessary at all (
Plohl et al. 2012).
Aside from interspecific variations between the AA, CC, and AACC genomes, variations in the copy number and GP size of each major repeat family have also been observed in the 11, 44, and nine
B. rapa,
B. oleracea, and
B. napus accessions, respectively (Unpublished data). In
B. napus in particular, seven of the nine accessions showed relatively similar numbers of REs. However, the Bn-1 and Bn-2 accessions generally had fewer TR copies, although much more 45S rDNA, compared with the other seven accessions (
Waminal et al. 2016b). Additionally, centromeric and pericentromeric retrotransposons were more abundant in these two accessions. A similar observation was reported for several
B. oleracea morphotypes (
Waminal et al. 2016a), in which some morphotypes, such as cauliflower and broccoli, had more CentBo1 than CentBo2. Some morphotypes, or accessions, apparently have unique RE compositions. We are aware of the limitations of in silico analysis in quantifying these repeats, which could have contributed to the observed value differences, especially taking into account the fewer WGS reads used in Bn-1 and Bn-2 (
Waminal et al. 2016b). However, the higher abundance of 45S rDNA and total TE in these two
B. napus accessions indicates an RE abundance independent from the number of WGS reads used. This was also noted in our previous study with
B. oleracea (
Waminal et al. 2016a). Consequently, the impact of variation in RE abundance warrants further analyses, especially considering a previous report that demonstrated a link between variation in TE abundance and environmental adaptation, emphasizing the adaptive and evolutionary importance of REs (
Kalendar et al. 2000). Studying the fluctuation of the RE fraction is therefore invaluable for understanding phylogenetic relationships. Although no studies have yet shown the direct phenotypic impact of variation in RE fraction size on crop biology or phenotypic diversification in
Brassica, biased TE-regulated subgenome dominance in
B. rapa may have an influence on genes related to production of phytohormones such as auxins, which are involved in morphogenesis (
Santner and Estelle 2009;
Cheng et al. 2015b). RE variance may thus be linked with morphogenesis.
In
Brassica, heterochromatins are mostly localized in centromeric and pericentromeric regions (
Lim et al. 2007), where most REs are localized. CRB is a common centromeric component of the AA, BB, and CC genomes. The absence of CentB hybridization in
B. nigra supports the earlier divergence of the BB genome from the AA and CC genomes (
Lim et al. 2007;
Koo et al. 2011;
Arias et al. 2014). FISH analysis has revealed genome-specific evolution of the
Brassica subtelomeric repeats (
Waminal et al. 2016) since their divergence. Compared with BSTRb, BSTRa seemed to be preferentially selected in the
B. rapa genome, while the opposite was observed in
B. oleracea. This eventually led to a greater abundance of BSTRb than BSTRa in
B. napus after the genome merger. Mechanisms controlling their retention or elimination are being studied and discussed in more detail (
Fablet and Vieira 2011;
Fedoroff 2012).
The varying interspecific and intraspecific abundance of different RE families provide an evolutionary footprint that can be traced and studied to elucidate the evolutionary pathways followed by each species or subspecies.
Epigenetic control of REs and crop improvement
The same mechanisms (i.e., unequal crossovers of homologous sequences and repeat transposition) that are responsible for DNA segment deletion are also models to explain the homogenization and spread of repeats between sister chromatids, homologous chromosomes, and non-homologous chromosomes (
Dover 1982;
Walsh 1987;
Charlesworth et al. 1994;
Cohen et al. 2003;
Hall et al. 2005). Unequal crossovers usually result in higher-order repeat units consisting of more than one type of element, and variation in array lengths (
Hall et al. 2005;
Talbert and Henikoff 2010;
Plohl et al. 2012). Other mechanisms such as gene conversion, repeat transposition, and rolling circle replication may amplify satellite arrays and cause their spread into non-homologous chromosomes (
Dover 1986;
Hall et al. 2005;
Plohl et al. 2012). Epigenetic control is an active cellular mechanism that controls when recombination and transposition should occur. Nonetheless, clear reasons as to how and why they happen in response to abiotic stresses are unknown (
Fedoroff 2013b).
SUMMARY AND PERSPECTIVES
Previous studies have demonstrated the feasibility of using WGS mapping and FISH analysis to quantify those repetitive genomic elements that are mostly left out of assemblies (
Macas et al. 2007;
Hribova et al. 2010;
Waminal et al. 2015). This approach also enables comparative “repeatomics” analysis between
B. napus and its diploid progenitors, promoting understanding of repeat dynamics and its contribution towards shaping the
Brassica genomes. We know that epigenetic control is at the heart of genome plasticity; nevertheless, even with recent advances in genomics and epigenetics, how and why these REs respond to abiotic stresses remain unknown. With further research, a robust explanation of the mechanisms underlying the interconnectedness of environments, genome, and organisms may be determined.
Whether repeatomics has predictive value in relation to agronomically favorable traits remains unclear, but is perhaps worth pursuing. Additionally, the power of WGS and FISH repeat quantification may be further improved by long-read sequencing technologies like PacBio (
Eid et al. 2009;
Ferrarini et al. 2013) and optical mapping (
Lam et al. 2012;
Tang et al. 2015) to provide accurate, single-molecule resolutions of the mega-base tandem repeats that represented a large portion of the unassembled fractions of the three species in this work. Applications of this approach would be particularly useful for analyzing RE fractions of species with large genomes, such as
Allium species (
Jakse et al. 2008),
Fritillaria species (
Kelly et al. 2015), and
Paris japonica (
Pellicer et al. 2010a).
ACKNOWLEDGEMENTS
This research was supported by the Golden Seed Project (Center for Horticultural Seed Development, No. 213003-04-4-SB430) of the Ministry of Agriculture, Food and Rural Affairs (MAFRA) of the Republic of Korea.
Fig. 1
U’s Triangle diagram depicting the genomic relationships between the six economically important Brassica species comprising three diploids (circles) and three allotetraploids (hexagons). Darker gray (diploid) and purple (tetraploid) backgrounds represent species included in the survey of Brassica major repeats.
PM: pseudomolecule, TEs: transposable elements.

Fig. 2
Diagram of the evolutionary history of Brassica. Different divergence time and WGD/WGT time estimates are provided by different authors.
WGD: whole-genome duplications, WGT: whole-genome triplication, Mya: million years ago.
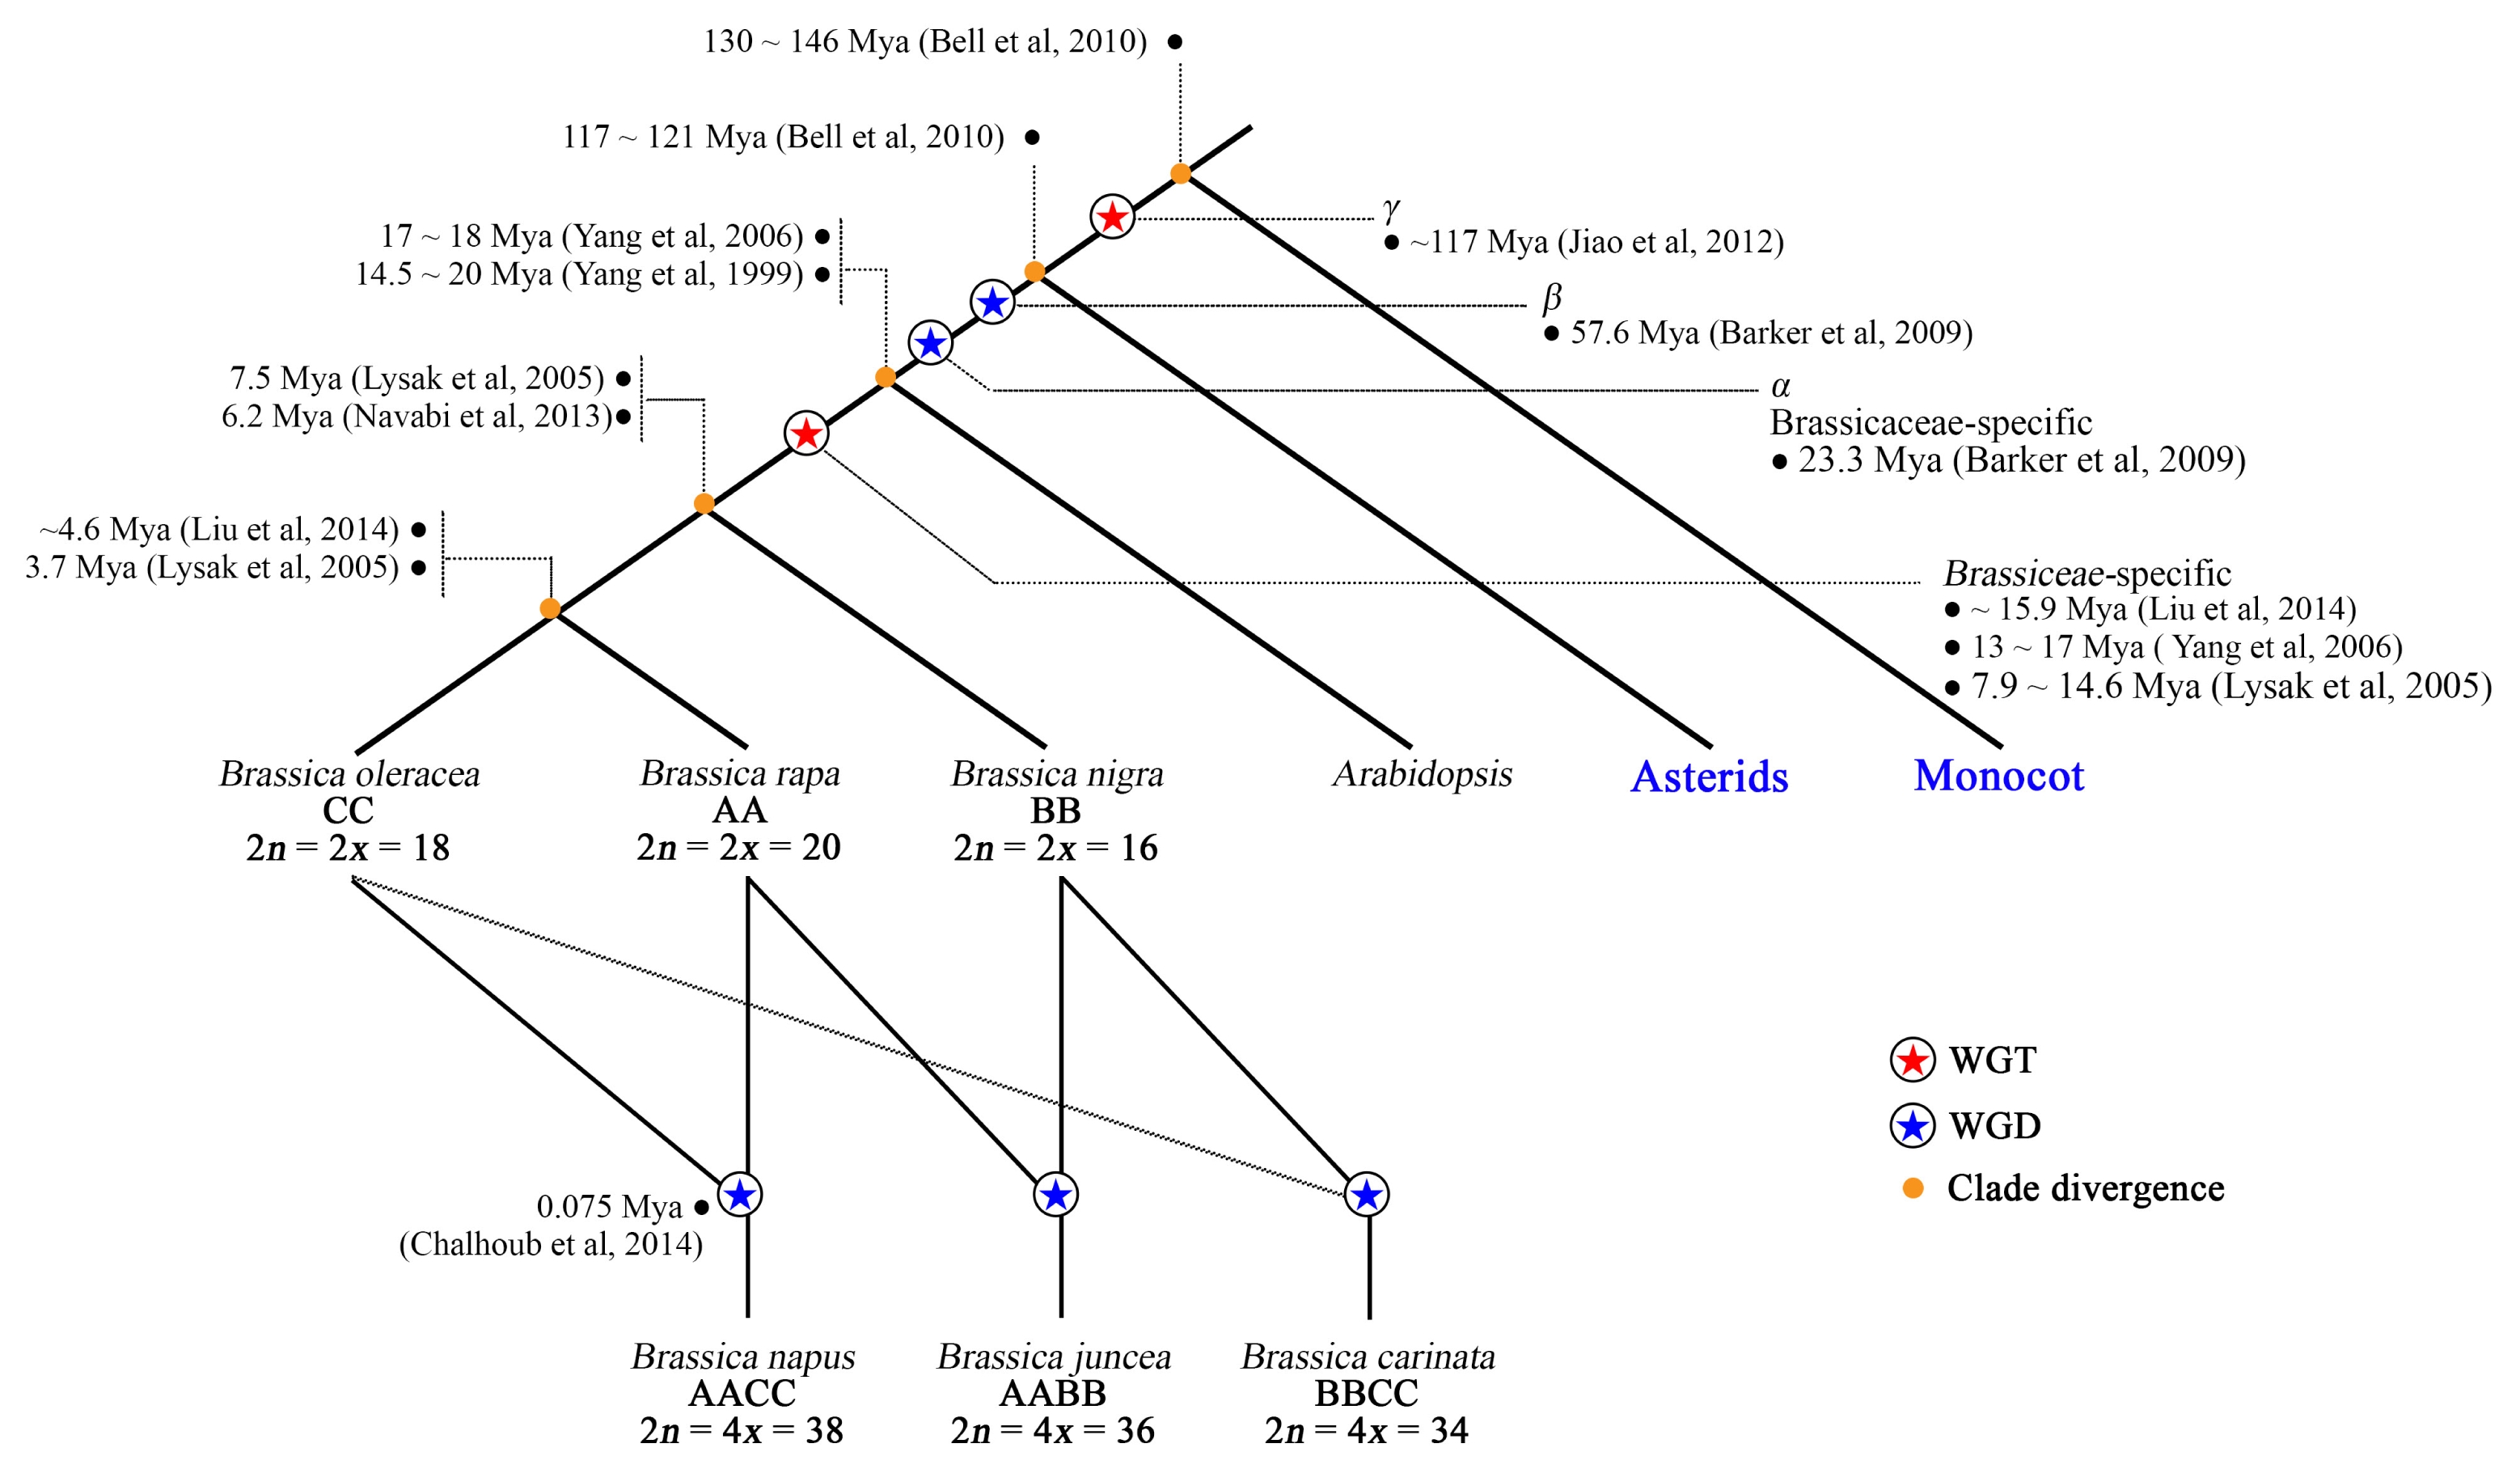
Fig. 3
Genomic proportions of assembled and unassembled sequences in Brassica napus and its diploid progenitors. (A) B. rapa: Large inner pie chart represents the estimated total non-repeat genic fraction (yellow slice) and repeat fraction (brown slice) of reference genomes. The outer doughnut chart represents the percentage of assembled (purple slice) and unassembled (black slice) fractions relative to estimated genome sizes. Smaller pie charts at the bottom left and right summarize the REs in the unassembled and assembled genome fractions, respectively. (B, C) Same diagrams for B. oleracea and B. napus, respectively.
TEs: transposable elements, REs: repetitive elements, TRs: tandem repeats.
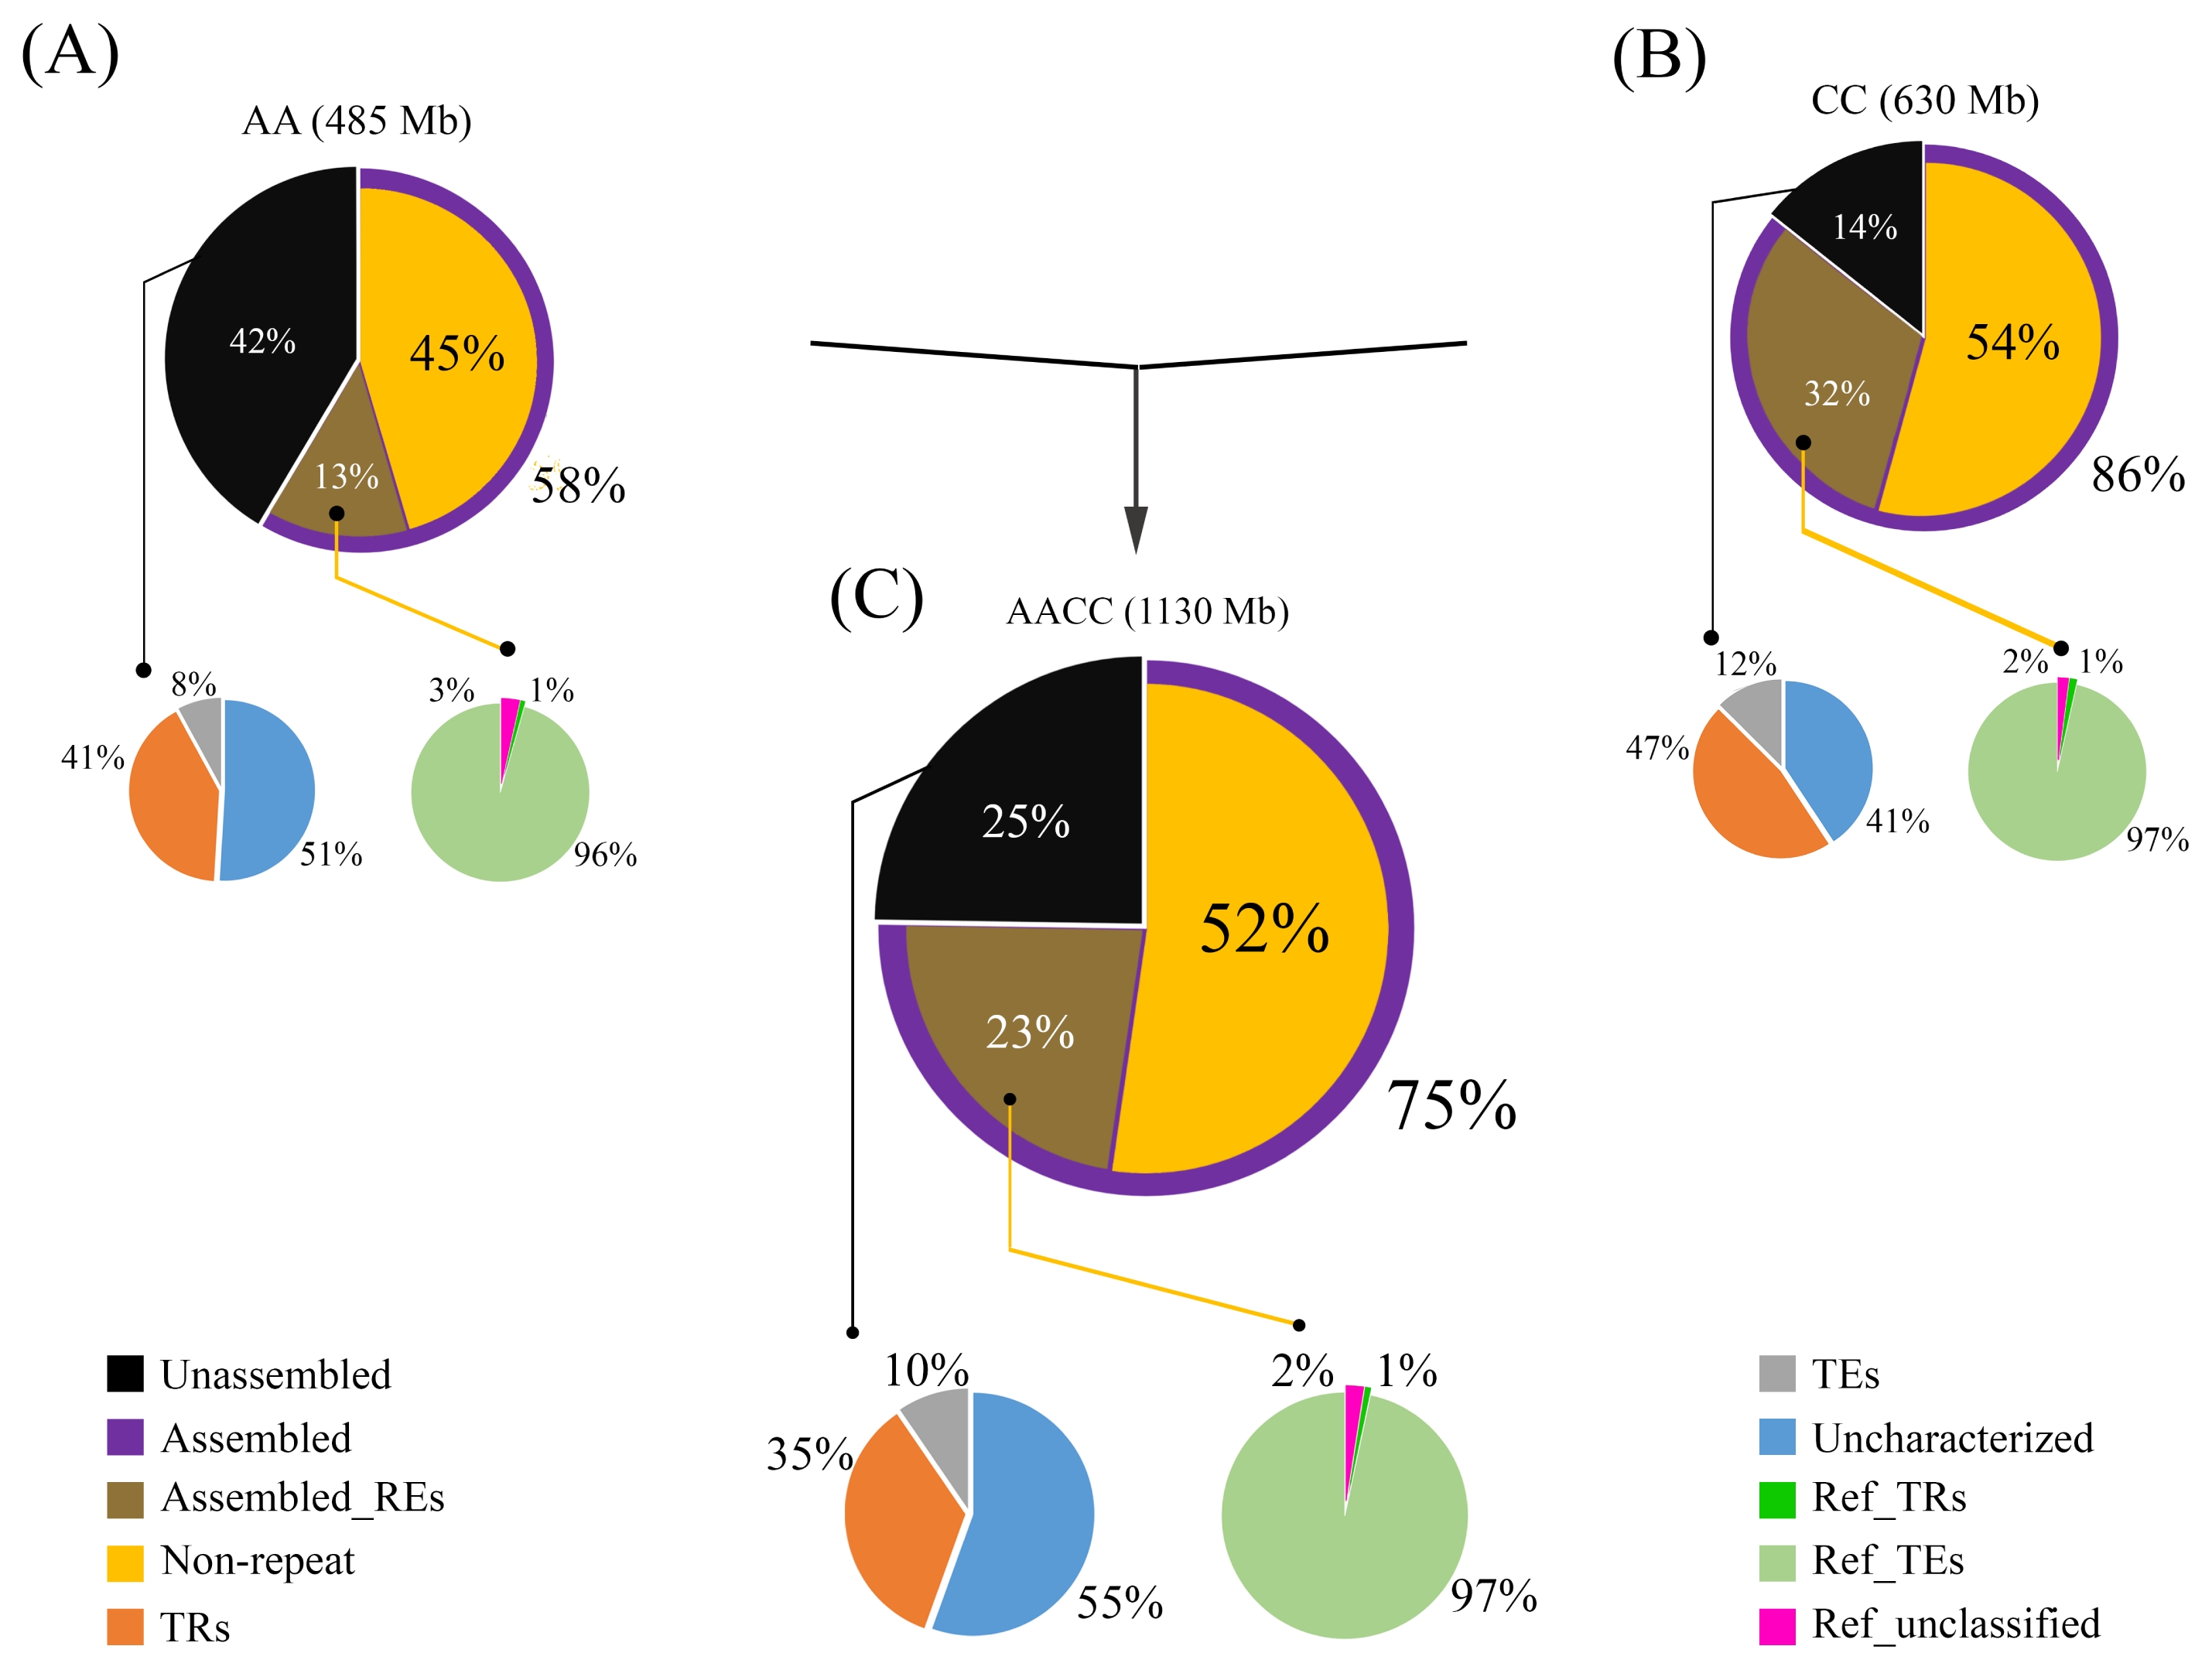
Fig. 4Fluorescence in situ hybridization mapping of the 45S (1) and 5S (2) rDNA in Brassica rapa (A), B. oleracea (C), and B. napus (AC). Yellow arrows indicate hemizygous or highly reduced loci. Note the Bar=10 μm.
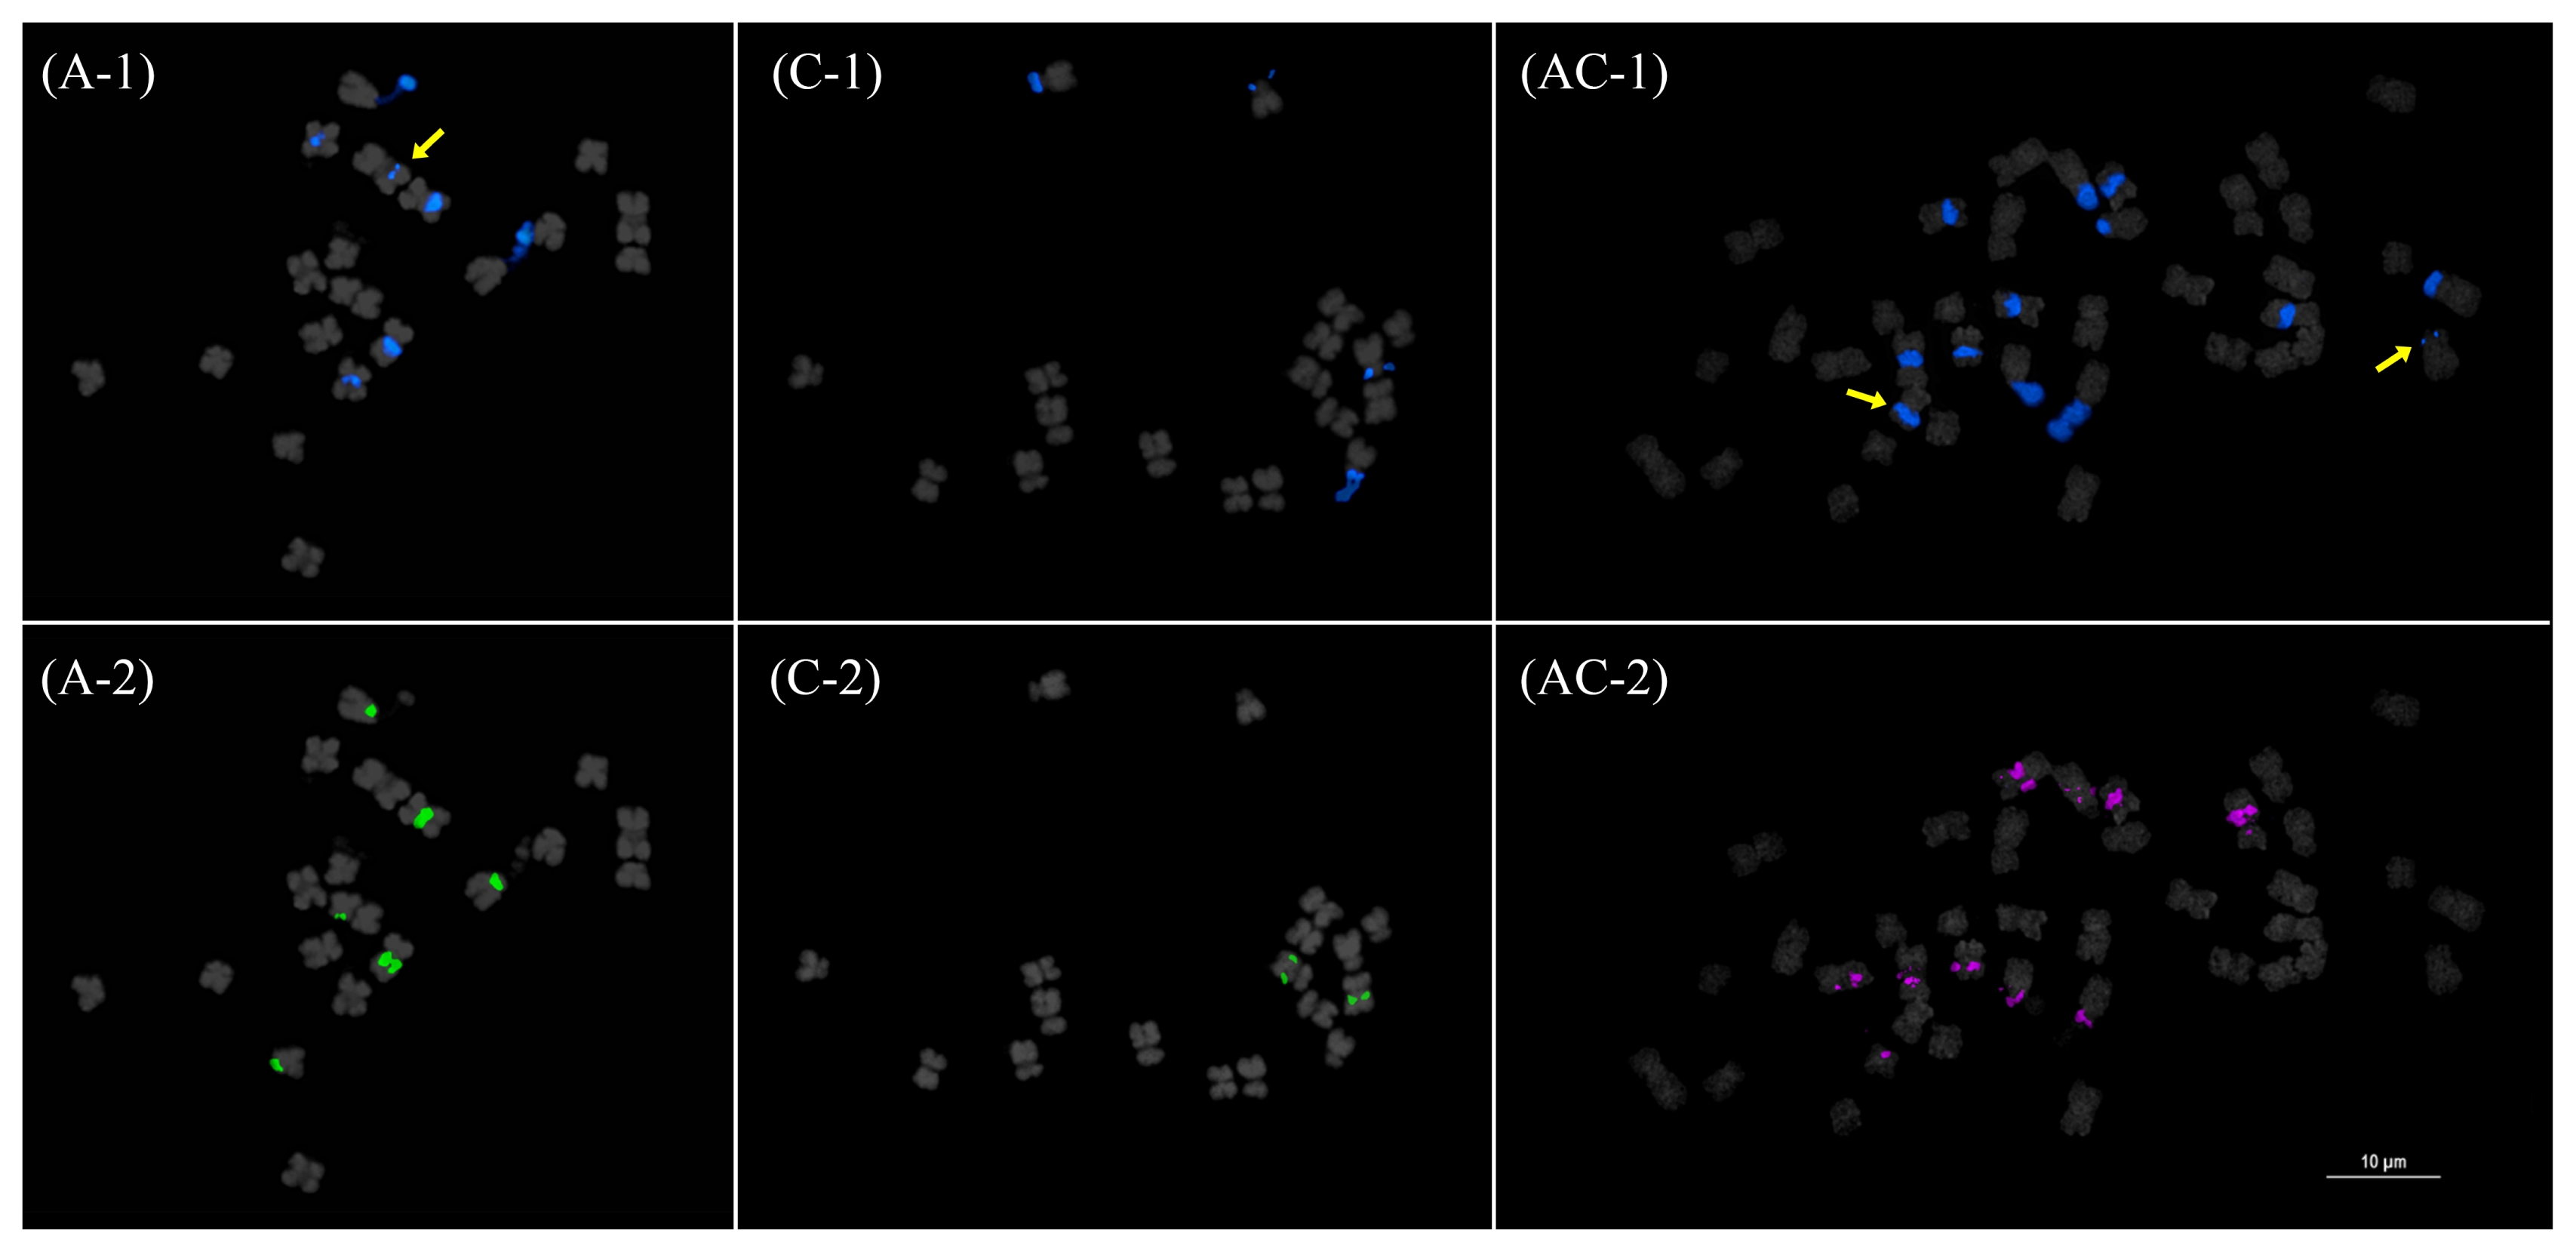
Fig. 5Fluorescence in situ hybridization mapping CentB1 (1) and CentB2 (2) in
Brassica rapa (A),
B. oleracea (C), and
B. napus (AC). Note the distinctive hybridization patterns in
B. rapa and a more co-localized pattern in
B. oleracea. These patterns were mostly retained in
B. napus (see idiogram in
Fig. 7). Bar=10 μm.

Fig. 6Fluorescence in situ hybridization mapping of BoCop-1 (1) and BoCACTA (2) in Brassica rapa (A), B. oleracea (C), and B. napus (AC). Note the C genome specificity of BoCop-1 and BoCACTA which is emphasized and retained in B. napus. Bar=10 μm.
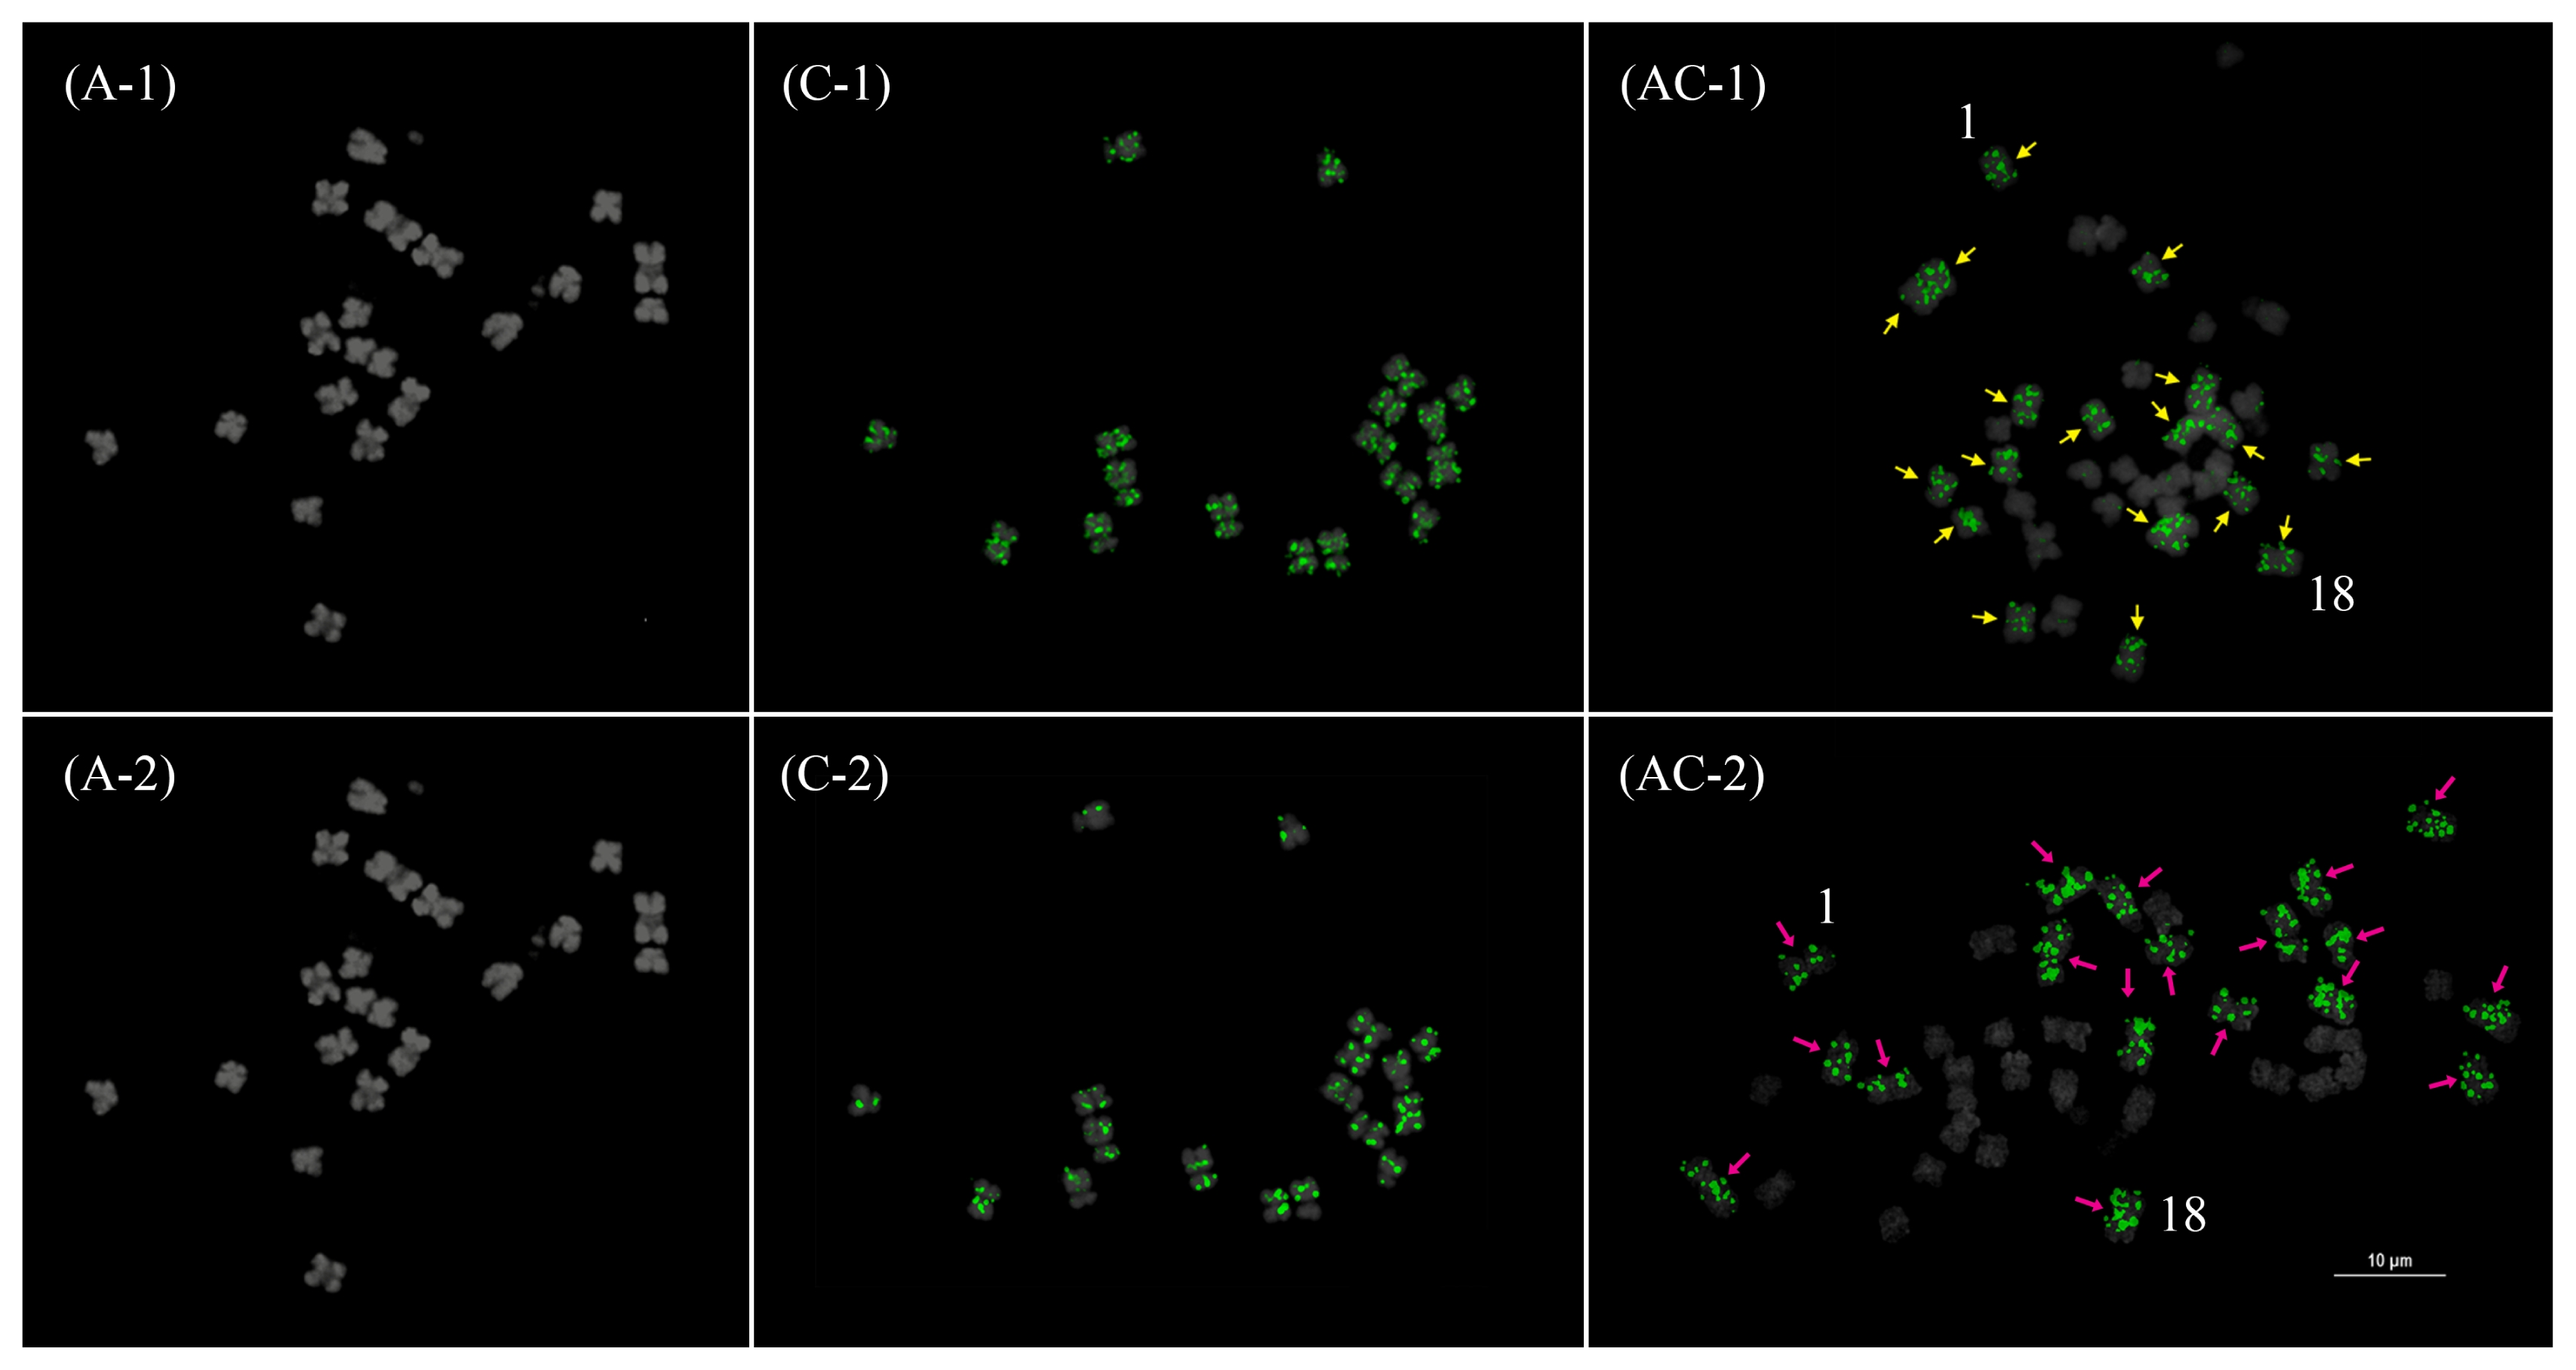
Fig. 7
Karyotypic idiogram of Brassica rapa (upper left), B. oleracea (upper right), and B. napus (bottom) based on major repeat distribution. Except for the genome-specific repeats (pCRBr, BoCop-1, and BoCACTA), all major repeats are depicted. B. napus loci outlined in red depict hemizygous loci. Note the repeat dynamics such as the rearrangements of the 45S rDNA loci in B. napus, especially the novel hemizygous locus in chromosome 5, and the relative abundance of BSTR variants.
CRB: centromeric retrotransposon in Brassica.
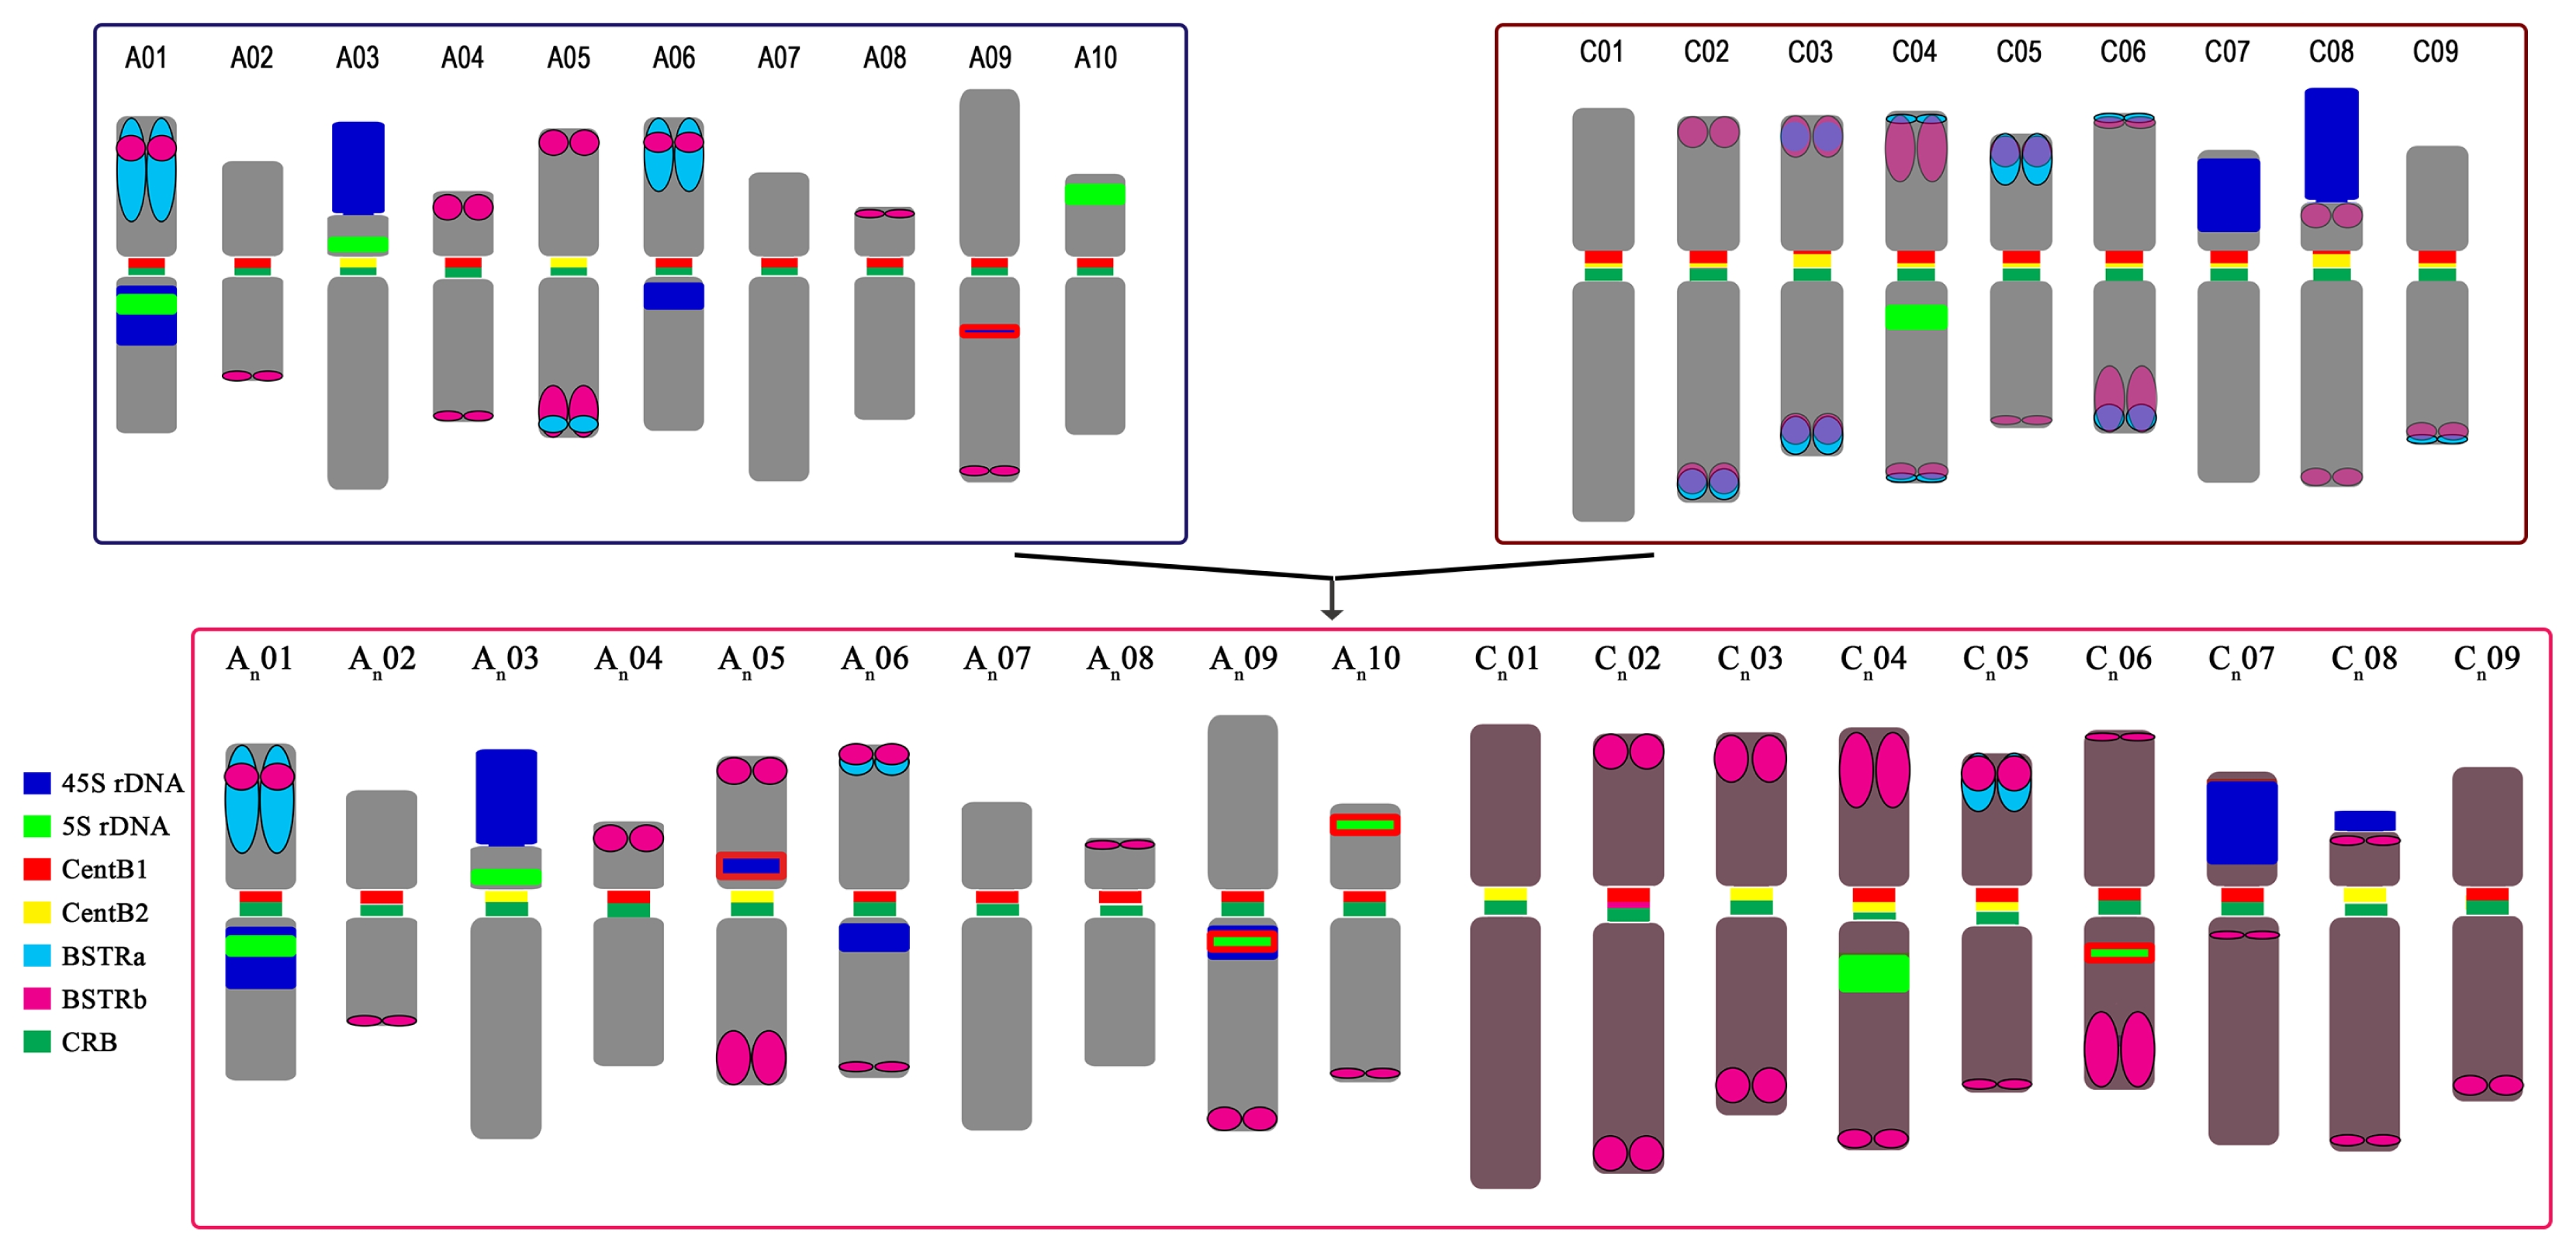
Table 1Comparison of major repeat content in three Brassica reference genome assemblies and WGS of respective 1× WGS reads.
Table 1
|
Element ID |
Size (bp) |
Source |
B. rapa
|
B. oleracea
|
B. napus
|
|
|
|
|
Reference genome (283 Mbp) |
1× wgs (485 Mbp)z)
|
GP (%)y)
|
Reference genome (540 Mbp) |
1× wgs (630 Mbp)z)
|
GP (%)y)
|
Reference genome (850 Mbp) |
1× wgs (1,130 Mbp)z)
|
GP (%)y)
|
|
|
|
|
|
|
|
|
|
|
GR (n)x)
|
GP (%) |
GR (n)x)
|
GR (kb)x)
|
WGS |
FISH |
GR (n)x)
|
GP (%) |
GR (n)x)
|
GR (kb)x)
|
WGS |
FISH |
GR (n)x)
|
GP (%) |
GR (n)x)
|
GR (kb)x)
|
WGS |
FISH |
|
CentB1 |
176 |
, Liu et al. 2014
|
145 |
0 |
197,157 |
34,699 |
6.56 |
11.4 |
1,203 |
0.03 |
114,077 |
20,192 |
3.21 |
7.3 |
336 |
0 |
228,030 |
40,361 |
3.57 |
8 |
|
CentB2 |
176 |
, Liu et al. 2014
|
215 |
0.01 |
40,312 |
7,094 |
1.34 |
2.3 |
1,924 |
0.05 |
89,827 |
15,899 |
2.52 |
6.17 |
518 |
0.01 |
51,092 |
9,043 |
0.8 |
2 |
|
5S nrDNA |
501 |
, Waminal et al. 2015
|
17 |
0 |
5,588 |
2,799 |
0.53 |
1.7 |
143 |
0.01 |
1,286 |
647 |
0.1 |
0.75 |
45 |
0 |
5,146 |
2,578 |
0.23 |
0.9 |
|
45S nrDNA |
7,456 |
, Waminal et al. 2015
|
1 |
0 |
4,395 |
32,766 |
6.19 |
5.9 |
1 |
0 |
1,072 |
8,136 |
1.29 |
1.63 |
- |
0 |
4,088 |
30,485 |
2.7 |
5.3 |
|
BSTRa |
352 |
, Waminal et al. 2016a
|
1323 |
0.08 |
14,579 |
5,137 |
0.97 |
3.5 |
1,511 |
0.08 |
3,829 |
1,354 |
0.21 |
2.55 |
1,517 |
0.05 |
20,348 |
7,122 |
0.63 |
2.7 |
|
BSTRb |
352 |
, Waminal et al. 2016a
|
178 |
0.01 |
809 |
284 |
0.05 |
2.4 |
5,186 |
0.28 |
21,067 |
7,394 |
1.17 |
4.67 |
4,632 |
0.14 |
23,141 |
8,122 |
0.72 |
4.1 |
|
CRB |
5,908 |
, Liu et al. 2014
|
1 |
0 |
694 |
4,098 |
0.77 |
2.5 |
2 |
0 |
486 |
2,995 |
0.48 |
2.98 |
- |
0 |
1,168 |
6,901 |
0.6108 |
2.8 |
|
pCRBr |
8,395 |
, Lim et al. 2007
|
- |
0 |
1,203 |
10,426 |
1.97 |
3.3 |
- |
0 |
46 |
391 |
0.06 |
- |
- |
0 |
960 |
8,216 |
0.73 |
1.9 |
|
BoCop-1 |
6,711 |
, Waminal et al. 2016b
|
1 |
0 |
37 |
251 |
0.05 |
- |
15 |
0.01 |
298 |
1,988 |
0.32 |
1.75 |
1 |
0 |
284 |
1,909 |
0.17 |
1 |
|
BoCACTA |
7,675 |
, Alix et al. 2008
|
1 |
0 |
157 |
1,207 |
0.23 |
- |
1 |
0 |
956 |
8,987 |
1.43 |
2.7 |
1 |
0 |
1,265 |
9,713 |
0.86 |
2.5 |
|
Total |
|
|
1,882.00 |
0.11 |
264,931.00 |
98,765 |
18.67 |
33 |
9,986 |
0.46 |
232,944 |
67,983 |
10.79 |
30.5 |
7,050 |
0.2 |
335,528 |
124,454 |
11.01 |
31.2 |
Table 2Statistical summary of the composition of the three Brassica reference genome assemblies.
Table 2
|
Species |
Accessions |
Genome size (Mb) |
Assembly |
Class I TE |
Class II TE |
No. of genes |
Reference |
|
|
|
|
Pseudo-molecule (Mb) |
Total (coverage) |
(GP) |
(GP) |
|
B. rapa
|
Chiffu |
485 |
257 (53%) |
283.8 (58%) |
28.2 (10%) |
32.2 (12%) |
41,174 |
, Wang et al. (2011b)
|
|
B. oleracea
|
02-12 |
630 |
385 (61%) |
539.9 (86%) |
113.7 (24%) |
77.5 (15%) |
45,758 |
, Liu et al. (2014)
|
|
TO1000 |
648 |
447 (69%) |
488.6 (76%) |
96.8 (22%) |
65.0 (15%) |
54,475 |
, Parkin et al. (2014)
|
|
B. napus
|
Darmor-bzh |
1,130 |
712 (63%) |
850.3 (75%) |
148.0 (20%) |
102.6 (14%) |
101,040 |
, Chalhoub et al. (2014)
|
References
- Alix K, Joets J, Ryder CD, Moore J, Barker GC, Bailey JP, et al. 2008. The CACTA transposon Bot1 played a major role in Brassica genome divergence and gene proliferation. Plant J. 56: 1030-1044.
- Arias T, Beilstein MA, Tang M, McKain MR, Pires JC. 2014. Diversification times among Brassica (Brassicaceae) crops suggest hybrid formation after 20 million years of divergence. Am J Bot. 101: 86-91.
- Barker MS, Vogel H, Schranz ME. 2009. Paleopolyploidy in the Brassicales: analyses of the Cleome transcriptome elucidate the history of genome duplications in Arabidopsis and other Brassicales. Genome Biol Evol. 1: 391-399.
- Bell CD, Soltis DE, Soltis PS. 2010. The age and diversification of the angiosperms re-revisited. AM J Bot. 97: 1296-1303.
- Bennetzen JL, Wang H. 2014. The contributions of transposable elements to the structure, function, and evolution of plant genomes. Annu Rev Plant Biol. 65: 505-530.
- Biémont C. 2010. A brief history of the status of transposable elements: from junk DNA to major players in evolution. Genetics. 186: 1085-1093.
- Biémont C, Vieira C. 2006. Genetics: Junk DNA as an evolutionary force. Nature. 443: 521-524.
- Bowers JE, Chapman BA, Rong J, Paterson AH. 2003. Unravelling angiosperm genome evolution by phylogenetic analysis of chromosomal duplication events. Nature. 422: 433-438.
- Chadwick BP. 2009. Macrosatellite epigenetics: the two faces of DXZ4 and D4Z4. Chromosoma. 118: 675-681.
- Chalhoub B, Denoeud F, Liu S, Parkin IA, Tang H, Wang X, et al. 2014. Early allopolyploid evolution in the post-Neolithic Brassica napus oilseed genome. Science. 345: 950-953.
- Charlesworth B, Sniegowski P, Stephan W. 1994. The evolutionary dynamics of repetitive DNA in eukaryotes. Nature. 371: 215-220.
- Cheng F, Lysak MA, Mandáková T, Wang X. 2015a. The common ancestral genome of the Brassica species. pp. 97-105. Wang X, Kole C, editors. Brassica rapa genome. Springer. Berlin, Germany:
- Cheng F, Wu J, Fang L, Sun S, Liu B, Lin K, et al. 2012. Biased gene fractionation and dominant gene expression among the subgenomes of Brassica rapa. PLoS One. 7: e36442
- Cheng F, Wu J, Liu B, Wang X. 2015c. Genome evolution after whole genome triplication: the subgenome dominance in Brassica rapa. pp. 107-114. Wang X, Kole C, editors. The Brassica rapa genome. Springer. Berlin, Germany:
- Cheng F, Wu J, Wang X. 2015b. Genome triplication drove the diversification of Brassica plants. pp. 97-105. Wang X, Kole C, editors. The Brassica rapa genome. Springer. Berlin, Germany:
- Choi HI, Waminal NE, Park HM, Kim NH, Choi BS, Park M, et al. 2014. Major repeat components covering one-third of the ginseng (Panax ginseng C.A. Meyer) genome and evidence for allotetraploidy. Plant J. 77: 906-916.
- Claros MG, Bautista R, Guerrero-Fernández D, Benzerki H, Seoane P, Fernandez-Pozo N. 2012. Why assembling plant genome sequences is so challenging. Biology (Basel). 1: 439-459.
- Cohen S, Yacobi K, Segal D. 2003. Extrachromosomal circular DNA of tandemly repeated genomic sequences in Drosophila. Genome Res. 13: 1133-1145.
- De Smet R, Adams KL, Vandepoele K, Van Montagu MC, Maere S, Van De Peer Y. 2013. Convergent gene loss following gene and genome duplications creates single-copy families in flowering plants. PNAS. 110: 2898-2903.
- Dover GA. 1982. Molecular drive: a cohesive mode of species evolution. Nature. 299: 111-117.
- Dover GA. 1986. Molecular drive in multigene families: how biological novelties arise, spread and are assimilated. Trends Genet. 2: 159-165.
- Eid J, Fehr A, Gray J, Luong K, Lyle J, Otto G, et al. 2009. Real-time DNA sequencing from single polymerase molecules. Science. 323: 133-138.
- Fablet M, Vieira C. 2011. Evolvability, epigenetics and transposable elements. Biomol Concepts. 2: 333-341.
- Fedoroff NV. 2012. Transposable elements, epigenetics, and genome evolution. Science. 338: 758-767.
- Fedoroff NV. 2013a. McClintock and epigenetics. pp. 61-70. Fedoroff NV, editor. Plant transposons and genome dynamics in evolution. Wiley-Blackwell. Hoboken, NJ:
- Fedoroff NV. 2013b. Molecular genetics and epigenetics of CACTA elements. Methods Mol Biol. 1057: 177-192.
- Fedoroff NV, Bennetzen JL. 2013. Transposons, genomic shock, and genome evolution. pp. 181-201. Fedoroff NV, editor. Plant transposons and genome dynamics in evolution. Wiley-Blackwell. Hoboken, NJ:
- Ferrarini M, Moretto M, Ward JA, Šurbanovski N, Stevanović V, Giongo L, et al. 2013. An evaluation of the PacBio RS platform for sequencing and de novo assembly of a chloroplast genome. BMC Genom. 14: 670
- Gao D, Jiang N, Wing RA, Jiang J, Jackson SA. 2015. Transposons play an important role in the evolution and diversification of centromeres among closely related species. Front Plant Sci. 6: 216
- Haag JR, Pikaard CS. 2011. Multisubunit RNA polymerases IV and V: purveyors of non-coding RNA for plant gene silencing. Nat Rev Mol Cell Biol. 12: 483-492.
- Hall SE, Luo S, Hall AE, Preuss D. 2005. Differential rates of local and global homogenization in centromere satellites from Arabidopsis relatives. Genetics. 170: 1913-1927.
- Howell EC, Kearsey MJ, Jones GH, King GJ, Armstrong SJ. 2008. A and C genome distinction and chromosome identification in Brassica napus by sequential fluorescence in situ hybridization and genomic in situ hybridization. Genetics. 180: 1849-1857.
- Hribová E, Neumann P, Matsumoto T, Roux N, Macas J, Dolezel J. 2010. Repetitive part of the banana (Musa acuminata) genome investigated by low-depth 454 sequencing. BMC Plant Biol. 10: 204
- Jakse J, Meyer JD, Suzuki G, McCallum J, Cheung F, Town CD, et al. 2008. Pilot sequencing of onion genomic DNA reveals fragments of transposable elements, low gene densities, and significant gene enrichment after methyl filtration. Mol Genet Genom. 280: 287-292.
- Jiang J, Gill BS. 2006. Current status and the future of fluorescence in situ hybridization (FISH) in plant genome research. Genome. 49: 1057-1068.
- Jiao Y, Leebens-Mack J, Ayyampalayam S, Bowers JE, McKain MR, McNeal J, et al. 2012. A genome triplication associated with early diversification of the core eudicots. Genome Biol. 13: R3
- Kalendar R, Tanskanen J, Immonen S, Nevo E, Schulman AH. 2000. Genome evolution of wild barley (Hordeum spontaneum) by BARE-1 retrotransposon dynamics in response to sharp microclimatic divergence. PNAS. 97: 6603-6607.
- Kato A, Lamb JC, Birchler JA. 2004. Chromosome painting using repetitive DNA sequences as probes for somatic chromosome identification in maize. PNAS. 101: 13554-13559.
- Kelly LJ, Renny-Byfield S, Pellicer J, Macas J, Novák P, Neumann P, et al. 2015. Analysis of the giant genomes of Fritillaria (Liliaceae) indicates that a lack of DNA removal characterizes extreme expansions in genome size. New Phytol. 208: 596-607.
- Kolomietz E, Meyn MS, Pandita A, Squire JA. 2002. The role of Alu repeat clusters as mediators of recurrent chromosomal aberrations in tumors. Genes Chromosomes Cancer. 35: 97-112.
- Koo DH, Hong CP, Batley J, Chung YS, Edwards D, Bang JW, et al. 2011. Rapid divergence of repetitive DNAs in Brassica relatives. Genomics. 97: 173-185.
- Koo DH, Jiang J. 2008. Extraordinary tertiary constrictions of Tripsacum dactyloides chromosomes: implications for karyotype evolution of polyploids driven by segmental chromosome losses. Genetics. 179: 1119-1123.
- Koo DH, Plaha P, Lim YP, Hur Y, Bang JW. 2004. A high-resolution karyotype of Brassica rapa ssp. pekinensis revealed by pachytene analysis and multicolor fluorescence in situ hybridization. Theor Appl Genet. 109: 1346-1352.
- Lagercrantz U. 1998. Comparative mapping between Arabidopsis thaliana and Brassica nigra indicates that Brassica genomes have evolved through extensive genome replication accompanied by chromosome fusions and frequent rearrangements. Genetics. 150: 1217-1228.
- Lam ET, Hastie A, Lin C, Ehrlich D, Das SK, Austin MD, et al. 2012. Genome mapping on nanochannel arrays for structural variation analysis and sequence assembly. Nat Biotechnol. 30: 771-776.
- Lim KB, Yang TJ, Hwang YJ, Kim JS, Park JY, Kwon SJ, et al. 2007. Characterization of the centromere and peri-centromere retrotransposons in Brassica rapa and their distribution in related Brassica species. Plant J. 49: 173-183.
- Liu B, Xu C, Zhao N, Qi B, Kimatu JN, Pang J, et al. 2009. Rapid genomic changes in polyploid wheat and related species: implications for genome evolution and genetic improvement. J Genet Genom. 36: 519-528.
- Liu S, Liu Y, Yang X, Tong C, Edwards D, Parkin IA, et al. 2014. The Brassica oleracea genome reveals the asymmetrical evolution of polyploid genomes. Nat Commun. 5: 3930
- Lysak MA, Berr A, Pecinka A, Schmidt R, Mcbreen K, Schubert I. 2006. Mechanisms of chromosome number reduction in Arabidopsis thaliana and related Brassicaceae species. PNAS. 103: 5224-5229.
- Lysak MA, Koch MA, Pecinka A, Schubert I. 2005. Chromosome triplication found across the tribe Brassiceae. Genome Res. 15: 516-525.
- Macas J, Neumann P, Navrátilová A. 2007. Repetitive DNA in the pea (Pisum sativum L.) genome: comprehensive characterization using 454 sequencing and comparison to soybean and Medicago truncatula. BMC Genom. 8: 427
- Marhold K, Lihová J. 2006. Polyploidy, hybridization and reticulate evolution: lessons from the Brassicaceae. Plant Syst Evol. 259: 143-174.
- Mehrotra S, Goyal V. 2014. Repetitive sequences in plant nuclear DNA: types, distribution, evolution and function. Genom Proteom Bioinform. 12: 164-171.
- Melters DP, Bradnam KR, Young HA, Telis N, May MR, Ruby JG, et al. 2013. Comparative analysis of tandem repeats from hundreds of species reveals unique insights into centromere evolution. Genome Biol. 14: R10
- Michael TP, Jackson S. 2013. The first 50 plant genomes. Plant Genome. 6:
- Mihai P, Salzberg SL, Shumway M. 2002. Genome sequence assembly: algorithms and issues. Computer. 35: 47-54.
- Mun JH, Kwon SJ, Yang TJ, Seol YJ, Jin M, Kim JA, et al. 2009. Genome-wide comparative analysis of the Brassica rapa gene space reveals genome shrinkage and differential loss of duplicated genes after whole genome triplication. Genome Biol. 10: R111
- Nagaharu U. 1935. Genome analysis in Brassica with special reference to the experimental formation of B. napus and peculiar mode of fertilization. Jpn J Bot. 7: 389-452.
- Navabi ZK, Huebert T, Sharpe AG, O’Neill CM, Bancroft I, Parkin IA. 2013. Conserved microstructure of the Brassica B genome of Brassica nigra in relation to homologous regions of Arabidopsis thaliana, B. rapa and B. oleracea. BMC Genomics. 14: 250
- Nowak R. 1994. Mining treasures from ‘junk DNA’. Science. 263: 608-610.
- Panjabi P, Jagannath A, Bisht NC, Padmaja KL, Sharma S, Gupta V, et al. 2008. Comparative mapping of Brassica juncea and Arabidopsis thaliana using Intron Polymorphism (IP) markers: homoeologous relationships, diversification and evolution of the A, B and C Brassica genomes. BMC Genomics. 9: 113
- Parkin IA, Koh C, Tang H, Robinson SJ, Kagale S, Clarke WE, et al. 2014. Transcriptome and methylome profiling reveals relics of genome dominance in the mesopolyploid Brassica oleracea. Genome Biol. 15: R77
- Paterson AH, Wendel JF, Gundlach H, Guo H, Jenkins J, Jin D, et al. 2012. Repeated polyploidization of Gossypium genomes and the evolution of spinnable cotton fibres. Nature. 492: 423-427.
- Pellicer J, Fay MF, Leitch IJ. 2010. The largest eukaryotic genome of them all? Bot J Linn Soc. 164: 10-15.
- Pellicer J, Garcia S, Canela MA, Garnatje T, Korobkov AA, Twibell JD, et al. 2010. Genome size dynamics in Artemisia L. (Asteraceae): following the track of polyploidy. Plant Biol (Stuttg). 12: 820-830.
- Pellicer J, Garnatje T, Hidalgo O, Tagashira N, Vallès J, Kondo K. 2010. Do polyploids require proportionally less rDNA loci than their corresponding diploids? Examples from artemisia subgenera Absinthium and Artemisia (Asteraceae, Anthemideae). Plant Biosyst. 144: 841-848.
- Peng JC, Karpen GH. 2008. Epigenetic regulation of heterochromatic DNA stability. Curr Opin Genet Dev. 18: 204-211.
- Petit M, Guidat C, Daniel J, Denis E, Montoriol E, Bui QT, et al. 2010. Mobilization of retrotransposons in synthetic allotetraploid tobacco. New Phytol. 186: 135-147.
- Plohl M, Meštrović N, Mravinac B. 2012. Satellite DNA evolution. Genome Dyn. 7: 126-152.
- Pop M. 2009. Genome assembly reborn: Recent computational challenges. Brief Bioinform. 10: 354-366.
- Renny-Byfield S, Kovařík A, Chester M, Nichols RA, Macas J, Novák P, et al. 2012. Independent, rapid and targeted loss of highly repetitive DNA in natural and synthetic allopolyploids of Nicotiana tabacum. Plos One. 7: e36963
- Renny-Byfield S, Kovarik A, Kelly LJ, Macas J, Novak P, Chase MW, et al. 2013. Diploidization and genome size change in allopolyploids is associated with differential dynamics of low- and high-copy sequences. Plant J. 74: 829-839.
- Renny-Byfield S, Wendel JF. 2014. Doubling down on genomes: polyploidy and crop plants. Am J Bot. 101: 1711-1725.
- Santner A, Estelle M. 2009. Recent advances and emerging trends in plant hormone signalling. Nature. 459: 1071-1078.
- Schatz MC, Witkowski J, McCombie WR. 2012. Current challenges in de novo plant genome sequencing and assembly. Genome Biol. 13: 243
- Slotkin RK, Martienssen R. 2007. Transposable elements and the epigenetic regulation of the genome. Nat Rev Genet. 8: 272-285.
- Snowdon RJ, Köhler W, Friedt W, Köhler A. 1997. Genomic in situ hybridization in Brassica amphidiploids and interspecific hybrids. Theor Appl Genet. 95: 1320-1324.
- Talbert PB, Henikoff S. 2010. Centromeres convert but don’t cross. PLoS Biol. 8: e1000326
- Tang H, Lyons E, Town CD. 2015. Optical mapping in plant comparative genomics. Gigascience. 4: 3
- Tang H, Woodhouse MR, Cheng F, Schnable JC, Pedersen BS, Conant G, et al. 2012. Altered patterns of fractionation and exon deletions in Brassica rapa support a two-step model of paleohexaploidy. Genetics. 190: 1563-1574.
- Tank DC, Eastman JM, Pennell MW, Soltis PS, Soltis DE, Hinchliff CE, et al. 2015. Nested radiations and the pulse of angiosperm diversification: increased diversification rates often follow whole genome duplications. New Phytol. 207: 454-467.
- Treangen TJ, Salzberg SL. 2011. Repetitive DNA and next-generation sequencing: computational challenges and solutions. Nat Rev Genet. 13: 36-46.
- Vanburen R, Bryant D, Edger PP, Tang H, Burgess D, Challabathula D, et al. 2015. Single-molecule sequencing of the desiccation-tolerant grass Oropetium thomaeum. Nature. 527: 508-511.
- Walsh JB. 1987. Persistence of tandem arrays: Implications for satellite and simple-sequence DNAs. Genetics. 115: 553-567.
- Waminal NE, Perumal S, Lim KB, Park BS, Kim HH, Yang TJ. 2015. Genomic survey of the hidden components of the B. rapa genome. pp. 83-96. Wang X, Kole C, editors. The Brassica rapa genome. Springer. Berlin, Germany:
- Waminal NE, Perumal S, Lee JH, Kim HH, Yang TJ. 2016a. Genomic abundance, diversity and distribution of the major repeats revealed by resequences and FISH in B oleracea. The Brassica oleracea genome. Springer. (in press).
- Waminal NE, Perumal S, Kim HH, Yang TJ. 2016b. Genomic survey of major repeats reveals the repeat dynamics and hidden genomic fraction of Brassica napus genome. The Brassica napus genome. Springer. (in press).
- Wang DO, Matsuno H, Ikeda S, Nakamura A, Yanagisawa H, Hayashi Y, et al. 2012. A quick and simple FISH protocol with hybridization-sensitive fluorescent linear oligodeoxynucleotide probes. RNA. 18: 166-175.
- Wang X, Torres MJ, Pierce G, Lemke C, Nelson LK, Yuksel B, et al. 2011a. A physical map of Brassica oleracea shows complexity of chromosomal changes following recursive paleopolyploidizations. BMC Genomics. 12: 470
- Wang X, Wang H, Wang J, Sun R, Wu J, Liu S, et al. 2011b. The genome of the mesopolyploid crop species Brassica rapa. Nat. Genet. 43: 1035-1039.
- Yang TJ, Kim JS, Kwon SJ, Lim KB, Choi BS, Kim JA, et al. 2006. Sequence-level analysis of the diploidization process in the triplicated FLOWERING LOCUS C region of Brassica rapa. Plant Cell. 18: 1339-1347.