Abstract
This study was carried out to evaluate the genetic diversity and relationships among fifty-six blackberry (Rubus fructicosus) mutants derived from gamma-ray treatment (fifty-two lines) by analysis of Amplified fragment length polymorphism (AFLP) markers. Both cluster analysis and principal coordinate analysis (PCOORDA) were conducted in order to study the genetic diversity, using both morphological traits and AFLP makers. A total of 589 bands were amplified with an average of 58.9 bands per primer. Among them, 560 were identified to be polymorphic, with a rate of 95.08%. A showed a highly significant (P≤0.01) positive correlation with GD and PIC (r2=0.999). MI also showed a significant (P≤0.05) positive correlation with GD and PIC. According to the clustering analysis, all mutant lines could be classified into five categories, but the three gamma-ray treatment lines and the cross-bred line were not clustered into any groups. For the morphological traits, cluster analysis divided the blackberry germplasm into six clusters and two independent groups. In addition, the morphological dendrogram indicated an unclear pattern of division among the groups based on AFLP analysis. The findings of this study indicate that mutant lines have high genetic diversity, and can be effectively utilized as materials for the improvement of breeding.
-
Key words: Blackberry, Mutant, Genetic diversity, AFLP
INTRODUCTION
Blackberries are fruit-bearing species of the genus
Rubus, subgenus
Rubus of the Rosaceae family (
Kim et al., 2002;
Thompson, 1997).
Rubus species are mostly perennial (in temperate areas), with a long-lived stem crown and short-lived biennial shoots bearing fruit in their second year. The genus
Rubus was divided into two major groups based on the horticultural traits: blackberries and raspberries (subgenus
Idaeobatus). In addition, apomixis occurs in the two subgenera most important in horticulture: polyploid species of blackberries, and very rarely, raspberries (
R. Idaeobatus) from polyploidy species deviant of normally diploid species (
Asker, 1979;
Gustafsson, 1943;
Nybom, 1988). They are reproductively very versatile, showing both sexual (outcrossing and selfing) and asexual reproduction. The latter includes parthenogenesis, pseudogamy (apomixis requiring pollination), parthenocarpy (production of fruit without fertilization), and vegetative reproduction through suckers or adventitious roots (
Gustafsson, 1943;
Hall and Brewer, 1993;
Nybom, 1988). Self-pollination is frequent (
Nybom, 1988), and increases the chances of seed production. The Blackberries ploidy ranges from diploid (2n = 2x = 14) to dodecaploid (2n = 12x = 84) (
Amsellem et al., 2000). These adaptations, together with several different modes of propagation, confer the genus with a high capacity to colonize new habitats, as is typical of invasive species. Hybridization is common in
Rubus: sympatric closely related species are very likely to hybridize, producing fecund progeny (
Hall and Brewer, 1993;
Nybom, 1988). However, hybridization has also been observed between species belonging to different subgenera (
Alice and Campbell, 1999;
Alice, 2002).
Plant breeding requires genetic variation of useful traits for crop improvement. Often, however, desired variation is lacking. Mutagenic agents such as radiation and certain chemicals may be used to induce mutations and generate genetic variations, from which mutants with the desired traits may be selected (
Bae et al., 2001;
Van Harten, 1998;
Hiroyasu et al., 2009; Predieri
et al., 2001). In fruit crops, mutagenesis has already been used to introduce many useful traits affecting plant size, blooming time and fruit ripening, fruit color, self-compatibility, self-thinning, and resistance to pathogens (
Visser et al., 1971;
Janick and Moore, 1975;
Donini, 1982). Most of these traits continue to be worthy of introduction in many fruit species. The number of cultivars derived from introduction of mutation is constantly increasing. In 2010, there were about 3000 varieties of more than 172 species derived from induced mutation (IAEA, 2010). Mutations are defined as heritable changes in the DNA sequence that are not derived from genetic segregation or recombination (
Van Harten, 1998). Genetic variation can be induced either by specific treatments with physical and chemical mutagens or by tissue culture. Whether tissue culture induces mutations different from those derived by physical or chemical mutagens is still being debated, but since at least part of the observed variations are stable and heritable (
Bae et al., 2001;
Van Harten, 1998), it is considered here as a source of genetic variation useful for improvement of fruit (
Hiroyasu et al., 2009; Predieri
et al., 2001).
The success of any crop breeding program is based on the knowledge of and availability of genetic variability for efficient selection. Genetic diversity estimates among genotypes are helpful in selecting parental combinations to create segregating populations so as to maintain genetic diversity in a breeding program (
Becelaere et al. 2005), and for the classification of germplasm into heterotic groups for hybrid crop breeding (
Menz et al., 2004). DNA-based markers, available in unlimited numbers, have been provided for diversity assessment in a number of plant species (
Lu et al., 1996;
Russel et al., 1997). Recently, genetic markers including restriction fragment length polymorphism (RFLP), Amplified Fragment Length Polymorphism (AFLP), random amplified polymorphic DNA (RAPD), simple sequence repeat (SSR), etc., have been used to detect polymorphisms of genetic diversity. The AFLP DNA fingerprinting technique is a powerful DNA marker system based on the detection of DNA restriction fragments by PCR amplification (Gresshoff
et al., 1996;
Russel et al., 1997). The concept of AFLP DNA fingerprinting techniques has the advantage of detecting DNA polymorphism in high resolution, as small as 1 bp. In addition, AFLP techniques have the advantage of being able to apply fingerprinting without sequence information of the genomic DNA (
Hulst et al., 2000;
Russel et al., 1997), because AFLP fingerprinting relies on primers designed in part on sequences for endonuclease restriction sites, and on two or three selective nucleotides. Amplification of restricted fragments is accomplished by the ligation of double-stranded (ds) adapter sequences to the ends of the restriction sites. In addition, it is possible to construct very high density DNA marker maps for application in genome research and positional cloning of genes through this method (
Monte-Corvo et al., 2000;
Russel et al., 1997). Studies on the genetic diversity of
Rubus species have been carried out, including species such as
R. idaeus (
Parent and Fortin 1993,
Graham and Mcnicol, 1995,
Graham et al. 1997) and
R. occidentalis (
Parent and Page, 1998), as well as Asian species (
Amsellem et al. 2000). These studies employed AFLP, RAPD (Random Amplified Polymorphic DNA), RFLP (Restriction Fragment Length polymorphism), and SCAR (Sequence Characterized Amplified Region) markers, as well as SSR (
Amsellem et al., 2000;
Parent and Fortin, 1993,
Graham and Mcnicol, 1995,
Graham et al. 1997;
Parent and Page, 1998).
In the present study, we evaluated the level and organization of genetic diversity and relationships among mutants derived from gamma-ray, MNU and cross breed treatment using AFLP markers, in order to establish a base line to assist future conservation and breeding programs for blackberries.
MATERIALS AND METHODS
Plant material
Fifty-six blackberry germplasms were used in this study (
Table 1). Fifty-two lines were derived from gamma-ray treatment, three lines were from MNU treatments, and one was a cross breed of
R. fructicosus ×
R. parvifolius (one line). The plants were cultivated at a breeding farm in Bioplant
.
The morphological experiment was carried out at the farm of Bioplus in the growing season of 2012. Eleven morphological characteristics were examined, including stem diameter, flowering date, leaf and fruit size, weight of one hundred fruit, leaf shape, leaf lobes, color of leaf spire, branch color, color of petals, flower bud color and color of corolla spire (
Ryu et al., 2012)
DNA was extracted from young leaves of each accession by the CTAB method (
Fang et al., 1992). DNA quantities were checked using 0.8% agarose gel electrophoresis and a Nanodrop Spectrophotometer (Thermo Fisher Scientific, Netherlands).
The AFLP analysis was performed as per the method in the instruction manual for the AFLPTM Analysis system I (InvitrogenTM, California, USA). Genomic DNA was digested with EcoRI and MseI enzymes. Adapters were ligated to the specific restriction fragment ends by incubating at 37°C for 2 h. Ligated DNA fragments were then pre-amplified using an AFLP Pre-Amp Primer Mix I kit (InvitrogenTM, California, USA) after 1/10 dilution with TE buffer. Pre-amplification PCR was performed using the following cycle profiles: 1st step, 2 min at 72°C; 2nd step, 30 s at 94°C, 60 s at 65°C, and 60 s at 72°C for 30 cycles; and 3rd step, 10 min at 60°C. Aliquots o the PCR products (5 μL) were confirmed on a 1.5% agarose gel, and then 1/10 dilution of the pre-amplified products was carried out using TE buffer. Diluted pre-amplified DNA was used as a template for selective amplification. PCR was carried out in a 10 μL volume containing 2 μL of template DNA, 2.5 μM MseI primer, 1 μM EcoRI primer, 10x buffer, 8 mM of dNTPs, and 0.65 U of Taq polymerase. The selective PCR was performed using the following cycle profile: Cycle 1, 30 s at 94°C, 30 s at 65°C, and 2 min at 72°C; Cycles 2 – 12, same PCR profile as cycle 1, except for a stepwise decrease of the annealing temperature in each subsequent cycle by 0.7°C during 11 cycles; Cycles 13 – 42, 30 s at 94°C, 30 s at 56°C, and 2 min at 72°C. The selective amplification was conducted to obtain polymorphic amplicons with a total of 34 combinations of EcoRI (+3) and MseI (+3) primers. The selective EcoRI primers were labeled with the fluorescent dyes FAM, HEX, NED, VIC, and PET. After selective PCR, each sample was prepared for capillary electrophoresis with a 10 μL loading mixture (1 μL of each labeled amplicon by different fluorescent dyes, 0.2 μL size standard, and Hi-Di formamide sequence buffer). The prepared mixture was boiled at 95°C and then chilled to 4°C. The sample was then fractionated with a Lapchip GX electrophoresis system (Caliper life science, USA).
Statistical analysis
All AFLP bands were scored as 0 or 1 for absence/presence of the bands, respectively. The total number of bands and the number of polymorphic bands were calculated, as well as the polymorphic information content (PIC), which was determined according to the method of
Anderson et al. (1993) using the following simplified formula: PICi = 1− ∑p
2ij, where pij is the frequency of the jth allele for the marker, summed across all alleles for the locus. Similarity coefficient matrices were calculated for all the markers (mixed together) using a simple matching similarity algorithm. A phylogenetic dendrogram was constructed using the UPGMA method (Unweighted Pair-Group Method with arithmetical algorithms Averages). Principal coordinate analysis (PCOORDA) was also performed on the basis of the distance matrices using the standardized centered data in the NTSYS PC2.1 software (Rohlf 1998). The molecular data were standardized through NTSYS PC2.1 software. Similarities matrices were calculated using the SimInt option, decentered, and then the eigenvectors and the eigenvalues were calculated using the ordination option in the NTSYS PC program. Finally, the three-dimensional diagram was obtained.
RESULTS
Polymorphism detected by AFLP analysis
The total number of bands and number of polymorphic bands of blackberry germplasms are presented in
Table 2. AFLP analysis was conducted to compare the genetic diversity and variation of blackberry germplasms, including 52 gamma-ray treatment lines, 3 MNU treatments lines and one
R. fructicosus ×
R. parvifolius cross-bred line. Polymorphism analysis detected 589 bands generated from all 10
EcoRI+3/
MesI+3 primer combinations, of which 560 were polymorphic, representing 95.08% of the total generated bands with an average of 56 polymorphic bands per primer pair. The total number of bands per primer ranged from 26 to 91 for the primer combinations
EcoRI+ AGA/
MesI+CAT and
EcoRI+ACG/
MesI+CAT, respectively, with an average of 58.9 per primer combination. The
EcoRI+ACC/
MesI+CAT primer combination gave the higst percentage of polymorphic bands (100%), while the
EcoRI+AGA/
MesI+CAT primer produced the lowest percentage (70.27%;
Table 2).
The marker attributes for the AFLP primer combinations were summarized as GD, PIC, EMR, MI and RP (
Table 3). The GD for each primer combination ranged from 0.098 to 0.350, with a mean of 0.180. The polymorphic information content (PIC) of the primer combinations ranged from 0.081 to 0.290, with an average 0.150. The maximum values of GD (0.350) and PIC (0.290) occurred with the primer combination E-ATC/M-CTC, while the minimum values (0.098 and 0.081, respectively) were generated by the E-AGA/M-CAT primer combination. The effective multiplex ratio (EMR) of the primer combinations ranged from 25.974 (E-AGA/M-CAT) to 90.988 (E-ACG/M-CAT), with a mean of 55.970. The MI for each primer combination ranged from 3.693 (E-ACG/M-CCG) to 16.819 (E-ATC/M-CTC), with a mean of 7.780.
The correlations among the four parameters were analyzed to identify the discrimination potential of the AFLP marker combinations (
Table 4). A showed a highly significant (P≤0.01) positive correlation with GD and PIC (r
2=0.999). MI showed a significant (P≤0.05) positive correlation with GD and PIC.
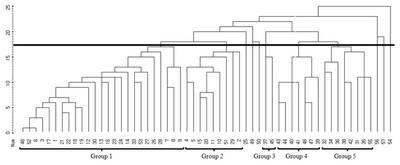
Based on the simple-matching coefficient between fifty-seven blackberry germplasms, a cluster analysis was carried out and a dendrogram was generated via the average linkage method for genetic relationships (
Fig. 1). According to cluster analysis of the AFLP markers, blackberry germplasms could be divided into two major clusters, divided at the genetic similarity of 0.800. All mutant lines could be classified into 5 categories at genetic similarity 0.777. Group 1 consisted of 24 mutant lines (No. 3, 6, 7, 8, 9, 12, 13, 14, 16, 17, 18, 19, 21, 22, 23, 24, 26, 27, 28, 30, 33, 48, 52 and 53) and the mother variety (No. 1). Group 2 consisted of 9 mutant lines (No. 2, 4, 5, 10, 11, 15, 20, 29 and 51), and group 3 included only 2 mutant lines (No. 37 and 45). Group 4 consists of 7 mutant lines (No. 39, 40, 41, 43, 44, 46 and 47), while group 5 consisted of 8 (No. 31, 32, 34, 35, 36, 38, 42 and 55). The 3 lines derived from gamma-ray treatment (No. 25, 49 and 50), the 2 lines from MNU treatments (No. 56 and 57), and the one
R. fructicosus ×
R. parvifolius cross-bred line (No. 54) were found to belong to an independent group.
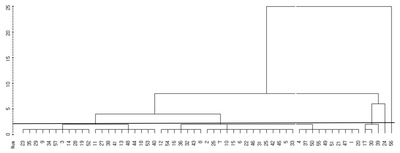
The dendrogram of blackberry germplasm on the basis of the variability of the measured morphological traits is presented in
Fig. 2. For the morphological traits, cluster analysis divided the blackberry germplasms into six clusters and two independent groups. Group 1 consisted of 11 lines (No. 3, 9, 14, 19, 23, 28, 29, 34, 52 and 57). Group 2 contained 10 lines (No. 11, 13, 18, 27, 38, 40, 41, 48, 44 and 53), and group 3 included 7 (No. 8, 12, 16, 32, 36, 43 and 54). Group 4 consisted of 14 lines (No. 2, 5, 6, 7, 10, 15, 22, 25, 26, 31, 33, 42, 45 and 46). Group 5 contained the mother variety (No. 1) along with 10 lines (No. 4, 20, 21, 37, 47, 49, 50, 51 and 55), and group 6 was made up of 3 lines (No. 17, 30 and 39). Two lines (No. 24 and 56) belonged to independent groups.
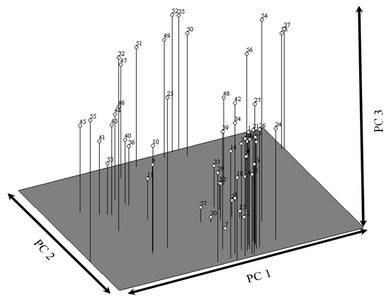
Principal coordinate analysis was used to separate all the blackberry germplasms by using the first three principal coordinates, PC1, PC2 and PC3, of the total genetic variance (
Fig. 3). According to the first principal coordinate (PC1), line 55 was represented at the lowest level while line 37 was represented at the highest level of PC1. According to the second principal coordinate (PC2), line 42 was represented at the lowest level, while lines 52 and 15 appeared at the highest level. Line 7 was observed at the lowest level of PC3, while line 52 was located at the highest level.
For the morphological date, PCOORDA analysis was constructed for the standardized de-centered data, and the 3-D diagram is presented in
Fig. 4. According to the morphological data, line 56 was represented at the lowest level of the first principal coordinate (PC1), while line 32 was at the highest level. For PC2, line 33 was found at the lowest level, while line 52 was represented at the highest level. In PC3, lines 30 and 8 line were found to represent the lowest level, while line 37 was observed at the highest level.
DISCUSSION
In this study, high levels of genetic diversity were found in the cross breed and the mutants generated by treatment with various mutagens (gamma-ray, MNU). The percentage of polymorphisms of the amplified products was 95.08%, which was similar to that reported for fifty-one cultivated samples and wild
Rubus species (
Marulanda et al., 2007). The percentage of polymorphisms detected herein was much higher than that reported in 10 blackberry (
R. ursines) and boysenberry cultivars by AFLP analysis, at 34.5% (
Ipek et al., 2009). These results indicate that mutagen treatment has the greatest influence on blackberry variation. Similar results were reported in earlier studies on
Glycine max (
Atak et al., 2004) and
Chrysanthemum (
Kang et al., 2013).
The relationships among blackberry germplasms were estimated based on the simple-matching coefficient between fifty-seven blackberry germplasms. Results of the clustering analysis revealed that the mutagen-treated line and the cross-bred
R. fructicosus ×
R. parvifolius line belonged to independent groups.
Kollmann et al. (2000) concluded that genetic variability in
Rubus is determined by the plant propagation system, and demonstrated that there is an effect of cross-pollination between polyploid
Rubus species. This type of crossbreeding positively influences the fruit quality (
Ryu et al., 2012), while also increasing the ploidy levels and taxonomic proximity (
Kollmann et al., 2000). The AFLP dendrogram showed five groups, with the genetic similarity of 0.800. This variation, due to deletion, addition and transition, might have been caused by variation in the DNA banding pattern influenced by gamma-ray and MNU treatment. The findings of this study indicate that mutant lines have high genetic diversity, and can be effectively utilized as materials for the improvement of breeding. In addition, the morphological dendrogram indicated an unclear pattern of division among the groups based on AFLP analysis. The information generated from this study provides a clearer picture of their genetic relationships. It may possibly be developed into a standard classification procedure in the future, and will be useful in identifying efficient strategies for the sustainable management of the genetic resources of
Rubus. Marulanda et al. (2007) reported that AFLP markers produced several bands or private alleles, which were exclusive to each species and serve to quickly identify genotypes or interspecific hybrids of interest in the early stages of improvement programs in
Rubus.
High numbers of polymorphisms is the main criterion discriminating germplasms. To detect the best primer combination for AFLP marker classification of germplasm, several researchers have employed GD, PIC, EMR and MI (
Kim et al., 2013;
Anderson et al., 1993;
Sathyanarayana et al., 2011) The highly significantly correlation with GD and PIC (r
2=0.999) in the present study agreed with the studies of
Sathyanarayana et al. (2011) and
Kim et al. (2013). In addition,
Sathyanarayana et al. (2011) defined MI as a measure of maker diversity. Like we also found a significant (P≤0.05) positive correlation with GD and PIC in this study. In the morphological analysis, both cluster analysis and principal coordinate analysis (PCOORDA) separated the blackberry germplasm in a similar fashion. For example, lines 56 and 24 were separated apart from all other lines in both cluster analysis and PCOORDA (
Fig. 2 and
4). These results are in agreement with those obtained by
Amsellem et al. (2000) in a study of the genetic diversity of
Rubus alceifolius. The selection of genotypes from blackberry with higher levels of genetic diversity should be considered in blackberry breeding programs. The results of this study are beneficial to the blackberry germplasm database, and to breeding programs for blackberry.
Distinct patterns were observed for the dissimilarity matrices estimated with morphological analysis and molecular markers. Molecular markers represent a sample of the plant genome, and are used to make an inference about the whole genome (
Becelaere et al., 2005). Morphological dissimilarity is influenced by the environmental variance, non-additive effects, correlation between characters, heterogeneity between variance and covariance, and genotype and environment interaction (
Hall HK and Brewer, 1993).
ACKNOWLEDGEMENTS
This work was supported by a grant from the KAERI, Republic of Korea.
Fig. 1Dendrogram illustrating genetic relationships among blackberry germplasms generated by cluster analysis with the average linkage method.

Fig. 2Dendrogram illustrating morphological relationships among blackberry germplasms generated by cluster analysis with the average linkage method (
Ryu et al., 2012).

Fig. 33-Dimensional PCOORDA analysis of blackberry germplasm obtained by AFLP analysis.

Fig. 43-Dimensional PCOORDA analysis of blackberry germplasm obtained by morphological analysis.
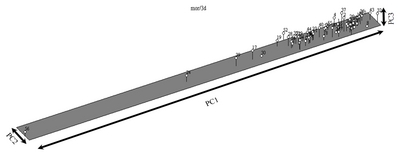
Table 1The origin of 57 genotypes of
Rubus fructicosus L used in this study (
Ryu et al., 2012).
Table 1
|
No. |
Lines |
Treatment |
|
1 |
V-9 |
control |
|
2 |
γ-1 |
γ-ray* 80 Gy |
|
3 |
γ-2 |
γ-ray 80 Gy |
|
4 |
γ-4 |
γ-ray 80 Gy |
|
5 |
γ-A101 |
γ-ray 60 Gy |
|
6 |
γ-A202 |
γ-ray 60 Gy |
|
7 |
γ-A219 |
γ-ray 60 Gy |
|
8 |
γ-B101 |
γ-ray 80 Gy |
|
9 |
γ-B116 |
γ-ray 80 Gy |
|
10 |
γ-B122 |
γ-ray 80 Gy |
|
11 |
γ-B201 |
γ-ray 80 Gy |
|
12 |
γ-B205 |
γ-ray 80 Gy |
|
13 |
γ-B221 |
γ-ray 80 Gy |
|
14 |
γ-B303 |
γ-ray 80 Gy |
|
15 |
γ-C101 |
γ-ray 60 Gy |
|
16 |
γ-C105 |
γ-ray 60 Gy |
|
17 |
γ-C122 |
γ-ray 60 Gy |
|
18 |
γ-C129 |
γ-ray 60 Gy |
|
19 |
γ-C137 |
γ-ray 60 Gy |
|
20 |
γ-C209 |
γ-ray 60 Gy |
|
21 |
γ-C216 |
γ-ray 60 Gy |
|
22 |
γ-C225 |
γ-ray 60 Gy |
|
23 |
γ-C234 |
γ-ray 60 Gy |
|
24 |
γ-D109 |
γ-ray 40 Gy |
|
25 |
γ-D120 |
γ-ray 40 Gy |
|
26 |
γ-D129 |
γ-ray 40 Gy |
|
27 |
γ-D144 |
γ-ray 40 Gy |
|
28 |
γ-D210 |
γ-ray 40 Gy |
|
29 |
γ-D215 |
γ-ray 40 Gy |
|
30 |
γ-F153 |
γ-ray 20 Gy |
|
31 |
γ-F205 |
γ-ray 20 Gy |
|
32 |
γ-F207 |
γ-ray 20 Gy |
|
33 |
γ-F211 |
γ-ray 20 Gy |
|
34 |
γ-F242 |
γ-ray 20 Gy |
|
35 |
γ-F250 |
γ-ray 20 Gy |
|
36 |
γ-G103 |
γ-ray 60 Gy |
|
37 |
γ-G202 |
γ-ray 60 Gy |
|
38 |
γ-G204 |
γ-ray 60 Gy |
|
39 |
γ-G213 |
γ-ray 60 Gy |
|
40 |
γ-G214 |
γ-ray 60 Gy |
|
41 |
γ-G215 |
γ-ray 60 Gy |
|
42 |
γ-S1 |
γ-ray 40 Gy |
|
43 |
γ-S2 |
γ-ray 40 Gy |
|
44 |
γ-S3 |
γ-ray 40 Gy |
|
45 |
γ-S4 |
γ-ray 40 Gy |
|
46 |
γ-S5 |
γ-ray 40 Gy |
|
47 |
γ-S6 |
γ-ray 40 Gy |
|
48 |
γ-S7 |
γ-ray 40 Gy |
|
49 |
γ-S8 |
γ-ray 40 Gy |
|
50 |
γ-S9 |
γ-ray 40 Gy |
|
51 |
γ-S10 |
γ-ray 40 Gy |
|
52 |
γ-S11 |
γ-ray 40 Gy |
|
53 |
γ-S12 |
γ-ray 40 Gy |
|
54 |
Cross-3 |
V-9 × R. parvifolius
|
|
55 |
MNU-3 |
MNUz) (Seed) |
|
56 |
MNU-11 |
MNU (Seed) |
|
57 |
MNU-32 |
MNU (Seed) |
Table 2Sequence of primers, number of total bands and number of polymorphic bands of amplification products generated with 10 AFLP primers across blackberry germplasm.
Table 2
|
Primer pair |
No. of total bands |
No. of polymorphism bands |
Polymorphism rate(%) |
|
1 |
E-ATC/M-CTC |
59 |
58 |
98.31 |
|
2 |
E-AGA/M-CAT |
90 |
88 |
97.78 |
|
3 |
E-AAT/M-CTA |
45 |
43 |
95.56 |
|
4 |
E-ACA/M-CAT |
46 |
43 |
93.48 |
|
5 |
E-ACG/M-CCG |
35 |
33 |
94.29 |
|
6 |
E-ACG/M-CAT |
92 |
91 |
98.91 |
|
7 |
E-ACG/M-CCA |
48 |
44 |
91.67 |
|
8 |
E-ACC/M-CAT |
72 |
72 |
100.00 |
|
9 |
E-ACC/M-CGA |
65 |
62 |
95.38 |
|
10 |
E-AGA/M-CAT |
37 |
26 |
70.27 |
|
Total |
589 |
560 |
95.08 |
Table 3Attributes of markers produced by 10 AFLP primer combinations.
Table 3
|
Primer pair |
Gene Diversity (GD) |
Polymorphic Information Content(PIC) |
Fraction of polymorphic marker(β) |
Multiplex ratio(n) |
EMRx) (E=β×n) |
Marker Index (MI) |
|
Ez)-ATC/My)-CTC |
0.350 |
0.290 |
0.983 |
59 |
57.997 |
16.819 |
|
E-AGA/M-CAT |
0.098 |
0.081 |
0.977 |
90 |
87.930 |
7.122 |
|
E-AGC/M-CTA |
0.118 |
0.096 |
0.955 |
45 |
42.975 |
4.126 |
|
E-ACA/M-CAT |
0.230 |
0.188 |
0.934 |
46 |
42.964 |
8.077 |
|
E-ACG/M-CCG |
0.145 |
0.112 |
0.942 |
35 |
32.970 |
3.693 |
|
E-ACG/M-CAT |
0.215 |
0.178 |
0.989 |
92 |
90.988 |
16.196 |
|
E-ACG/M-CCA |
0.106 |
0.087 |
0.916 |
48 |
43.968 |
3.825 |
|
E-ACC/M-CAT |
0.116 |
0.094 |
1.000 |
72 |
72.000 |
6.768 |
|
E-ACC/M-CGA |
0.135 |
0.111 |
0.953 |
65 |
61.945 |
6.876 |
|
E-AGA/M-CAT |
0.303 |
0.242 |
0.702 |
37 |
25.974 |
6.286 |
|
Mean |
0.180 |
0.150 |
0.940 |
58.90 |
55.970 |
7.980 |
Table 4Significant correlations between four discriminatory power parameters.
Table 4
|
GD |
PIC |
EMR |
MI |
|
GD |
1.000 |
|
|
|
|
PIC |
0.999**
|
1.000 |
|
|
|
EMR |
−0.235 |
−0.205 |
1.000 |
|
|
MI |
0.654*
|
0.680*
|
0.527 |
1.000 |
References
- Alice LA, Campbell CS. 1999. Phylogeny of Rubus (Rosaceae) based on nuclear ribosomal DNA internal transcribed spacer region sequences. American Journal of Botany. 86: 81-97.
- Alice LA. 2002. Evolutionary relationships in Rubus (Rosaceae) based on molecular data. Acta Horticulturae. 585: 79-83.
- Amsellem L, Noyer JL, Le Bourgeois T, Hossaert-Mckey M. 2000. Comparison of genetic diversity of the invasive weed Rubus alceifolius Poir. (Rosaceae) in its native range and in areas of introduction, using amplified fragment length polymorphism (AFLP) markers. Molecular Ecology. 9: 443-455.
- Anderson JA, Churchill JE, Autrique SD, Tanksley S, Sorrells ME. 1993. Optimizing parental selection for genetic linkage maps. Genome. 36: 181-188.
- Asker S. 1979. Progress in apomixis research. Hereditas. 91: 231-240.
- Atak C, Alikamanoglu S, Acik L, Canbolat Y. 2004. Induced of plastid mutations in soybean plant (Glycine max L. Merrill) with gamma radiation and determination with RAPD. Mutation Research. 556: 35-44.
- Bae CH, Abe T, Matsuyama N, Fukunishi N, Nagata T, Nakano T, Kaneko Y, Miyoshi K, Matsushima H, Yoshida S. 2001. Regulation of chloroplast gene expression is affected in ali, a novel tobacco albino mutant. Ann Bot. 88: 545-553.
- Becelaere GV, Lubbers EL, Paterson AH, Chee P. 2005. Pedigree vs. DNA marker-based genetic similarity estimates in cotton. Crop Sci. 45: 2281-2287.
- Donini B. 1982. Mutagenesis applied to improve fruit trees: techniques, methods and evaluation or radiation induced mutations. Induced Mutations in Vegetatively Propagated Plants. pp. 29-36. IAEA. Vienna.
- Fang G, Hammar S, Grumet R. 1992. A quick inexpensive method of removing ploysaccharides from plant genomic DNA. Biotechniques. 13: 52-55.
- Graham J, McNicol RJ. 1995. An examination of the ability of RAPD markers to determine the relationships within and between Rubus species. Theoretical and Applied Genetics. 90: 1128-1132.
- Graham J, Squire GR, Marshall B, Harrison RE. 1997. Spatially dependent genetic diversity within and between colonies of wild raspberry Rubus idaeus detected using RAPD markers. Molecular Ecology. 6: 1001-1006.
- Gustafsson A. 1943. The genesis of the European blackberry flora. Acta Universitatis Lund. 39: 1-200.
- Hall HK, Brewer . 1993. Breeding Rubus cultivars for quality and diversity. Acta Horticult. 352: 329-337.
- Hiroyasu Y, Akemi S, Yoshihiro H, Konosuke D, Atsushi T, Toshikazu M. 2009. Mutation induction with ion beam irradiation of lateral buds of chrysanthemum and analysis of chimeric structure of induced mutants. Euphytica. 165: 97-103.
- van Hulst RGMD, Mes THM, Den Nijs JCM, Bachmann K. 2000. Amplified fragment length polymorphism (AFLP) markers reveal that population structure of triploid dandelions (Taraxacum officinale) exhibits both clonality and recombination. Mol Ecol. 9: 1-8.
- Ipek A, Barut E, Gulen H, Ipek M. 2009. Genetic diversity among some blackberry cultivars and their relationship with Boysenberry assessed by AFLP Markers. Biotechnology. 8(19): 4830-4834.
- Janick J, Moore JN. 1975. Advances in fruit breeding. Purdue Univ. Press. West Lafayette.
- Kang EJ, Lee YM, Sung SY, Ha BK, Kim SH, Kim DS, Kim JB, Kang SY. 2013. Analysis of the Genetic Relationship of Gamma-irradiated in vitro Mutants Derived from Standard-type Chrysanthemum cv. Migok. Hort Environ Biotechnol. 54(1): 76-81.
- Kim MJ, Kim HS, Lee UK. 2002. Selection of Korean black raspberry (Rubus coreans Miq.) for larger fruit and high productivity. Kor For Soc. 91(1): 96-101.
- Kim SH, Lee JS, Lee GJ, Kim JS, Ha BK, Kim DS, Kim JB, Kang SY. 2013. Analyses of genetic diversity and relationship in four Calanthe taxa native to Korea using AFLP markers. Hort Environ Biotechol. 54(2): 148-155.
- Kollmann J, Steinger T, Roy BA. 2000. Evidence of sexuality in European Rubus (Rosaceae) species based on AFLP and allozyme analysis. Botany. 87: 1592-1598.
- Lu J, Knox MR, Ambrose MJ, Brown JKM, Ellis THN. 1996. Comparative analysis of genetic diversity in pea assessed by RFLP- and PCR-based methods. Theor Appl Genet. 93: 1103-1111.
- Marulanda ML, Lopez AM, Aguilar SB. 2007. Genetic diversity of wild and cultivated Rubus species in Colombia using AFLP and SSR markers. Crop Breeding and Applied Biotechnol. 7: 242-252.
- Menz MA, Klein RR, Unruh NC, Rooney WL, Klein PE, Mullet JE. 2004. Genetic diversity of public inbreeds of sorghum determined by mapped AFLP and SSR markers. Crop Sci. 44: 1236-1244.
- Monte-Corvo L, Cabrita L, Oliveiria CM, Leitão J. 2000. Assessment of genetic relationship amomg Pyrus species and cultivars using AFLP and RAPD markers. Genet Resour Crop Evol. 47: 257-265.
- Nybom H. 1988. Apomixis versus sexuality in blackberries (Rubus subgen. Rubus, Rosaceae). Plant Systematics and Evolution. 160: 207-218.
- Parent JG, Fortin MG. 1993. Identification of raspberry cultivars by random amplified polymorphic DNA (RAPD) analysis. Plant Science. 73: 1115-1122.
- Parent JG, Page D. 1998. Identification of raspberry cultivars by sequence characterized amplified region DNA analysis. Hortscience. 33: 140-142.
- Predieri S, Bertazza G, Gennari F. 1998. Pear cv. Bartlett mutants selection for high fruit quality: analysis of soluble sugars and organic acids. Atti IV Giornate Scientifiche. SOI, Sanremo Aprile. 65-66.
- Rohlf FJ. 2000. NTSYS-pc numerical taxonomy and multivariate system (v.2.1). User guide. Exeter Software. Setauket, New York.
- Russel TR, Fuller JD, Macaulay M, Hatz BG, Jahoor A, Powell WP, Waugh R. 1997. Direct comparison of level of genetic variation among barley accessions detected by RFLPs, AFLPs, SSRs and RAPDs. Theor Appl Genet. 95: 714-722.
- Ryu JH, Kim DS, Ha BK, Kim JB, Kim SH, Jeong IY, Jo HJ, Kim EY, Kang SY. 2012. Growth Characteristics and Morphological Variation Analysis of Mutant Lines derived from Gamma-ray and Chemical Mutagen Treatments in Rubus fructicosus L. Radiat Ind. 6(3): 257-265.
- Sathyanarayana N, Leelambika M, Mahesh S, Jaheer M. 2011. AFLP assessment of genetic diversity among Indian Mucuna accessions. Physiol Mol Biol Plants. 17(2): 171-180.
- Thompson MM. 1997. Survey of chromosom number in Rubus (Rosaceae: Rosoideae). Ann Mol Bot Garden. 84: 129-165.
- Van Harten AM. 1998. Mutation Breeding: Theory and Practical Applications. Cambridge Univ. Press. Cambridge.
- Visser T, Verhaegh JJ, De Vries D. 1971. Pre-selection of compact mutants induced by X-ray treatment in apple and pear. Euphytica. 20: 195-207.