Abstract
Mungbean is one of the prominent pulse crops in Indonesia since the mungbean seeds are highly nutritious and has become an important part of the diet for the community. The black-seeded mungbean highly nutritious as it contains high anthocyanin content. We have developed a black-seeded mungbean lines that need to be evaluated for drought tolerance. Drought tolerance is important as mungbean is usually cultivated during the drought-prone dry season that leads to total loss. This study aimed to (1) determine the effectiveness of drought tolerance indices to select drought tolerance in black-seeded mungbean, (2) reveal the drought indices most suitable to select drought-tolerant, high- yielding black-seeded mungbean lines. This study was conducted during dry season in the Field Laboratory of Universitas Nusa Cendana. A Split-Plot design was employed, consisting of irrigation frequencies as the main plot and mungbean genotype as the sub- plot treatments. The main plot consisted of three levels, i.e. irrigation every day (I1), every four days (I2), and every seven days (I3), and the subplot consisted of 23 mungbean genotypes. Seed yields under non-stress and stress conditions were used to calculate the drought indices. The data were subjected to ANOVA, PCA and correlation analysis. There were significant variations in seed yields among genotypes under different drought indices. The indices MP, GMP, STI, HARM, MRP, SSI, YSI, MSTIK1, and MSTIK2 are suitable for selection of drought-tolerant, high-yielding mungbean lines. V9.HT, V10.HT, V11.HT, V16.HT, V18.HT, V19.HT, V20.HT, V22.HT were potential for further evaluation as promising drought tolerant, high yielding varieties.
-
Key words: Selection, Black-Seeded, Mungbean, Yield, Drought tolerance, Indices
Introduction
The average mungbean productivity in Indonesia remains low (~0.93 t/ha;
Agriculture 2025), primarily due to various factors such as low-yielding cultivars, drought stress, pest and disease infestations, etc. Among these, drought stress is globally recognized as the main limiting factor that hampers mungbean growth and yield (
Bangar et al. 2019;
Singh et al. 2021). These problems can be solved by using high-yielding varieties with tolerance to drought stress, pests and diseases, which can be developed through hybridization employing superior parental varieties.
The recently released Indonesian mungbean varieties are all having a green seed coat color (
BSIP 2024) and no black seed coat color has been registered as a released variety to date. Similarly, the globally cultivated mungbean varieties are those with green seed color. In contrast, breeding work on mungbean with black seed coat color has been reported very limitedly (
Khattak et al. 2022). Although there is limited breeding work on the black-seeded mungbean, the nutritional values of this mungbean genotype are becoming more popular and promising, as the black seed coat contains polyphenol compounds that offer additional health-promoting benefits compared to the green-seeded one. The polyphenol compound mostly found in the black seed coat of the mungbean is the flavonoid subclass anthocyanin, which exhibits health-promoting effects such as antioxidant, anti-tumor, anti-cancer, anti-aging, and anti-diabetic properties (
Randhir et al. 2007;
Yousaf et al. 2021). A previous study by Yao (
Yao et al. 2013) showed that anthocyanin was only found in the black-seeded mungbean. Furthermore, (
Wang et al. 2021) also discovered that the black-seeded mungbean produced the highest levels of flavonoids (anthocyanins) and phenolic acids, and also the highest antioxidant activity. Thus, it can be used as a natural source of antioxidants for the development of functional health foods.
We have developed a segregating mungbean population derived from crosses between Fore Belu (green-seeded) and Local Sabu (black-seeded;
Mau et al. 2023), and the successive generations have been evaluated for several superior agronomic traits and potential for further selection as superior lines (
Mau et al. 2024). Some of the selected lines are black-seeded, which are presumably rich in anthocyanins that serve various health-promoting properties (
Wang et al. 2024;
Yang et al. 2020). Thus, these mungbean lines can serve as a gene pool for improvement of drought tolerance, as well as the production of a superior black-seeded mungbean variety that is currently not available in Indonesia (
BSIP 2024). This may provide added value of the future superior mungbean varieties to be proposed.
In Indonesia, the mungbean crop is typically cultivated during the dry season, following the first crops, such as rice and corn (
Pratiwi et al. 2017). For semi-arid dryland regions, such as the East Nusa Tenggara (ENT) Province, water deficit during crop growth is one of the main reasons for low mungbean productivity. The effect is more pronounce as the drought stress most frequently occurs during the most critical stages of the plant, i.e., the flowering and post flowering stages. Thus, it is crucial to develop mungbean genotypes that are tolerant to drought stress/water deficit. Improvement of mungbean genotypes with drought tolerance relies mainly on the gene pool containing the desired trait. Once the gene pool contains the drought tolerance is available, the improvement of drought tolerance can be done by designing the most effective selection strategy through understanding and evaluation of plant growth and yield performances under drought/water stress conditions (
Abenavoli et al. 2016;
Anower et al. 2017;
Sarkar et al. 2013).
The selection of drought tolerance in various crops has frequently used indirect selection indicators, such as morphological and physiological responses (
Kumar et al. 2015;
Purbajanti et al. 2017;
Singh et al. 2017). However, these methods are labor- and resource-intensive. Thus, the indirect selection of drought tolerance, employing stress tolerance indices based on crop yields, is considered more effective and rapid. Multiple drought tolerance indices that had been used for selection of drought tolerance in various crops include, among others, stress susceptibility index (SSI;
Fischer et al. 1978), mean productivity (MP;
Rosielle et al. 1981), stress tolerance index (STI), geometric mean productivity (GMP;
Fernandez 1992), mean relative performance (MRP;
Hossain et al. 1990), modified STI1 (MISTIk1) and modified STI2 (MSTIK2;
Farshadfar et al. 2003) and harmonic mean yield (HARM;
Dadbakhsh et al. 2011).
In mungbean, Azimov (
Azimov et al. 2024) employed drought tolerance indices, including MP, GMP, STI, HARM, SSI, SSPI, and the tolerance index (TOL), to identify drought-tolerant genotypes. Furthermore, Kumar (
Kumar et al. 2020) evaluated various stress tolerance indices to identify heat-tolerant mungbean genotypes using stress indices such as MP, GMP, SSI, TOL, yield index (YI) and superiority measure (SM) based on seed yield under heat-stress and non-stress conditions. In cowpea, Mafakheri (
Mafakheri et al. 2015) also employed TOL, MP, GMP, SSI, STI, YI and yield stability index (YSI) to identify drought-tolerant cowpea varieties.
Until recently, more than 20 drought tolerance indices have been used to identify drought-tolerant genotypes in various crops (
Ali et al. 2016;
Bahar et al. 2010;
Bennani et al. 2017;
Farshadfar et al. 2012;
Golbashy et al. 2010;
Mau et al. 2015;
Mau et al. 2019b;
Wulansari et al. 2025) with varying degrees of effectiveness depending on the crop species. These indices, however, have not been used to assess drought tolerance in black-seeded mungbean. In mungbean, tolerance indices that had been proven effectively used in assessing the drought tolerance included MP, GMP, STI, HARM, SSI, SSPI, and the tolerance index (TOL;
Azimov et al. 2024). Similarly, Kumar (
Kumar et al. 2020) also effectively used MP, GMP, SSI, TOL, yield index (YI) for evaluation of drought tolerance in mungbean. As a comparison, Mafakheri (
Mafakheri et al. 2015) also employed TOL, MP, GMP, SSI, STI, YI and yield stability index (YSI) to identify drought-tolerant cowpea varieties. In this study, we evaluated a subset of the most commonly used and biologically meaningful indices (specifically, MP, GMP, SSI, STI, HM, YSI, MISTIK1, MSTIK2, YSI, and TOL). Not all ~20 reported indices were included due to high multicollinearity among some indices and their limited added value for yield-based selection in mungbean. Thus, this study aimed to (1) assess the effectiveness of drought tolerance indices for selection of drought tolerance in black-seeded mungbean, and (2) identify the drought-tolerant and high-yielding black-seeded mungbean genotypes based on the drought indices employed.
The identification of effective and reliable drought tolerance indices in this study will facilitate selection through direct phenotypic breeding, enabling the development of high-yielding, drought-tolerant mungbean varieties suited to rainfed and drought-prone environments. Most of the drought indices employed had strong correlation with yield under both stress and non-stress conditions, and ability to discriminate genotypes with practical breeding objectives, i.e., balancing drought tolerance and yield/productivity.
Materials and Methods
Research location
This research was conducted at the Field Agriculture Laboratory of Universitas Nusa Cendana, Kupang, East Nusa Tenggara, Indonesia, during the dry season (July to September) in 2024. The research site was located at 10°15'32.0'' S Latitude and 123°36'59.7'' E longitude, approximately 110 m above sea level (asl). The soil type at the location was Entisol (Vertisol, according to the USDA classification).
Plant materials
Research materials used in the present study consisted of 23 mungbean genotypes, which included 17 black-seeded F
6 lines, two local parental cultivars (Fore Belu and Local Sabu) from East Nusa Tenggara Province, Indonesia, and five reference/check varieties (Vima 1, Vima 3, Vima 4, and Kutilang) kindly provided by the Indonesian Legume and Tuber Crop Research Institute (ILETRI). All treatments consisted of two replicates, and in total, 46 experimental units were observed. The 23 F
6 lines are the outcome of a pedigree selection method carried out throughout F
3 - F
5 generations of Fore Belu x Local Sabu crosses. As the black seed coat color is controlled by a single co-dominant gene (
Mau et al. 2023), thus, selected lines are homozygous for seed coat color trait indicated by their stable expression across generations. Meanwhile, the parental cultivars (Fore Belu and Local Sabu) were included in the study as they have been adapted to the local environment, which performance can be used as comparison. The five check varieties (Vima 1, Vima, 3, Bima, 4, Vima 5, Kutilang) were included as commercial standards for yield and quality comparison, serving as controls/references to evaluate the relative performance of the F
6 lines under the same conditions. The inclusion of these check varieties is in line with the Indonesia regulation on evaluation of new candidate varieties.
Soils type of the planting field was Vertisol with a loamy texture. Before the planting field was plough and prepared for plot arrangement, soil samples were taken to determine the soil moistures at field capacity level (using a gravimetry method) and the permanent wilting point (using mungbean seedling as the test plant).
The planting field was first cleared, and 46 plots, each 1.5 m×1.5 m in size, were prepared for growing the mungbean plants. Between-plot spacing was 50 cm, and between-block spacing was 1.0 m. The plots were irrigated until the field capacity level before planting the mungbean seeds. The soil moisture contents of field capacity level and permanent witling point were, respectively, 42% and 18%. Mungbean seeds were planted manually in planting holes of 25 cm×20 cm plant spacing. Two seeds were grown in each planting hole, and after 10 days after planting, only one plant was retained for the evaluation. Irrigation was provided based on the treatments.
The mungbean plants were provided with a compound NPK (16:16:16) fertilizer at a rate of 67.50 g/2.25 m2 plot (equivalent to 300 kg/ha), with half of the fertilizer was applied at planting time and the other half was applied 21 days after planting.
Evaluation of drought tolerance
Drought tolerance evaluation was done during the dry season to allow an appropriate setting of drought stress. The experiment employed a Split-Plot design, consisting of irrigation level (I) as the main plot and mungbean genotype (V) as the subplot treatments. The main plot consisted of three irrigation frequencies, i.e., I1: non-stress/normal irrigation every day, I2: irrigation every four days, and I3: irrigation every seven days, while the subplot treatment consisted of 23 mungbean genotypes.
In normal/non-stress conditions (I1), the plants were watered daily until the field capacity level was reached, started from the time of planting until one week before harvest. In the stress conditions (I2 and I3), the plants were irrigated on a daily basis until 100% field capacity level, started from the time of planting until the initial flowering stage (28 days after planting), which then followed by irrigation at every four days (I2) and irrigation at every seven days (I3), started from the early flowering stage until one week before harvesting.
The irrigation of the drought stress treatments was provided based on calculated water loss through evapotranspiration, employing mean Et0 values in the research area during the last five years (5.24-5.28 mm/day during July to September, average 5.26 mm/day) and the mungbean plant coefficient (Kc value) during the flowering and reproductive stages (1.1). Thus, the Etc value was about 5.8 mm/day, equals to 5.8 L/m2/day. The amount of water required to resume the 100% field capacity level of the treatment plots after the drought stress treatments was adjusted by considering the plot size (2.25 m2), irrigation interval (days) of each treatment, and the soil moisture content at the day of irrigation treatment provided. The soil moisture content in planting plots was determined using a soil moisture sensor. On average, the soil moisture contents of the treatments at the day of irrigation provided were, respectively, 38.4%, 31.6%, and 24.7% for I1, I2, and I3. These moisture contents correspond to, respectively, 91,4%, 75.2%, and 58.8% of the field capacity level (42%). Meanwhile the soil moisture content of the permanent wilting point was about 18%.
Observation and data analysis
The primary observed variable was dry seed weight per 2.25 m
2 plot, which was then converted into seed yield/ha (t/ha). The seed yields in non-stress and stress treatments included Ys (potential yield of a given genotype under stress conditions), Yp (potential yield of a given genotype under non-stress condition), Ȳs (average yield of all genotypes under stress condition), and Ȳp (average yield of all genotypes under non-stress condition) which were used to calculate the drought tolerance indices employing equation in
Table 1. The mean yields of all genotypes under stress (Ȳs) and non-stress (Ȳp) conditions were also used to calculate the stress intensity following the formula: SI = (1 - (Ȳs/Ȳp);
Fischer et al. 1978).
Seed yield data and calculated drought tolerance indices were subjected to ANOVA and correlation analysis to reveal the treatment effect and the relationship among the observed/calculated variables. The model equation for the split plot design is as follows:
The data were also subjected to Cluster analysis and Principal Component Analysis to group the genotypes based on their tolerance level and to reveal the variables most responsible for the variation observed in the dataset. The split-plot ANOVA was carried out using a statistical analysis package GenStat version 12 software (
VSNi 2012) while correlation analysis, cluster analysis and Principal Component Analysis were performed using PAST (
Hammer et al. 2001).
Results
Seed yields and drought tolerance indices
The seed yield data were recorded from mungbean plants grown under non-stress (irrigation provided daily) and drought-stress conditions, i.e., irrigation provided every four days (Stress Level 1, SL1) and every seven days (Stress Level 2, SL2). A two-way split-plot ANOVA (
Table 2) reveals that seed yields under non-stress and stress conditions (Yp and Ys, respectively) were highly significantly affected (
p<0.001) by the stress level. At the same time, one-way ANOVA suggests that the seed yield at normal (non-stress) conditions (Yp) alone was highly significantly affected by the genotype of mungbean (
p<0.001). The interaction between stress level and genotype had a highly significant effect on seed yield under stress conditions (Ys;
p<0.001). Still, the overall mean seed yields of all genotypes under SL1 and SL2 did not differ substantially (
p>0.05). The lack of significance in overall mean yield across the two stress levels reflect moderate drought intensities imposed, where many genotypes maintained reasonable yield performance. The stress intensity (SI = 1-(mean Ys/mean Yp)) is a standard metric in drought studies (
Fischer et al. 1978), where SI values of ~0.4-0.5 typically correspond to moderate field drought, allowing discrimination of tolerance without complete yield loss. In addition, the absence of non-significant mean seed yield between stress and non-stress condition may likely be caused by a highly variable responses of the genotypes, in which, a high yield reduction in certain genotypes can be compensated by a low/negligible yield reduction in other genotype, resulting in non-significant mean seed yield under the two drought stress conditions.
The interaction between drought stress level (SL) and genotype (G) had a highly significant effect on all drought indices, except MSTIK1, indicating that the magnitude of the drought indices varied with changes in both drought stress level and genotype. The genotype treatment also had a highly significant effect on all the drought indices, indicating that the tested genotypes performed differently under the employed drought indices. The one-way ANOVA (
Table 2) shows that the genotype significantly affected each drought tolerance index under each stress level, indicating that the genotype performed differently under each of the two stress levels imposed.
The mean seed yield under normal conditions was the highest (2.49 t/ha;
Table 3), which can be considered as the potential yield (Yp). The mean seed yield under stress conditions (Ys) at SL1 (1.45 t/ha) was 41.7% lower than the potential yield, while that at SL2 (1.25 t/ha;
Table 3) was 49.8% lower than the potential yield. The stress intensities at SL1 (0.42), and SL2 (0.51) did not significantly differ between stress levels (SL1 and SL2) indicating the same level of drought intensity. This is in line with Fischer and Maurer (
Fischer et al. 1978), that the SI values of ~0.4-0.5 are considered as moderate field drought. Thus, only the data from the higher stress level, i.e., SL2 (0.51 stress intensity), were used for the evaluation described in this work.
Table 3 shows that the mean seed yields at non-stress conditions ranged from 1.35 to 3.44 t/ha (mean: 2.49 t/ha) while those at stress intensity (SL2, 0.51) ranged from 0.18 to 2.18 t/ha (mean: 1.14 t/ha). The highest mean seed yield was observed in V19.HT and V9.HT under non-stress and stress conditions, respectively. The lowest mean seed yields were observed in V21.HT under both non-stress and stress conditions. Mean seed yield differences among tested genotypes under varying drought stress levels indicate a significant interaction effect of genotype by environment, where the seed yield trait depends significantly on both the genotype and the drought stress condition.
In this study, we also included the parental lines as they have been commonly cultivated in the study area, thus they can serve as comparisons. Meanwhile, the check varieties used were the commercial varieties that have been released by the Indonesian Government as superior high-yielding varieties, which mean yield serve as standard for registration of new varieties. Only the promising varieties with mean yield similar to or above that of these check varieties under non-stress condition can be registered as new superior varieties. The study results showed that Vima 1 produced the highest yield among the check varieties under both stress and non-stress conditions. Meanwhile, the parental line Local Sabu (2.48 t/ha) produced the highest seed yield under non-stress conditions among the parental and check varieties, indicating its good adaptation to the study area. Seed yields of 11 F6 lines surpassed those of the parental and the check varieties under normal conditions, while 12 F6 lines surpassed those of the parental and check varieties under stress conditions.
The tested mungbean genotypes varied greatly in their drought tolerance indices (
Table 3). The drought tolerance index MP selected 12 genotypes whose seed yields under non-stress and stress conditions were higher than those of the best check variety, Vima 1 (1.83 t/ha;
Table 3). Similar to the MP index, the GMP index also selected the same 12 genotypes (
Table 2) based on their geometric mean yield performance above that of the best check variety, Vima 1 (GMP = 1.72). The stress tolerance index (STI) was used to select for drought-tolerant and high-yielding genotypes under both non-stress and stress conditions, as indicated by STI values of ≥1.0. Based on the STI, only one F
6 line, i.e., V9.HT, was selected as drought-tolerant. However, ten F
6 lines exhibited STI values of 0.5 - <1.0 and were higher than the best national check variety (
Table 3), which can also be considered as drought-tolerant.
In contrast to STI, which selects drought-tolerant genotypes based on a high STI value (≥1.0), the stress susceptibility index (SSI) selects drought-tolerant genotypes based on an SSI value of ≤0.5, indicating a stable yield between non-stress and stress conditions. This indicates that STI emphasizes high yield in both conditions while SSI emphasizes susceptibility, where the lower the SSI values the lower the susceptibility (higher tolerance level). Thus, these two indices are complementary to select for drought tolerant, high yielding genotypes. Based on the SSI index, only two F6 lines were selected, i.e., V15.HT and V12.HT. These genotypes were selected because they could produce somewhat stable seed yields of about 2.10 and 2.25 t/ha in non-stress conditions, respectively, and 1.78 t/ha in stress conditions. Yield stability index (YSI) selected nine F6 lines based on their stable seed yield performance under non-stress and stress conditions. Genotypes with a YSI index of 0.5 or greater are considered drought-tolerant. None of the parental and check varieties included in this study was drought-tolerant based on the YSI index.
The drought indices MRP, HARM, MSTIK1, MSTIK2, and TOL do not provide a range of index values suitable for preferred genotype selection. For MRP, HARM, MSTIK1, and MSTIK2, the higher the values of the indices, the more stress-tolerant; while for TOL, the lower the value, the more stress-tolerant, and vice versa. TOL index favours genotypes stable under stress but may select lower-potential yields. Thus, the genotypes/F6 lines with a higher index value of MRP, HARM, MSTIK1, and MSTIK2, or lower index values of TOL, compared to those of the best check varieties, can be selected as drought-tolerant genotypes.
Employing the MRP index resulted in 12 genotypes being selected as the most drought-tolerant. Meanwhile, the HARM, MSTIK1, and MSTIK2 indices identified 11 genotypes as drought-tolerant, nine of which were also selected by the same three indices. Interestingly, the 12 genotypes selected by MRP were similar to those selected by both MP and GMP indices. The nine genotypes selected using HARM, MSTIK1, and MSTIK2 indices were also similar to those selected by either MP, GMP, or MRP as drought-tolerant genotypes (
Table 3). This suggests that the indices employed are equally effective and can be used interchangeably to select drought-tolerant black-seeded mungbean genotypes, as these drought tolerance indices have been successfully employed in other crops to select and identify the genotypes that maintain relatively high and stable performance in both stress and non-stress conditions.
The study results show that six of the tested genotypes (V9.HT, V10.HT, V11.HT, V16.HT, V20.HT, V22.HT) were selected as drought-tolerant genotypes based on yield performances (Yp and Ys) and ten drought indices (
Table 3). Two genotypes (V14.HT and V15.HT) were selected as drought-tolerant based on the ten indices employed and seed yield under stress conditions; however, their seed yields under non-stress conditions were lower than those of the best check variety, Vima 1. Further, the genotype V12.HT was selected based on Ys and nine drought tolerance indices, except for MSTIK1; however, the seed yield of the genotype under non-stress conditions (Yp) was lower than that of the best check variety, Vima 1.
Table 3 also shows that two genotypes (V18.HT, V19.HT) were selected based on seed yield performances (Yp and Ys) and eight drought indices, while Yp and six drought indices selected V17.HT. Thus, the results show that eight genotypes were classified as drought-tolerant, high-yielding genotypes/lines because they were selected by all or most of the drought indices employed, as well as their seed yield performance (Yp and Ys).
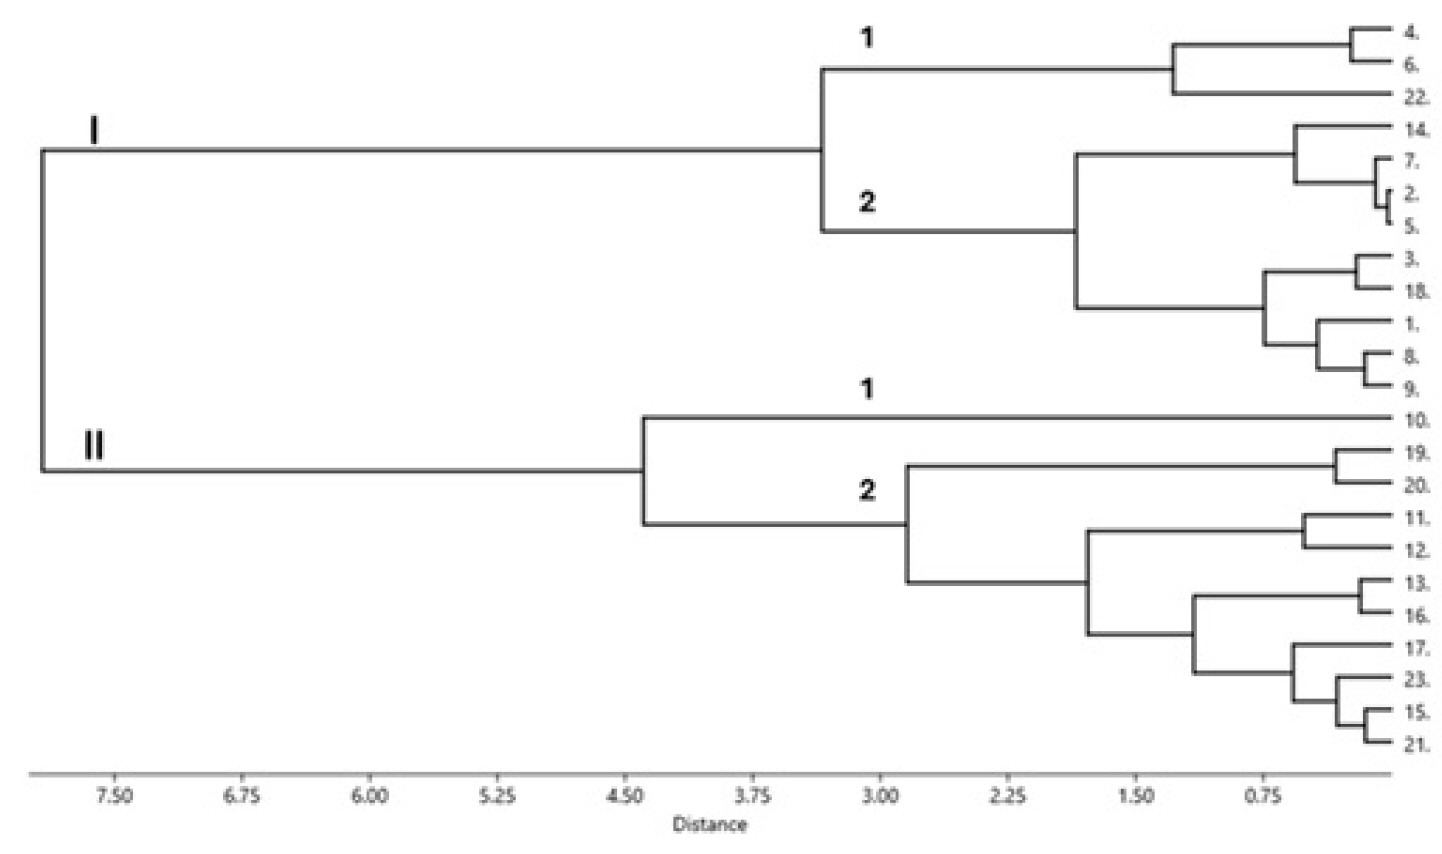
The calculated drought indices were used to group the evaluated mungbean genotypes as shown in a dendrogram in
Fig. 1.
Fig. 1 reveales that at a truncation point of 7.5, the 23 mungbean genotypes were grouped into two main clusters (I and II). Each cluster was subdivided into two sub-clusters (1 and 2) at a truncation of 3.0. Cluster I comprises 12 genotypes, three genotypes in subcluster 1 and nine genotypes in subcluster 2. Cluster II consists of eleven genotypes; only one genotype (number 10, V9.HT) constitutes sub-cluster 1, and the remaining ten genotypes form sub-cluster 2. In addition,
Fig. 1 also shows that the ten drought indices produced one duplicate (genotypes that are grouped at the 0.0 truncation point) in sub-cluster 1 of Cluster II, indicating that the genotypes constituting the duplicate [2 (Local Sabu) and 5 (Kutilang)] share a similar drought tolerance level. It is shown in
Fig. 1 that the distance between the two cluster is high but the distance between the genotypes within each cluster was narrow. This is because the genotypes within the same cluster share almost similar drought index values, indicating their close relationship in both drought tolerance level and seed yield performances under stress and non-stress conditions.
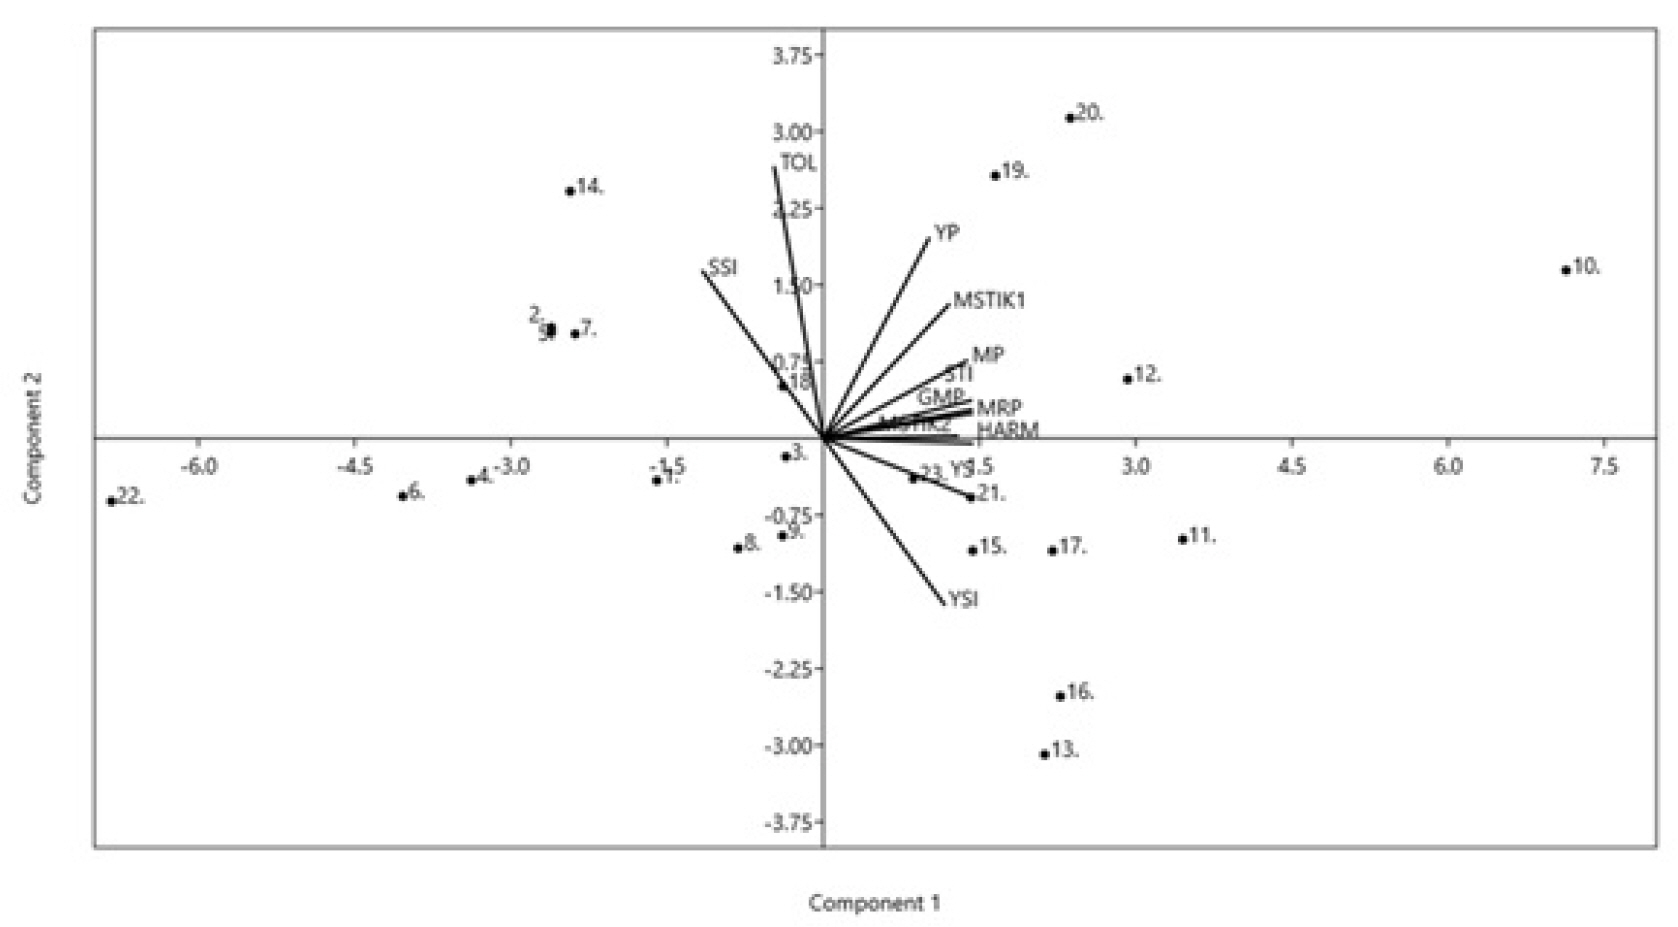
Principal Component Analysis (PCA) revealed two principal components (PC1 and PC2) that explained 96.24% of the variations in drought tolerance indices. About 76.65% of the variation was explained by the first component (PC1), and 19.59% of the observed variations was explained by the second component (PC2). The PCA results also show that PC1 was positively correlated with almost all drought indices, except SSI and TOL, that was negatively correlated with PC1 (
Fig. 2). PC2 had a positive association with drought indices YP, MP, GMP, STI, MRP, SSI, MSTIK1, MSTIK2, and TOL, but had a negative relationship with YS and YSI. In contrast, its relationship with HARM was negligible. In general,
Fig. 2 may broadly reflect multicollinearity among the drought indices, especially those sharing positive correlation with PC1. The multicollinearity among these indices is expected as they identify genotypes that maintained high and stable performance under stress and non-stress conditions, which may be underlined by shared biological tolerance mechanisms against drought stress. The PCA may have captured the biological variation in tolerance mechanisms. However, the drought tolerance mechanisms are not elucidated in the present study as the indices employed do not measure physiological traits directly but instead rank the evaluated genotypes based on their yield performance under both drought stress and non-tress conditions.
Table 4 presents the coefficients of correlation between seed yields and drought tolerance indices under a stress level of 0.51. Seed yield (Yp) under non-stress conditions was significantly correlated with seed yield (Ys) under stress conditions. Yp was also significantly and positively associated with all the drought indices but exhibited no correlation with SSI and YSI. Meanwhile, seed yield under stress conditions (Ys) was positively correlated with MP, STI, GMP, YSI, MRP, HARM, MSTIK1, MSTIK2 but was negatively correlated with SSI and TOL. Seven drought indices, namely MP, STI, GMP, MRP, HARM, MSTIK1, and MSTIK2, were positively correlated with each other; however, almost all of them, except MSTIK1, were negatively correlated with SSI. Additionally, the seven indices showed no significant correlation with TOL. TOL, on the other hand, was significantly and positively correlated with SSI but was negatively correlated with YSI.
It is interesting to note from
Table 4 that a perfect positive correlation (r = 1.0) exists between GMP and MRP, while a perfect negative correlation (r = -1.0) is observed between YSI and SSI. The first indicates that an increase in GMP value was accompanied by a corresponding increase in MRP value of the same magnitude, and vice versa. The latter suggests that an increase in SSI value was followed by a decrease in YSI value of the same magnitude, and vice versa. A perfect negative correlation between SSI and YSI did occur, as the cutoff value for stress tolerance levels for both indices is 0.5. Specifically, a lower SSI value than 0.05 indicates a higher tolerance level, while a higher YSI value than 0.05 indicates a higher stress tolerance level. Despite the perfect negative correlation observed between SSI and YSI, both are equally important as the first identifies genotypes that resist drastic yield losses while the latter identifies genotypes with consistent/stable performance under stress and non-stress conditions.
Discussion
The study results showed that drought stress during the reproductive stage caused a 49.8% decrease in seed yield, nearly half that observed under normal/non-stress conditions. In line with the present study's results, Ranawaket et al. (
Ranawake et al. 2011) reported flowering and post-flowering stages as the most sensitive to drought stress in mungbean with a seed yield reduction of approximately 81%. Zare et al. (
Zare et al. 2012) also found that drought stress in mungbean caused yield reductions of 51% to 85.5%. Additionally, Islam (
Islam et al. 2021) also observed a significant yield reduction in mungbean due to differences in the frequency and timing of irrigation. The authors found that water deficit during the flowering stage was the most critical, causing a yield reduction of approximately 18.15%. As the mungbean yield is a complex trait (
Mehandi et al. 2015;
Singh et al. 2016;
Singh et al. 2023), the seed yield reduction observed in this study may have been caused by the drought stress effect on various morphophysiological processes and growth attributes. Previous studies (
Bangar et al. 2019;
Baroowa et al. 2012;
Baroowa et al. 2016;
Ghanbari et al. 2015) have revealed that drought stress in mungbean causes significant changes in morphophysiological and biochemical processes, leading to poor seed yield.
Under moderate drought stress level (SL2), eight best genotypes (V9.HT, V10.HT, V11.HT, V16.HT, V18.HT, V19.HT, V20.HT, V22.HT) were selected. The selected genotypes ranked highly across multiple indices, suggesting robust performance rather than sole dependence on inherent yield potential. As indices like STI, MP, GMP, MRP, HARM, MSTIK1, MSTIK2 are designed to favor genotypes with high yield potential under both stress (Ys) and non-stress (Yp) conditions, the selected genotypes are considered as drought-tolerant and high yielding, which aligns with breeding goals for productive tolerance. We also included TOL and SSI to balance this by emphasizing yield maintenance. The seed yield performances (Yp and Ys) of the selected genotypes also exceeded the best check variety employed. These results suggest that selecting drought-tolerant, high-yielding genotypes based on multiple drought indices (MP, STI, GMP, SSI, YSI, MRP, HARM, MSTIK1, MSTIK2) and seed yield performances was effective. These results are in line with the previous works (
Ali et al. 2016;
Bennani et al. 2017;
Mafakheri et al. 2015;
Mau et al. 2019a;
Mau et al. 2019b), which found that drought indices MP, GMP, STI, MRP, HARM, MSTIK 1, and MSTIK 2 were effective in selecting drought-tolerant, high-yielding genotypes in various crops.
Besides drought tolerance indices, selecting drought tolerance based on additional analyses, such as correlation analysis, cluster analysis, principal component analysis, and bi-plot diagrams, may result in a more effective selection. Hashemzehi (
Hashemzehi et al. 2013) employed a combination of drought tolerance indices and Principal Component Analysis (PCA), observing that the PCA plot clearly distinguished between drought-tolerant and drought-sensitive genotypes. Furthermore, Paramesh (
Paramesh et al. 2016) successfully used genotype by trait (GT) biplot analysis as a powerful statistical tool to analyse drought-related traits in mungbean. In bread wheat, Farshadfar et al. (
Farshadfar et al. 2012) successfully used a mean-rank method in combination with correlation analysis, PCA and bi-plot diagram to select for drought-tolerant and high-yielding genotypes.
Cluster analysis results showed that the eight best genotypes (8 (V9.HT), 9 (V10.H), 10 (V11.HT), 17 (V16.HT), 19 (V18.HT), 20 (V19.HT), 21 (V20.HT), 23 (V22.HT)) selected by Yp, Ys, MP, STI, GMP, SSI, YSI, MRP, HARM, MSTIK1, MSTIK2 were grouped in the same cluster (Cluster II) in addition to three other genotypes (13 (V12.HT), 15 (V14.HT), 16 (V15.HT)) that were also put in the same cluster. The latter three genotypes can also be considered drought-tolerant, as they were selected by nine and ten drought indices, respectively, and Ys. Interestingly, the other 12 genotypes that were not selected or selected by only a few (less than half) of the employed drought indices were grouped in Cluster I (
Fig. 1), indicating that these genotypes share a similar drought tolerance level, i.e., they are drought-susceptible. Thus, the cluster analysis results support the selection of drought-tolerant genotypes based on the drought indices and yield performances. The PCA and Bi-plot analysis (
Fig. 2) revealed almost similar results with those of cluster analysis, where the genotypes selected as drought-tolerant based on the nine drought indices were grouped in the two upper quadrants of PC1, which explained about 76.65% of the observed variations in the tested genotype’s drought tolerance levels. The results further support the effectiveness of drought indices in selecting the best drought-tolerant and high-yielding mungbean genotypes. Cluster analysis, PCA, and Bi-plot analysis have also been used to select drought-tolerant, high-yielding genotypes in other crops (
Azimov et al. 2024;
Mau et al. 2019a;
Mau et al. 2019b;
Wulansari et al. 2025).
The correlation analysis results showed a positive and highly significant correlation between Yp and Ys, indicating that genotypes with high seed yield under non-stress conditions also exhibited high yield under drought-stress conditions. This result aligns with that of previous studies in other crops (
Bennani et al. 2017;
Dadbakhsh et al. 2011;
Mau et al. 2019a;
Mau et al. 2019b). The drought indices MP, GMP, STI, MRP, HARM, MSTIK1, and MSTIK2 showed highly significant correlations among each other and also with Yp and Ys. The high correlations among these indices are frequently observed in drought studies on grain legumes (
Bangar et al. 2019;
Baroowa et al. 2012;
Baroowa et al. 2016;
Ghanbari et al. 2015), reflecting that they capture overlapping aspects of yield stability and drought stress response (
Zare et al. 2012).
The high correlation among indices also provides consistent ranking of genotypes without requiring exhaustive trait measurements. Nevertheless, we acknowledge that correlated indices may primarily reflect similar signals related to yield maintenance rather than distinct morphological and physiological mechanisms such as root architecture, osmotic adjustment, etc. However, they likely provide limited unique biological insight, and future advanced analyses could better resolve distinct mechanisms. Overall, the study results suggest that these drought indices were able to identify drought-tolerant and high-yielding black-seeded mungbean genotypes under both non-stress and stress conditions.
A perfect positive correlation was observed between drought indices GMP and MRP, while a perfect negative correlation occurred between YSI and SSI. These results suggest that drought indices that show perfect correlation can be used interchangeably. The Interchangeable drought tolerance indices had also been found in wheat (
Ali et al. 2016;
Bennani et al. 2017). As with cluster analysis, PC analysis, and bi-plot diagram, the correlation analysis also showed that the drought indices MP, GMP, STI, HARM, MRP, SSI, YSI, MSTIK1, and MSTIK2 are the most suitable indices to select for drought-tolerant genotypes.
Overall, the study results showed that drought indices MP, GMP, STI, HARM, MRP, SSI, YSI, MSTIK1, and MSTIK2 were effective in selecting for drought-tolerant, stable and high-yielding black-seeded mungbean lines. However, the drought mechanisms identified using the drought tolerance indices are not elucidated this study. The yield-based drought tolerance indices integrate escape, avoidance, tolerance, and constitutive yield potential, which can confound the mechanisms. Thus, further mechanistic studies to cover morphological and physiological traits such as rooting, osmoregulation, etc. are required for deeper insight and evaluation.
Despite the promising results of this study, we acknowledge that their application in further mungbean breeding programs is still limited since the study was only conducted in a single environment and season. Thus, testing in multi-environment trials are further needed to confirm the identified genotypes' performance. In addition, while highlighted in the introduction, linkages between drought tolerance and superior nutritional profiles (e.g., antioxidants) in black-seeded mungbean were not explored due to limited seed color variation. However, the study provides a useful initial screening for black-seeded mungbean improvement in drought-prone areas, with the noted limitations warrant future targeted breeding efforts.
In conclusion, the overall study results reveal that the drought tolerance indices MP, GMP, STI, HARM, MRP, SSI, YSI, MSTIK1, and MSTIK are considered suitable indicators for selecting drought-tolerant black-seeded mungbean lines. The mungbean lines V9.HT, V10.H, V11.HT, V16.HT, V18.HT, V19.HT, V20.HT, and V22.HT were selected as promising lines based on the drought indices and yield performances. These promising lines are recommended for another season of drought tolerance evaluation before being subjected to multi-location trials to ensure stable performances of the selected lines.
Acknowledgments
We would like to thank the Lembaga Pengelola Dana Pendidikan (LPDP) of the Indonesian Ministry of Finance for the funding support, which was made possible through collaboration with the Directorate of Research and Community Services (DRPM) of the Indonesian Ministry of Higher Education, Science, and Technology, through Pendanaan Riset Pembangunan Berkelanjutan (PRPB) 2024-2025, contract number: 022/E5/PG.02.00/PRPB.INKLUSIVITAS/2024.
Fig. 1Clustering of the mungbean genotypes based on drought tolerance indices at SL2 (0.52) based on Ward’s method employing Euclidean distance. (Genotypes-1: Fore Belu, 2: Local Sabu, 3: Vima 1, 4: Vima 3, 5: Kutilang, 6: Vima 4, 7: V6.HT, 8: V7.HT, 9: V8.HT, 10: V9.HT, 11: V10.HT, 12: V11.HT, 13: V12.HT, 14: V13.HT, 15: V14.HT, 16: V15.HT, 17: V16.HT, 18: V17.HT, 19: V18.HT, 20: V19.HT, 21: V20.HT, 22: V21.HT: 23: V22.HT.

Fig. 2Biplot diagram for drought tolerance indices in SL2 (0.51) stress level. (Genotypes-1: Fore Belu, 2: Local Sabu, 3: Vima 1, 4: Vima 3, 5: Kutilang, 6: Vima 4, 7: V6.HT, 8: V7.HT, 9: V8.HT, 10: V9.HT, 11: V10.HT, 12: V11.HT, 13: V12.HT, 14: V13.HT, 15: V14.HT, 16: V15.HT, 17: V16.HT, 18: V17.HT, 19: V18.HT, 20: V19.HT, 21: V20.HT, 22: V21.HT, 23: V22.HT.

Table 1Drought tolerance indices employed in this study.
Table 1
|
Drought Tolerance Indices |
Equation |
Biological Relevance |
Key Reference |
|
Mean productivity (MP) |
(Ys+Yp)/2 |
Average yield across conditions. Higher values indicate good performance in stress and non-stress conditions, and correlates with high potential yield |
(Rosielle et al. 1981) |
|
Stress tolerance index (STI) |
(Yp*Ys)/(Ȳp)2
|
Select genotypes that perform well under both conditions. Higher values indicate wide adaptation and tolerance. Most effective for simultaneous selection of yield potential and stress tolerance |
(Fernandez 1992) |
|
Geometric mean productivity (GMP) |
√(Yp*Ys) |
Balances yield in both conditions (similar to MP but less influenced by extreme condition). Higher values suggest tolerance with maintained productivity. Recommended for selecting genotypes high-yielding in both stress and non-stress environments |
(Fernandez 1992) |
|
Stress Susceptibility Index (SSI) |
(1-(Ys/Yp))/(1-(Ȳs/Ȳp)) |
Measures relative yield reduction compared to stress intensity. Values <1 indicate tolerance; >1 indicate susceptibility |
(Fischer et al. 1978) |
|
Yield stability index (YSI) |
Ys/Yp |
Ratio of stress to non-stress yield. Higher values (closer to 1) indicate stability and tolerance. Identifies genotypes with a minimum guaranteed yield under poor environments |
(Bouslama et al. 1984) |
|
Mean relative performance (MRP) |
(Ys/Ȳs)+(Yp/Ȳp) |
Identifies genotypes that maintain relatively high and stable performance in both stress and non-stress conditions from those that are merely high-yielding in good conditions but low yielding under stress |
(Hossain et al. 1990) |
|
Harmonic Mean (HM) |
2*(YpxYs)/(Yp+Ys) |
Similar to GMP but more sensitive to low Ys. Higher values indicate balanced performance, emphasizing tolerance |
(Dadbakhsh et al. 2011) |
|
Modified Stress Tolerance Index for non-stressed (MSTIK1) |
((Yp)2/(Ȳp)2)*STI |
It is a modification of STI to better discriminate genotypes that maintain high yield potential in both environments, emphasizes performance closer to non-stress means (suitable for mild stress) |
(Farshadfar et al. 2003) |
|
Modified Stress Tolerance Index for stressed (MSTIK2) |
((Ys)2/(Ȳs)2)*STI |
Modified from STI, strongly correlates with yields in both environments but performs particularly well in identifying tolerant genotypes under high/severe stress, suitable for severe stress condition |
(Farshadfar et al. 2003) |
|
Tolerance index (TOL) |
Yp-Ys |
Measures absolute yield loss under stress. Lower values indicate higher tolerance. Favors genotypes stable under stress but may select lower-potential yields |
(Rosielle et al. 1981) |
Table 2Mean square of analysis of variance of seed yields and drought tolerance indices for 23 mungbean genotypes across stress levels (non-stress/SL 0, stress level 1/SL1, stress level 2/SL2), genotypes, and their interaction.
Table 2
|
Source of Variation |
Two-way ANOVA |
|
ANOVA Non-stress |
ANOVA SL1: 0.42 |
ANOVA SL2: 0.51 |
|
|
|
Stress level (SL) |
Genotype (G) |
SL x G |
Genotype Effect |
Genotype Effect |
Genotype Effect |
|
Seed Yield (Yp and Ys) |
29.865***
|
1.436***
|
0.224***
|
|
5.8575***
|
- |
- |
|
Seed Yield (Ys) |
0.9051 |
0.7586***
|
0.0782***
|
|
|
2.0418***
|
1.8371***
|
|
MP |
0.2263 |
0.7932***
|
0.0196**
|
|
|
3.4031***
|
3.6332***
|
|
STI |
0.1307 |
0.2809***
|
0.0117**
|
|
|
0.4491***
|
0.4047***
|
|
GMP |
0.5529 |
0.8411***
|
0.0426**
|
|
|
3.3520***
|
3.0633***
|
|
SSI |
0.0008 |
0.3060***
|
0.0731**
|
|
|
0.9797***
|
1.0557***
|
|
YSI |
0.2107 |
0.0740***
|
0.0200**
|
|
|
0.3273***
|
0.2757****
|
|
MRP |
0.0520 |
1.1054***
|
0.0706**
|
|
|
3.9767***
|
4.5048***
|
|
HARM |
0.8898 |
0.8917***
|
0.0664**
|
|
|
3.1057***
|
2.8029***
|
|
MSTIK1 |
0.1920 |
1.0108***
|
0.0124 |
|
|
0.9616***
|
0.8440***
|
|
MSTIK2 |
0.0525 |
2.1402***
|
0.1514**
|
|
|
1.3202***
|
2.0163***
|
|
TOL |
0.9051 |
0.6683***
|
0.0782**
|
|
|
1.2658***
|
1.2658***
|
Table 3Mean seed yield and drought tolerance indices for 23 mungbean genotypes grown under non-stress conditions (i.e., irrigated daily at 100% field capacity throughout) and under severe stress conditions (irrigated every seven days at field capacity level during the post-flowering phase of plant development).
Table 3
|
Genotype |
Ypz)
|
Ysy)
|
MP |
GMP |
STI |
SSI |
YSI |
MRP |
HARM |
MSTIK1 |
MSTIK2 |
TOL |
|
1. Fore Belu |
2.24 |
1.02 |
1.63 |
1.51 |
0.37 |
1.03 |
0.45 |
1.75 |
1.40 |
0.29 |
0.24 |
1.23 |
|
2. Local Sabu |
2.48 |
0.77 |
1.62 |
1.38 |
0.31 |
1.31 |
0.31 |
1.63 |
1.17 |
0.30 |
0.12 |
1.72 |
|
3. Vima 1 |
2.45 |
1.21 |
1.83 |
1.72 |
0.48 |
0.95 |
0.50 |
2.00 |
1.62 |
0.45 |
0.45 |
1.24 |
|
4. Vima 3 |
2.00 |
0.71 |
1.35 |
1.19 |
0.23 |
1.21 |
0.36 |
1.39 |
1.05 |
0.15 |
0.07 |
1.29 |
|
5. Kutilang |
2.47 |
0.77 |
1.62 |
1.37 |
0.31 |
1.30 |
0.31 |
1.63 |
1.17 |
0.30 |
0.12 |
1.70 |
|
6. Vima 4 |
1.86 |
0.61 |
1.23 |
1.06 |
0.18 |
1.27 |
0.33 |
1.25 |
0.92 |
0.10 |
0.04 |
1.25 |
|
7. V6.HT |
2.49 |
0.81 |
1.65 |
1.41 |
0.33 |
1.28 |
0.32 |
1.67 |
1.22 |
0.33 |
0.15 |
1.68 |
|
8. V7.HT |
2.19 |
1.18 |
1.69 |
1.61 |
0.42 |
0.87 |
0.54 |
1.87 |
1.53 |
0.32 |
0.37 |
1.01 |
|
9. V8.HT |
2.27 |
1.25 |
1.76 |
1.68 |
0.46 |
0.85 |
0.55 |
1.95 |
1.61 |
0.38 |
0.46 |
1.02 |
|
10. V9.HT |
3.39 |
2.22 |
2.81 |
2.74 |
1.21 |
0.65 |
0.66 |
3.22 |
2.68 |
2.20 |
3.85 |
1.17 |
|
11. V10.HT |
2.65 |
1.88 |
2.27 |
2.23 |
0.80 |
0.55 |
0.71 |
2.64 |
2.20 |
0.89 |
1.82 |
0.77 |
|
12. V11.HT |
2.92 |
1.70 |
2.31 |
2.22 |
0.80 |
0.79 |
0.58 |
2.59 |
2.13 |
1.07 |
1.52 |
1.23 |
|
13. V12.HT |
2.12 |
1.78 |
1.95 |
1.94 |
0.61 |
0.31 |
0.84 |
2.34 |
1.93 |
0.43 |
1.23 |
0.35 |
|
14. V13.HT |
2.86 |
0.72 |
1.79 |
1.43 |
0.33 |
1.41 |
0.25 |
1.74 |
1.14 |
0.42 |
0.11 |
2.14 |
|
15. V14.HT |
2.44 |
1.57 |
2.00 |
1.95 |
0.62 |
0.68 |
0.64 |
2.29 |
1.90 |
0.58 |
0.97 |
0.88 |
|
16. V15.HT |
2.25 |
1.78 |
2.01 |
2.00 |
0.64 |
0.39 |
0.79 |
2.39 |
1.98 |
0.51 |
1.30 |
0.47 |
|
17. V16.HT |
2.52 |
1.69 |
2.10 |
2.06 |
0.68 |
0.62 |
0.67 |
2.43 |
2.02 |
0.68 |
1.28 |
0.83 |
|
18. V17.HT |
2.60 |
1.17 |
1.89 |
1.74 |
0.50 |
1.04 |
0.45 |
2.02 |
1.61 |
0.53 |
0.43 |
1.43 |
|
19. V18.HT |
3.26 |
1.36 |
2.31 |
2.10 |
0.71 |
1.10 |
0.42 |
2.44 |
1.92 |
1.20 |
0.85 |
1.90 |
|
20. V19.HT |
3.44 |
1.43 |
2.43 |
2.21 |
0.79 |
1.10 |
0.42 |
2.57 |
2.01 |
1.47 |
1.03 |
2.01 |
|
21. V20.HT |
2.55 |
1.53 |
2.04 |
1.97 |
0.63 |
0.75 |
0.60 |
2.30 |
1.91 |
0.64 |
0.97 |
1.02 |
|
22. V21.HT |
1.35 |
0.18 |
0.76 |
0.49 |
0.04 |
1.64 |
0.13 |
0.68 |
0.31 |
0.01 |
0.00 |
1.18 |
|
23. V22.HT |
2.53 |
1.43 |
1.98 |
1.90 |
0.58 |
0.82 |
0.57 |
2.21 |
1.82 |
0.60 |
0.77 |
1.11 |
|
|
Mean |
2.49 |
1.25 |
1.87 |
1.74 |
0.52 |
0.95 |
0.50 |
2.04 |
1.62 |
0.60 |
0.79 |
1.24 |
|
Table 4Spearmen’s correlation coefficients between Yp, Ys and drought tolerance indices determined across 23 mungbean genotypes at the SL2 (0.51) stress level.
Table 4
|
Yp |
Ys |
MP |
STI |
GMP |
SSI |
YSI |
MRP |
HARM |
MSTIK1 |
MSTIK2 |
|
Ys |
0.56*
|
|
|
|
|
|
|
|
|
|
|
|
MP |
0.88***
|
0.89***
|
|
|
|
|
|
|
|
|
|
|
STI |
0.76**
|
0.94***
|
0.97***
|
|
|
|
|
|
|
|
|
|
GMP |
0.78**
|
0.95***
|
0.98***
|
0.98***
|
|
|
|
|
|
|
|
|
SSI |
-0.20ns
|
-0.91***
|
-0.63*
|
-0.70**
|
-0.75**
|
|
|
|
|
|
|
|
YSI |
0.20ns
|
0.91***
|
0.64*
|
0.71**
|
0.76**
|
-1.00***
|
|
|
|
|
|
|
MRP |
0.77**
|
0.96***
|
0.98***
|
0.98***
|
1.00***
|
-0.76**
|
0.76**
|
|
|
|
|
|
HARM |
0.70**
|
0.98***
|
0.96***
|
0.97***
|
0.99***
|
-0.82**
|
0.82**
|
0.99***
|
|
|
|
|
MSTIK1 |
0.85**
|
0.72**
|
0.89***
|
0.91***
|
0.84**
|
-0.37ns
|
0.38ns
|
0.85**
|
0.80**
|
|
|
|
MSTIK2 |
0.56*
|
0.86***
|
0.81**
|
0.92***
|
0.84**
|
-0.66*
|
0.66*
|
0.85**
|
0.85**
|
0.86***
|
|
|
TOL |
0.44*
|
-0.5*
|
-0.05ns
|
-0.22ns
|
-0.22ns
|
0.78**
|
-0.77**
|
-0.23ns
|
-0.33ns
|
0.11ns
|
-0.35ns
|
References
- Abenavoli M, Leone M, Sunseri F, Bacchi M, Sorgona A. 2016. Root phenotyping for drought tolerance in bean landraces from Calabria (Italy). J. Agron. Crop Sci. 202(1): 1-12.
- Agriculture Mo. 2025. Statistik pertanian (Agriculture statisctis) 2025. In: Agriculture (ed.). Jakarta, Ministry of Agriculture - Republic of Indonesia.
- Ali MB, El-Sadek AN. 2016. Evaluation of drought tolerance indices for wheat (Triticum aestivum L.) under irrigated and rainfed conditions. Commun. Biometry Crop. Sci. 11(1): 77-89.
- Allito BB, Nana E-M, Alemneh AA. 2015. Rhizobia strain and legume genome interaction effects on nitrogen fixation and yield of grain legume: A review. Mol. Soil Biol. 6(4): 1-12.
- Anower M, Boe A, Auger D, Mott I, Peel M, Xu L, et al. 2017. Comparative drought response in eleven diverse alfalfa accessions. J. Agron. Crop Sci. 203(1): 1-13.
- Arnoldi A, Zanoni C, Lammi C, Boschin G. 2015. The role of grain legumes in the prevention of hypercholesterolemia and hypertension. Crit. Rev. Plant Sci. 34(1-3): 144-168.
- Azimov A, Shavkiev J, Saidjanov S, Ziyaev Z, Valiyev L. 2024. Mung bean (Vigna radiata L.) genotypes assessment for drought tolerance in Uzbekistan. J. Wildl. Biodivers. 8(1): 65-75.
- Badan Standardisasi Instrumen Pertanian (BSIP). 2024. Deskripsi varietas unggul kacang hijau 1945 - 2020. Jakarta, Indonesia.
- Bahar B, Yildirim M. 2010. Heat and drought resistances criteria in spring bread wheat: Drought resistance parameters. Sci. Res. Essays. 5(13): 1742-1745.
- Bangar P, Chaudhury A, Tiwari B, Kumar S, Kumari R, Bhat KV. 2019. Morphophysiological and biochemical response of mungbean [Vigna radiata (L.) Wilczek] varieties at different developmental stages under drought stress. Turk. J. Biol. 43(1): 58-69.
- Baroowa B, Gogoi N, Farooq M. 2016. Changes in physiological, biochemical and antioxidant enzyme activities of green gram (Vigna radiata L.) genotypes under drought. Acta Physiol. Plant. 38(9): 219.
- Baroowa B, Gogoi N. 2012. Effect of induced drought on different growth and biochemical attributes of black gram (Vigna mungo L.) and green gram (Vigna radiata L.). J. Environ. Res. Dev. 6: 584-593.
- Bennani S, Nsarellah N, Jlibene M, Tadesse W, Birouk A, Ouabbou H. 2017. Efficiency of drought tolerance indices under different stress severities for bread wheat selection. Aust. J. Crop Sci. 11(4): 395-405.
- Bouslama M, Schapaugh W. 1984. Stress tolerance in soybean. Part 1: Evaluation of three screening techniques for heat and drought tolerance. Crope Sci. 24: 933-937.
- Dadbakhsh A, Yazdansepas A, Ahmadizadeh M. 2011. Study drought stress on yield of wheat (Triticum aestivum L.) genotypes by drought tolerance indices. Adv. Environ. Biol. 5(7): 1804-1810.
- Farshadfar E, Elyasi P. 2012. Screening quantitative indicators of drought tolerance in bread wheat (Triticum aestivum L.) landraces. Eur. J. Exp. Biol. 2(3): 577-584.
- Farshadfar E, Sutka J. 2003. Multivariate analysis of drought tolerance in wheat substitution lines. Cereal Res. Commun. 31(1): 33-40.
- Fernandez GC. 1992. Effective selection criteria for assessing plant stress tolerance. Adaptation of food crops to temperature and water stress. Aug. 13-16, Shanhua, Taiwan, 1992.
- Fischer R, Maurer R. 1978. Drought resistance in spring wheat cultivars. I. Grain yield responses. Aust. J. Agric. Res. 29(5): 897-912.
- Foyer CH, Lam H-M, Nguyen HT, Siddique KH, Varshney RK, Colmer TD, et al. 2016. Neglecting legumes has compromised human health and sustainable food production. Nat. Plants. 2(8): 1-10.
- Ghanbari M, Javan SM. 2015. Study the response of mung bean genotypes to drought stress by multivariate analysis. Int. J. Agric. Innov. Res. 3(4): 2319-1473.
- Golbashy M, Ebrahimi M, Khorasani SK, Choukan R. 2010. Evaluation of drought tolerance of some corn (Zea mays L.) hybrids in Iran. Afr. J. Agric. Res. 5(19): 2714-2719.
- Hammer Ø, Harper DA. 2001. Past: Paleontological statistics software package for educaton and data anlysis. Palaeontol. Electronica. 4(1): 1.
- Hashemzehi M, Moradgholi A, Ghasemi A. 2013. Evaluation of responses of mung bean (Vigna radiata) genotypes to drought stress using different stress tolerance indices. J. Crop Breed. 5: 112-122.
- Hossain A, Sears R, Cox TS, Paulsen G. 1990. Desiccation tolerance and its relationship to assimilate partitioning in winter wheat. Crop Sci. 30(3): 622-627.
- Islam MS, Hasan MK, Islam B, Renu NA, Hakim MA, Islam MR, et al. 2021. Responses of water and pigments status, dry matter partitioning, seed production, and traits of yield and quality to foliar application of GA3 in Mungbean (Vigna radiata L.). Front. Agron. 2: 596850.
- Khattak GSS, Saeed I, Ahmad S, Ibrar M, Mansoor M. 2022. World's first black-seeded high yielding mungbean [Vigna radiata (L.) Wilczek] varieties 'NIFA Sikaram-21 and NIFA Spinghar-21'. Intl. J. Appl. Exp. Biol. 1(2): 67-73.
- Kumar R, Singh CM, Arya M, Kumar R, Mishra S, Singh U, et al. 2020. Investigating stress indices to discriminate the physiologically efficient heat tolerant genotypes of mungbean [Vigna radiata (L.) Wilczek]. Legume Res. 43(1): 43-49.
- Kumar R, Sreenu K, Singh N, Jain N, Singh N, Rai V. 2015. Effect of drought stress on contrasting cultivars of rice. Int. J. Trop. Agric. 33(2): 1559-1564.
- Lindström K, Mousavi SA. 2020. Effectiveness of nitrogen fixation in rhizobia. Microb. Biotechnol. 13(5): 1314-1335.
- Mafakheri K, Bihamta MR, Abbasi AR. 2015. Screening for drought stress tolerance in cowpea genotypes) Vigna unguiculata L. Iran. J. Pulses Res. 6(2): 123-138.
- Mau YS, Ndiwa A, Arsa IG. 2015. Drought tolerance of local rote and check varieties of groundnut (Arachis hypogaea L.) Under dry season in two locations in east Nusa Tenggara. Agrivita J. Agricultural. Sci. 36(3): 268-277.
- Mau YS, Ndiwa AS, Bunga W, Abidin Z, Harini TS, Oematan SS, et al. 2023. Inheritance of seed coat color and heritability of agronomic characters of F2 population of reciprocal crosses between Fore Belu and Local Sabu mungbean varieties. Biodiversitas. 24(5): 2647-2656.
- Mau YS, Ndiwa AS, Markus JE, Arsa IGA. 2019a. Agronomic performance and drought tolerance level of sweet potato hybrids grown in Kupang, East Nusa Tenggara, Indonesia. Biodiversitas. 20(8): 2187-2196.
- Mau YS, Ndiwa AS, Oematan SS, Markus JE. 2019b. Drought tolerance indices for selection of drought tolerant, high yielding upland rice genotypes. Aust. J. Crop Sci. 13(1): 170-178.
- Mau YS, Neno A, Ndiwa AS, Oematan S. 2024. Variabilitas dan kemajuan genetik karakter agronomis galur-galur F2: 4 hasil persilangan fore belu dan lokal sabu. Jurnal Agrisa. 13(1): 139-150.
- Mehandi S, Singh I, Bohra A, Singh CM. 2015. Multivariate analysis in green gram [Vigna radiata (L.) Wilczek]. Legum. Res. An Int. J. 38(6): 758-762.
- Nair RM, Thavarajah P, Giri RR, Ledesma D, Yang R-Y, Hanson P, et al. 2015. Mineral and phenolic concentrations of mungbean [Vigna radiata (L.) R. Wilczek var. radiata] grown in semi-arid tropical India. J. Food Compos. Anal. 39: 23-32.
- Paramesh M, Mohan Reddy D, Shanthi Priya M, Sumathi P, Sudhakar P, Reddy K. 2016. GT biplot analysis for yield and drought related traits in mung bean (Vigna radiata L. Wilczek). J. Plant Breed. 7(3): 538-543.
- Pratiwi H, Rahmianna AA. 2017. The effect of growing season on growth rate, pod partitioning, phenology and yield variations of mungbean varieties. Nusantara Biosci. 9(3): 243-250.
- Purbajanti ED, Kusmiyati F, Fuskhah E. 2017. Growth, yield and physiological characters of three types of Indonesian rice under limited water supply. Asian J. Plant Sci. 16(2): 101-108.
- PUSDATIN 2024. Peningkatan kualitas data produksi kacang hijau melalui perbaikan metode produktivitas. In News Letter Pusdatin (Vol. 21, p. 5). Jakarta.21, Pusat Data Dan Sistem Informasi Pertanian Indonesia.
- Ranawake A, Nakamura C. 2011. Assessment of salinity tolerance in an inbred population of rice (Oryza sativa L.) derived from a Japonica X Indica cross. Trop. Agric. Res. Ext. 15(3): 6-12.
- Randhir R, Shetty K. 2007. Mung beans processed by solid-state bioconversion improves phenolic content and functionality relevant for diabetes and ulcer management. Innov. Food Sci. Emerg. Technol. 8(2): 197-204.
- Rosielle A, Hamblin J. 1981. Theoretical aspects of selection for yield in stress and non-stress environment 1. Crop Sci. 21(6): 943-946.
- Sarkar RK, Mahata KR, Singh DP. 2013. Differential responses of antioxidant system and photosynthetic characteristics in four rice cultivars differing in sensitivity to sodium chloride stress. Acta Physiol. Plant. 35(10): 2915-2926.
- Singh B, Reddy KR, Redoña ED, Walker T. 2017. Screening of rice cultivars for morpho-physiological responses to early-season soil moisture stress. Rice Sci. 24(6): 322-335.
- Singh CM, Mishra S, Pandey A, Kumari K. 2023. Branching pattern and harvest index as important selection criteria for improvement of mungbean [Vigna radiata (L.) Wilczek]. Madras Agric. J. 102(1-3): 1-5.
- Singh CM, Singh AK, Mishra SB, Pandey A. 2016. Generation mean analysis to estimate the genetic parameters for yield improvement and inheritance of seed colour and lusture in mungbean [Vigna radiata (L.) Wilczek]. Legum. Res. Int. J. 39(4): 494-501.
- Singh CM, Singh P, Tiwari C, Purwar S, Kumar M, Pratap A, et al. 2021. Improving drought tolerance in mungbean (Vigna radiata L. Wilczek): Morpho-physiological, biochemical and molecular perspectives. Agronomy. 11(8): 1534.
- VSNi. 2012. GenStat 15th edition for windows. VSN International Ltd., UK.
- Wang F, Huang L, Yuan X, Zhang X, Guo L, Xue C, et al. 2021. Nutritional, phytochemical and antioxidant properties of 24 mung bean (Vigna radiate L.) genotypes. Food Prod. Process. Nutr. 3(1): 28.
- Wang L, Mao Q, Chen C, Hong J. 2024. Characterization of nutritional components of foxtail millet (Setaria italica (L.) P. Beauv) cv. Jingu 21 cultivated in soil with different nutrient contents in China. J. Food Compos. Anal. 127: 105950.
- Wulansari A, Purwito A, Sukma D, Wulandari D. 2025. Drought tolerance of Indonesian taro (Colocasia esculenta [l.] Schott.): Comparison between diploids and polyploids. SABRAO J. Breed. Genet. 57(1): 195-205.
- Xie J, Du M, Shen M, Wu T, Lin L. 2019. Physico-chemical properties, antioxidant activities and angiotensin-I converting enzyme inhibitory of protein hydrolysates from Mung bean (Vigna radiate). Food Chem. 270: 243-250.
- Yang Q-Q, Ge Y-Y, Gunaratne A, Kong K-W, Li H-B, Gul K, et al. 2020. Phenolic profiles, antioxidant activities, and antiproliferative activities of different mung bean (Vigna radiata) varieties from Sri Lanka. Food Biosci. 37: 100705.
- Yao Y, Yang X, Tian J, Liu C, Cheng X, Ren G. 2013. Antioxidant and antidiabetic activities of black mung bean (Vigna radiata L.). J. Agric. Food Chem. 61(34): 8104-8109.
- Yousaf L, Hou D, Liaqat H, Shen Q. 2021. Millet: A review of its nutritional and functional changes during processing. Food Res. Int. 142: 110197.
- Zare M, Nejad M, Bazrafshan F. 2012. Influence of drought stress on some traits in five mung bean (Vigna radiata (L.) R. Wilczek) genotypes. Intl. J. Agron. Plant Prod. 3(7): 234-240.