Abstract
Amylopectin branch-chain length distribution is a key determinant of rice starch functionality and eating quality, yet the genetic basis underlying specific chain fractions remains incompletely understood in diverse germplasm. In this study, amylopectin fine structure was quantified in 137 accessions of the Korean Rice Core Selection (KRICE_Core) using HPAEC-PAD, and genome-wide association studies were conducted with 2.1 million high-quality SNPs under the FarmCPU model. The short-chain distribution (SCD, DP 6-12) varied from 26.85% to 37.20%, whereas the intermediate-chain distribution (ICD, DP 12-24) ranged from 52.57% to 61.04%, and the two fractions showed a strong inverse correlation. GWAS identified two major loci on chromosomes 4 and 6, with the chromosome 6 region showing exceptionally strong association signals and co-localizing with Os06g0229800 (SSIIa). Haplotype analysis of SSIIa detected five non-synonymous SNPs defining five haplotypes. Hap1 and Hap5 were associated with increased SCD and reduced ICD, whereas indica-related haplotypes (Hap2-Hap4) showed the opposite trend, indicating that SSIIa allelic variation quantitatively shifts the balance between short and intermediate chain fractions. In a panel of 113 Korean-bred cultivars, Hap1 and Hap5 together accounted for > 99% of genotypes, suggesting strong directional selection for japonica-type SSIIa alleles during Korean breeding. These findings provide robust molecular targets for designing rice varieties with tailored starch architecture and cooking qualities.
-
Key words: Chain-length distribution, Grain quality, Haplotype, Genome-wide association study, Rice
Introduction
Rice (
Oryza sativa L.) serves as a vital staple food for more than half of the global population (
Rezvi et al. 2023). As economic standards rise, consumer preferences have significantly transitioned from focusing on yield to prioritizing grain quality, particularly superior eating and cooking characteristics (
Alam et al. 2024;
Calingacion et al. 2014). Rice grain quality is a multifaceted trait encompassing milling performance, appearance, nutritional value, and most importantly, eating and cooking quality (ECQ;
Bao et al. 2023;
Chen et al. 2012). ECQ is primarily determined by starch physicochemical properties, including amylose content (AC), gelatinization temperature (GT), gel consistency, and pasting viscosity. Among these, AC dictates the firmness and stickiness of cooked rice, while GT is directly correlated with the time and temperature required for cooking, with intermediate GT generally preferred by consumers (
Farzad Amirebrahimi et al. 2025;
Pang et al. 2016).
The cooking behavior and sensory attributes of rice are fundamentally dictated by its starch structure (
Li et al. 2018). Starch is composed of two major glucose polymers: amylose, which has a lower molecular weight and fewer branches, and amylopectin, a highly branched molecule with a significantly larger molecular weight (
Apriyanto et al. 2022; Zhu et al. 2023). Varietal differences in rice quality arise predominantly from variations in the fine structure of amylopectin, specifically its chain length distribution (
Miura et al. 2018;
Sasaki et al. 2019). These structural variations are the result of the differential expression and activity of various isoforms of starch biosynthetic enzymes (
Abe et al. 2014;
Yaling et al. 2020). Previous studies have established that the architecture of amylopectin branch chains is a critical determinant of the physical behavior and functionality of rice starch during thermal processing (
He et al. 2020;
Zhang et al. 2021).
The physicochemical properties of rice are fundamentally determined by the composition and fine structure of starch, which constitutes over 90% of the endosperm’s dry weight (
Shoukat et al. 2025;
Tu et al. 2023). Starch biosynthesis is regulated by an intricate network of starch synthesis-related genes (SSRGs). For instance, the
Wx gene, encoding
granule-bound starch synthase I (
GBSSI), is the primary determinant of AC, while
Starch Synthase IIa (
SSIIa), also known as the
ALK gene, serves as a major locus controlling GT (
Chen et al. 2020;
Huang et al. 2021;
Li et al. 2021;
Zhou et al. 2021). Functionally,
SSIIa elongates short amylopectin chains, particularly very short A and B1 chains, thereby increasing longer B1 chains and modulating amylopectin chain-length distribution (
Hu et al. 2022;
Luo et al. 2023). Previous studies have demonstrated that specific allelic variations in
SSIIa, particularly Single Nucleotide Polymorphism (SNP) combinations in exon 8, significantly alter amylopectin architecture and, consequently, the GT profile of the grain. Furthermore, starch architecture is not only influenced by structural SSRGs but also by a complex regulatory network involving transcription factors such as
OsbZIP58, which directly regulates the expression of multiple SSRGs, including
Wx and
SSIIa (
Chen et al. 2020;
Kharabian-Masouleh et al. 2012;
Wang et al. 2013;
Waters et al. 2006).
Despite extensive biochemical knowledge of starch biosynthesis, the allelic architecture controlling specific amylopectin chain fractions has not been sufficiently integrated into breeding-oriented frameworks. Improving grain quality is a central objective for modern rice breeding programs aimed at developing elite varieties (
Calingacion et al. 2014;
Fitzgerald et al. 2009). Despite the importance of starch fine structure, the genetic determinants controlling specific amylopectin chain fractions remain to be fully elucidated across diverse germplasm (
Bowen et al. 2024;
Hori et al. 2025;
Zhang et al. 2021). Genome-wide association studies (GWAS) have emerged as a powerful tool to dissect such complex traits by identifying significant quantitative trait loci (QTLs) and candidate genes associated with phenotypic variations. Understanding the allelic diversity and distribution of these genes is essential for the molecular design of rice with tailored cooking qualities (
Bowen et al. 2024;
Hori et al. 2025).
Through QTL mapping using recombinant inbred lines (RILs) and RNA-seq analysis,
OsCRLK2, a gene encoding a receptor-like protein kinase, was identified as a key regulator of starch properties. Functional characterization revealed that
oscrlk2 mutants exhibit significant decreases in GT, apparent amylose content (AAC), and viscosity, primarily due to the downregulation of major starch biosynthesis-related genes (
Chen et al. 2024).
Recent integrative genomic approaches have further unveiled the multi-dimensional complexity of rice ECQ through the combination of GWAS, epistatic interaction analysis, and transcriptional profiling. For instance, a comprehensive study of 243 diverse accessions identified 23 significant QTLs, confirming the major roles of
WX1 and
SSIIa while discovering novel loci such as
qGC2-1 on chromosome 2 for gel consistency (
Farzad Amirebrahimi et al. 2025).
Therefore, the objective of this study was to systematically identify the genetic determinants governing amylopectin branch-chain architecture, specifically focusing on short-chain distribution (SCD, DP 6-12) and intermediate-chain distribution (ICD, DP 12-24). Using a GWAS based on the Korean Rice Core Selection (KRICE_Core), we identified major QTLs associated with starch properties. Furthermore, we evaluated the frequency and distribution of these haplotypes in 113 domestically developed Korean cultivars to understand the genetic fixation and selection patterns resulting from rice breeding programs. Our findings provide a comprehensive understanding of the genetic basis of amylopectin fine structure and offer valuable molecular information for the precise improvement of starch quality in rice molecular breeding.
Materials and Methods
Plant Materials and Genomic Data
A total of 137 rice accessions, obtained from the National Agrobiodiversity Center of the Rural Development Administration (RDA, Korea), were utilized to investigate natural variation in the amylopectin chain-length distribution of endosperm starch. These accessions were originally designated as the KRICE_Core by
Kim et al. (2007) and were derived from a collection of 25,604 rice accessions spanning 28 countries. They are classified into six distinct subgroups: tropical
japonica (19 accessions), temperate
japonica (62 accessions),
indica (43 accessions),
aus (8 accessions),
aromatic (3 accessions), and
admixture (2 accessions;
Zhao et al. 2010). Whole-genome sequencing of the 137 rice accessions was performed using the Illumina HiSeq 2500 Sequencing System (Illumina Inc., San Diego, USA), generating an average sequencing depth of approximately 8×. The raw sequencing reads were mapped to the rice reference genome (IRGSP 1.0) to determine genotype variations. For GWAS, genotype data were processed using Plink software with the following filtering criteria: missing data < 1%, minor allele frequency (MAF) > 5%, and heterozygosity ratio < 5% (
Purcell et al. 2007). After applying these filters, approximately 2.1 million high-quality SNPs were extracted from an initial set of 6.5 million SNPs for subsequent GWAS analysis (
Kawahara et al. 2013;
Kim et al. 2016).
The distribution of amylopectin chain lengths was determined using high-performance anion-exchange chromatography coupled with a pulsed amperometric detector (HPAEC-PAD;
Chávez-Murillo et al. 2008;
Moreno-Zaragoza et al. 2024). For sample preparation, 5 mg of lyophilized starch was dispersed in 1.5 mL of deionized water and solubilized by heating at 80℃ for 2 hours with constant stirring (350 rpm) in a thermomixer. After cooling to room temperature, the dispersion was passed through a 0.45 μm syringe filter. The chromatographic analysis was conducted on a Dionex ICS 5000 system (Thermo Scientific, Waltham, USA) equipped with an AS-AP autosampler. A CarboPac PA200 analytical column (3×250 mm) and a corresponding guard column (3×50 mm) were employed for the separation. The mobile phase consisted of 150 mM NaOH (Eluent A) and 150 mM NaOH containing 500 mM sodium acetate (Eluent B). The elution was performed at a flow rate of 0.5 mL min
-1 using the following gradient of Eluent A: 95% from 0 to 5 minutes, 60% up to 18 minutes, 15% up to 55 minutes, and 95% up to 75 minutes. Data acquisition and integration were carried out using Chromeleon software (version 7.1.2).
The population structure of the 137 rice accessions was examined using ADMIXTURE version 1.3.0, where subgroup classification was determined based on the delta K value (
Alexander et al. 2009). To validate the results, cross-validation (CV) analysis was conducted. Visualization of population structure was carried out using the Structure Plot V2.0 web application (
http://omicsspeaks.com/strplot2/, accessed on 1 December 2025). Additionally, principal component analysis (PCA) was performed using the R package Genomic Association and Prediction Integrated Tool (GAPIT;
Lipka et al. 2012). The PCA results were further visualized using R software (
RCoreTeam 2022). To explore linkage disequilibrium (LD) decay patterns and identify potential candidate regions, LD decay analysis was conducted using PopLDdecay (version 3.27;
Zhang et al. 2019).
GWAS was conducted to identify genotype-phenotype associations using the GAPIT package (version 3.0) in R. The association analysis was performed based on the Fixed and random model Circulating Probability Unification (FarmCPU) approach, implemented in the GAPIT package (
Lipka et al. 2012;
Liu et al. 2016). To control for false positives, the genome-wide significance threshold was adjusted using the Bonferroni correction (
Armstrong 2014). PCA and kinship matrices were incorporated into the model to account for population stratification. Visualization of GWAS results was carried out using Manhattan and Q-Q plots generated with the GAPIT package in R. Additionally, significant SNPs were identified by filtering the genotype data using PLINK software (
Purcell et al. 2007). Non-informative SNPs were excluded, leaving approximately 2.1 million high-quality SNPs for further analysis.
In the KRICE_Core population, SNP genotype data were filtered to remove SNPs with missing genotype calls and heterozygous genotypes prior to haplotype construction. Phenotypic data were available for this population, and the mean phenotypic value for each accession was calculated across replicates, and haplotypes were then tested to identify those significantly associated with the target phenotypes. In addition, a panel of 113 Korean-bred cultivars (94
japonica and 19
tongil-type) was used to characterize haplotype patterns within domestic breeding germplasm (
Supplementary File 1). Because phenotypic data were not available for this panel, analyses were conducted based on genotype data only. Candidate genes involved in starch biosynthesis were prioritized based on significant GWAS loci identified in the KRICE_Core, and high-quality SNPs within the genomic regions of the target genes were extracted to examine haplotypes and their allele distributions across the 113 cultivars.
Results
Phenotypic Variation in Amylopectin Chain Length Distribution
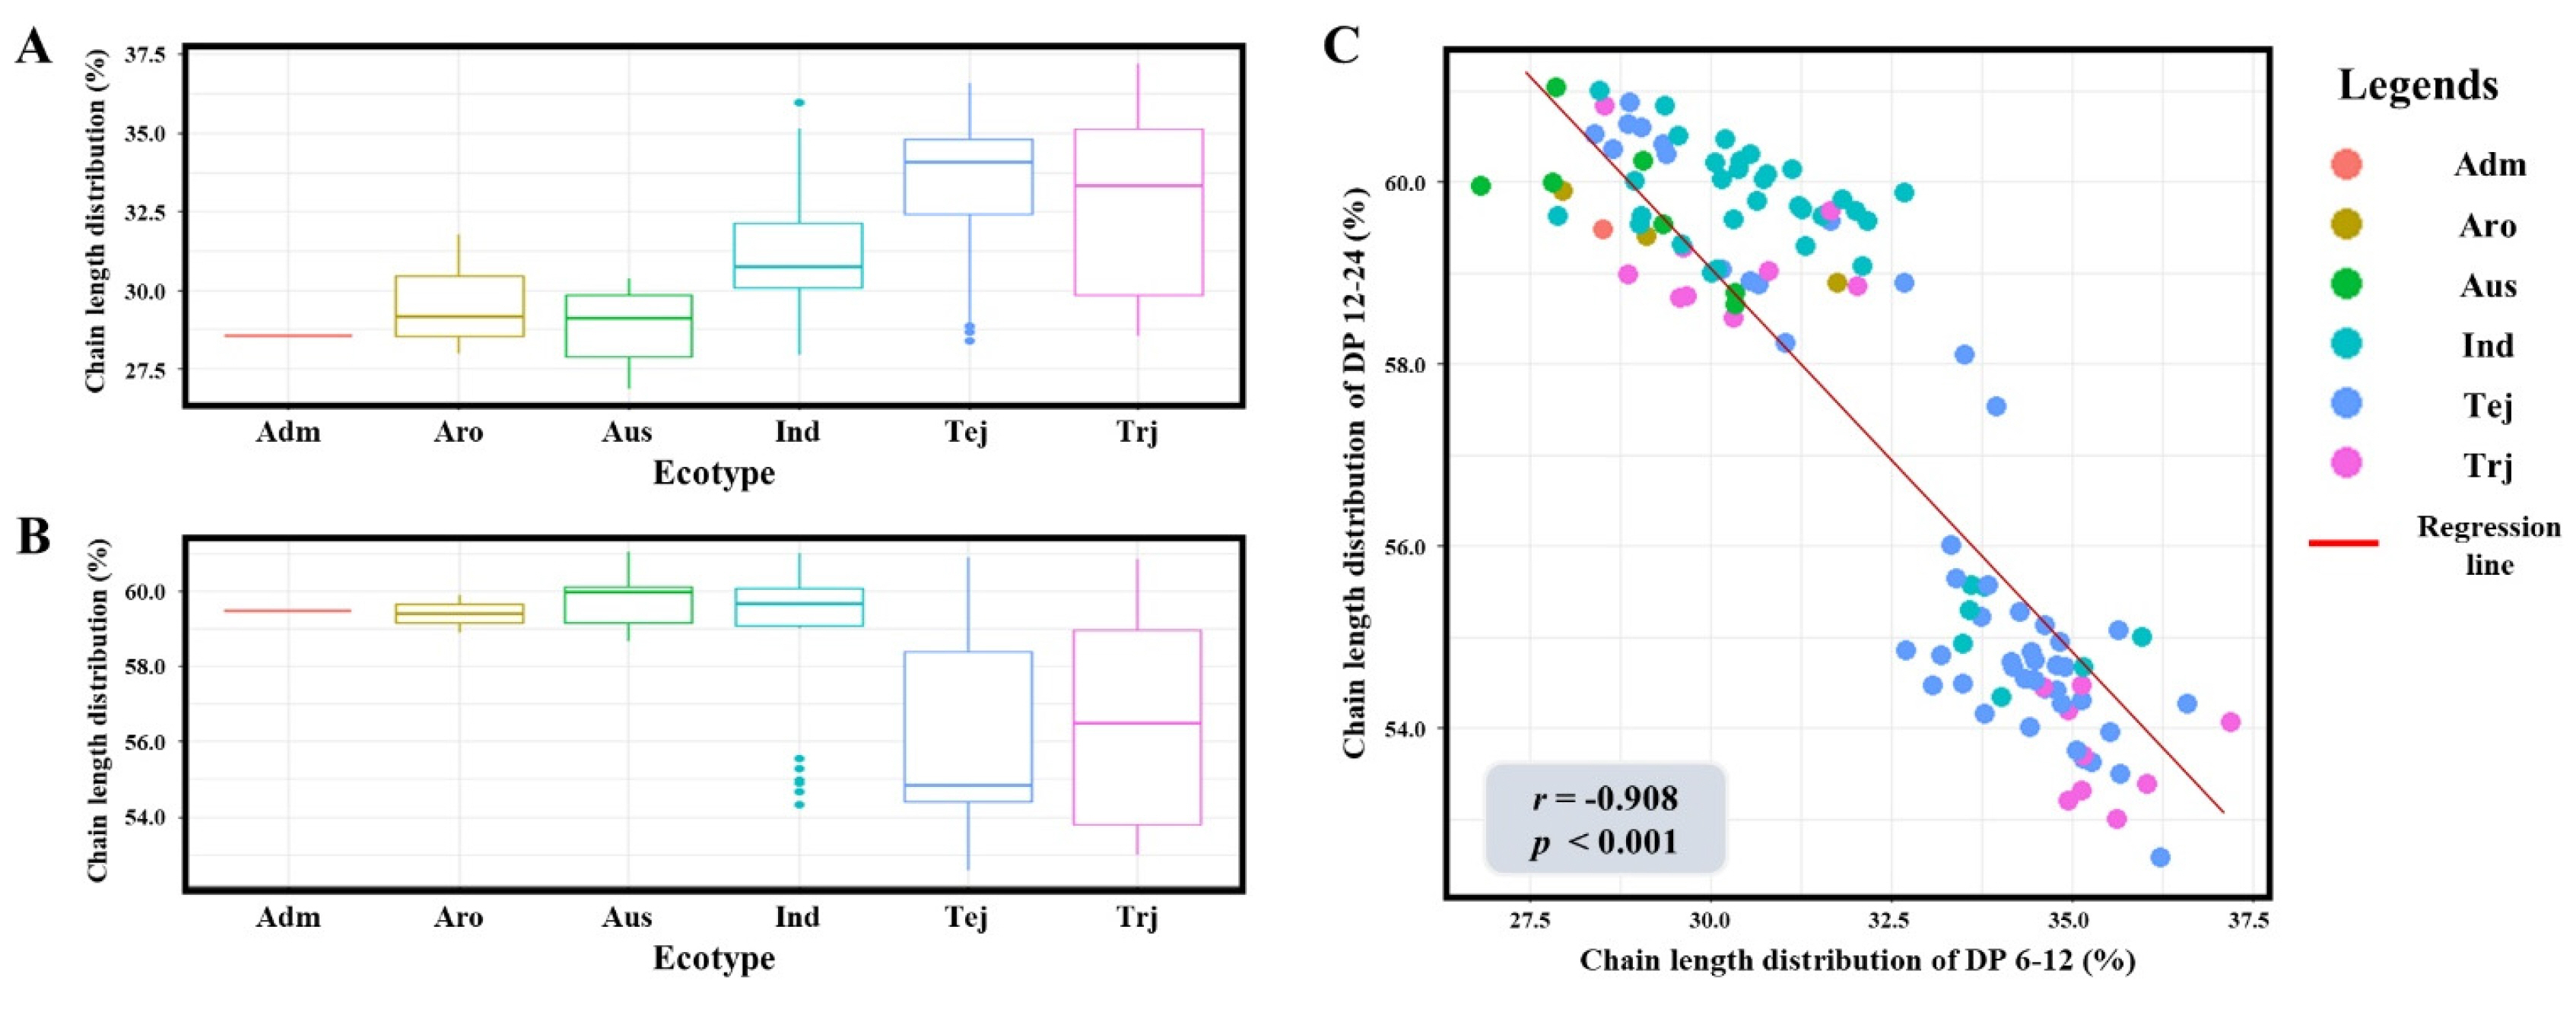
The fine structure of amylopectin, represented by the SCD and ICD, exhibited significant phenotypic variation across the 137 rice accessions. The SCD proportion ranged from 26.85% to 37.20%, while the ICD proportion varied from 52.57% to 61.04%, indicating a broad range of genetic diversity within the KRICE_Core. Boxplot analysis revealed a clear differentiation based on ecotypes; Temperate
japonica and Tropical
japonica were characterized by a higher proportion of short chains (~33-35%) compared to the
indica and
aus groups (~28-31%;
Fig. 1a). Conversely,
indica and
aus accessions showed a markedly higher distribution of intermediate chains (~59-60%) compared to the
japonica ecotypes (~54-57%;
Fig. 1b). To further elucidate the relationship between these two fractions, a correlation analysis was conducted. A robust negative correlation was identified between the proportions of DP 6-12 and DP 12-24, with a Pearson correlation coefficient of
r=-0.908 (
p<0.001;
Fig. 1c). This strong reciprocal relationship indicates that the elongation of branch chains is a highly coordinated process. Such distinct phenotypic divergence between ecotypes and the high degree of variation within the population provided a robust foundation for identifying the underlying genetic determinants via genome-wide association mapping.
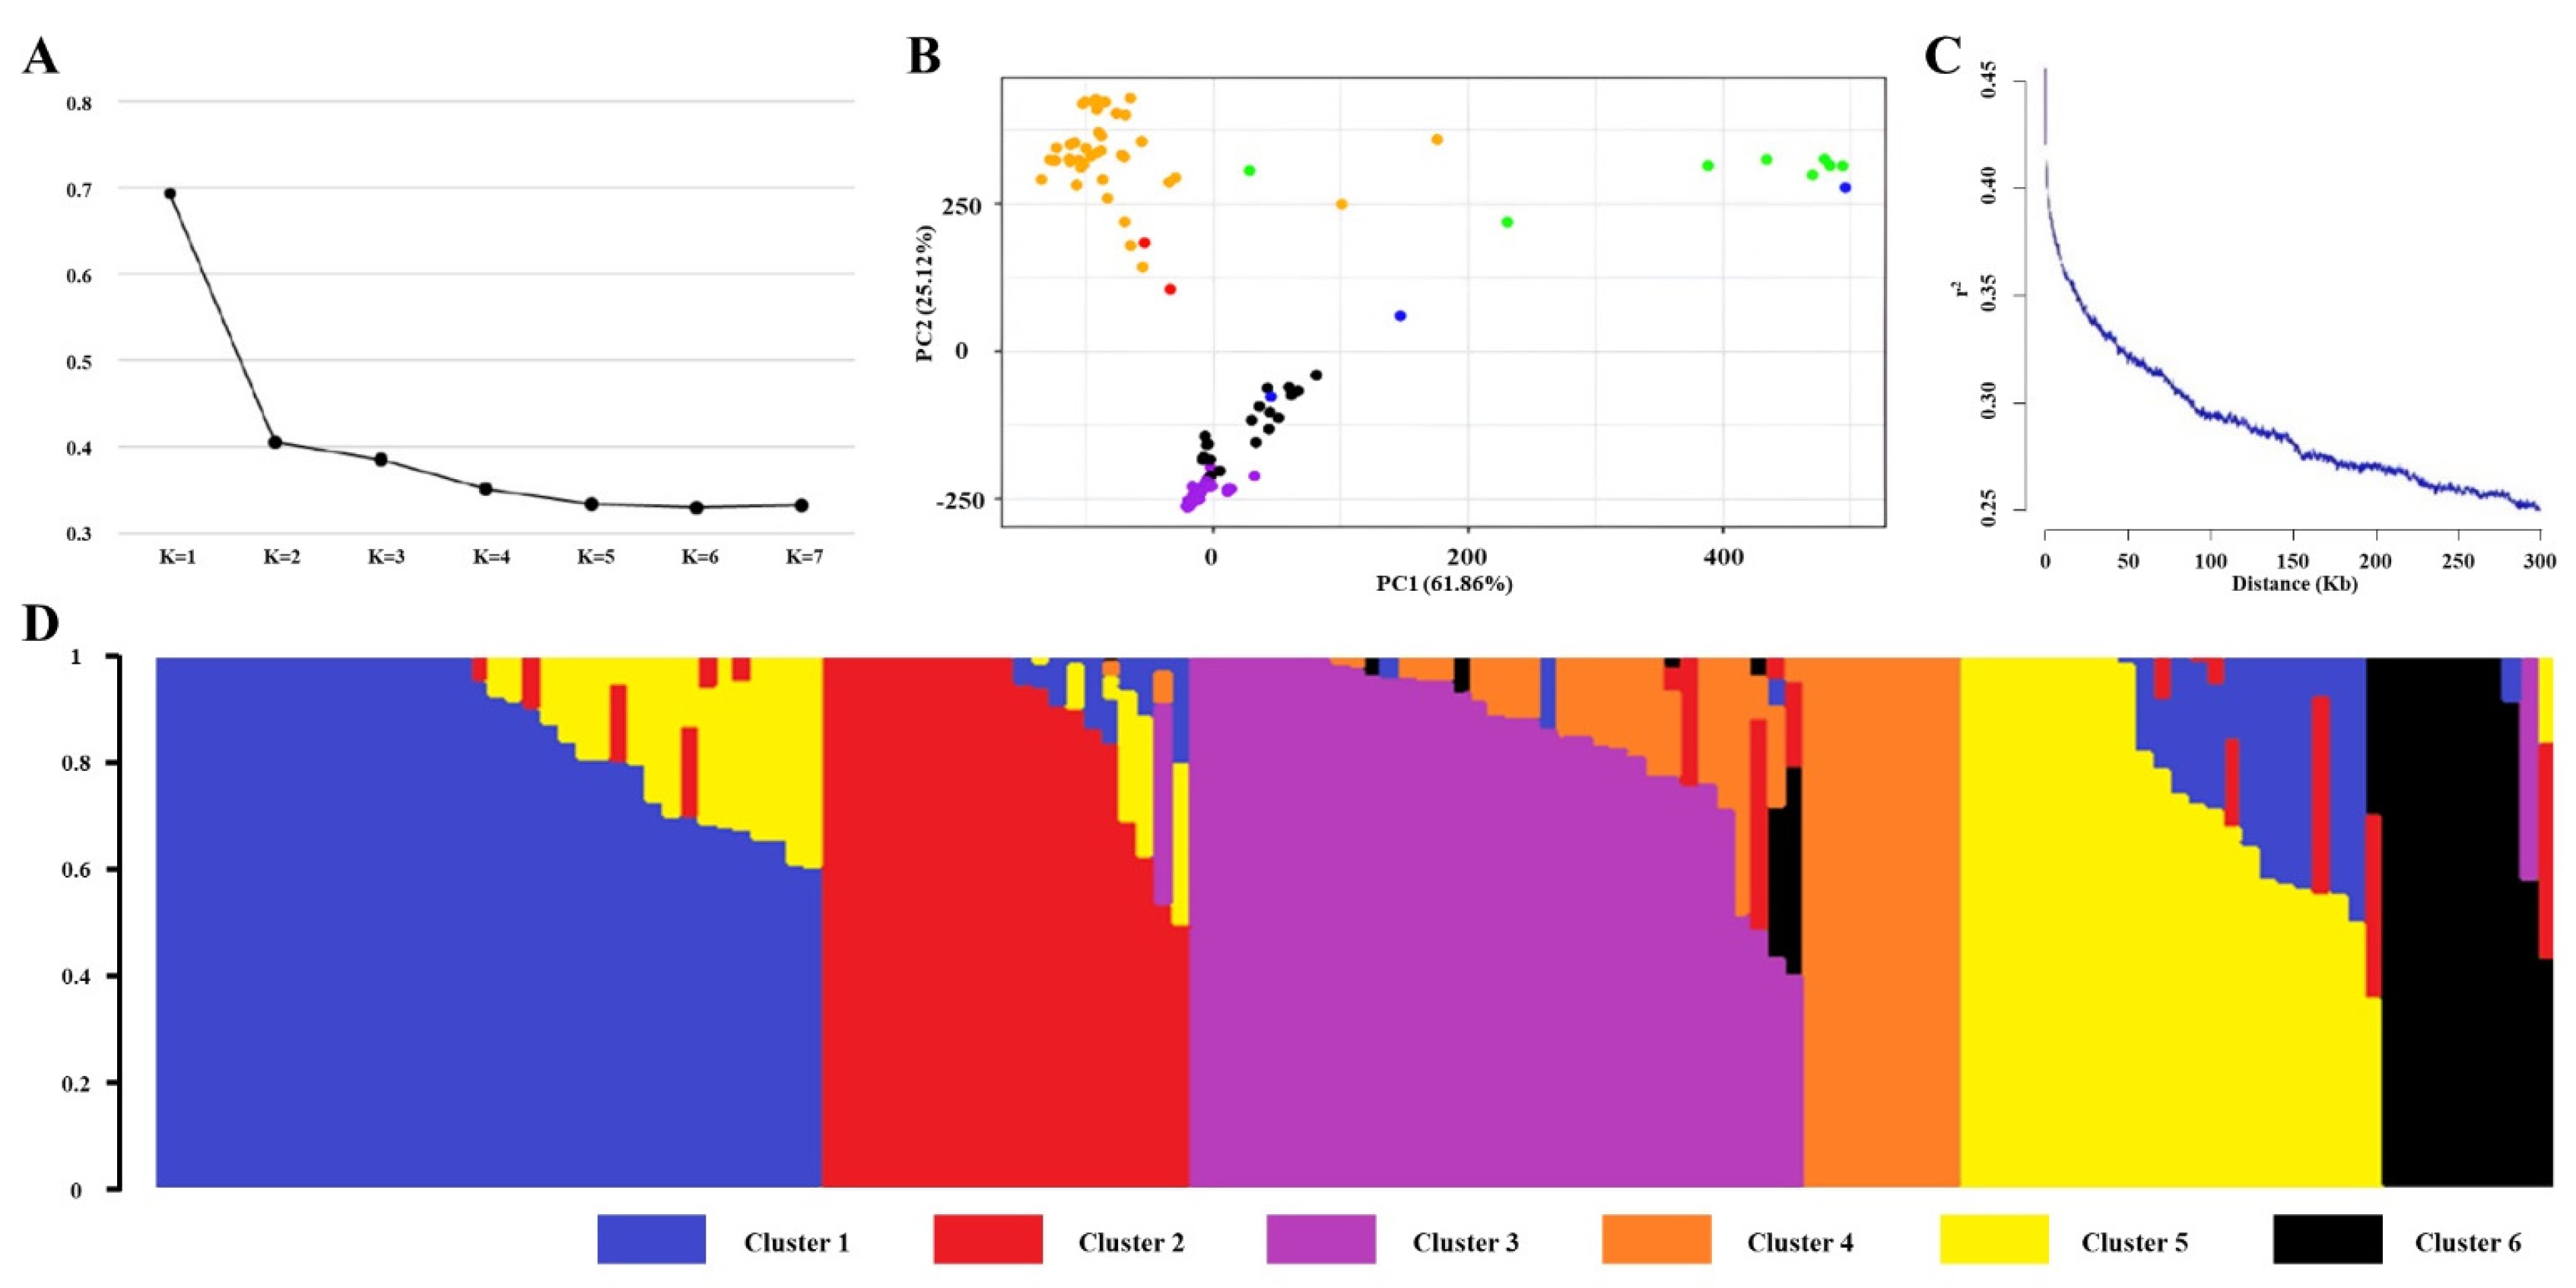
The CV analysis was performed using ADMIXTURE version 1.3.0, which identified K=6 as the optimal number of population groups based on the lowest error rates among tested K values (
Fig. 2a). PCA revealed that the first two principal components (PCs) explained 61.86% and 25.12% of the total variation, respectively, providing sufficient information for visualization. The PCA results clearly displayed distinct clusters corresponding to the Tropical
japonica, Temperate
japonica,
indica, and
aus subspecies (
Fig. 2b). Genome-wide LD decay was calculated using
r2 values between allele pairs across the 137 rice accessions. The maximum
r2 was 0.52, and the threshold for LD decay was set at 0.26 (half of the maximum
r2). The LD decay distance was estimated to be approximately 230 kb, defining the genomic candidate regions (
Fig. 2c). The population structure of the 137 rice accessions was visualized using Structure Plot V2.0, which divided the accessions into six groups based on their subspecies. Temperate
japonica was primarily assigned to Clusters 1 and 5, while
indica was found in Clusters 3 and 4.
Admixture accessions were shared between Clusters 2 and 3, and
aromatic accessions were placed in Clusters 2 and 6. Tropical
japonica showed dominance in Cluster 2, and
aus was primarily represented in Cluster 6 (
Fig. 2d).
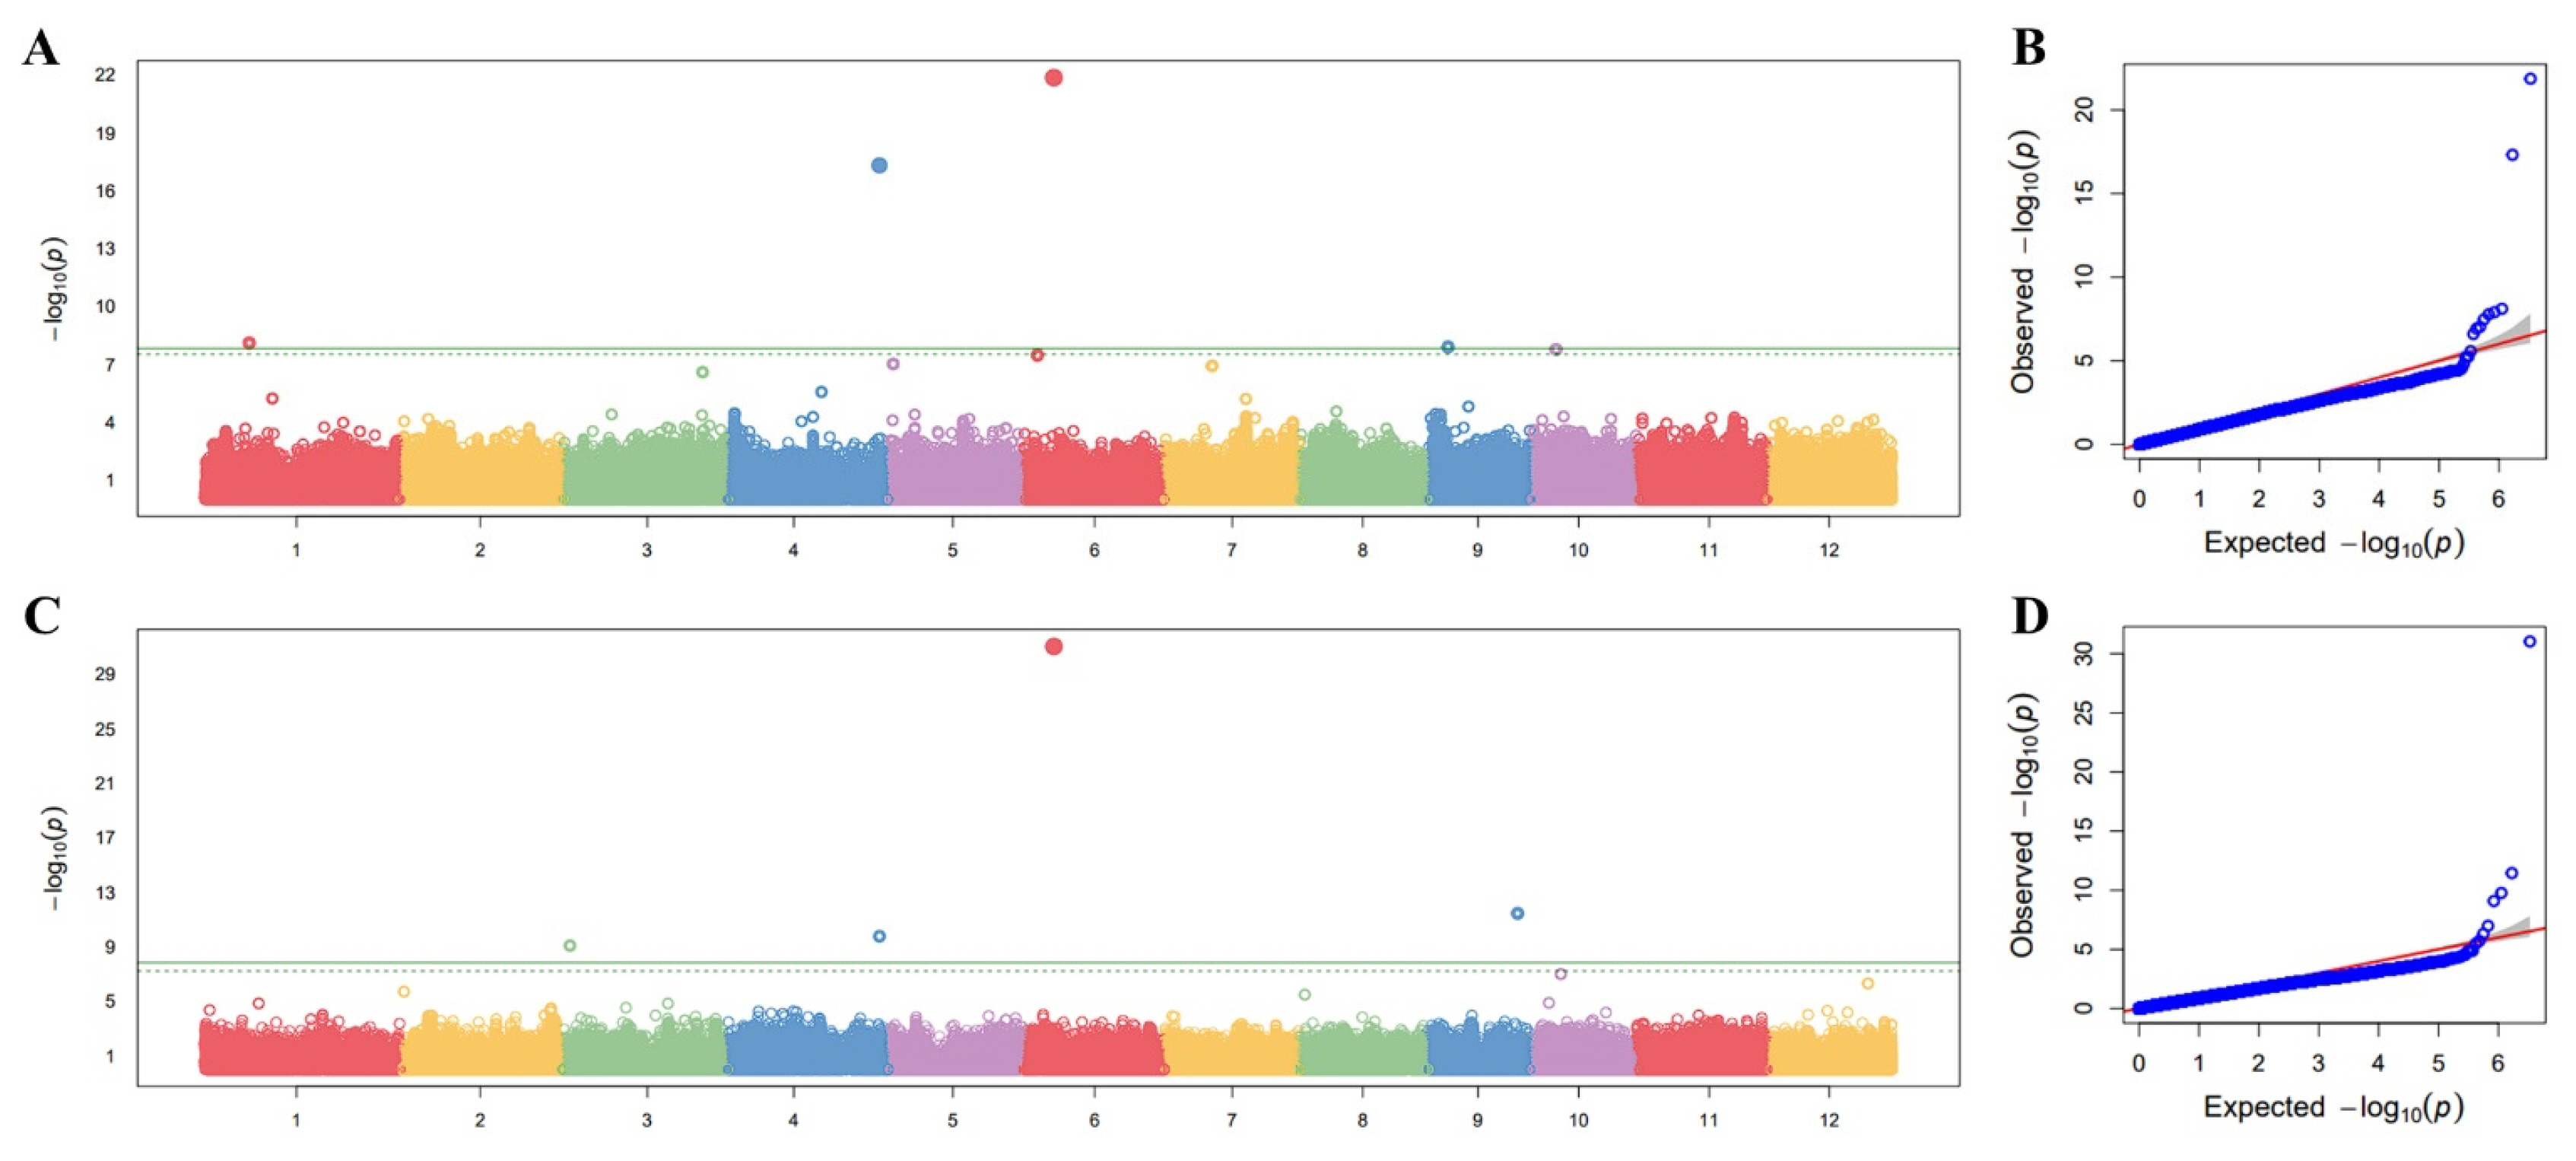
The GWAS analysis was performed to identify loci associated with amylopectin branch-chain length distribution, focusing on SCD and ICD. Association testing was conducted using the FarmCPU model implemented in the GAPIT package in R. A significance threshold of -log(
p)≥8.32 was set at a significance level of 0.01, following Bonferroni multiple test correction to minimize false positives in this GWAS. The Manhattan plots revealed multiple significant association signals for both traits (
Figs. 3a,
3c). Notably, prominent peaks were observed on chromosomes 4 and 6, with lead SNPs detected in both the SCD and ICD analyses. The chromosome 6 signal showed particularly strong statistical support, reaching approximately -log
10(
p)~21.9 for SCD and ~31.0 for ICD, consistent with a major-effect locus (
Table 1). The Q-Q plots showed close agreement between observed and expected
p-value distributions across most quantiles, with a clear deviation in the extreme tail (
Figs. 3b,
3d), supporting the presence of true association signals. For downstream interpretation and candidate-gene prioritization, we focused on lead SNPs that were consistently identified in both SCD and ICD GWAS (overlapping lead SNPs), thereby prioritizing loci with robust, cross-trait evidence that may reflect shared genetic determinants of amylopectin fine structure.
To further investigate the genetic basis of the major-effect QTL on chromosome 6, we performed a haplotype analysis of the candidate gene
Os06g0229800 (
SSIIa). Based on the resequencing data, five non-synonymous SNPs were identified within the coding regions: two in Exon 1 and 2, and three in Exon 8 (
Figs. 4a,
4b). Specifically, these variations included amino acid substitutions of D to E (6,748,824 bp), E to D (6,749,313 bp), S to G (6,752,357 bp), M to V (6,752,756 bp), and L to F (6,752,888 bp). Based on these five functional SNPs, the KRICE_Core accessions were classified into five distinct haplotypes (Hap1 to Hap5;
Fig. 4b). Significant differences in amylopectin chain length distribution were observed among the haplotypes. For SCD, Hap1 and Hap5 exhibited significantly higher proportions (~34-35%) compared to the other groups (
Fig. 4c). Conversely, for ICD, Hap2, Hap3, and Hap4 showed remarkably higher values (~59-60%), while Hap1 and Hap5 remained at lower levels (~54-55%;
Fig. 4d). This result indicates that the allelic variations in
SSIIa significantly shift the balance between short and intermediate chains in amylopectin. Ecotype distribution analysis further revealed the evolutionary context of these haplotypes (
Fig. 4e). Hap1 was exclusively found in Temperate
japonica varieties, while Hap4 was solely composed of
Indica accessions. Hap2 and Hap3 consisted of diverse ecotypes, including Tropical
japonica,
indica, and
Aus. These findings suggest that the functional differentiation of
SSIIa haplotypes is closely associated with the distinct starch properties observed between
japonica and
indica subspecies, particularly in the fine structure of amylopectin branch chains.
The distribution of
SSIIa haplotypes was investigated among 113 domestically developed Korean rice cultivars to evaluate the current status of genetic fixation. The analysis revealed a highly skewed distribution, with the majority of cultivars belonging to either Hap1 (48 cultivars, 42.5%) or Hap5 (64 cultivars, 56.6%). These two haplotypes together accounted for more than 99% of the total domestic panel, while Hap3 was identified in only a single cultivar (Mimyeon,
tongil type) and other haplotypes were entirely absent (
Table 2). This concentration of specific haplotypes indicates a strong directional selection for
japonica-type
SSIIa alleles during the Korean rice breeding process. As previously observed in the KRICE_Core, both Hap1 and Hap5 are associated with a higher proportion of SCD in amylopectin, a characteristic trait of temperate
japonica rice with high palatability.
Discussion
Identification of Major QTLs and Prioritization of SSIIa
In this study, GWAS was employed to dissect the genetic architecture of amylopectin branch-chain length distribution, identifying two prominent genomic regions on chromosomes 4 and 6. The signal on chromosome 6 (
qSC6,
qIC6) exhibited exceptional statistical significance, with –log (
p) values exceeding 30, and its location directly corresponded to the well-characterized starch synthase gene,
SSIIa. Interestingly, the QTL on chromosome 4 (
qSC4,
qIC4) overlapped with previously reported loci associated with grain chalkiness, such as
qACE4 and
qDCE4 (
Gao et al. 2016). This suggests that amylopectin fine structure may play a crucial role not only in determining starch physicochemical properties but also in influencing grain appearance and development. However, our inability to detect significant haplotype variations within the exons of candidate genes in the chromosome 4 region implies that the observed trait variation may be governed by regulatory elements rather than changes in the protein-coding sequences. Beyond its effect on amylopectin chain-length distribution, the overlap of the chromosome 4 locus with chalkiness-related QTLs raises the possibility of pleiotropy between endosperm starch architecture and grain appearance traits. Chalkiness is frequently associated with altered packing and morphology of starch granules in the endosperm, and several stable chalkiness QTLs have been mapped to chromosome 4. Fine mapping of
qWCR4, for example, narrowed the locus to a small interval containing candidate genes showing endosperm expression differences and accompanying changes in starch granule morphology, supporting the concept that starch deposition dynamics can underlie chalkiness phenotypes. Integrating chain-length phenotypes with grain appearance traits in the same panel, together with transcriptomic and/or eQTL analyses during grain filling, will be valuable to distinguish pleiotropy from linkage and to pinpoint causal regulatory variants (
Gao et al. 2016;
Shi et al. 2022).
The haplotype analysis of
SSIIa revealed that five non-synonymous SNPs are critical determinants of the balance between SCD and ICD distributions. Haplotypes Hap1 and Hap5, which are predominant in
japonica rice, were significantly associated with an increased proportion of short chains. In contrast, the
indica-related haplotypes (Hap2, Hap3, and Hap4) were linked to higher intermediate-chain proportions. These structural differences are biologically significant as they directly modulate the gelatinization temperature and palatability of rice starch, factors that define the distinct cooking qualities of
japonica and
indica subspecies. The high significance of specific amino acid substitutions suggests that
SSIIa has been a primary target of selection during the evolutionary divergence of rice starch quality. Functionally, these haplotype effects are consistent with extensive genetic and biochemical evidence that
SSIIa elongates short amylopectin chains into intermediate chains, thereby shifting the balance between short and intermediate fractions. In
japonica rice, reduced
SSIIa activity is largely explained by characteristic SNP combinations concentrated in exon 8, which increase the proportion of short chains and lower gelatinization temperature, whereas
indica-type alleles generally promote chain elongation and higher gelatinization temperature. Accordingly, the Hap1/Hap5 (
japonica-related) versus Hap2-Hap4 (
indica-related) trends observed here provide a mechanistic link between allelic variation at
SSIIa and the quantitative shifts in chain-length distribution captured in our GWAS (
Miura et al. 2018;
Nakamura et al. 2005;
Waters et al. 2006).
The distribution of SSIIa haplotypes in 113 domestically developed Korean cultivars provides a striking example of genetic fixation resulting from intense directional selection. The fact that over 99% of the cultivars belong to either Hap1 (42.5%) or Hap5 (56.6%) indicates that Korean breeding efforts have consistently prioritized the japonica-type amylopectin structure. This structure is essential for achieving the soft and sticky texture preferred in the Korean market. While this selection has led to high genetic homogeneity and predictable quality in domestic varieties, it also highlights a narrow genetic base. The near-total absence of indica-type haplotypes like Hap2 and Hap4 reflects a rigid breeding focus on maintaining traditional japonica starch properties.
Future Perspectives and Conclusion
While this study successfully characterized the dominant influence of
SSIIa, the failure to identify causal variants in the coding regions of the chromosome 4 locus points toward a need for broader genomic exploration. It is highly probable that the phenotypic variations associated with the chromosome 4 QTL are driven by variations in promoter regions or other non-coding regulatory elements that affect gene expression levels. Therefore, future research will focus on analyzing the promoter sequences and transcriptional profiles of candidate genes in this region. Furthermore, by integrating the markers identified in this study, breeders could potentially fine-tune amylopectin fine structure to develop novel rice varieties with customized textures and properties, catering to the diverse needs of the modern food industry and an aging population. In addition, starch phenotypes are shaped by regulatory networks coordinating multiple starch synthesis-related genes. Transcription factors such as
OsbZIP58 have been shown to directly regulate the expression of key starch biosynthetic genes, while Rice Starch Regulator1 (RSR1) was reported as a negative regulator whose loss-of-function increases amylose content, alters amylopectin fine structure, and changes gelatinization temperature. Therefore, future allele-mining and functional validation should extend beyond coding variants to include promoter and other cis-regulatory variants of SSRGs and their upstream regulators, ideally integrating eQTL mapping and endosperm-stage transcriptomics to identify causal regulatory polymorphisms (
Fu et al. 2010;
Wang et al. 2013).
Supplemental Materials
Acknowledgments
This work was supported for 2 years by Pusan National University.
Fig. 1Phenotypic variation and correlation analysis of amylopectin chain length distribution across diverse rice ecotypes. (a) Distribution of short-chain amylopectin (DP 6-12) among six rice ecotypes. (b) Distribution of intermediate-chain amylopectin (DP 12-24) among six rice ecotypes. (c) Pearson correlation analysis between the proportions of DP 6-12 and DP 12-24. Adm: admixture, Aro: aromatic, Ind: indica, Tej: Temperate japonica, Trj: Tropical japonica. The regression line in (c) indicates a strong negative correlation (r=-0.908, p<0.001).

Fig. 2Population structure analysis. (a) Cross-validation error of diverse groups (K). The dotted transverse line represents the lowest level. (b) Principal Component Analysis (PC1 and PC2). Pink, orange, blue, green, yellow, and red represent the Temperate japonica, Tropical japonica, indica, aus, aromatic, and admixture rice subspecies, respectively. (c) Genome-wide linkage disequilibrium. (d) Structure analysis outcome (K=6).

Fig. 3Genome-wide association mapping for amylopectin chain length distribution traits. (a) Manhattan plot representing significant SNPs associated with short-chain distribution (DP 6-12). (b) Quantile-quantile (Q-Q) plot for DP 6-12, confirming the statistical reliability of the FarmCPU model. (c) Manhattan plot for intermediate-chain distribution (DP 12-24). (d) Q-Q plot for DP 12-24. The horizontal green lines indicate the significance threshold.

Fig. 4Haplotype analysis of Os06g0229800. (a) Schematic diagram of the SSIIa gene structure. Black, grey blocks and gray line represent exon, untranslated region and intron regions, (b) Haplotype analysis of Os06g0229800 in 137 KRICE_Core. (c) Boxplot displaying the phenotypic distribution of short chain length among various haplotypes. Letters a and b represent significant differences at **p<0.01 (Duncan’s test). (d) Boxplot displaying the phenotypic distribution of intermediate chain length among various haplotypes. Letters a and b represent significant differences at **p<0.01 (Duncan’s test). (e) Pie charts illustrating the distribution of identified haplotypes across various rice subspecies.
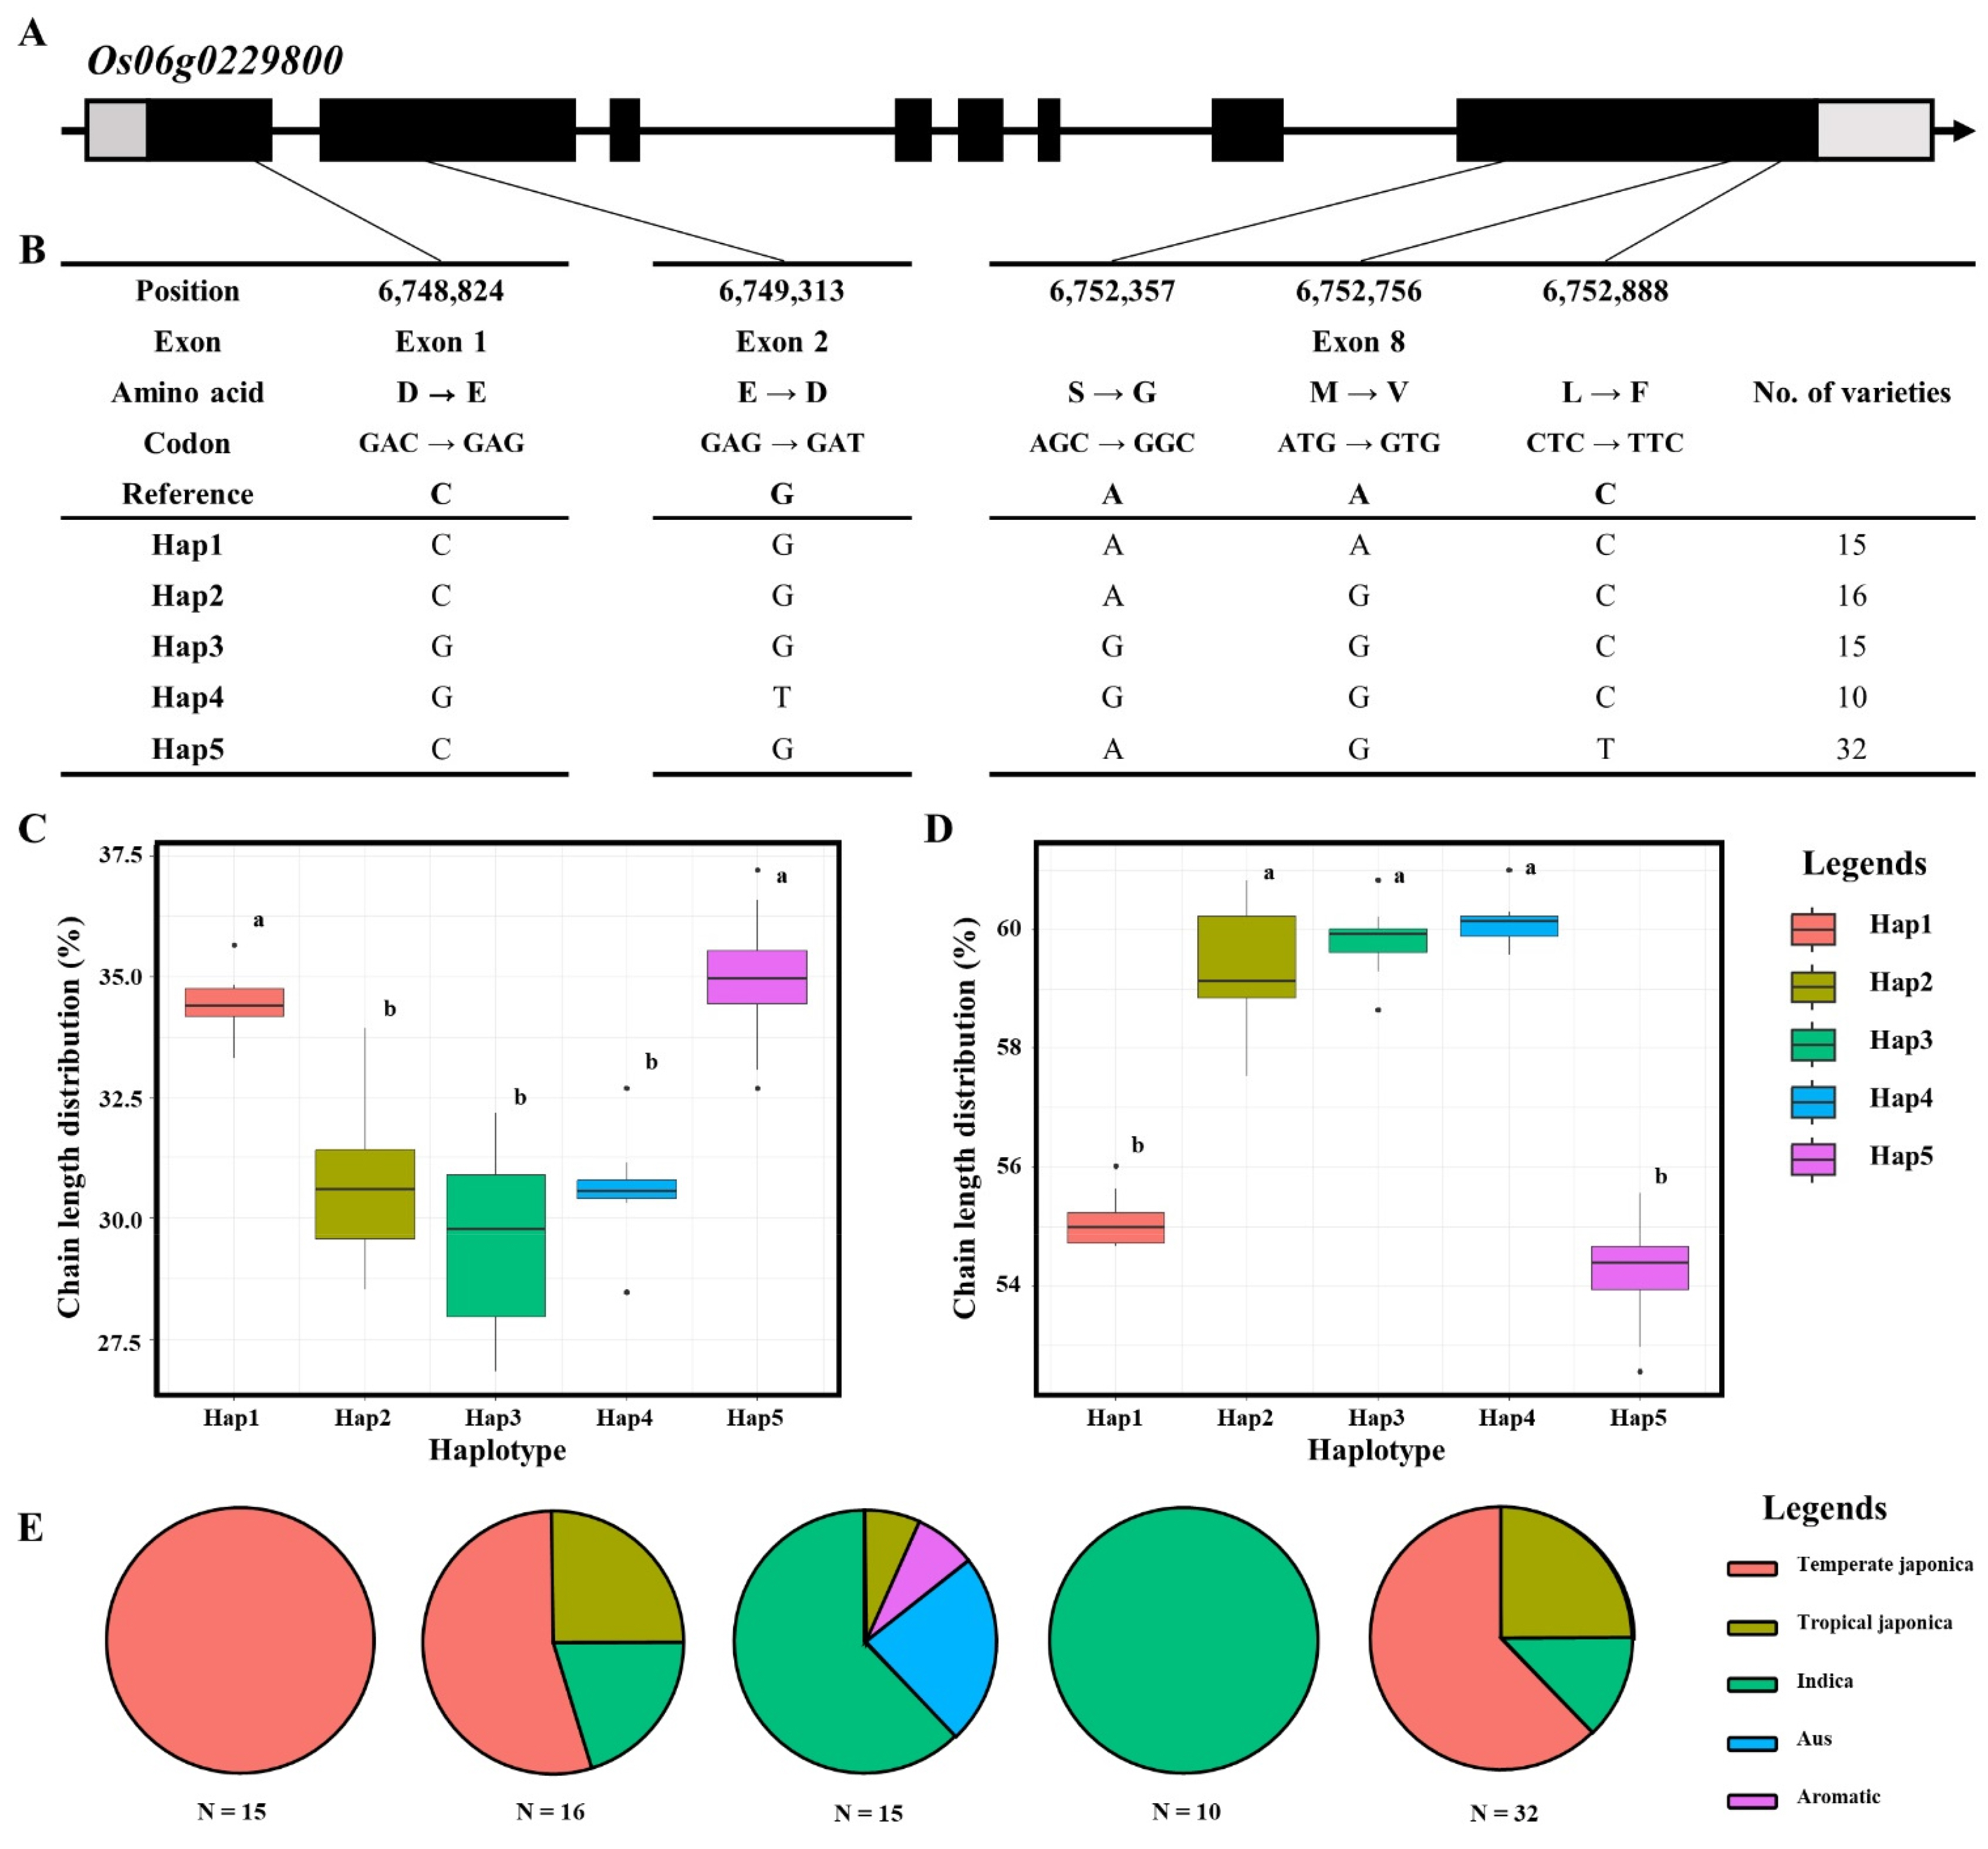
Table 1Overlapping lead SNPs and candidate regions identified in genome-wide association study for amylopectin chain length distribution.
Table 1
|
Traits |
QTLs |
Genomic region (Mbp) |
Chr. |
-log10(P) |
Reported QTLs or genes |
Reference of Previously Reported QTL |
|
|
Accession |
Related Trait |
|
SCDz
|
qSC4
|
33.5 |
4 |
17.3 |
qACE4
qDCE4
qPGWC4
|
ACEx
DCEw
PGWCv
|
, Gao et al. 2016
|
|
ICDy
|
qIC4
|
9.77 |
|
|
SCD |
qSC6
|
6.7 |
6 |
21.9 |
SSIIa
|
Starch synthase |
, Nakamura et al. 2005
|
|
ICD |
qIC6
|
31.0 |
Table 2Distribution of SSIIa haplotypes in 113 domestically developed Korean-bred varieties.
Table 2
|
Position |
6,748,824 |
6,749,313 |
6,752,357 |
6,752,756 |
6,752,888 |
No. of varieties |
|
Exon |
Exon 1 |
Exon 2 |
Exon 8 |
Exon 8 |
Exon 8 |
|
Reference |
C |
G |
A |
A |
C |
|
|
Hap1 |
C |
G |
A |
A |
C |
48 |
|
Hap3 |
G |
G |
G |
G |
C |
1 |
|
Hap5 |
C |
G |
A |
G |
T |
64 |
References
- Abe N, Asai H, Yago H, Oitome NF, Itoh R, Crofts N, et al. 2014. Relationships between starch synthase I and branching enzyme isozymes determined using double mutant rice lines. BMC Plant Biol. 14(1): 80
- Alam M, Lou G, Abbas W, Osti R, Ahmad A, Bista S, et al. 2024. Improving rice grain quality through ecotype breeding for enhancing food and nutritional security in Asia-Pacific region. Rice. 17(1): 47
- Alexander DH, Novembre J, Lange K. 2009. Fast model-based estimation of ancestry in unrelated individuals. Genome Res. 19(9): 1655-1664.
- Apriyanto A, Compart J, Fettke J. 2022. A review of starch, a unique biopolymer-Structure, metabolism and in planta modifications. Plant Sci. 318: 111223
- Armstrong RA. 2014. When to use the B onferroni correction. Ophthalmic Physiol. Opt. 34(5): 502-508.
- Bao J, Deng B, Zhang L. 2023. Molecular and genetic bases of rice cooking and eating quality: An updated review. Cereal Chem. 100(6): 1220-1233.
- Bowen D, Yanni Z, Fan Z, Wensheng W, Jianlong X, Yu Z, et al. 2024. Genome-wide association study of cooked rice textural attributes and starch physicochemical properties in indica rice. Rice Sci. 31(3): 300-316.
- Calingacion M, Laborte A, Nelson A, Resurreccion A, Concepcion JC, Daygon VD, et al. 2014. Diversity of global rice markets and the science required for consumer-targeted rice breeding. PLoS One. 9(1): e85106
- Chávez-Murillo CE, Wang YJ, Bello-Pérez LA. 2008. Morphological, physicochemical and structural characteristics of oxidized barley and corn starches. Starch-Stärke. 60(11): 634-645.
- Chen Y, Shi H, Yang G, Liang X, Lin X, Tan S, et al. 2024. OsCRLK2, a Receptor-Like kinase identified by QTL analysis, is involved in the regulation of rice quality. Rice. 17(1): 24
- Chen Y, Wang M, Ouwerkerk PB. 2012. Molecular and environmental factors determining grain quality in rice. Food Energy Secur. 1(2): 111-132.
- Chen Z, Lu Y, Feng L, Hao W, Li C, Yang Y, et al. 2020. Genetic dissection and functional differentiation of ALK a and ALK b, two natural alleles of the ALK/SSIIa gene, responding to low gelatinization temperature in rice. Rice. 13(1): 39
- Farzad Amirebrahimi F, Saidi A, Ahmadikhah A. 2025. Genome-wide association study (GWAS) and transcription analysis of candidate genes for rice grain eating and cooking quality (ECQ) traits. BMC Genom.
- Fitzgerald MA, McCouch SR, Hall RD. 2009. Not just a grain of rice: The quest for quality. Trends Plant Sci. 14(3): 133-139.
- Fu F-F, Xue H-W. 2010. Coexpression analysis identifies rice starch regulator1, a rice AP2/EREBP family transcription factor, as a novel rice starch biosynthesis regulator. Plant Physiol. 154(2): 927-938.
- Gao Y, Liu C, Li Y, Zhang A, Dong G, Xie L, et al. 2016. QTL analysis for chalkiness of rice and fine mapping of a candidate gene for qACE9. Rice. 9(1): 41
- He W, Liu X, Lin L, Xu A, Hao D, Wei C. 2020. The defective effect of starch branching enzyme IIb from weak to strong induces the formation of biphasic starch granules in amylose-extender maize endosperm. Plant Mol Biol. 103(3): 355-371.
- Hori K, Shenton M, Mochizuki K, Suzuki K, Iijima K, Kuya N, et al. 2025. QTN detection and candidate gene identification for improved eating and cooking quality in rice using GWAS and PLS regression analysis. Theor. Appl. Genet. 138(3): 58
- Hu Y, Zhang Y, Yu S, Deng G, Dai G, Bao J. 2022. Combined effects of BEIIb and SSIIa alleles on amylose contents, starch fine structures and physicochemical properties of indica rice. Foods. 12(1): 119
- Huang L, Tan H, Zhang C, Li Q, Liu Q. 2021. Starch biosynthesis in cereal endosperms: An updated review over the last decade. Plant Commun. 2(5): 100237
- Kawahara Y, de la Bastide M, Hamilton JP, Kanamori H, McCombie WR, Ouyang S, et al. 2013. Improvement of the Oryza sativa Nipponbare reference genome using next generation sequence and optical map data. Rice. 6(1): 4
- Kharabian-Masouleh A, Waters DL, Reinke RF, Ward R, Henry RJ. 2012. SNP in starch biosynthesis genes associated with nutritional and functional properties of rice. Sci. Rep. 2(1): 557
- Kim K-W, Chung H-K, Cho G-T, Ma K-H, Chandrabalan D, Gwag J-G, et al. 2007. PowerCore: A program applying the advanced M strategy with a heuristic search for establishing core sets. Bioinformatics. 23(16): 2155-2162.
- Kim T-S, He Q, Kim K-W, Yoon M-Y, Ra W-H, Li FP, et al. 2016. Genome-wide resequencing of KRICE_CORE reveals their potential for future breeding, as well as functional and evolutionary studies in the post-genomic era. BMC Genom. 17(1): 408
- Li H, Gilbert RG. 2018. Starch molecular structure: The basis for an improved understanding of cooked rice texture. Carbohydr. Polym. 195: 9-17.
- Li R, Zheng W, Jiang M, Zhang H. 2021. A review of starch biosynthesis in cereal crops and its potential breeding applications in rice (Oryza sativa L.). PeerJ. 9: e12678
- Lipka AE, Tian F, Wang Q, Peiffer J, Li M, Bradbury PJ, et al. 2012. GAPIT: Genome association and prediction integrated tool. Bioinformatics. 28(18): 2397-2399.
- Liu X, Huang M, Fan B, Buckler ES, Zhang Z. 2016. Iterative usage of fixed and random effect models for powerful and efficient genome-wide association studies. PLoS Genet. 12(2): e1005767
- Luo M, Gong W, Zhang S, Xie L, Shi Y, Wu D, et al. 2023. Discrepancies in resistant starch and starch physicochemical properties between rice mutants similar in high amylose content. Front. Plant Sci. 14: 1267281
- Miura S, Crofts N, Saito Y, Hosaka Y, Oitome NF, Watanabe T, et al. 2018. Starch synthase IIa-deficient mutant rice line produces endosperm starch with lower gelatinization temperature than japonica rice cultivars. Front. Plant Sci. 9: 645
- Moreno-Zaragoza J, Alvarez-Ramirez J, Dhital S, Bello-Pérez LA. 2024. Chromatographic analysis of branched and debranched starch structure: Variability of their results. Int. J. Biological Macromol. 281: 136639
- Nakamura Y, Francisco PB, Hosaka Y, Sato A, Sawada T, Kubo A, et al. 2005. Essential amino acids of starch synthase IIa differentiate amylopectin structure and starch quality between japonica and indica rice varieties. Plant Mol. Biol. 58(2): 213-227.
- Pang Y, Ali J, Wang X, Franje NJ, Revilleza JE, Xu J, et al. 2016. Relationship of rice grain amylose, gelatinization temperature and pasting properties for breeding better eating and cooking quality of rice varieties. PLoS One. 11(12): e0168483
- Purcell S, Neale B, Todd-Brown K, Thomas L, Ferreira MA, Bender D, et al. 2007. PLINK: A tool set for whole-genome association and population-based linkage analyses. Am. J. Hum. Genet. 81(3): 559-575.
- RCoreTeam.2022. R: A language and environment for statistical computing (Version 4.2.0) [Computer software].
- Rezvi HUA, Tahjib-Ul-Arif M, Azim MA, Tumpa TA, Tipu MMH, Najnine F, et al. 2023. Rice and food security: Climate change implications and the future prospects for nutritional security. Food Energy Secur. 12(1): e430
- Sasaki T, Matsuki J, Yoza K, Sugiyama J, Maeda H, Shigemune A, et al. 2019. Comparison of textural properties and structure of gels prepared from cooked rice grain under different conditions. Food Sci. Nutr. 7(2): 721-729.
- Shi H, Zhu Y, Yun P, Lou G, Wang L, Wang Y, et al. 2022. Fine mapping of qWCR4, a rice chalkiness QTL affecting yield and quality. Agronomy. 12(3): 706
- Shoukat R, Cappai M, Pilia L, Pia G. 2025. Rice starch chemistry, functional properties, and industrial applications: A review. Polymers. 17(1): 110
- Tu D, Jiang Y, Salah A, Xi M, Cai M, Cheng B, et al. 2023. Variation of rice starch structure and physicochemical properties in response to high natural temperature during the reproductive stage. Front. Plant Sci. 14: 1136347
- Wang J-C, Xu H, Zhu Y, Liu Q-Q, Cai X-L. 2013. OsbZIP58, a basic leucine zipper transcription factor, regulates starch biosynthesis in rice endosperm. J. Exp. Bot. 64(11): 3453-3466.
- Waters DL, Henry RJ, Reinke RF, Fitzgerald MA. 2006. Gelatinization temperature of rice explained by polymorphisms in starch synthase. Plant Biotechnol. J. 4(1): 115-122.
- Yaling C, Yuehan P, Jinsong B. 2020. Expression profiles and protein complexes of starch biosynthetic enzymes from white-core and waxy mutants induced from high amylose indica rice. Rice Sci. 27(2): 152-161.
- Zhang C, Dong S-S, Xu J-Y, He W-M, Yang T-L. 2019. PopLDdecay: A fast and effective tool for linkage disequilibrium decay analysis based on variant call format files. Bioinformatics. 35(10): 1786-1788.
- Zhang L, Zhang C, Yan Y, Hu Z, Wang K, Zhou J, et al. 2021. Influence of starch fine structure and storage proteins on the eating quality of rice varieties with similar amylose contents. J. Sci. Food Agric. 101(9): 3811-3818.
- Zhao W, Cho G-T, Ma K-H, Chung J-W, Gwag J-G, Park Y-J. 2010. Development of an allele-mining set in rice using a heuristic algorithm and SSR genotype data with least redundancy for the post-genomic era. Mol. Breed. 26(4): 639-651.
- Zhou H, Xia D, Zhao D, Li Y, Li P, Wu B, et al. 2021. The origin of Wxla provides new insights into the improvement of grain quality in rice. J. Integr. Plant Biol. 63(5): 878-888.