Abstract
Perilla frutescens is a traditionally cultivated crop in East Asia that exhibits significant morphological variation between its two main variants: var. frutescens and var. crispa. To investigate the genetic basis of trait variation and segregation, we developed an F2 population from a cross between weedy accessions of the two variants of Perilla and analyzed 107 individuals. Four qualitative and nine quantitative traits were evaluated, including leaf color, stem color, flower color, days to flowering, plant height, and leaf area. The F2 population showed wide phenotypic variation. In the chi-square test for four qualitative traits, two traits (color of leaf reverse side, color of flower) followed a Mendelian segregation ratio of 1:2:1. Heritability analysis revealed high values for days to flowering and leaf width. In contrast, traits such as number of florets and leaf length exhibited lower heritability, indicating a more substantial influence of environmental factors. Hierarchical clustering analysis grouped the parental lines into distinct clusters, revealing a diverse distribution of F2 individuals across multiple groups. Some individuals closely resembled one of the parents, while others formed novel clusters, reflecting recombination and the emergence of new trait combinations. These findings underscore the genetic complexity underlying morphological traits in Perilla and highlight the potential of weedy accessions as valuable resources for breeding. The foundation established by this study will aid in developing new cultivars with desirable traits.
-
Key words: Perilla frutescens, F2 population, Weedy type, Leaf color, Morphological variation
Introduction
Perilla frutescens var.
frutescens (PF) and
Perilla frutescens var.
crispa (PC) are self-pollinating plants classified as variants within the
Perilla species. They have been cultivated and utilized for centuries in East Asia, with PF primarily grown as an oilseed or leaf vegetable crop in South Korea and PC mainly cultivated as a medicinal plant or vegetable crop in China and Japan. While the wild progenitors of the
Perilla crop in East Asia have not yet been identified, weedy forms of both PF and PC have been reported in countries such as South Korea, Japan, and China (
Lee et al. 2001,
2003;
Nitta et al. 1999,
2003).
The PF and PC of the
Perilla crop are distinctly differentiated based on various morphological characteristics, including plant size, plant aroma, leaf and stem color, flower color, and seed size and hardness (
Lee et al. 2001). However, both variants of the
Perilla crop share the same chromosome number (2n=40) (
Honda et al. 1994;
Yamane 1950) and can be crossbred through artificial hybridization (
Honda et al. 1990;
Lim et al. 2019;
Nagai 1935). Additionally, two weedy types of
Perilla have been reported to occur naturally in East Asia: the weedy type of var.
frutescens (WPF) and the weedy type of var.
crispa (WPC). Morphologically, WPF closely resembles PF, while WPC shares similarities with PC (
Lee et al. 2002,
2003;
Nitta et al. 1999). Furthermore, PC is further classified into multiple variants based on leaf color and shape morphological characteristics, such as green-leaf, red-leaf, wrinkled-leaf, and smooth-leaf (
Makino 1966).
In East Asia, PF is most extensively cultivated and utilized in South Korea, while PC is primarily grown and used in Japan (
Nitta 2001;
Nitta et al. 2003). In South Korea today, the cultivation area of PF is gradually expanding, not only for edible oil production but also due to its increasing use as a leafy vegetable alongside meat consumption. However, PC is rarely cultivated in South Korea. In contrast, PC is widely cultivated and used in Japan, whereas PF is seldom grown. Among the PC variants used in Japan, green-leaf PC is mainly consumed as a fresh garnish, while red-leaf PC is used to impart a red color to
umeboshi, a traditional Japanese pickled plum dish (
Nitta et al. 2003). The cultivation history of the
Perilla crop in East Asia is very long; however, the wild progenitors of the
Perilla crop and the differentiation process between PF and PC remain unclear. Additionally, some accessions of weedy
Perilla have been reported to originate from natural hybridization between PF and PC (
Lee et al. 2002,
2003;
Nitta et al. 1999).
To enhance the improvement and development of
Perilla crop varieties, it is essential to understand the genetic differences between parent lines and analyze trait variations across generations. In particular, genetic analysis using an F
2 population is a crucial process for investigating the genetic mechanisms underlying trait expression and provides fundamental information for selecting desirable traits in the breeding process (
Kim et al. 2021;
Lim et al. 2019;
Shrestha et al. 2024). While significant crops such as rice, maize, and soybean have undergone extensive genetic analysis using molecular markers in segregating populations, systematic studies on morphological traits remain relatively insufficient for minor crops like
Perilla. Although environmental factors influence morphological characteristics, they play a crucial role as selection criteria in breeding and serve as fundamental data for understanding the correlation between genotype and phenotype (
Giménez et al. 2021;
Lim et al. 2019). Therefore, comprehensive research analyzing the segregation patterns of quantitative and qualitative traits in the F
2 population of
Perilla is necessary. Additionally, to better understand the differentiation within
Perilla species, it is essential to elucidate the genetic basis of quantitative and qualitative traits, such as plant size, leaf size, and leaf color, which exhibit significant morphological differences between PF and PC.
Therefore, in this study, we conducted a genetic analysis of the segregation characteristics of qualitative and quantitative traits in an F2 population developed by sele cting weedy accessions of PF and PC—widely cultivated and utilized in South Korea and Japan—as parental lines, followed by hybridization.
Materials and Methods
Plant materials and F2 population development
The plant materials used in this study were a weedy PC (
Perilla frutescens var.
crispa, WPC06-339, ♀) and a weedy PF (
Perilla frutescens var.
frutescens, WPF17-049, ♂) collected from South Korea (
Fig. 1). These were selected as the maternal and paternal parents for hybridization, which was conducted in June 2022 to produce F
1 hybrid seeds. The F
1 seeds were sown at the experimental field of Kangwon National University in 2023, and the harvested F
1 plants were used to obtain 140 individuals of the F
2 population. In the spring of 2024, the seeds of 140 individuals of the F
2 population were sown. However, the study was conducted on 107 individuals, excluding those who exhibited poor growth or did not survive. These plants were cultivated in the experimental field of Kangwon National University with a planting distance of 60 cm (row spacing)×40 cm (plant spacing), maintaining a 1 m gap between rows and individuals.
The morphological characteristics of the F
2 population were examined based on the traits of the maternal and paternal parents, focusing on qualitative traits related to plant characteristics (
Table 1,
Fig. 1).
Fig. 1 shows the plant morphology of the parent lines, while
Table 1 summarizes four qualitative (QL) and nine quantitative (QN) traits used to assess morphology. The qualitative characteristics include the color of the leaf surface (QL1), the color of the leaf reverse side (QL2), the color of the stem (QL3), and the color of the flower (QL4). The quantitative traits include days to heading (QN1), days to flowering (QN2), days to maturity (QN3), plant height (QN4), length of inflorescence (QN5), number of florets (QN6), leaf length (QN7), leaf width (QN8), and leaf area (QN9). In this study, leaf length, width, and location were precisely measured using ImageJ software (
Rasband 2007) based on field images. Additionally, leaf color (leaf surface and reverse side) and flower color were recorded during the flowering stage.
To examine phenotypic variation and genetic relationships within the F
2 population, pie charts and bar graphs were generated in Excel to assess the distribution of qualitative and quantitative traits visually. Genetic analysis was conducted by recording observed values for each trait, and the segregation ratio was evaluated using the chi-square test (χ
2-test) based on Mendelian inheritance principles, with calculations performed in SPSS (
IBM Corp 2017). Additionally, heritability (
H2) was estimated using the formula
H2=
VG/
VP, where
VP represents phenotypic variance and
VG denotes genetic variance, to assess the contribution of genetic factors to quantitative trait expression (
Lynch et al. 1998;
Meitei et al. 2019). Hierarchical clustering analysis was performed to assess genetic similarities among individuals. The Euclidean distance and Ward’s D
2 method were applied for this analysis, with clustering executed using the R programming language (
Danielsson 1980;
Kaufman et al. 2009;
Ward 1963).
Results
Morphological characteristics of the two parental Perilla lines
The morphological characteristics of the two parental
Perilla lines (maternal and paternal) used in the cross-combination are as follows: As shown in
Table 1 and
Fig. 1, the maternal parent (Parent A) has greenish-purple leaves on the upper surface, purple leaves on the reverse side, and purple flowers. In contrast, the paternal parent (Parent B) has green leaves on both the upper and reverse surfaces and white flowers (
Table 1,
Fig. 1). Regarding stem color (QL3), the maternal parent (Parent A) has a purple stem, while the paternal parent (Parent B) has a green stem. In terms of days to heading (QN1), the maternal parent (Parent A) was recorded at 124 days, whereas the paternal parent (Parent B) was recorded at 119 days. The days to flowering (QN2) was recorded at 134 days for the maternal parent (Parent A) and 126 days for the paternal parent (Parent B). For the days to maturity (QN3), the maternal parent (Parent A) was recorded at 168 days, while the paternal parent (Parent B) was recorded at 157 days. For plant height (QN4), the maternal parent (Parent A) measured 151.4 cm, whereas the paternal parent (Parent B) measured 105.4 cm. The length of inflorescence (QN5) was 8.6 cm for the maternal parent (Parent A) and 8.5 cm for the paternal parent (Parent B). The number of florets (QN6) was 33.3 for the maternal parent (Parent A) and 44 for the paternal parent (Parent B). Both parental lines (Parent A and Parent B) had an identical leaf length (QN7) of 12.6 cm. However, the leaf width (QN8) was 8.3 cm for the maternal parent (Parent A) and 11.2 cm for the paternal parent (Parent B). The leaf area (QN9) was 59.8 cm
2 for the maternal parent (Parent A) and 88.8 cm
2 for the paternal parent (Parent B).
The morphological characteristics of the F
2 population were analyzed based on quantitative and qualitative traits that exhibited distinct differences between the two parental lines of the cross combination, as summarized in
Table 1. As shown in
Table 2,
Figs. 2,
3, and
Supplementary Table 1, the distribution of color of leaf surface (QL1) in the F
2 population was as follows: 104 individuals had green leaves, 3 individuals had green-purple leaves, and none exhibited entirely purple leaves. For the color of the leaf reverse side (QL2), 34 individuals had green leaves, 54 had green-purple leaves, and 19 had purple leaves. The color of the stem (QL3) was green in 14 individuals, green-purple in 90 individuals, and purple in 3 individuals. Regarding the color of the flower (QL4), 33 individuals had white flowers, 53 had pink flowers, and 21 had purple flowers (
Table 2). In the chi-square test for four qualitative traits in the F
2 population, two traits (QL2, QL4) followed a Mendelian segregation ratio of 1:2:1. In contrast, QL1 and QL3 did not show a Mendelian segregation ratio of 1:2:1. Specifically, QL1 exhibited a non-Mendelian segregation ratio of 15:1 (
Table 2,
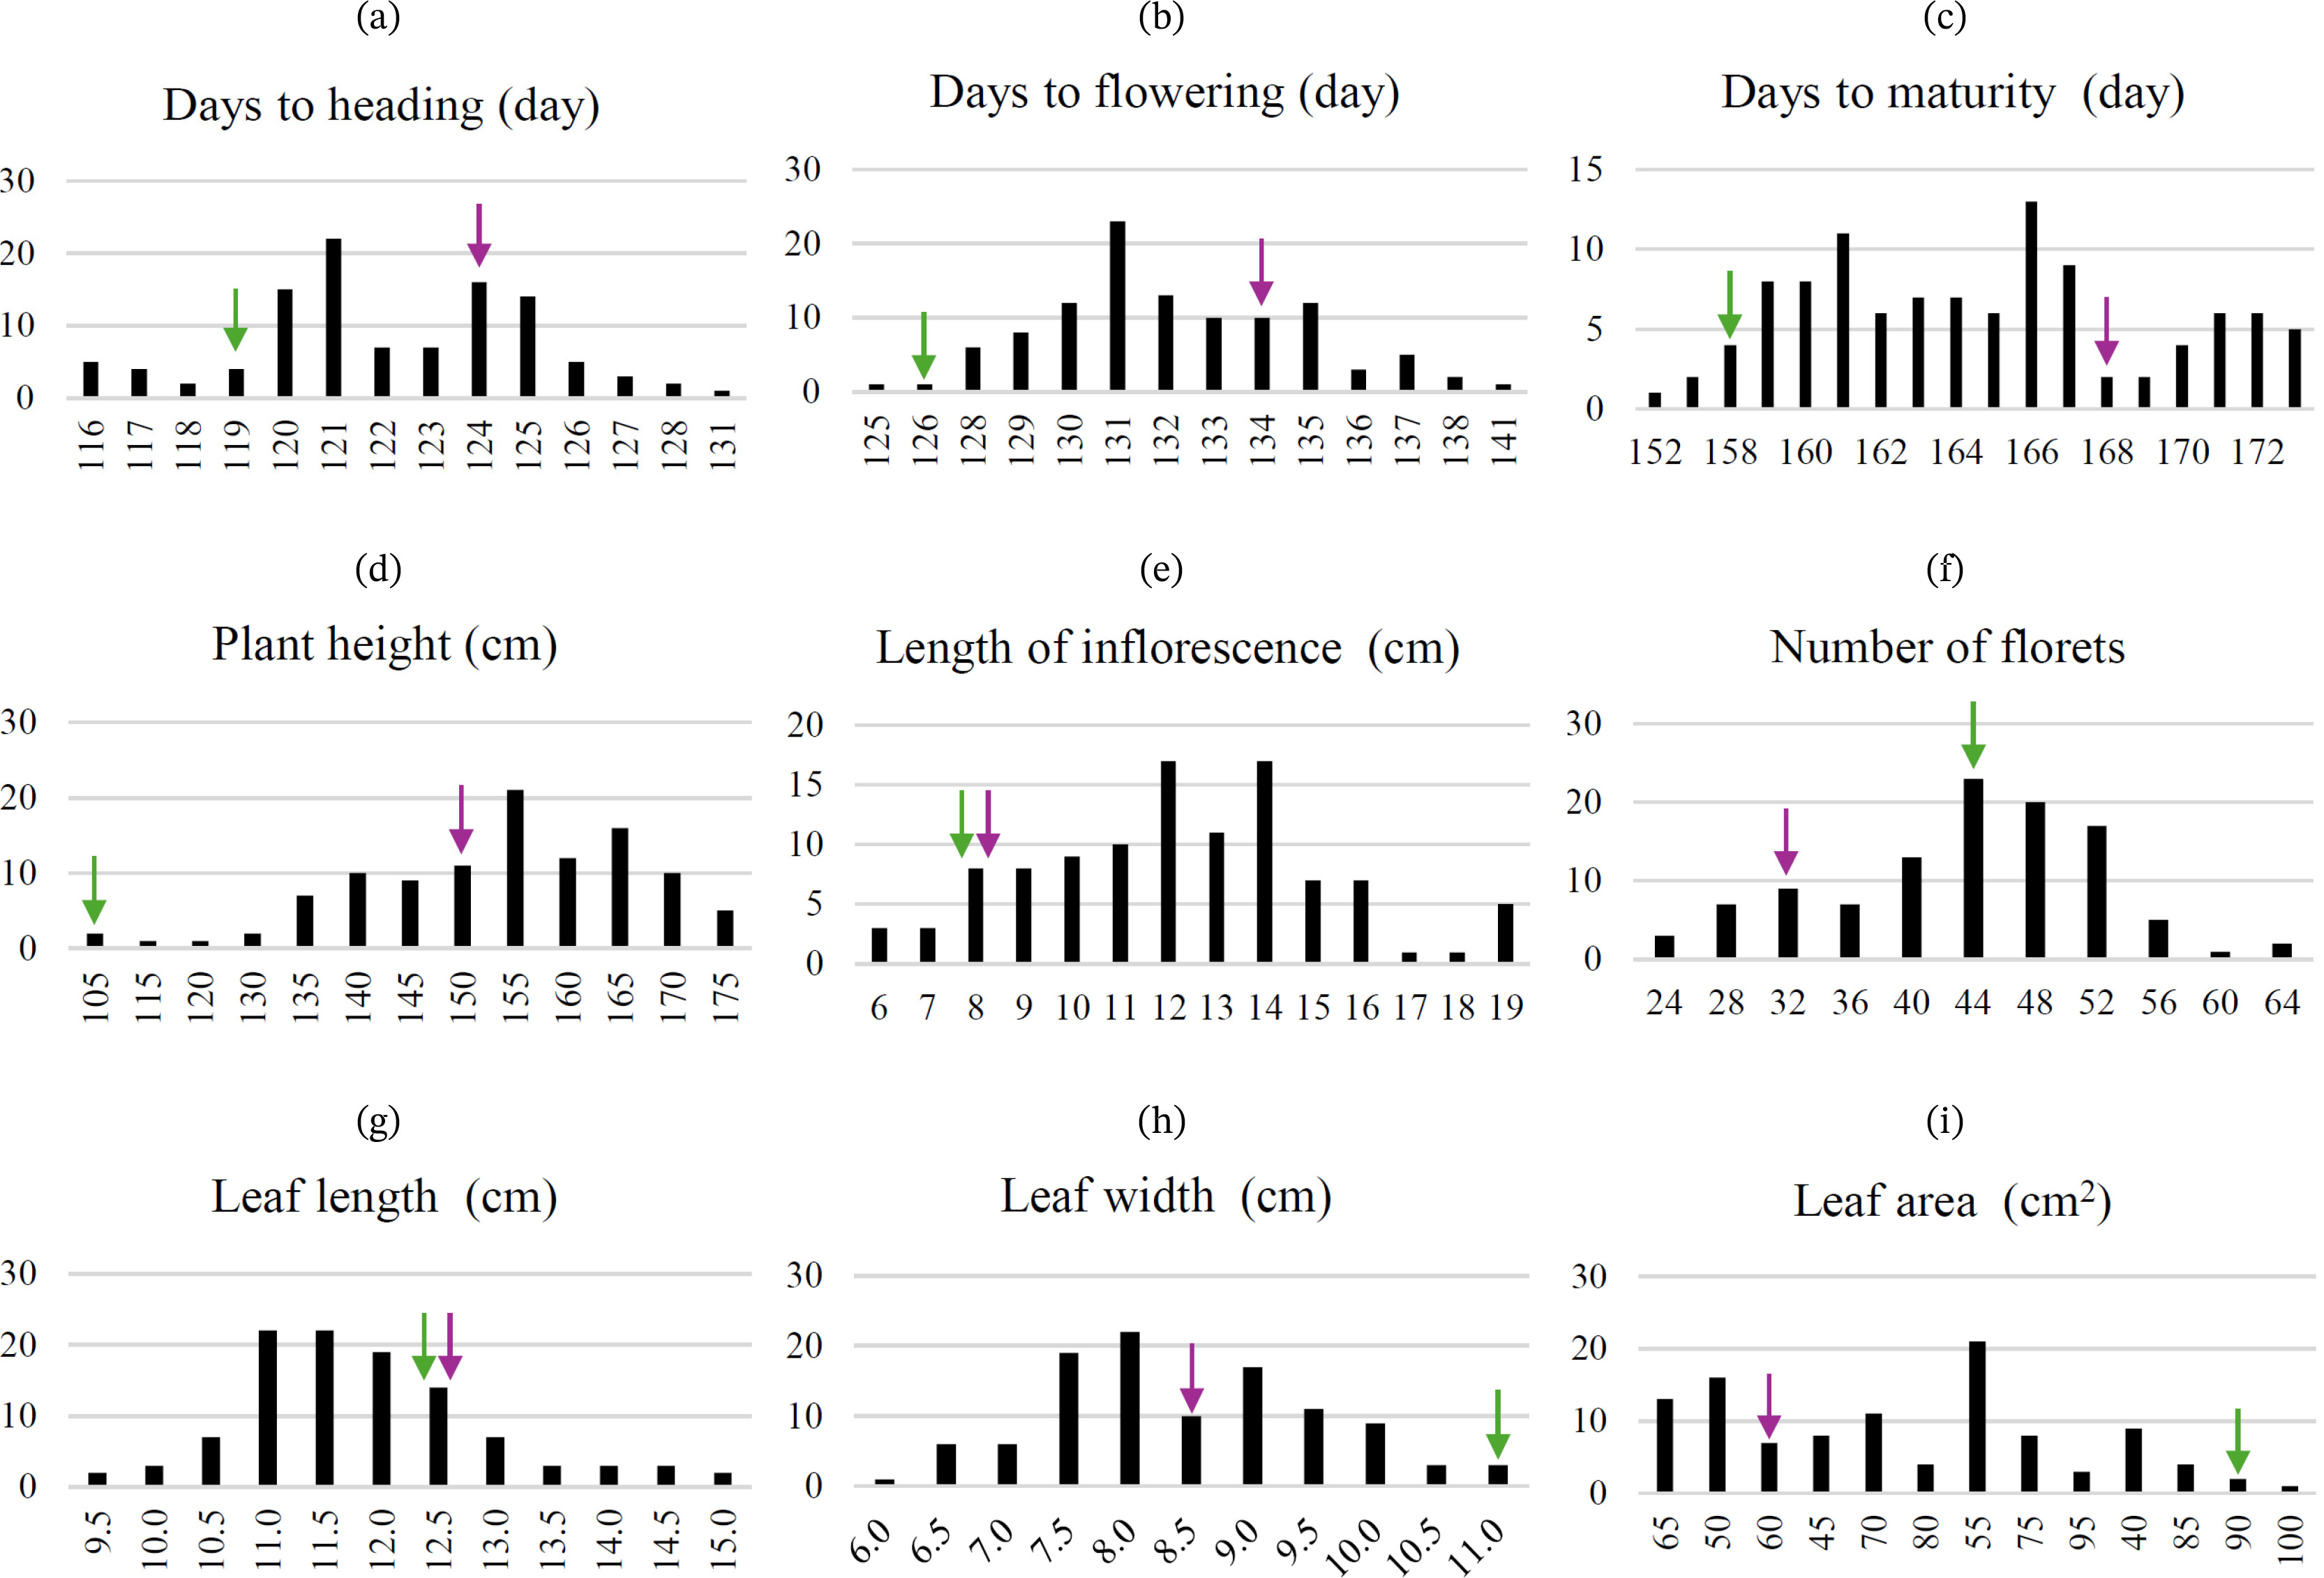
Supplementary Table 1). Quantitative traits, including days to heading (QN1), days to flowering (QN2), days to maturity (QN3), plant height (QN4), length of inflorescence (QN5), number of florets (QN6), leaf length (QN7), leaf width (QN8), and leaf area (QN9), showed different degrees of variation within the parental lines (
Fig. 3,
Supplementary Table 1). Specifically, QN1 ranged from approximately 116 to 131 days, QN2 from 125 to 141 days, and QN3 from 152 to 173 days. Plant height (QN4) varied from 105.3 cm to 176.7 cm, QN5 ranged from 5.7 cm to 19.3 cm, and QN6 ranged from 24 to 64. Additionally, QN7 varied from 9.4 cm to 15.0 cm, QN8 from 6.2 cm to 10.9 cm, and QN9 from 37.7 cm
2 to 98.9 cm
2.
Heritability (H
2) analysis revealed that traits related to the growth period, such as QN1, QN2, QN3, and QN4, had heritability values of 0.809, 0.823, 0.779, and 0.513, respectively (
Table 3). Among inflorescence organ traits, QN5 and QN6 had heritability values of 0.874 and 0.060, respectively. For leaf-related traits, QN7, QN8, and QN9 had heritability values of 0.483, 0.948, and 0.714, respectively. As a result, among the quantitative traits analyzed, QN1, QN2, QN3, QN5, and QN8 exhibited very high heritability, whereas QN6 displayed very low heritability (
Table 3).
Fig. 4 showed the results of hierarchical clustering analysis based on the Euclidean distance and Ward’s D
2 method. In the dendrogram, each F
2 individual is represented by an individual number, while the parent lines are distinguished as Parent A (red) and Parent B (green). The analysis reveals that the parental lines form distinct clusters, whereas the F
2 individuals are distributed across multiple clusters, exhibiting varying degrees of similarity to one or both parental lines.
Discussion
Perilla species are cultivated and naturally distributed in East Asia, with distinct differentiation between cultivated and weedy types. The cultivated varieties,
Perilla frutescens var.
frutescens and
P. frutescens var.
crispa, are highly valued in East Asian countries, including South Korea, as sources of edible oil and leafy vegetables. In contrast, weedy types of
Perilla grow naturally in South Korea around farmhouses, villages, roadsides, and streams. Notably, while
P. frutescens var.
crispa occurs as a weedy type in South Korea, it is cultivated as a leafy vegetable in Japan (see Introduction). Understanding the genetic segregation characteristics of key traits in cultivated and weedy
Perilla species can provide valuable insights for breeding strategies to develop improved
Perilla varieties. However, cultivated crops often undergo genetic bottlenecks during long-term breeding, where selective maintenance of specific traits reduces genetic diversity (
Hyten et al. 2006;
Tanksley et al. 1997). This bottleneck results in the loss of genetic variation, as intensive selection for productivity and uniformity limits the available gene pool. Consequently, cultivated crops may exhibit lower resistance to environmental changes, pests, and diseases, posing challenges for introducing new genetic traits. In contrast, wild or weedy types retain a wide range of traits through natural selection, allowing them to adapt to diverse environments. These weedy or wild accessions are valuable genetic resources in modern breeding studies (
Cheng et al. 2024;
Warschefsky et al. 2014). Notably, they often possess traits that enhance survival in extreme conditions and confer resistance to stress factors such as drought, high and low temperatures, and pest infestations. These characteristics can improve environmental adaptability and stress resistance in breeding programs.
Warschefsky et al. (2014) suggested that crossbreeding wild or weedy accessions with modern cultivated crops is a promising strategy for enhancing growth potential and environmental adaptability.
In this study, we selected weedy
Perilla accessions with high genetic and morphological diversity as parent lines to analyze various trait combinations and secure valuable genetic resources for breeding programs. As reported previously by Lee and Ohnishi (
2001,
2003), Sa et al. (
2015,
2018), and
Fu et al. (2022) analyzed the genetic diversity of
Perilla genetic resources using SSR markers and found that weedy accessions exhibited greater genetic variation than cultivated accessions. This likely results from the natural maintenance of high genetic diversity in weedy accessions as they adapt to diverse environments. By utilizing weedy
Perilla accessions in crosses, we expected to observe a wide range of phenotypic combinations in the F
2 population, thereby securing genetic resources applicable to breeding programs. Our results confirmed that both qualitative traits (e.g., color of leaf surface, color of leaf reverse side, color of stem, and color of flower) and quantitative traits (e.g., days to flowering, days to maturity, plant height, and length of inflorescence) exhibited considerable variation between the two parental lines (Parent A and Parent B) and among individuals in the F
2 population. This extensive variability is likely due to genetic recombination and segregation within the F
2 population. While some traits appeared to follow simple inheritance patterns, others seemed influenced by more complex genetic interactions. Among the four qualitative traits analyzed, two traits (QL2 and QL4) exhibited a Mendelian segregation ratio of 1:2:1, indicating codominant or incomplete dominant inheritance. In contrast, QL1 and QL3 did not conform to this expected ratio. Notably, QL1 followed a non-Mendelian segregation ratio of 15:1, which suggests the involvement of duplicate dominant epistasis or polygenic interaction. The chi-square test supported these observations: QL2 (χ
2=4.21,
p=0.122) and QL4 (χ
2=2.70,
p=0.259) aligned with the expected Mendelian 1:2:1 ratio, while QL3 (χ
2=52.07,
p=0.000) showed a significant deviation. Similarly, QL1 significantly deviated from the 1:2:1 expectation (χ
2=295.7,
p=0.000) but closely fit the 15:1 segregation pattern (χ
2=2.17,
p=0.141), supporting the hypothesis of non-Mendelian inheritance (
Table 2). These findings suggest that the inheritance of QL1 and QL3, which are associated with leaf and stem color, may involve allelic interactions, such as epistasis or incomplete dominance. Specifically, in the case of the color of leaf surface (QL1), the F
2 population showed a higher frequency of individuals with the green coloration of the paternal parent (
P. frutescens var.
frutescens) compared to the green/purple phenotype of the maternal parent (
P. frutescens var.
crispa). Similarly, for the stem color (QL3), the F
2 population exhibited a predominance of green/purple individuals, exceeding the frequencies of both the purple maternal and green paternal phenotypes. Together, these results suggest that the segregation patterns of leaf and stem color traits in the F
2 population may be influenced by regulatory gene expression mechanisms or epistatic interactions, indicating the potential involvement of incomplete dominance, codominance, or polygenic control.
Anthocyanin production can be regulated through various mechanisms (
Cui et al. 2021), and this study also indicates that the expression of specific genes in the anthocyanin biosynthetic pathway may have been suppressed (
Liu et al. 2023;
Xie et al. 2022). In previous studies,
Morita et al. (2018) demonstrated that transposons, RNA silencing, and epigenetic regulation can suppress pigment gene expression in Japanese morning glory (
Ipomoea) and
Petunia, leading to altered pigment formation. Similarly, in our experiment, the purple pigmentation inherited from the maternal parent appeared to be expressed at lower levels than expected, likely due to the suppression of specific pigment-related genes. Furthermore,
Bashir et al. (2014) showed that gene expression in
Arabidopsis thaliana hybrids can be influenced by parent-of-origin effects. Although the maternal parent in our study carried the genes for purple pigmentation, their reduced expression in the F
2 population suggests that genetic interactions between the parental lines may have modulated pigment gene regulation. Notably, genes associated with white flower color, green leaf color, and green stem color in the paternal
Perilla line may have exerted epistatic effects, suppressing the expression of purple-related genes. Further analysis of anthocyanin biosynthesis-related gene expression is needed to clarify this phenomenon. Investigating the genetic interactions and expression patterns of pigment-related genes between the parental lines will be crucial in understanding the lower-than-expected expression of purple traits in the F
2 population.
According to the results of the heritability (H
2) analysis (
Table 3), traits related to the growth period, such as days to heading (QN1), days to flowering (QN2), and days to maturity (QN3), exhibited relatively high heritability. This suggests that genetic factors primarily regulate these traits, with minimal influence from environmental factors. In contrast, the heritability of plant height (QN4) was relatively low, indicating that genetic and environmental factors contribute to its expression. Among traits related to inflorescence organs, the heritability of length of inflorescence (QN5) was high, suggesting strong genetic control. Conversely, the heritability of several florets (QN6) was very low, implying a greater influence of environmental factors. Regarding leaf traits, the heritabilities of leaf width (QN8) and leaf area (QN9) were very high, indicating a strong genetic influence. In contrast, the heritability of leaf length (QN7) was relatively low, suggesting a greater impact from environmental factors. Additionally, hierarchical clustering analysis (HCA) using Euclidean distance and Ward’s D
2 method clearly distinguished the two parental lines, while the F
2 individuals formed clusters with varying degrees of similarity to the parents. Some F
2 individuals closely resembled one of the parental lines, retaining their original traits, whereas others exhibited novel phenotypic combinations, leading to distinct cluster distributions (
Fig. 4). These findings suggest that phenotypic variation in the F
2 population arises not only from intermediate inheritance but also from genetic segregation and gene interactions, leading to the emergence of new traits. Furthermore, clustering analysis revealed that while some individuals retained parental traits, others displayed new phenotypes, providing valuable foundational data for identifying novel traits in breeding programs.
As there have been few reports on the genetic analysis of segregating populations in the Perilla crop, the wide phenotypic variation observed in the F2 population in this study provides valuable data for trait selection and future genetic analysis in Perilla crop breeding. In particular, examining how specific traits deviate from those of the parental lines offers deeper insights into genetic relationships and segregation patterns between Perilla frutescens var. crispa and P. frutescens var. frutescens. These findings highlight the potential for unexpected phenotypic variations in Perilla hybrid populations, suggesting that complex gene interactions may influence the expression of certain traits. Further gene expression analyses will be essential to elucidate the genetic mechanisms underlying these variations. Ultimately, this knowledge will support the development of more precise breeding strategies, providing a scientific foundation for Perilla cultivar improvement and the creation of novel traits.
Acknowledgments
This research was supported by Particulate Matter Management Specialized Graduate Program through the Korea Environmental Industry & Technology Institute (KEITI) funded by the Ministry of Environment (MOE) and a National Research Foundation of Korea (NRF) grant funded by the Korean government (MSIT) (No. 2022R1F1A1063300), Republic of Korea.
Fig. 1Morphological characteristics of the parental lines used for crossing: Perilla frutescens var. crispa (WPC06-339, ♀) and var. frutescens (WPF17-049, ♂).
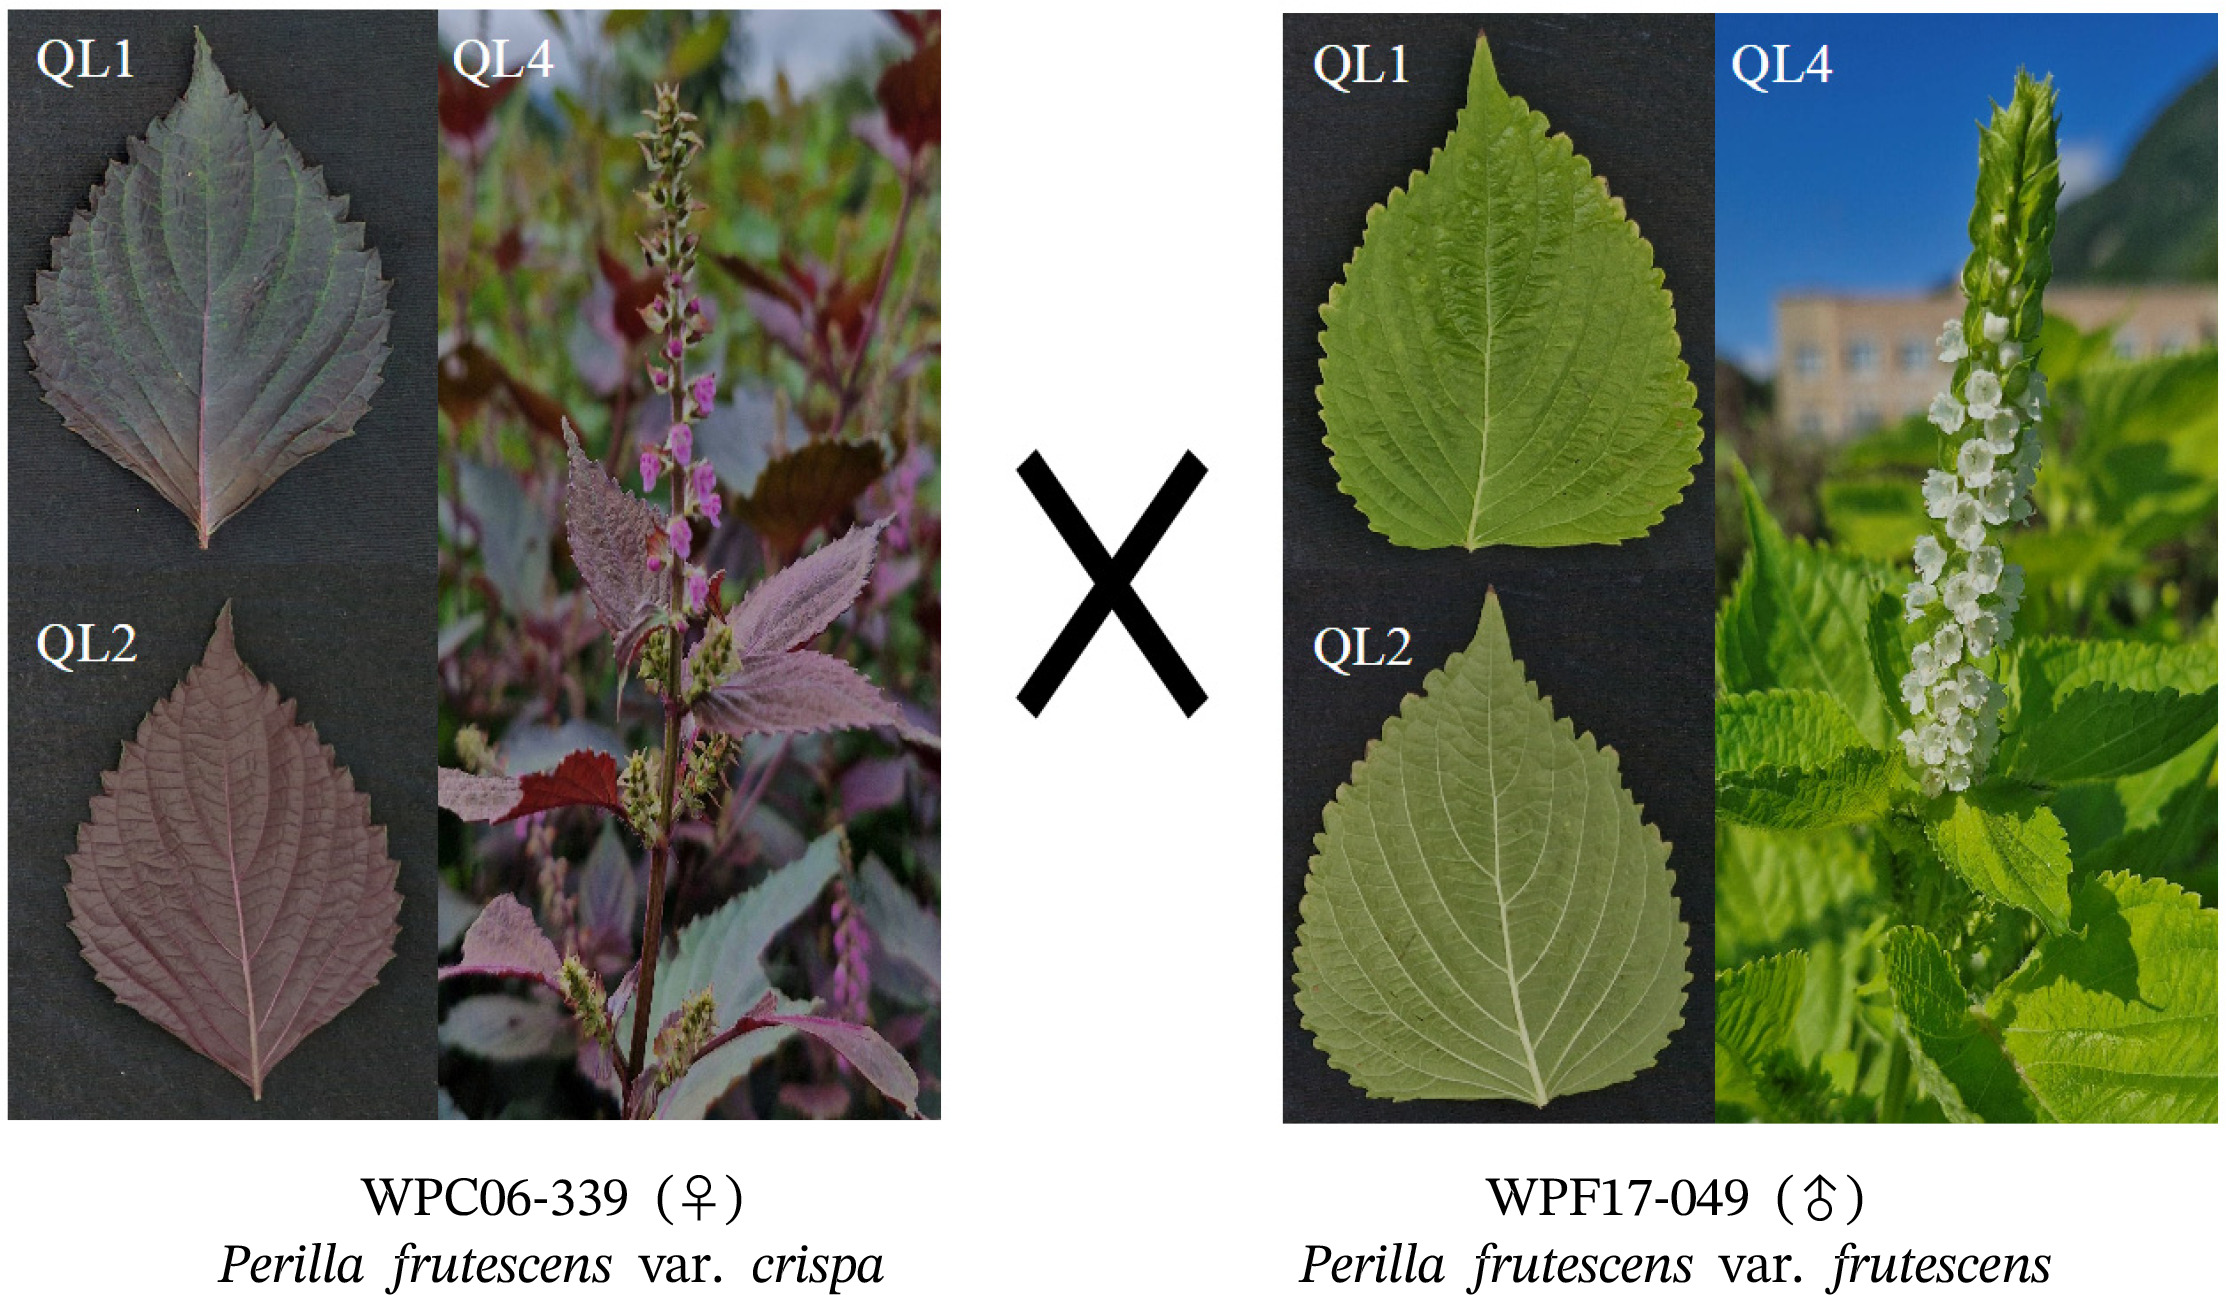
Fig. 2Proportion of qualitative traits in the F2 population (n=107): (a) Color of leaf surface, (b) Color of leaf reverse side, (c) Color of stem, and (d) Color of flower. Purple arrows indicate traits inherited from Perilla frutescens var. crispa, while green arrows indicate traits inherited from P. frutescens var. frutescens. Leaf surface, leaf reverse side, and stem color (a–c) are classified as Light Gray (■ Green), Gray (■ Green/Purple), Dark Gray (■ Purple). Flower color (d) is classified as Light Gray (■ White), Gray (■ Pink), Dark Gray (■ Purple).
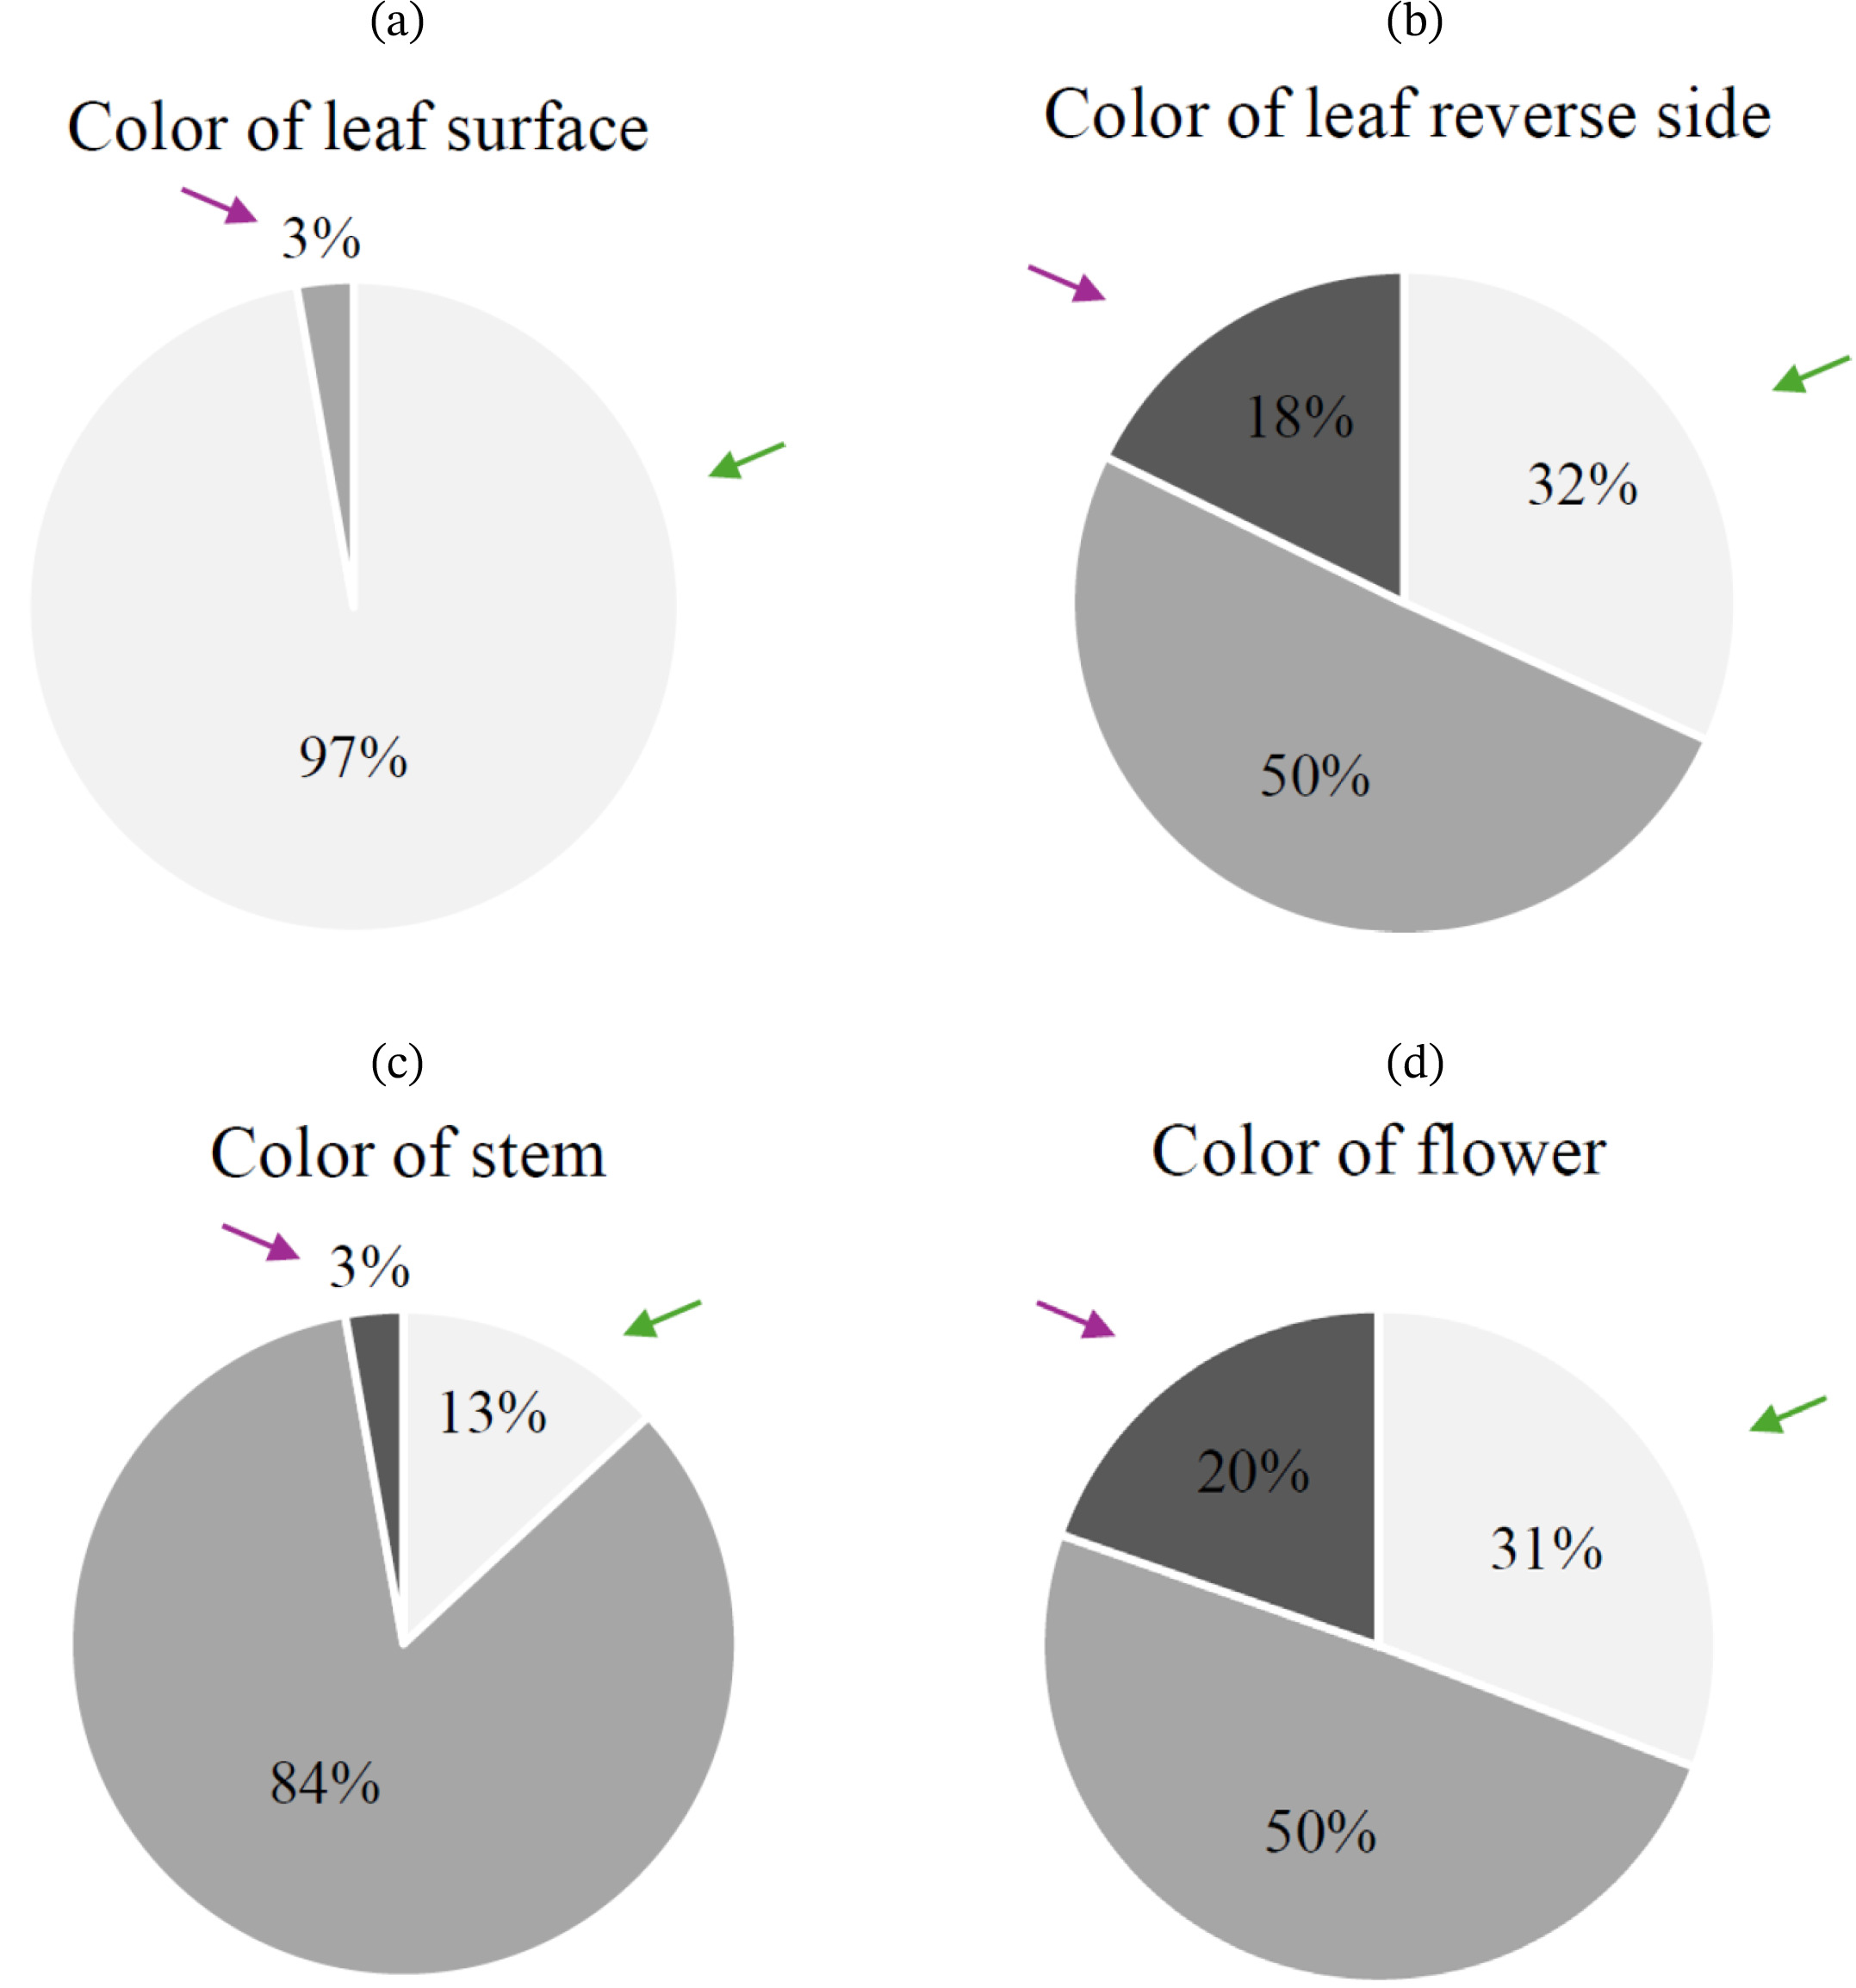
Fig. 3Distribution of quantitative traits in the F2 population (n=107): (a) Days to heading, (b) Days to flowering, (c) Days to maturity, (d) Plant height, (e) Length of inflorescence, (f) Number of florets, (g) Leaf length, (h) Leaf width, and (i) Leaf area. Parental values are indicated by their respective markers: Perilla frutescens var. crispa (purple) and Perilla frutescens var. frutescens (green).

Fig. 4Hierarchical clustering dendrogram of the F2 population derived from a cross between Perilla frutescens var. crispa (red) and var. frutescens (green), constructed using Euclidean distance and Ward’s D2 method.
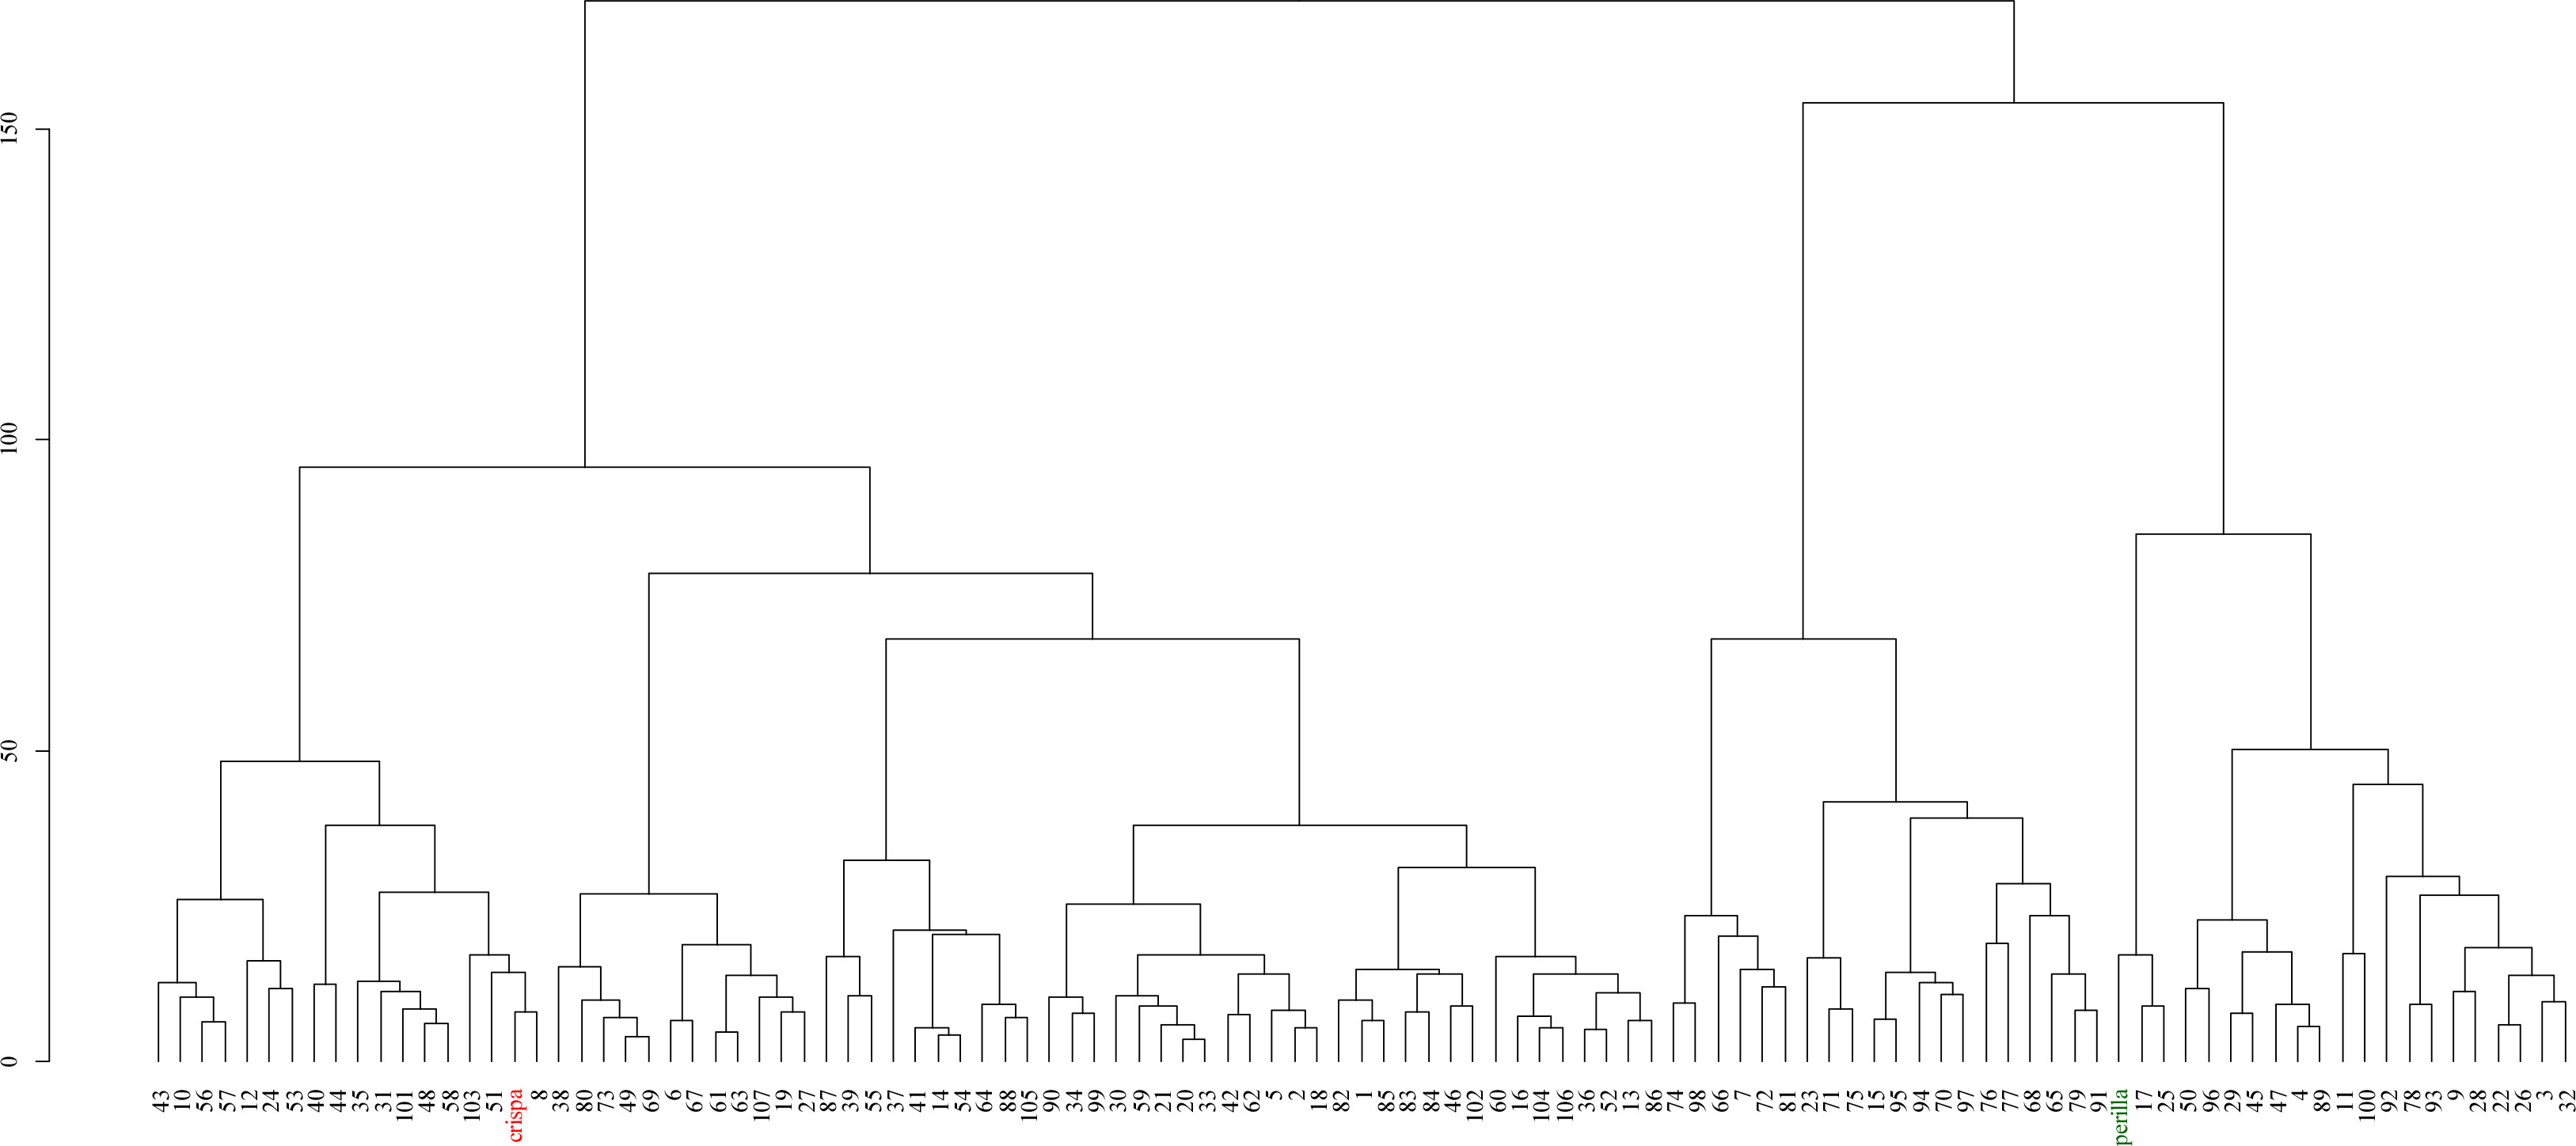
Table 1Morphological traits and their measurements in parent A (var. crispa) and parent B (var. frutescens)
Table 1
|
Morphological trait |
Unit or Category |
Parent A |
Parent B |
|
QL1 (Color of leaf surface) |
Green, Green/Purple, Purple |
Green/Purple |
Green |
|
QL2 (Color of leaf reverse side) |
Green, Green/Purple, Purple |
Purple |
Green |
|
QL3 (Color of stem) |
Green, Green/Purple, Purple |
Purple |
Green |
|
QL4 (Color of flower) |
White, Pink, Purple |
Purple |
White |
|
QN1 (Days to heading) |
day |
124 |
119 |
|
QN2 (Days to flowering) |
day |
134 |
126 |
|
QN3 (Days to maturity) |
day |
168 |
157 |
|
QN4 (Plant height) |
cm |
151.4 |
105.4 |
|
QN5 (Length of inflorescence) |
cm |
8.6 |
8.5 |
|
QN6 (Number of florets) |
Number |
33.3 |
44 |
|
QN7 (Leaf length) |
cm |
12.6 |
12.6 |
|
QN8 (Leaf width) |
cm |
8.3 |
11.2 |
|
QN9 (Leaf area) |
cm2
|
59.8 |
88.8 |
Table 2Segregation and Chi-square test of qualitative traits in the F2 population derived from a cross between Perilla frutescens var. crispa and var. frutescens, compared with expected Mendelian segregation ratio
Table 2
|
Morphological trait |
Observation value of F2 population |
Expected Segregation Ratio |
Value of Chi-square (χ2) |
Degrees of freedom (df) |
p value |
|
QL1 (Color of leaf surface) |
Green (104**) |
G/P* (3) |
Purple (0) |
1:2:1(15:1) |
297.50(2.17) |
2(1) |
0.000(0.141) |
|
QL2 (Color of leaf reverse side) |
Green (34) |
G/P (54) |
Purple (19) |
1:2:1 |
4.21 |
2 |
0.122 |
|
QL3(Color of stem) |
Green (14) |
G/P (90) |
Purple (3) |
1:2:1 |
52.07 |
2 |
0.000 |
|
QL4 (Color of flower) |
White (33) |
Pink (53) |
Purple (21) |
1:2:1 |
2.70 |
2 |
0.259 |
Table 3Variance components and heritability (H2) of quantitative traits in the F2 population of Perilla frutescens
Table 3
|
QN1 |
QN2 |
QN3 |
QN4 |
QN5 |
QN6 |
QN7 |
QN8 |
QN9 |
|
Phenotypic variance (VP) |
8.719 |
7.529 |
21.085 |
194.695 |
9.392 |
75.689 |
1.276 |
1.224 |
200.297 |
|
Environmental variance (VE) |
1.667 |
1.333 |
4.667 |
94.792 |
1.182 |
71.111 |
0.659 |
0.064 |
57.198 |
|
Genetic variance (VG) |
7.052 |
6.196 |
16.418 |
99.903 |
8.210 |
4.578 |
0.617 |
1.161 |
143.099 |
|
Heritability (H2) |
0.809 |
0.823 |
0.779 |
0.513 |
0.874 |
0.060 |
0.483 |
0.948 |
0.714 |
References
- Bashir T, Sailer C, Gerber F, Loganathan N, Bhoopalan H, Eichenberger C, et al. 2014. Hybridization alters spontaneous mutation rates in a parent-of-origin-dependent fashion in Arabidopsis. Plant Physiol. 165: 424-437.
- Cheng S, Feng C, Wingen LU, Cheng H, Riche AB, Jiang M, et al. 2024. Harnessing landrace diversity empowers wheat breeding. Nature. 632: 823-831.
- Cui X, Deng J, Huang C, Tang X, Li X, Li X, et al. 2021. Transcriptomic analysis of the anthocyanin biosynthetic pathway reveals the molecular mechanism associated with purple color formation in Dendrobium Nestor. Life. 11: 113
- Danielsson P. 1980. Euclidean distance mapping. Comput Graph Image Process. 14: 227-248.
- Fu ZY, Sa KJ, Park H, Jang SJ, Kim YJ, Lee JK. 2022. Utilization of novel Perilla SSR markers to assess the genetic diversity of native Perilla germplasm accessions collected from South Korea. Plants. 11: 2974
- Giménez E, Benavente E, Pascual L, García-Sampedro A, López-Fernández M, Vázquez JF, et al. 2021. An F2 barley population as a tool for teaching Mendelian genetics. Plants. 10: 694
- Honda G, Koezuka Y, Tabata M. 1990. Genetic studies of fruit color and hardness in Perilla frutescens. Jpn J Breed. 40: 469-474.
- Honda G, Yuba A, Kojima T, Tabata M. 1994. Chemotaxonomic and cytogenetic studies on Perilla frutescens var. citriodora ('Lemon Egoma'). Nat Med. 48: 185-190.
- Hyten DL, Song Q, Zhu Y, Choi IY, Nelson RL, Costa JM, et al. 2006. Impacts of genetic bottlenecks on soybean genome diversity. Proc Natl Acad Sci. USA. 103: 16666-16671.
- IBM Corp.2017. IBM SPSS Statistics for Windows, Version 25. 0. IBM Corp.. New York, USA..
- Kaufman L, Rousseeuw PJ. 2009. Finding groups in data: An introduction to cluster analysis. John Wiley & Sons..
- Kim JY, Sa KJ, Ha YJ, Lee JK. 2021. Genetic variation and association mapping in the F2 population of the Perilla crop (Perilla frutescens L.) using new developed Perilla SSR markers. Euphytica. 217: 135
- Lee JK, Ohnishi O. 2001. Geographic differentiation of morphological characters among Perilla crops and their weedy types in East Asia. Breed Sci. 51: 247-255.
- Lee JK, Nitta M, Kim NS, Park CH, Yoon KM, Shin YB, et al. 2002. Genetic diversity of Perilla and related weedy types in Korea determined by AFLP analyses. Crop Sci. 42: 2161-2166.
- Lee JK, Ohnishi O. 2003. Genetic relationships among cultivated types of Perilla frutescens and their weedy types in East Asia revealed by AFLP markers. Genet. Resour. Crop Evol. 50: 65-74.
- Lim SE, Sa KJ, Ha YJ, Lee JK. 2019. Genetic analysis of F2 population derived from the cross between Perilla frutescens var. frutescens and var. crispa. Korean J Breed Sci. 51: 184-189.
- Liu X, Zhai Y, Liu J, Xue J, Markovic T, Wang S, et al. 2023. Comparative transcriptome sequencing analysis to postulate the scheme of regulated leaf coloration in Perilla frutescens. Plant Mol Biol. 112: 119-142.
- Lynch M, Walsh B. 1998. Genetics and analysis of quantitative traits. Vol. 1: Sinauer. Sunderland, MA: pp. 535-557.
- Makino F. 1966. Makino's new illustrated flora of Japan.
- Meitei CB, Sharma S, Roy S, Das A, Mishra D, Singgh IM, et al. 2019. Evaluation of genetic variation in Perilla for agro-morphological and quality traits. Indian J Agric Sci. 89: 940-945.
- Morita Y, Hoshino A. 2018. Recent advances in flower color variation and patterning of Japanese morning glory and petunia. Breed Sci. 68: 128-138.
- Nagai I. 1935. On Shiso and Egoma. Agric Hortic. 10: 2265-2273.
- Nitta M, Ohnishi O. 1999. Genetic relationships among two Perilla crops, shiso and egoma, and the weedy type revealed by RAPD markers. Genes Genet Syst. 74: 43-48.
- Nitta M. 2001. Origin of Perilla crops and their weedy type. Ph.D. Thesis. Kyoto Univ., Kyoto, Japan..
- Nitta M, Lee JK, Ohnishi O. 2003. Asian Perilla crops and their weedy forms: Their cultivation, utilization and genetic relationships. Econ Bot. 57: 245-253.
- Rasband WS. 2007. ImageJ, US national institutes of health.
- Sa KJ, Choi SH, Ueno M, Lee JK. 2015. Genetic diversity and population structure in cultivated and weedy types of Perilla in East Asia and other countries as revealed by SSR markers. Hortic Environ Biotech. 56: 524-534.
- Sa KJ, Choi IY, Park KC, Lee JK. 2018. Genetic diversity and population structure among accessions of Perilla frutescens (L.) Britton in East Asia using new developed microsatellite markers. Gene Genom. 40: 1319-1329.
- Shrestha A, Shim J, Mangat PK, Dhaliwal LK, Sweeney M, Angeles-Shim RB. 2024. Genetic analysis of an F2 population derived from the cotton landrace Hopi identified novel loci for boll glanding. Int J Mol. Sci. 25: 7080
- Tanksley SD, McCouch SR. 1997. Seed banks and molecular maps: Unlocking genetic potential from the wild. Science. 277: 1063-1066.
- Ward JH. 1963. Hierarchical grouping to optimize an objective function. J Am Stat Assoc. 58: 236-244.
- Warschefsky E, Penmetsa RV, Cook DR, Von Wettberg EJ. 2014. Back to the wilds: Tapping evolutionary adaptations for resilient crops through systematic hybridization with crop wild relatives. Am J Bot. 101: 1791-1800.
- Xie G, Zou X, Liang Z, Wu D, He J, Xie K, et al. 2022. Integrated metabolomic and transcriptomic analyses reveal molecular response of anthocyanins biosynthesis in Perilla to light intensity. Front Plant Sci. 13: 976449
- Yamane Y. 1950. Cytogenetic studies in Perilla and Coleus. I. Chromosome numbers. Jpn J Genet. 25: 220.