Abstract
Triticum aestivum L., commonly known as wheat, has long been considered one of the most important crops worldwide. Over the past 20 years, there has been a notable increase in domestic demand for wheat in South Korea, raising interest in locally grown varieties. In recent years, an expansion in reclaimed land areas has prompted extensive research into crop breeding and varietal improvement for salt tolerance. As part of this research effort, salt-tolerant mutant individuals selected through gamma radiation mutation were used as experimental materials to study the temporal gene expression profiles related to salt response in "Urimil" varieties following salt treatment. In this study, physiological analyses were conducted by measuring the changes in the Na+ and K+ contents, as well as the K+/Na+ ratios, in plant leaves as indicators of salt response. RNA-Seq was used to analyze gene expression patterns post-salt treatment across different time points. Furthermore, gene ontology compartmentalized the genes into biological processes, molecular functions, and cellular components. Finally, the wheat reference genome was compared with the experimental and control groups to identify non-synonymous SNPs that could induce changes in protein expression. This analysis aimed to investigate the mechanisms of salt tolerance in wheat and to identify candidate genes for further research.
-
Key words: RNA sequencing, DEGs, SNP, Salt-tolerant
Introduction
The world population is currently increasing by about 1.1% each per year, and the medium-variant projection estimates that the world population will reach 9.7 billion by 2050 (
Desa 2018). Although some projections suggest that the global population facing hunger may decrease by 2050, other scenarios indicate that hunger could persist or even worsen due to socio-economic disparities and climate-related factors (
Van Dijk et al. 2021). To meet the growing food demand, agricultural production must increase by at least 70% by 2050 (FAO, 2009), although estimates vary depending on methodologies and assumptions. However, achieving this level of agricultural growth is increasingly challenging due to the impact of climate change and extreme weather events, which have emerged as major threats to global food security (
Kromdijk et al. 2016). In addition, abiotic and biotic stresses—including those induced by climate change—are major contributors to declining crop yields (
Donovan et al. 2021). Abiotic factors such as salt stress, temperature, and drought reduce agricultural productivity and threaten global food security by directly affecting plant growth, lowering seed quality, and ultimately decreasing crop yields (
Hussein et al. 2017;
Surekha et al. 2014).
Salt stress is a major agricultural problem in arid and semi-arid regions, but these threats can also be observed in other areas (
Ashraf et al. 2009). Salinity is broadly categorized into primary and secondary classifications. Primary salinity is a natural process resulting from the long-term accumulation of salts in soil and water, driven by factors such as weathering, rainfall, and strong winds. On the other hand, secondary salinity is the action of anthropogenic activities such as deforestation, land removal, excessive irrigation, and inappropriate fertilizer application (
Arif et al. 2020;
Keesstra et al. 2012;
Tetteh 2015). Similarly, salt accumulation is also caused by the indiscriminate use of fertilizers and pesticides (
Yargholi et al. 2014). Such salinity damages about 900 million hectares of land, occupying about 20% of the world's arable land and harming about half of the world's irrigated total arable land (
Velmurugan et al. 2020).
Generally, salt stress causes osmotic stress, oxidative damage, and ion imbalance (
You et al. 2019). First, osmotic pressure caused by salt stress increases the salt concentration around the root to a threshold level, reducing the osmotic potential of the soil solution, making it difficult for the root to extract water during the osmotic phase, significantly reducing the growth rate of shoots and causing physiological droughts in plants (
Hasegawa et al. 2000;
Jahromi et al. 2008;
Shanker et al. 2011;
Wei-Feng et al. 2008). Additionally, dehydration by excessive Na
+ and Cl
- ion toxicity in plant cells due to salt stress can disrupt the structure of enzymes and other macromolecules. Moreover, it can damage cell organelles and plasma membranes and interfere with photosynthesis, respiration, and protein synthesis (
Feng et al. 2002;
Juniper et al. 1993;
Zhu 2001,
2003). Oxidative stress is one of the early and rapid responses to salt stress, characterized by the production of reactive oxygen species (ROS), including superoxide anions (O₂•⁻), singlet oxygen (¹O₂), hydroxyl radicals (OH•), and hydrogen peroxide (H₂O₂) (
Halliwell 2006). Because potential ROS interacts non-specifically with many components, causing peroxidation reactions and severe damage to phospholipids, proteins, and nucleic acids, ROS levels must be carefully monitored and controlled in cells. Salinity also adversely affects morphological and biochemical functions, including impeding seed germination, plant growth, and development and reducing crop yield. It also disrupts plant nutritional balance by impairing nutrient uptake and transport to the shoot, resulting in ion deficiencies (
Adiku et al. 2001;
Marschner 1995).
Plant salt tolerance to these salt stresses is achieved by an integrated response at the physiological, cellular, molecular, and metabolic levels (
Amirbakhtiar et al. 2021). First, salt stress signals are detected at the membrane level by receptors such as ion channels and receptor-like kinases, thereby generating secondary signal materials like Ca
2+, reactive oxygen species (ROS), salt overly sensitive (SOS), abscisic acid (ABA) mitogen-activated protein kinase (MAPK), and proline metabolism. In addition, due to salt tolerance at the molecular level, transcription factors, ion transporters, protein kinases, and genes encoding permeability are expressed (
Tuteja 2007).
Therefore, understanding salt stress is crucial to achieving sustainable agricultural practices and meeting global food demand (
Zörb et al. 2019). Thus, for many years, it has been proposed that salt-tolerant crops in salt-affected lands be used to counter these threats (
Epstein 1977). Such a biological approach was seen by many scientists as the most efficient and economical means of utilizing salt-affected soils and as a permanent solution to the problem (
Ashraf et al. 1994;
Shannon 1985). Thus, scientists sought new salt-resistant crops to minimize crop loss (
Gallagher 1985;
Glenn et al. 1985), and breeders bred salt-resistant crops (
Cuartero et al. 2003). Additionally, to resolve the harmful effects of salt, scientists genetically manipulated plants using other genes (
Sanan-Mishra et al. 2005;
Tang et al. 2005;
Wei-Feng et al. 2008;
Wu et al. 2005;
Zhang et al. 2001). Yet, over the years, traditional breeding methods have created a genetic bottleneck in the genetic basis of plants (
Cooper et al. 2001). This result has prompted plant breeders to use new techniques, such as genetic engineering and mutant breeding, to overcome genetic bottlenecks and reveal traits lost or repressed in evolution through various breeding methods (
Ulukapi et al. 2015). Among these techniques, gamma rays, a physical mutagenesis source, are widely used to introduce genetic diversity in various plant species and induce new mutations (
Shu et al. 2012).
Wheat (
Triticum aestivum L.) is a grain crop that belongs to the Poaceae (Gramineae) family and occupies an important position as food in this family (
Gupta et al. 2021). It is the most important major food crop for over 33% of people worldwide and contributes to higher calorie and protein intake than other cereal crops (maize, rice, barley, oat, rye, and sorghum) (
Food et al. 2014). And allohexaploid wheat (2n = 6x = 42, AABBDD) has evolved relatively recently through two repetitive allopolyploidization events and has a large genomic size of approximately 17 gigabases (
Matsuoka 2011;
Sourdille et al. 2004). Despite the importance of wheat, knowledge of wheat genes is not well known due to the large genome size of wheat, repeat content, and the complexity of polyploids (
Brenchley et al. 2012).
A transcriptome is a complete set of transcripts for cells and their quantities for a particular developmental stage or physiological condition. Understanding transcriptomes is essential for analyzing the functional elements of the genome, disclosing the molecular constituents of cells and tissues, and understanding development and disease (
Wang et al. 2009). Various technologies have been developed to estimate and quantify transcriptomes, including hybridization or sequence-based approaches. Still, these methods have several limitations, including reliance on existing knowledge of genome sequences, high background levels due to cross-hybridization, a limited dynamic detection range due to signal background and saturation, and complex normalization method requirements due to difficulties in comparing expression levels in different experiments (
Okoniewski et al. 2006;
Royce et al. 2007). RNA sequencing technology is a technology developed to overcome these shortcomings. Next-generation high-throughput RNA sequencing technology (RNA-Seq) is a recently developed method for discovering, profiling, and quantifying RNA transcripts that provide high sensitivity, splicing isoforms, and somatic mutation detection capabilities. As a deep sequencing technique, it has many advantages over other expression profiling techniques (
Wang et al. 2009). Because of these advantages and its low cost, RNA-Seq has been used in numerous studies related to the response to abiotic stress (
Meng et al. 2017;
Wu et al. 2017;
Xie et al. 2015;
Xiong et al. 2017).
Worthy insights have recently been observed through many studies to understand the cellular and molecular mechanisms that respond to salt stress in many crop plants, including wheat, but many aspects have yet to be identified (
Amirbakhtiar et al. 2021). Furthermore, research on the expression pattern of wheat genes according to the salt treatment time is still being actively studied. In this study, we chose mutant individuals of
Triticum aestivum L. resistant to salt produced by gamma rays. The selected individuals were treated with a high salt concentration (200 mM NaCl), and the gene expression pattern in response to salt in mutant wheat leaves was analyzed at the seedling stage using mRNA sequencing based on the duration of the salt treatment. In addition, the physiological and molecular mechanisms involved between wheat and salt stress were studied. The results of this study will provide important data for studies related to the complex regulatory mechanisms between wheat and salt stress.
Materials and Methods
Plant materials and salt treatment
In this study, we conducted research using the seeds of selected mutant individuals that exhibited salt tolerance. These mutants were derived from ‘Urimil’ wheat varieties by applying gamma-ray treatment at a dose of 200–300 Gy using a 60Co source. The seeds were irradiated for 8 hours at a total dose of 200–300 Gy. The irradiated seeds were grown, and successive generations were propagated through self-pollination and selection. The study focuses on the M12 generation, ensuring the genetic stability of the mutant lines. Before sowing, all seeds were sterilized by immersing them in a thiram-benomyl mixture (5 g/L) for 24 hours. After that, in October 2020, we sowed the seeds in 32-hole pots filled with bed soil at the Chungnam National University Greenhouse (36°22'06.6''N, 127°21'11.3''E) in the Republic of Korea to support plant growth. Seeds were germinated and grown for about two weeks. Once germinated, the seedlings were transferred to wider pots containing vermiculite and planted. The seedlings were then grown for another two weeks until rooting, with Hoagland nutrient solution supplied via hydroponics. Vernalization was not applied during the germination and growth process. Subsequently, the plants in the seedling stage were salt-treated using 200 mM NaCl by hydroponics, and sampling was performed at 0, 24, and 48 hours after the salt treatment. The leaves of the salt-treated plants were processed for two replicates and stored at -80℃ immediately after sampling.
Physiological analysis
Plant leaf samples stored at -80℃ were first dried in a dry oven for 24 hours to quantify the sodium and potassium content of the experimental materials. The dried leaves were ground using a mortar, and a sample of about 300 mg was obtained during drying per sample. Then, it was placed in nitric acid for 24 hours for digestion of the sample. After that, the second digestion was performed through a graphite block and diluted to a final volume of 50 mL. Thus, the solution obtained was measured for the sodium and potassium content in the sample using an Inductively Coupled Plasma (ICP) instrument. The sodium and potassium content was measured in 3 replicates for each treatment group.
RNA isolation
Total RNA was extracted from the leaves at 0, 24, and 48 hours after the salt treatment using QIAGEN’s RNeasy Plant Mini Kit following the manufacturer’s instructions. RNA quality was assessed by the Agilent 2100 bioanalyzer (Agilent Technologies, Amstelveen, The Netherlands), and RNA quantification was performed using the ND-2000 Spectrophotometer (Thermo Inc., DE, USA).
Library preparation and sequencing
Libraries were prepared from total RNA using the NEBNext Ultra II Directional RNA-Seq Kit (NEW ENGLAND BioLabs, Inc., UK). The mRNA isolation was performed using the Poly(A) RNA Selection Kit (LEXOGEN, Inc., Austria). The isolated mRNAs were used for the cDNA synthesis and shearing following the manufacturer's instructions. Indexing was performed using the Illumina indexes 1- 12. The enrichment step was carried out using PCR. Subsequently, libraries were checked using the TapeStation HS D1000 Screen Tape (Agilent Technologies, Amstelveen, The Netherlands) to evaluate the mean fragment size. Quantification was performed using the library quantification kit using a StepOne Real-Time PCR System (Life Technologies, Inc., USA). Finally, high-throughput sequencing was performed as paired-end 100 sequencing using NovaSeq 6000 (Illumina, Inc., USA).
Sequencing data analysis
Raw sequencing data quality control was performed using FastQC (Andrews 2010). Adapter and low-quality reads (<Q20) were removed using FASTX_Trimmer (
Gordon et al. 2014) and BBduk (
https://jgi.doe.gov/data-and-tools/bbtools/bb-tools-user-guide/bbduk-guide/). After trimming, STAR v 2.7 (
Dobin et al. 2013) was used to map the NGS reads and align clean reads against the IWGSC wheat reference genome v2.1 (
https://urgi.versailles.inrae.fr/download/iwgsc/IWGSC_RefSeq_Assemblies/v2.1/). The outputs generated by STAR were mapped to the reference genome using TopHat v 2.1.1 (
Trapnell et al. 2009). After that, gene expression levels were estimated using FPKM (Fragments Per kb per Million reads) values by Cufflinks (
Roberts et al. 2011). The FPKM values were normalized using the Quantile normalization method in EdgeR within R using Bioconductor. Data mining and graphic visualization were performed using CummeRbund (
Trapnell et al. 2012). After identifying the loci of differentially expressed genes (DEGs) through Edge R, the sequences of the DEGs were determined by aligning reads to the IWGSC wheat reference genome v2.1. Then, the results were analyzed with Bedtools. After that, BLASTX was performed on the NCBI non-redundant (nr) protein database to check the Gene IDs of the DEGs, and the protein description was confirmed in the NCBI.
The Gene Ontology (GO) terms for the DEGs were identified using their confirmed gene IDs through the OrthoDB database (
https://www.orthodb.org/). DEGs with a |log
2 fold change|≥3 were selected for this analysis. For heatmap visualization, expression levels were represented using log
10(FPKM+1) values. The GO terms were categorized into three main domains: biological process, molecular function, and cellular component. To ensure the reliability of the GO terms, the gene ontology analysis was conducted specifically for
Triticum aestivum.
Using Bowtie2, we aligned paired-end sequenced raw reads to the IWGSC wheat reference genome v2.1. We used Samtools to convert a SAM file to a BAM file and then sort and index it. The output files from SAMtools were added to the new read group using Picard AddOrReplaceReadGroups, and duplicates were marked and removed using the PicardMarkDuplicates tool. And variant calling was done using GATK-HaplotypeCaller. Output files from GATK-HaplotypeCaller were extracted as tab-separated tables from VCF files using GATK VariantsToTable. We then used the SNPEff tool to predict the impact of the variant and identify the SNP annotations. For the identified SNPs, non-synonymous substitutions per non-synonymous site (Ka) and synonymous substitutions per synonymous site (Ks) were investigated. Thus, the Ka/Ks ratio was calculated using our custom Python script based on the SNP position via the gene ‘Urimil.’ The gene selection pressure was classified into the diversified group if Ka/Ks>1 and the purified group if Ka/Ks<1 (
Fig. 1).
Results
Physiological response of the leaf to salt stress
Salt-tolerant mutants produced by gamma-rays in the ‘Urimil’ variety were treated with sodium chloride at 200 mM. The concentrations (ppm) of Na⁺ and K⁺ in the samples were measured using an ICP instrument. The final concentration was calculated using the formula: ICP detection concentration×dilution factor (50)/sample weight×extraction volume (20) (
Fig. 2). The Na
+ concentration of the leaves at 00H was 5,354 to 7,026 ppm; at 24H, it was 9,328 to 11,153 ppm; and at 48H, it was 10,881 to 12,674ppm. As a result, the concentration of Na
+ tended to increase gradually in proportion to the salt treatment time. On the other hand, the concentration of K
+ and the K
+/Na
+ ratio tended to decrease progressively over time, and the concentration of K
+ for each treatment group was 36,760 to 44,715 ppm at 00H, 31,971 to 40,991 ppm at 24H, and 21,505 to 39,842 ppm at 48H.
Differences in gene expression over time in salt stress help to understand the salt tolerance genotype of wheat. Therefore, we identified genes differentially expressed in wheat leaves according to salt stress times. Reads generated through RNA-seq of the leaf samples by each treatment group were aligned to the IWGSC v2.1 reference genome using the STAR alignment tool, and the DEG was identified using the cufflinks tool. Gene expression levels were calculated using the FPKM method, and significant DEGs were selected based on a |log
2 fold change|≥3 and Q-value cut off≤0.05. DEGs were analyzed using a combination of 00H/24H, 00H/48H, and 24H/48H based on the salt treatment (
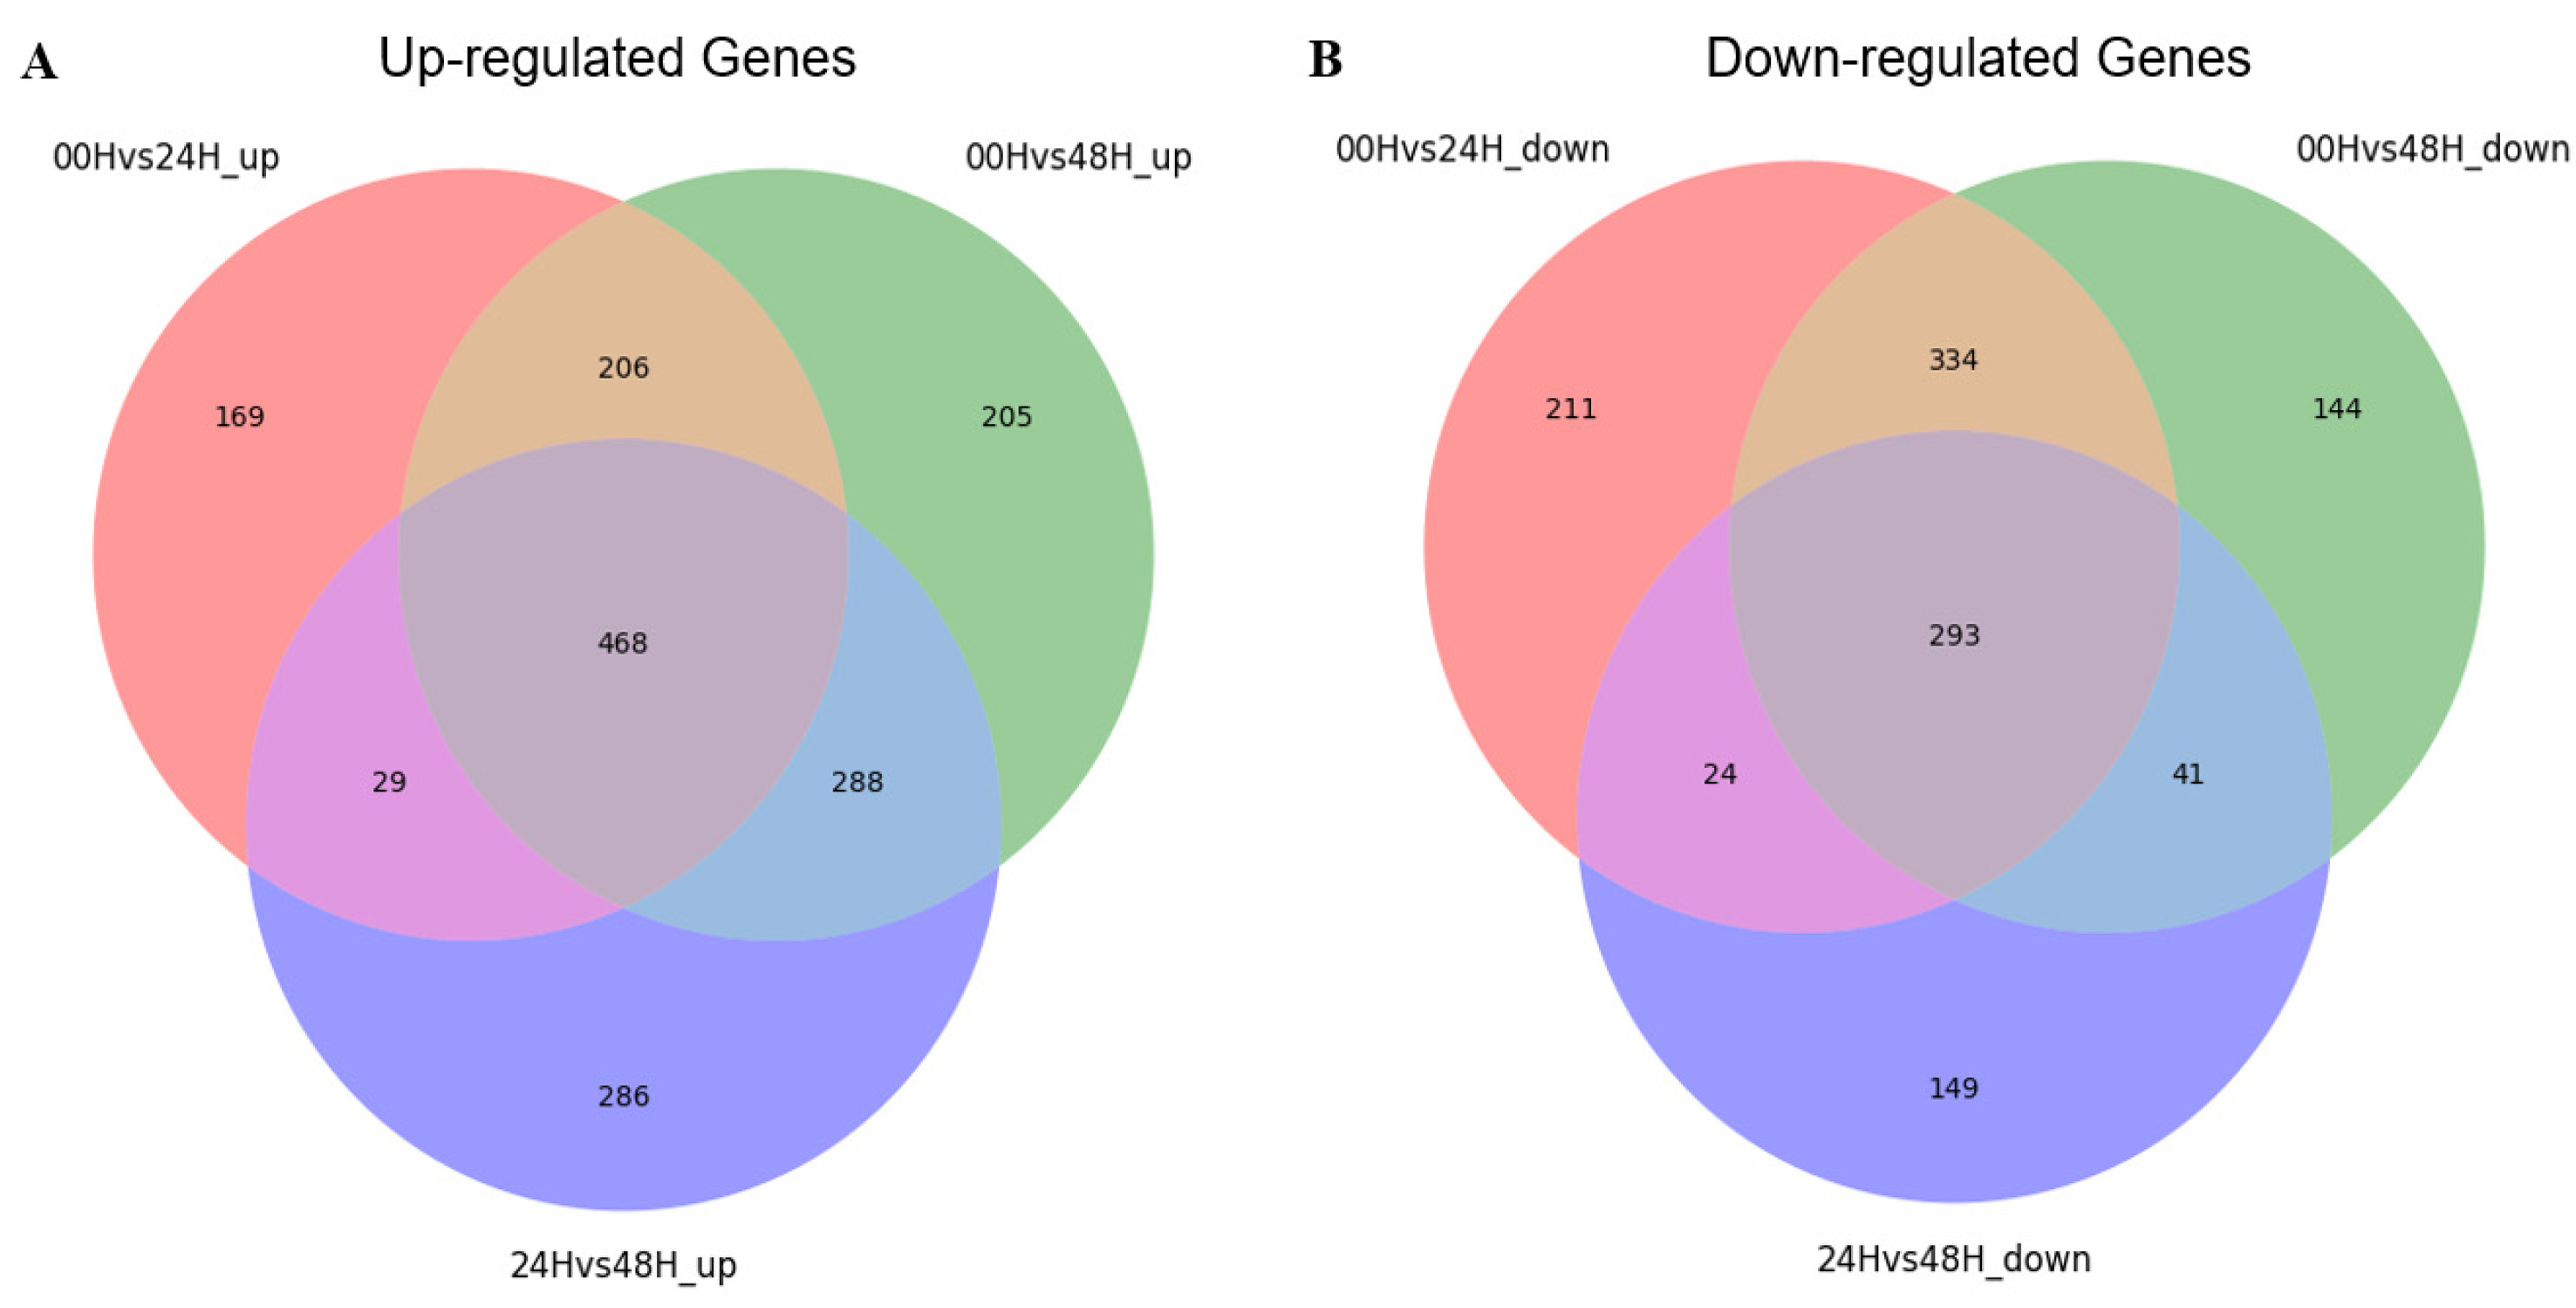
Fig. 3). A total of 2,265 DEGs were identified in three comparison combinations. 1,106 DEGs were identified in the 00H/48H comparison, the largest number of DEGs, and 308 DEGs were identified in the 24H/48H comparison, the smallest number of DEGs. The comparison with the highest number of up-regulated genes relative to down-regulated genes and the largest difference between them was 00H/48H. Then, to see the correlation between them, we confirmed the common DEGs among the combinations of comparisons (
Fig. 4). There were no DEGs commonly identified between the 00H/24H comparison combination and the 24H/48H comparison combination. Four genes were commonly up-regulated among all comparison combinations, but no down-regulated genes were observed. To further explore potential candidate genes involved in salt tolerance, we selected the top 20 DEGs from each comparison based on the highest |log₂ fold change| values. The expression levels of these genes were visualized using a heatmap based on log₁₀(FPKM+1) values to clearly represent their expression patterns under salt stress (
Fig. 5).
GO enrichment analysis was performed to investigate the specific functions of the DEGs among the three comparative combinations under salt stress. The comparison combination with the most significant number of GO terms was 00H and 48H (up-regulation: 1,167 and down-regulation: 812), and the comparison combination with the smallest number of GO terms was 24H and 48H (up-regulation, 1,071 and down-regulation, 507) (
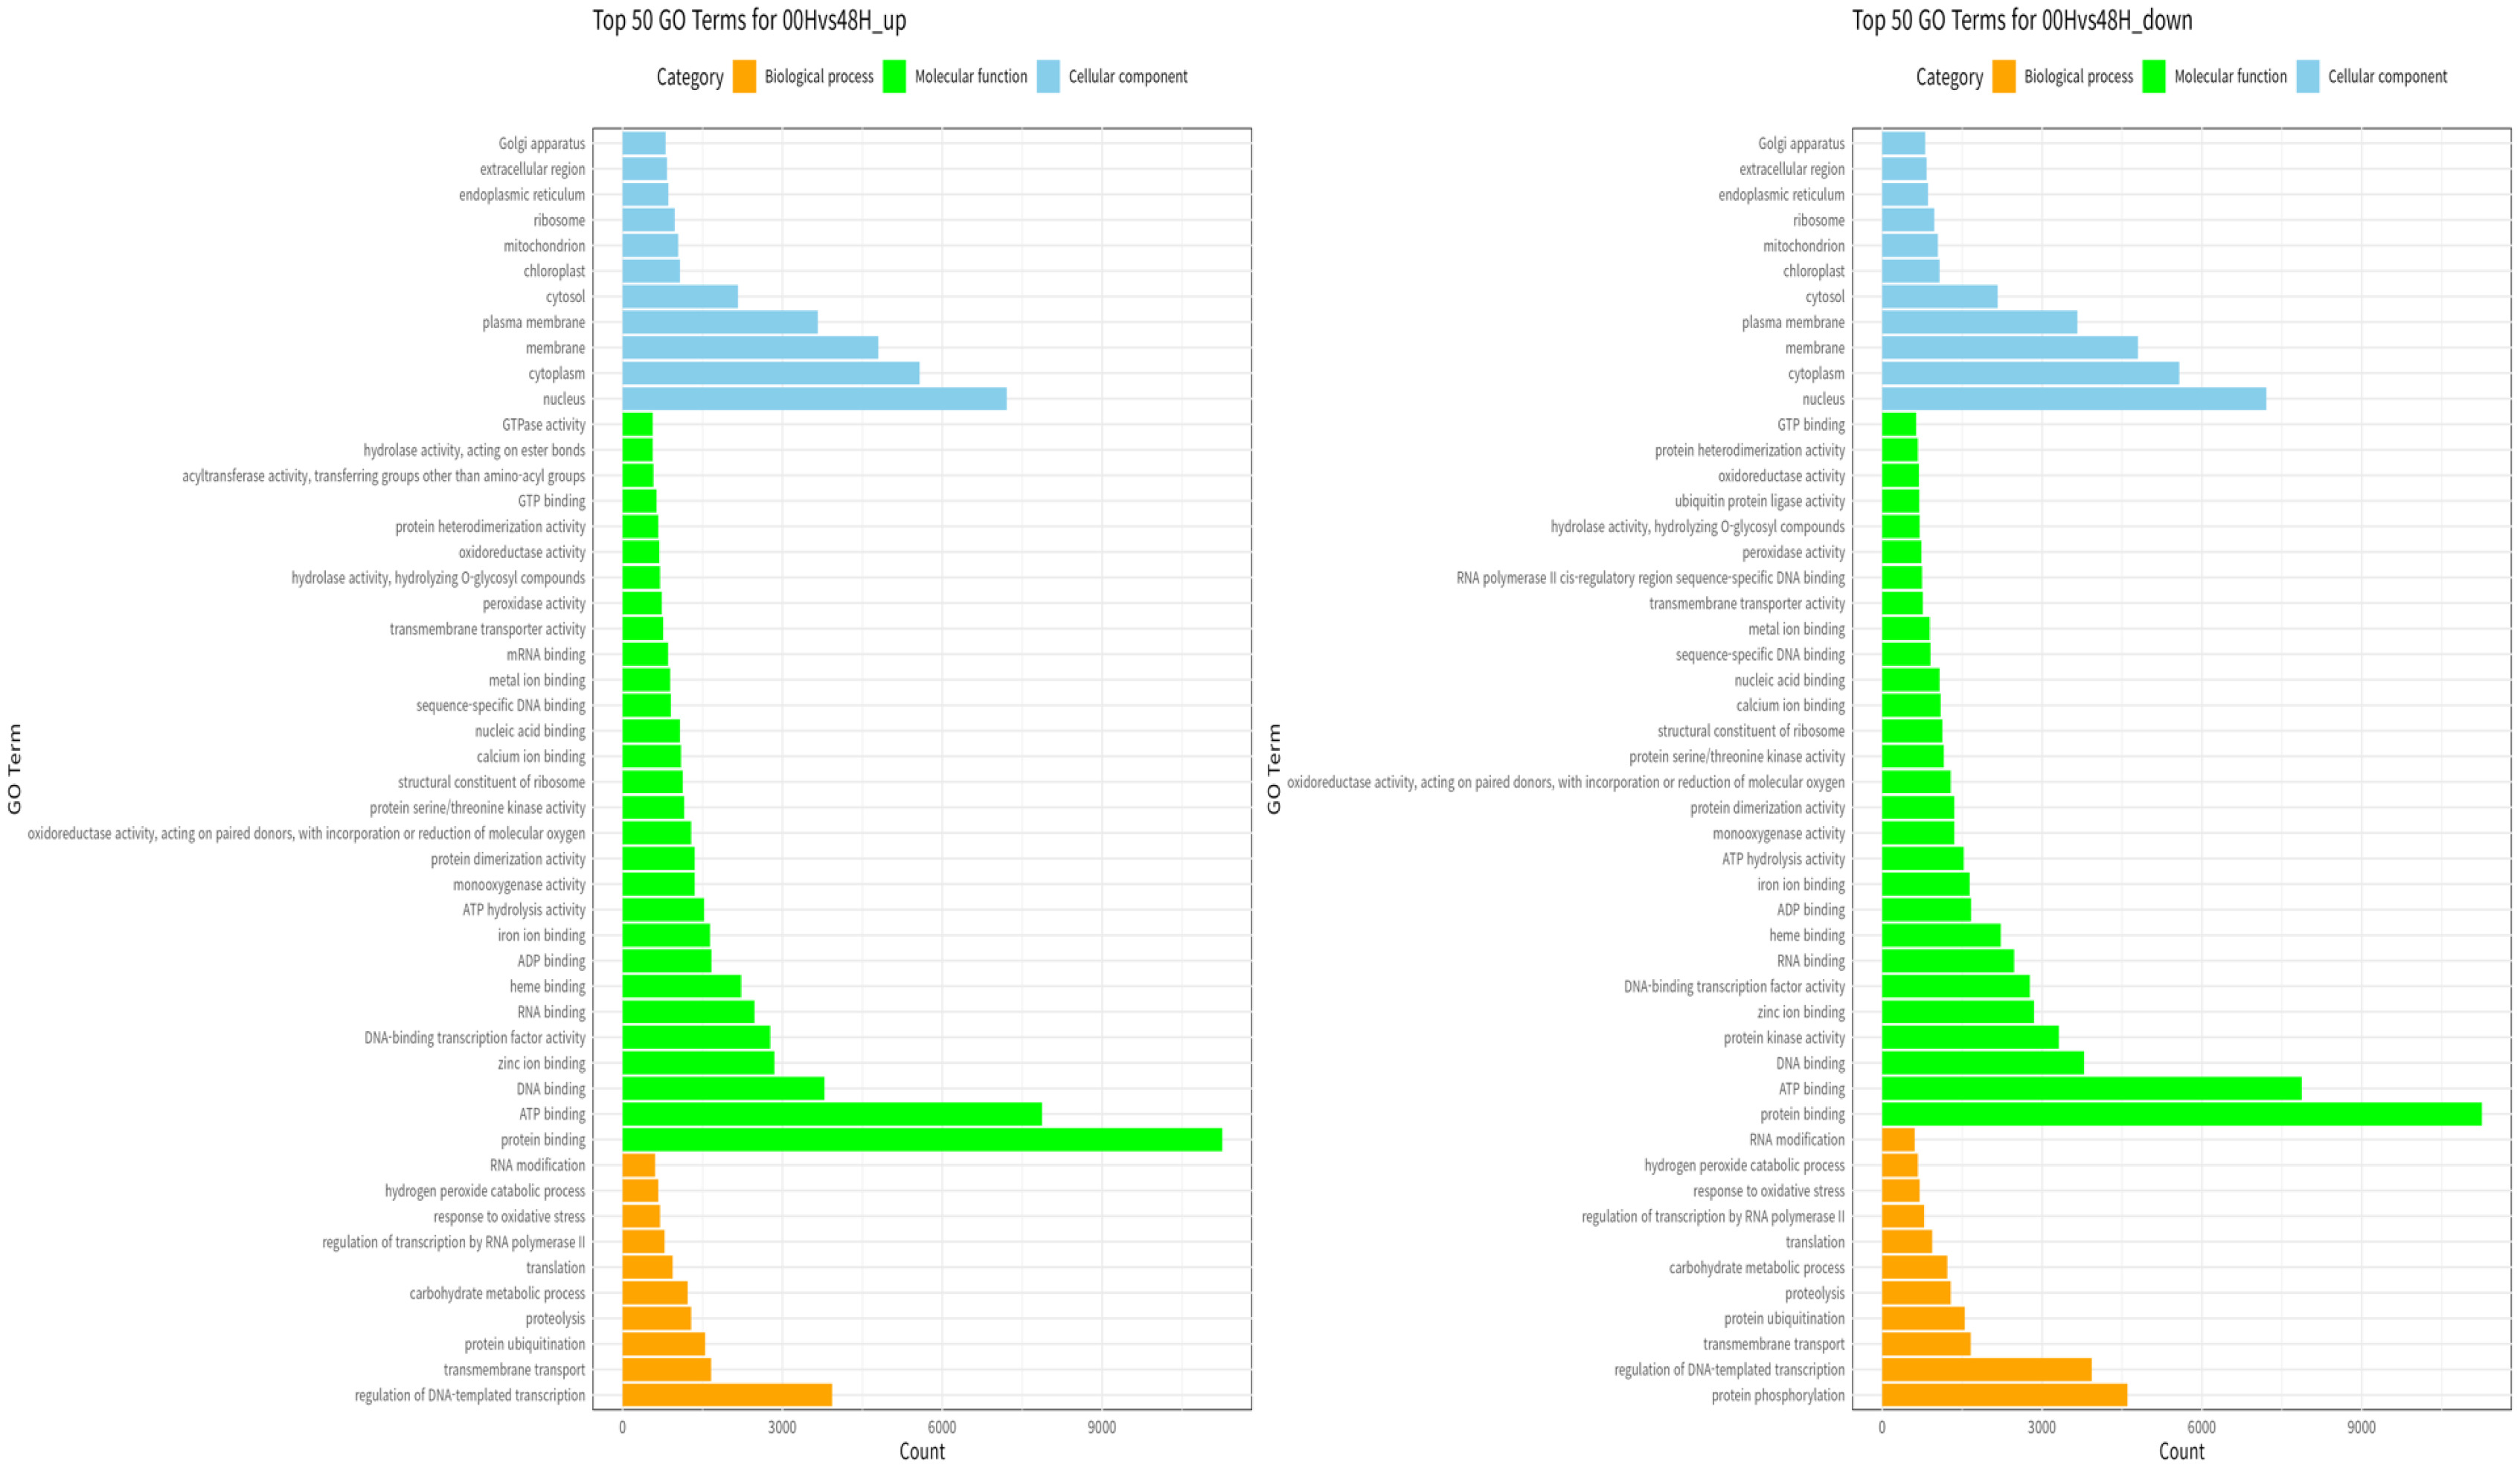
Fig. 6). The most commonly identified GO terms in the 00Hvs48H comparison were regulation of DNA-templated transcription for biological processes, protein binding for molecular functions, and nucleus for cellular components (
Fig. 7). In the 00Hvs48H up comparison, transmembrane transport was also prominent, while in the 00Hvs48H down comparison, protein phosphorylation stood out.
Variant annotation uses information from reference genome annotation to describe genetic variants, such as their location between genes or within genes, and, in the case of variants, the effect of the variants on the entire nucleotide or coding sequence (
Piot et al. 2020). Therefore, we used SNPEff to annotate the genetic variants discovered by Haplotype Caller through the IWGSC wheat v2.1 reference genome (
Table 1). It was divided into region, type of effect, and frequency of SNPs. The coding region was classified into synonymous variants, which do not alter the amino acid sequence, and non-synonymous missense variants, which lead to amino acid substitutions (
Raherison et al. 2020). In the non-coding region, variants were categorized into two types: UTR (untranslated regions), which are located at the 5' and 3' ends of the genes, and intergenic regions, which are situated between genes outside of the upstream and downstream gene areas. This category also includes variants located in splice regions and introns (
Piot et al. 2020). In all results, the proportion of coding regions in all SNPs was approximately 1.7–1.8% (00H, 1,317 of 70,821; 24H, 1,429 of 75,251; 48H, 1,168 of 68,378). Using the SNPEff tool, we divided it into four categories according to the overall impact: High, Low, Moderate, and Modifier (
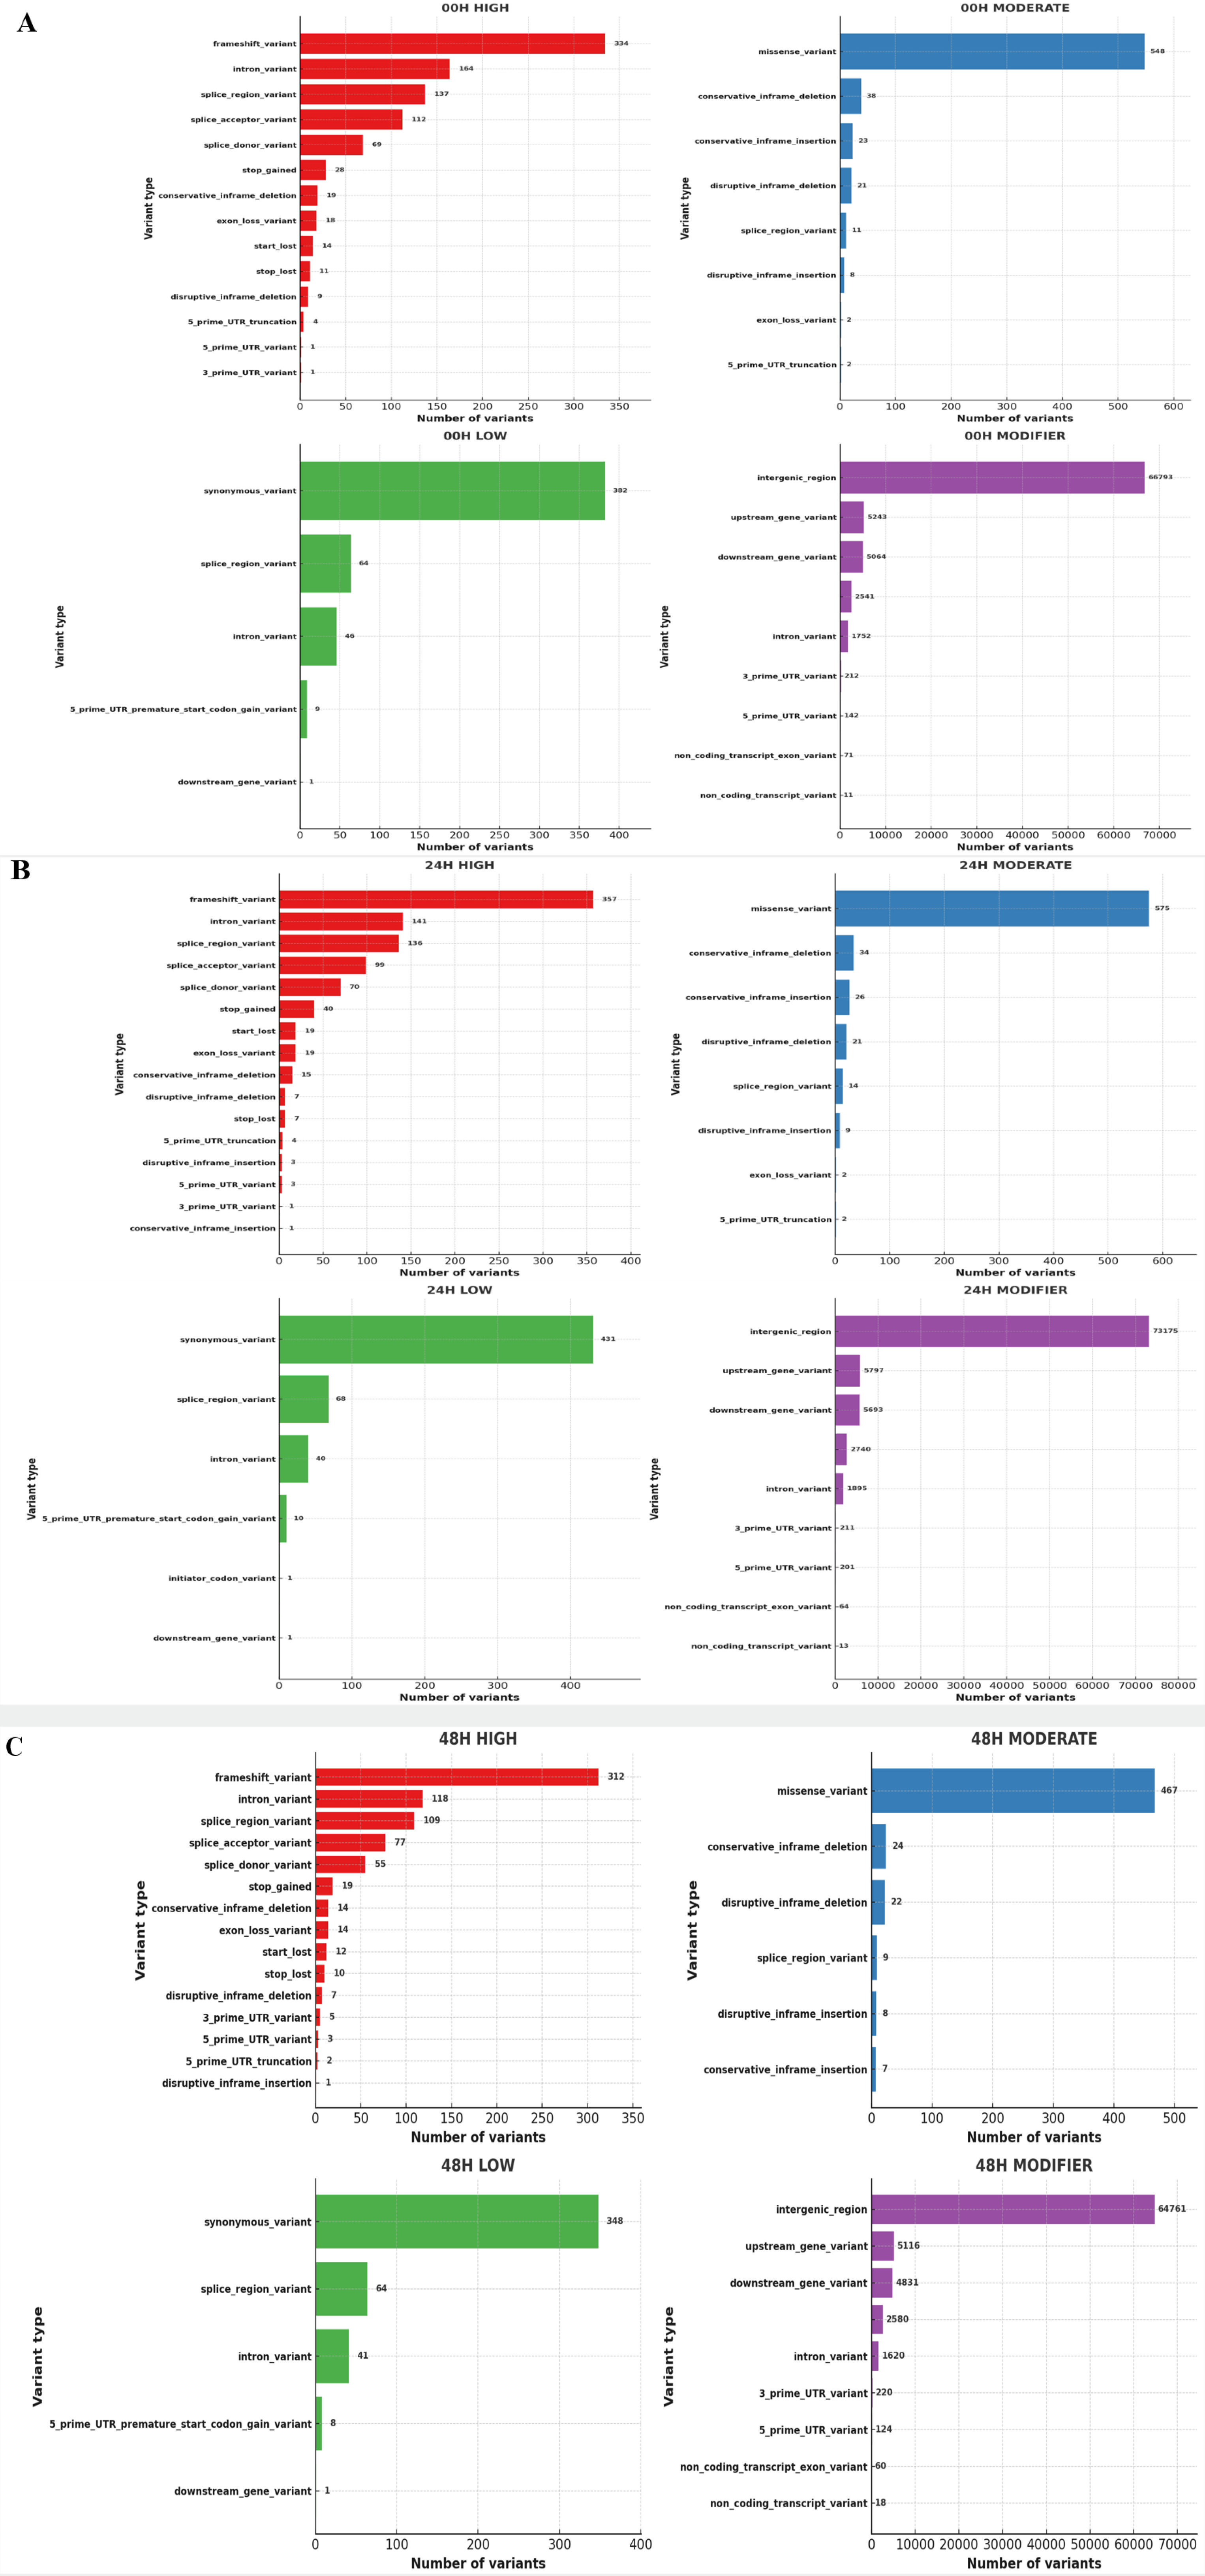
Fig. 8). A high-impact SNP directly affects gene function. It gains stop codons or loses stop codons at each gene. Gain or loss of stop codons can cause functional consequences by deteriorating protein truncation and transcription. Low-impact SNPs are composed of synonymous SNPs, meaning they have little effect on gene function. In addition, in moderate-impact SNPs, non-synonymous variants that can change protein function are observed, and modifier-impact SNPs can change the function of each gene composed of the UTR and intergenic SNP (
Bhardwaj et al. 2016). 80,824 impacts were discovered at 00H, 88,657 at 24H, and 78,077 at 48H. Among the four impact categories, modifier variants were the most abundant, followed by moderate, low, and high impacts, across all time points (00H, 24H and 48H). Within the modifier category, the 'intergenic region' variant was the most prevalent, followed by 'upstream gene variant', 'downstream gene variant', and 'intron variant', consistently across all conditions (
Fig. 9).
First, the number of non-synonymous sites (Ka) indicating nucleotide modification that could cause protein modifications was checked in the control and treatment groups, and changes in gene evolution depending on the salt treatment time were identified (
Tables 2,
3 and
4). The largest non-synonymous SNP in all groups was the "Potassium transporter," with 13 identified at 0 and 24 hours after salt treatment and 14 at 48 hours. Then, we checked the ratio of non-synonymous substitution (Ka)/ synonymous substitution (Ks), where Ks is neutral evolution, so the Ka/Ks ratio reflects the ratio of adaptive evolution to the background ratio of evolution (Hu et al. 2008). Therefore, a Ka/Ks ratio<1 indicates a negative (purifying) selection, and a Ka/Ks>1 means a positive (adaptive) selection (
Roth et al. 2006). A custom Python script was used to compare the Ka/Ks ratio in the control and treatment groups; see a list of genes with a Ka/Ks ratio>1 (
Tables 5,
6 and
7). As a result, of the 266 genes, 136 genes (51.1%) had a Ka/Ks ratio higher than one at 0 h after the salt treatment. At 24 hours after salt treatment, 150 out of 279 genes (53.7%) had a Ka/Ks ratio greater than 1. At 48 hours, 125 out of 245 genes (51.0%) exhibited a Ka/Ks ratio greater than 1. The Ka/Ks ratio distribution of the control and treatment groups also showed a similar distribution.
Discussion
For plants, salt stress is one of the abiotic stresses that significantly negatively impacts growth and development. To such salt stress plants typically use three major mechanisms to increase salt tolerance: osmotic stress tolerance, ion exclusion, and tissue tolerance (
Almeida et al. 2017). These mechanisms are activated in complex and diverse ways within the plant, including minimizing the salinity of the roots and dividing them at the tissue and cell level to avoid the accumulation of toxic substances such as sodium in the cytoplasm of the leaves (
Wang et al. 2020). Especially at the transcript level, salt tolerance is a quantitative trait regulated by many genes (
Munns 2005;
Wu et al. 2017).
Recently, high-throughput transcriptomic data such as NGS (next-generation sequencing) have helped to elucidate the complexity of gene regulation under a variety of abiotic stress conditions (
Panahi et al. 2019). The NGS platform is an excellent method for transcript profiling of organisms at different points and times (
Mahajan et al. 2017). However, in the case of wheat (
Triticum aestivum L.), the genome size is very large and complex, and it is one of the crops with little research on a transcriptomic level.
Therefore, there are currently many studies related to gene expression profiling between wheat and salt stress, and in particular, several post-transcriptional profiling studies of wheat roots under salt stress have been published. However, few post-transcriptional profiling studies have been conducted on wheat leaves at different time points under salt stress conditions. In the present study, the response to salt was confirmed through physiological analysis and comparative genomic analysis of wheat leaves at 0, 24, and 48 hours under salt stress of 200 mM NaCl using salt-resistant mutant wheat at the seedling stage induced by gamma-rays.
When a plant is subjected to salt stress, the osmotic effect causes sodium to accumulate in the shoots, which impedes water absorption from the roots, thereby causing water scarcity (
Pardo 2010;
Roy et al. 2014). The second effect causes ion imbalance, which leads to the accumulation of toxic substances such as sodium, causing tissue necrosis and early leaf senescence, especially in older leaves (
Munns et al. 2008). In addition, potassium is a macronutrient that has a myriad of important physiological roles, such as enzyme activation, regulation of osmotic and membrane potential, and cytoplasmic pH homeostasis in plants (
Armstrong et al. 1998;
Barragan et al. 2012).
However, due to the similar physicochemical properties of potassium and sodium, sodium replaces potassium in major binding sites during essential metabolic processes, disrupting key processes such as enzyme reactions and protein synthesis, ultimately causing growth impairment in plants (
Armstrong et al. 1998;
Assaha et al. 2017;
Marschner 1995). As a result, the K
+/Na
+ ratio of plants under salt stress is considered an important criterion for salt tolerance, and it tends to decrease further as stress intensifies (
Shabala et al. 2014). The sodium content of wheat leaves tends to increase gradually over the salt treatment time, and the ratio of potassium to K
+/Na
+ tends to decrease further. These results are only indicators of the response of wheat leaves to salt stress, and a comparative transcriptomic analysis of salt-tolerant wheat and ordinary wheat will give more reliable results to understand the mechanism of salt-tolerant wheat under salt stress.
The genes expressed in plants under salt stress will be very diverse. One of the best ways to understand the complex candidate genes of salt tolerance is through NGS-based gene annotation and comparative transcriptomic approaches. In the present study, RNA sequencing confirmed the DEGs of wheat leaves at various time points under salt stress.
When comparing 0 and 24 hours after the salt treatment, the most significantly up-regulated gene at 24H after the salt treatment was "XLOC_088735", and the description of this gene was "senescence-specific cysteine protease." This protein is known to have apoptosis, heavy metal degradation, and sensitive response functions for developmental senescence-specific cell death activation in rice (
Oryza sativa L.) (
Yu et al. 2005), and previous studies have confirmed that when NaCl was applied to common wheat at the seedling stage, the expression level of this gene after the salt treatment was up-regulated (
Zang et al. 2010). Additionally, the most significantly downregulated gene 24 hours after the salt treatment was identified as "XLOC_069035," which encodes a "pentatricopeptide repeat-containing protein (
Fig. 5A). This protein family is one of the largest families in the land plants and is known to have an important role in the RNA metabolism of organisms and the development of plants (
Chen et al. 2018). When comparing 00H and 48H after the salt treatment, the most significantly up-regulated gene at 48 hours after the salt treatment was “XLOC_104579,” and the description of this gene was ‘photosystem II 10 kDa polypeptide, chloroplastic.’ This protein is related to the photosystem II oxygen evolution complex in
Arabidopsis thaliana (
Cheng et al. 2017). In a previous study, it was confirmed that this gene was up-regulated when
Kandelia candel L. was treated with salt (
Wang et al. 2013). In addition, "XLOC_030341" was one of the significantly down-regulated genes, and the description of this gene was "transcription factor bHLH47" (
Fig. 5B). This protein is known to be associated with DNA-binding, transcription, and transcription regulation in
Arabidopsis thaliana (
Cheng et al. 2017), and previous studies confirmed that this gene was down-regulated when apples were salted (
Mao et al. 2017). Finally, when comparing 24H and 48H after the salt treatment, the gene that was most significantly up-regulated based on 48H after the salt treatment was 'photosystem II 10 kDa polypeptide, chloroplastic,' which was up-regulated at 48 hours after the salt treatment. The most significantly down-regulated gene was the most significantly up-regulated "senescence-specific cysteine protease" in the comparison between 00H and 24H after the salt treatment (
Fig. 5C). In the salt treatment of common wheat, which was used as plant material in previous studies, this gene tended to up-regulate over time gradually (
Zang et al. 2010), while our study observed that it decreased rapidly from 48H after the salt treatment.
For decades, traditional breeding methods have sought to improve crops through hybridization or mutation breeding. These methods were performed by selecting individuals with superior phenotype traits without knowing the molecular mechanism (
Rasheed et al. 2019). However, this breeding method was inefficient because it takes a lot of time, money, and effort, and as the use of molecular markers has rapidly increased with the recent development of genomics tools, the limit of phenotyping has been reduced, and the breeding program has been developed (
Cericola et al. 2017). Among them, single nucleotide polymorphism (SNP) markers are increasingly being selected in many plants, and crop breeders have recently become more interested in SNP markers. The reason is that the presence of SNPs among individual crops of single-copy DNA enables much more efficient breeding through SNP markers in individuals with good phenotype traits (
Morgil et al. 2020). Plant protein function and gene expression that change under various conditions can be caused by SNPs in their respective coding regions and regulatory sequences (
Xu et al. 2011). Therefore, breeding with SNP markers shortens the selection time of individuals with agriculturally advantageous traits such as abiotic stress resistance (
Oyiga et al. 2018;
Younis et al. 2020), pathogen resistance (
Gao et al. 2016;
Wu et al. 2018), yield, and grain quality, and has a positive effect on crop improvement. In addition, allelic frequencies can be assessed by SNP changes from comparisons between two different phenotypes by RNA sequencing (
Morgil et al. 2020). This approach allows for phenotype prediction based on genotype and supports data-driven strategies in crop breeding (
McMullen et al. 2009).
To investigate the genetic changes in wheat leaves under salt stress, we compared SNP occurrences between different time points and the Wheat reference genome (IWGSC v2.1). Among the SNPs identified, we focused on non-synonymous SNPs, which alter protein function due to sequence changes. The most frequently found non-synonymous SNP gene symbol in both the control and treatment groups was "TraesCS6A02G063000," which encodes a "potassium transporter" (
Tables 2,
3 and
4). Previous studies have shown that genetic changes affecting leaf Na
+ levels and the K
+/Na
+ ratio are closely related to salt tolerance (
Ahmad et al. 2011), and the expression of "potassium transporter" genes increases over time in salt-tolerant wheat leaves under salt stress (
Oyiga et al. 2018).
In addition, to assess the potential functional significance of SNPs located in coding regions, we calculated the ratio of non-synonymous to synonymous substitutions (Ka/Ks) by comparing transcript-derived variants with the reference genome (
Fig. 10). While RNA-Seq data is not typically used for evolutionary Ka/Ks analysis, this metric was used here to examine the relative coding impact of detected SNPs. As shown in
Fig. 10, most genes had Ka/Ks ratios below 1, suggesting functional constraints on coding changes, while a few genes exhibited Ka/Ks ratios greater than 1, indicating potential coding variation under salt stress.
Interestingly, the gene with the highest Ka/Ks ratio across all groups was "TraesCS5A02G326300," which is associated with the function of "Protein detoxification" (
Tables 5,
6 and
7) and exhibits an antiporter activity. Previous research has confirmed that transgenic
Arabidopsis overexpressing detoxification genes showed enhanced salt tolerance under salt stress (
Qi et al. 2010). While some loci exhibited Ka/Ks ratios greater than 1 at different time points, the data do not show a clear gradual increase over time. Therefore, these variations may reflect transient transcriptional changes in response to salt stress.
In conclusion, our study highlights the complex genetic and physiological responses of wheat leaves under salt stress. Through comparative transcriptomic and SNP analyses, we identified key candidate genes and mechanisms potentially contributing to salt tolerance. Notably, identifying genes such as "potassium transporter" and "protein detoxification" underscores their critical roles in maintaining ion homeostasis and cellular detoxification under stress conditions. These findings contribute to understanding how plants respond to salt stress at the molecular level.
Our results provide valuable insights into the molecular basis of salt tolerance in wheat and lay a foundation for future breeding programs targeting abiotic stress resilience. However, while our study offers significant advances, additional experimental validation of key DEGs through qRT-PCR and further physiological and transcriptomic comparisons with non-mutant wheat varieties, such as "Urimil," will be necessary to strengthen and expand upon these results. This integrative approach will enhance our understanding of salt tolerance mechanisms and accelerate the development of salt-tolerant wheat cultivars, contributing to sustainable agriculture in salt-affected regions.
Acknowledgments
This work was supported by a research fund of Chungnam National University.
Fig. 1SNP analysis pipeline using sequencing data of the genotype by time under salt treatment.
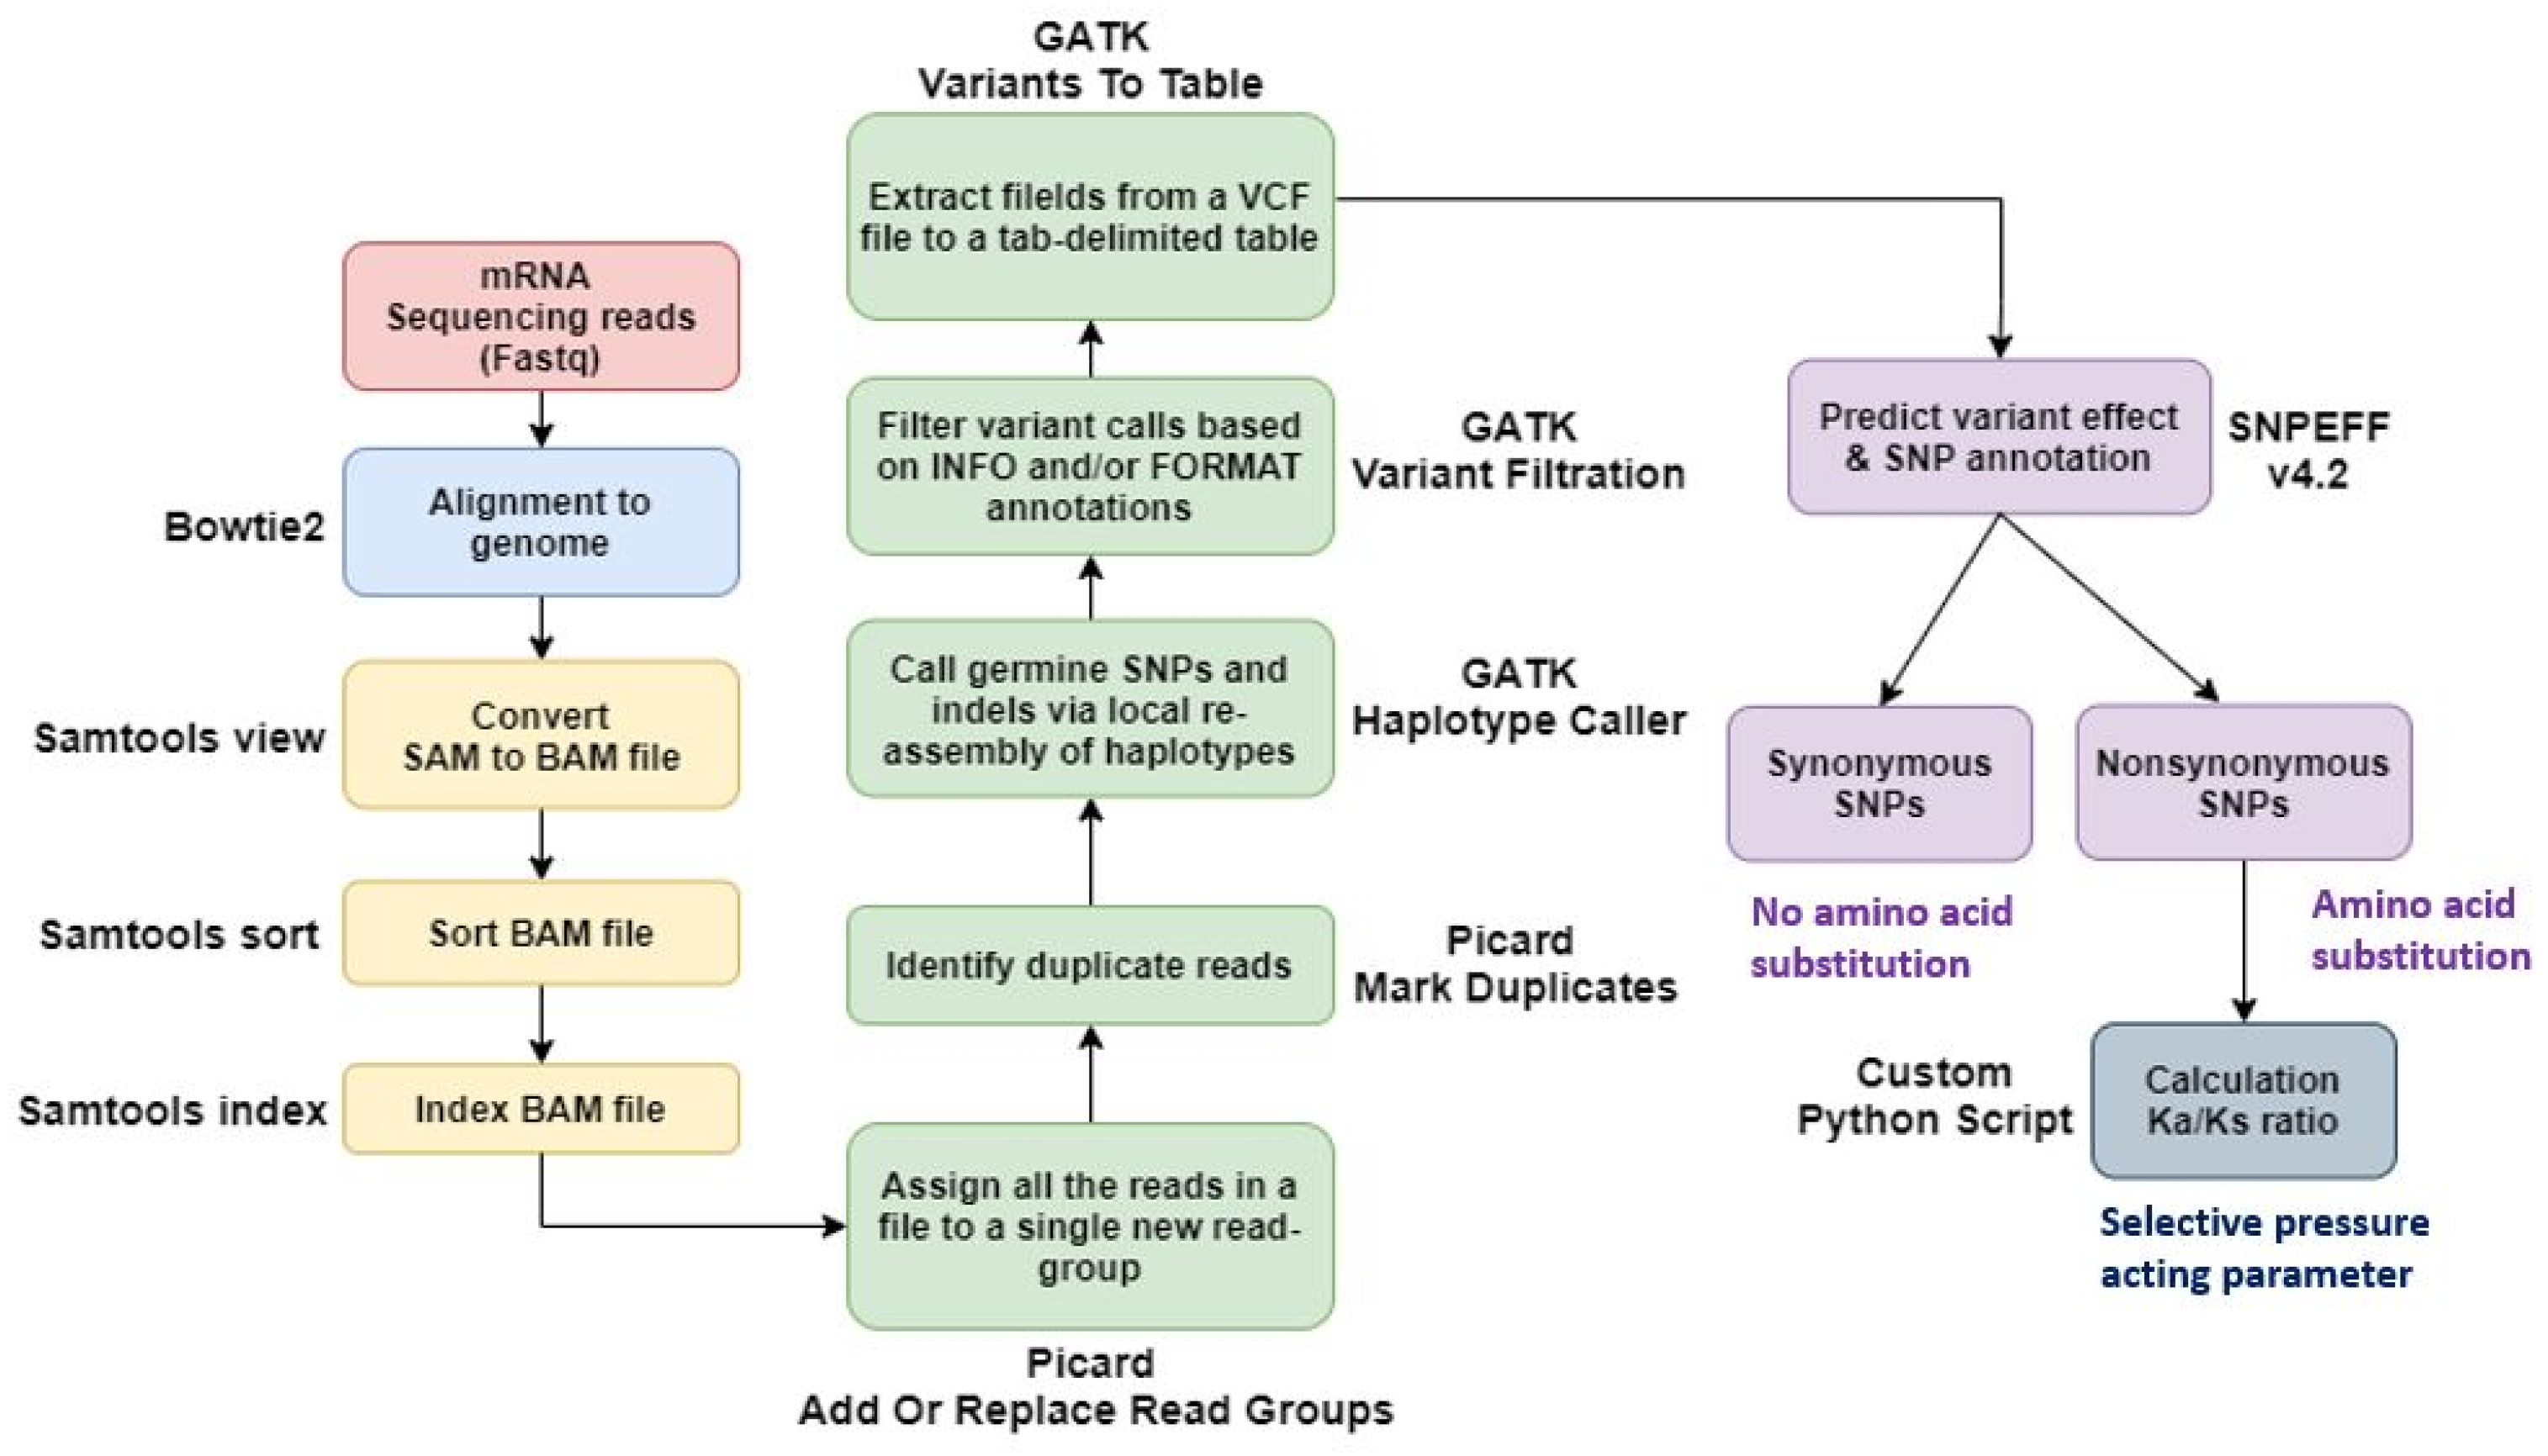
Fig. 2Changes in ion content in leaves following treatment with 200 mM NaCl over time. (A) Changes in Na+ content. (B) Changes in K+ content. (C) K+/Na+ ratio.
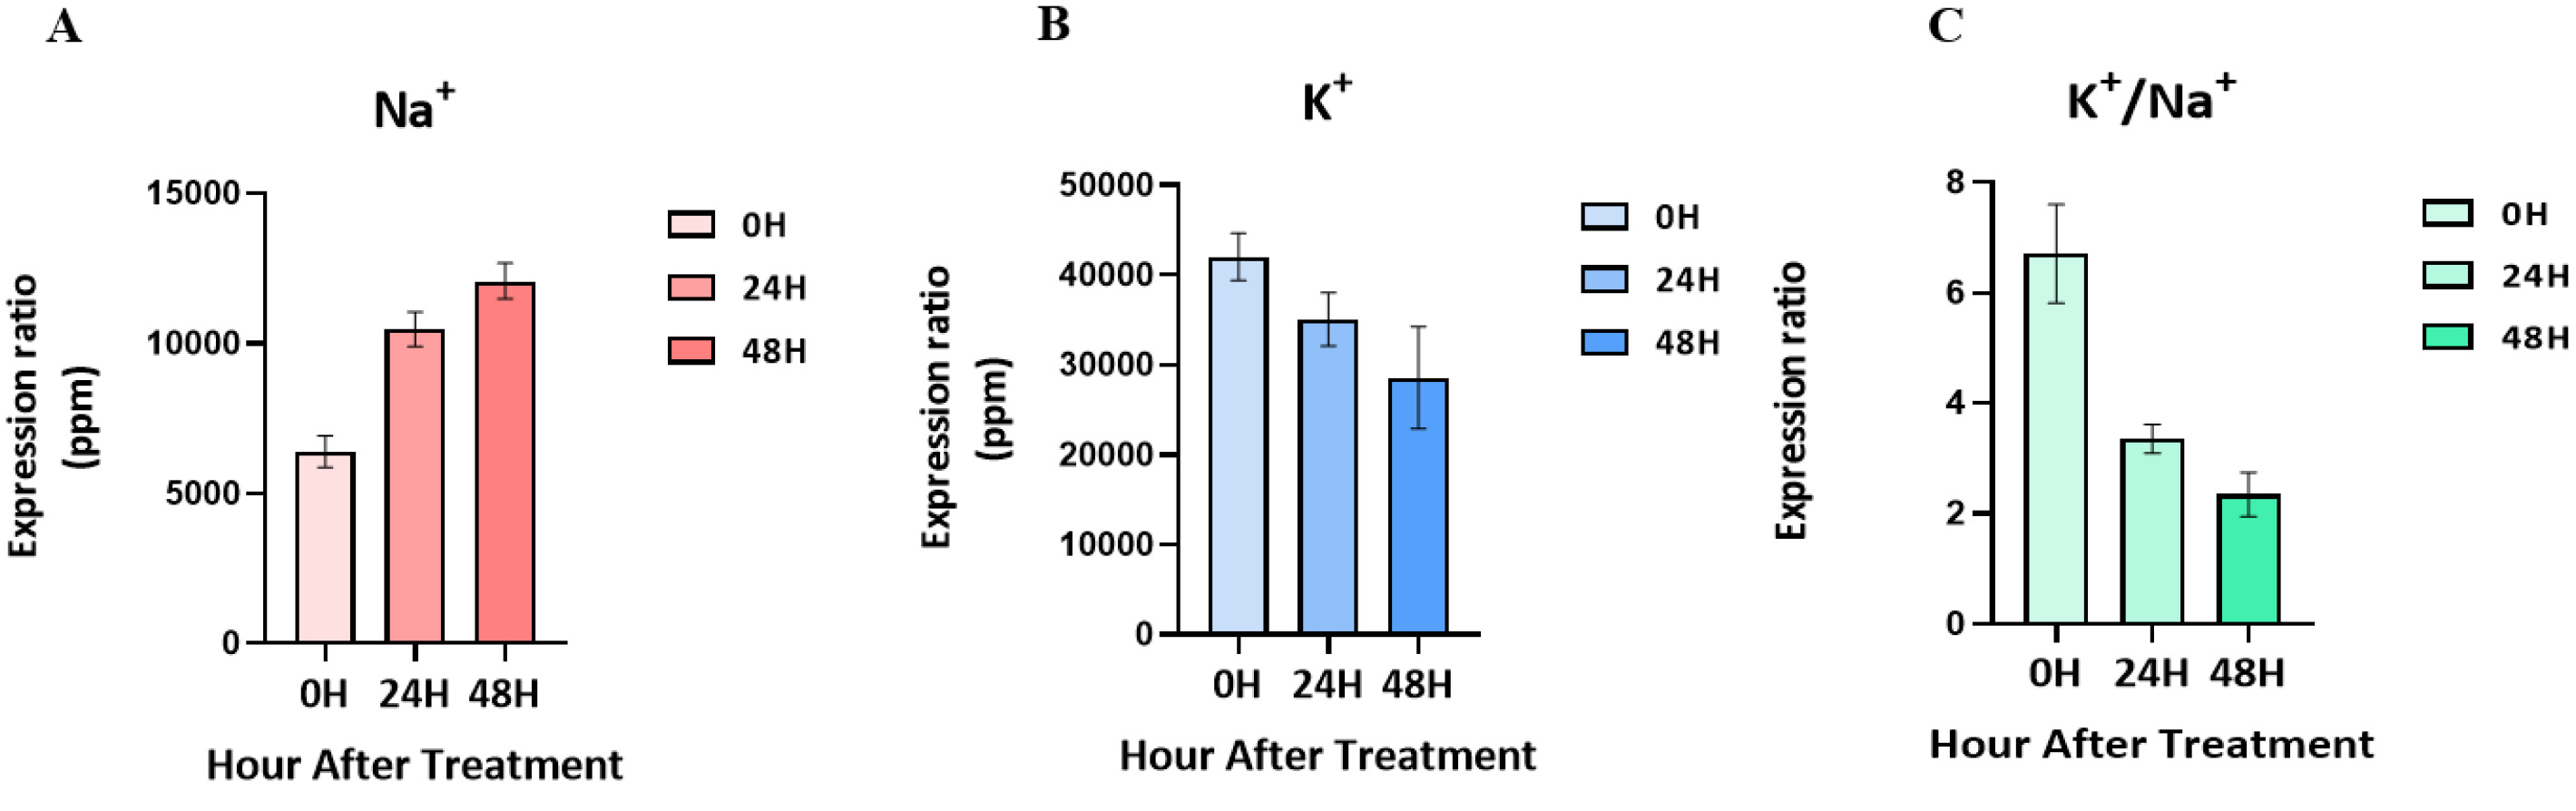
Fig. 3Number of DEGs for the three comparative combinations of leaves under salt stress (24H and 48H) and control conditions (00H).
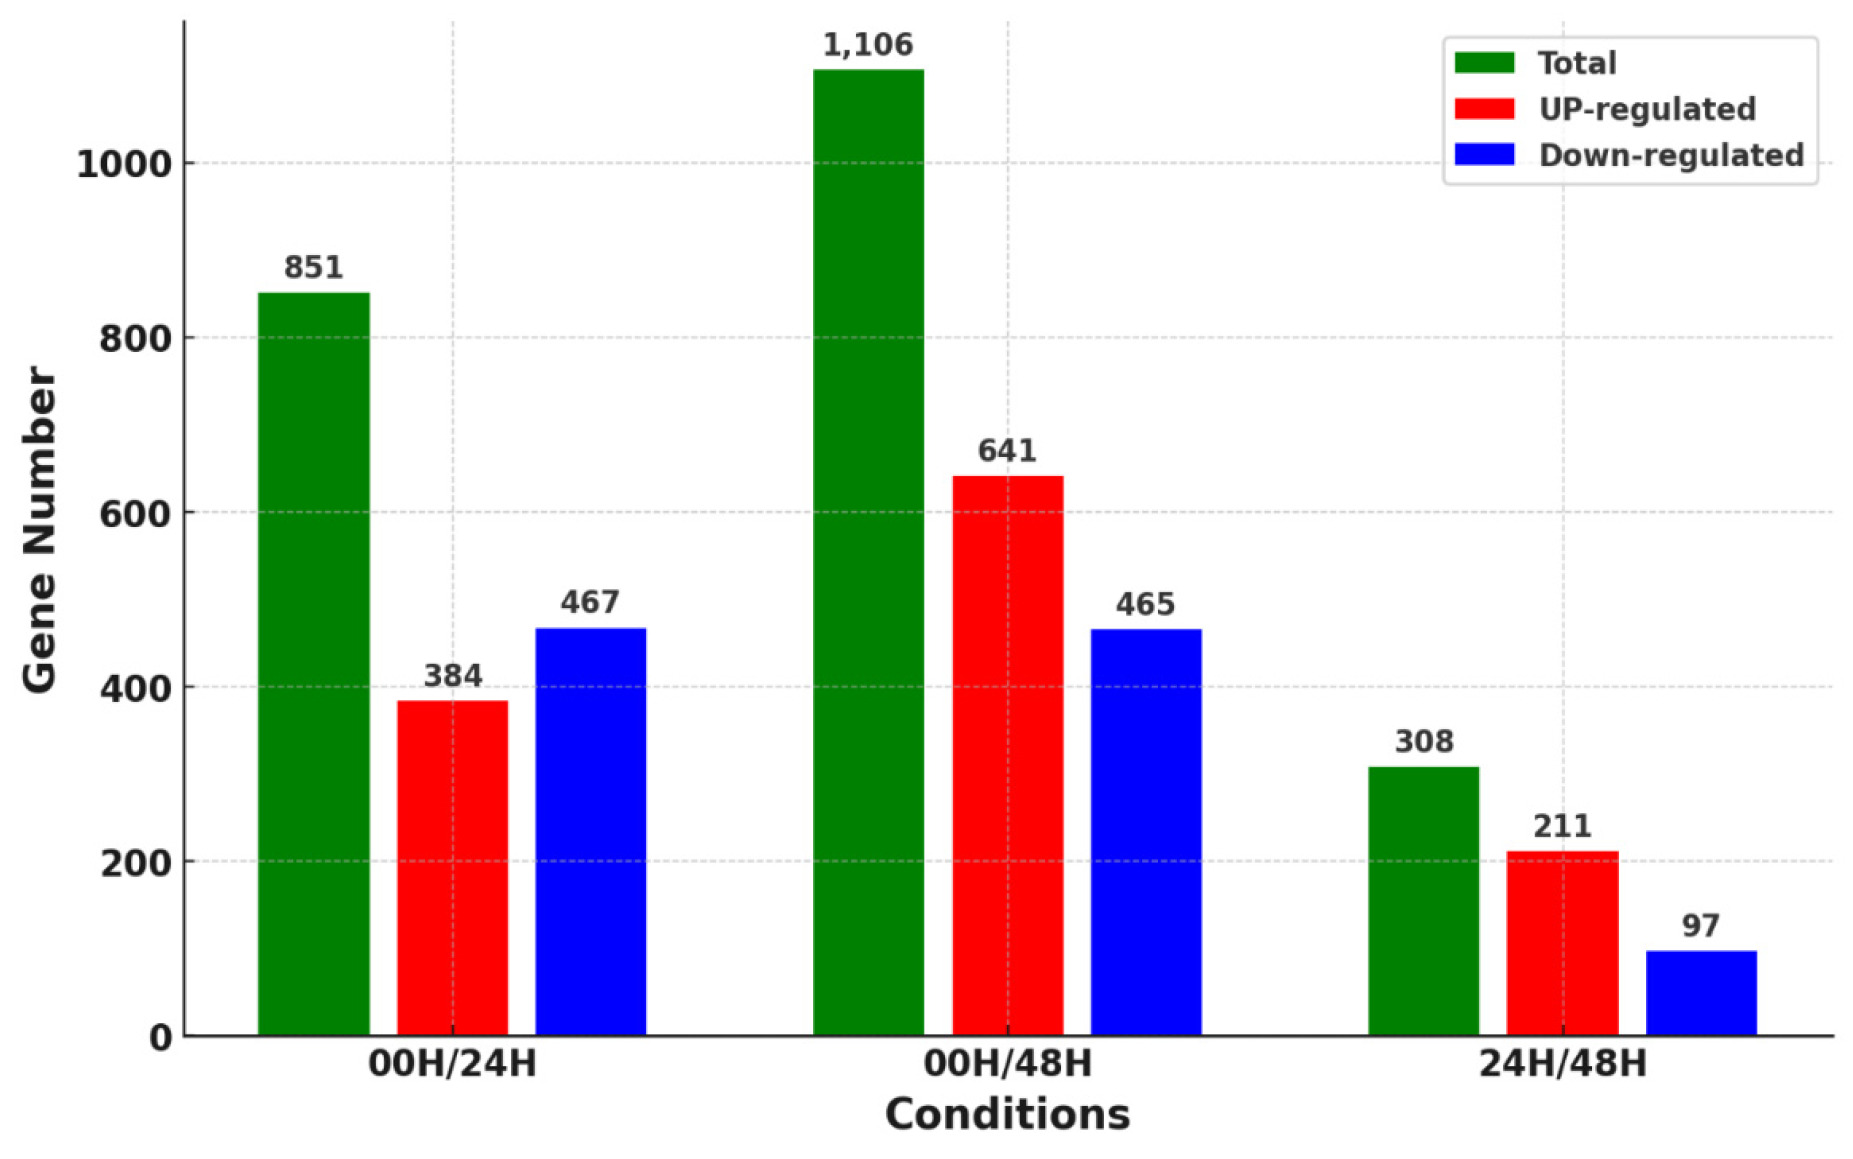
Fig. 4Distribution of overlapping or unique genes via Venn diagram for 3 DEG combinations (A) Up-regulated genes in 00H vs. 24H, 00H vs. 48H, and 24H vs. 48H comparisons (B) Down-regulated genes in 00H vs. 24H, 00H vs. 48H, and 24H vs. 48H comparisons.
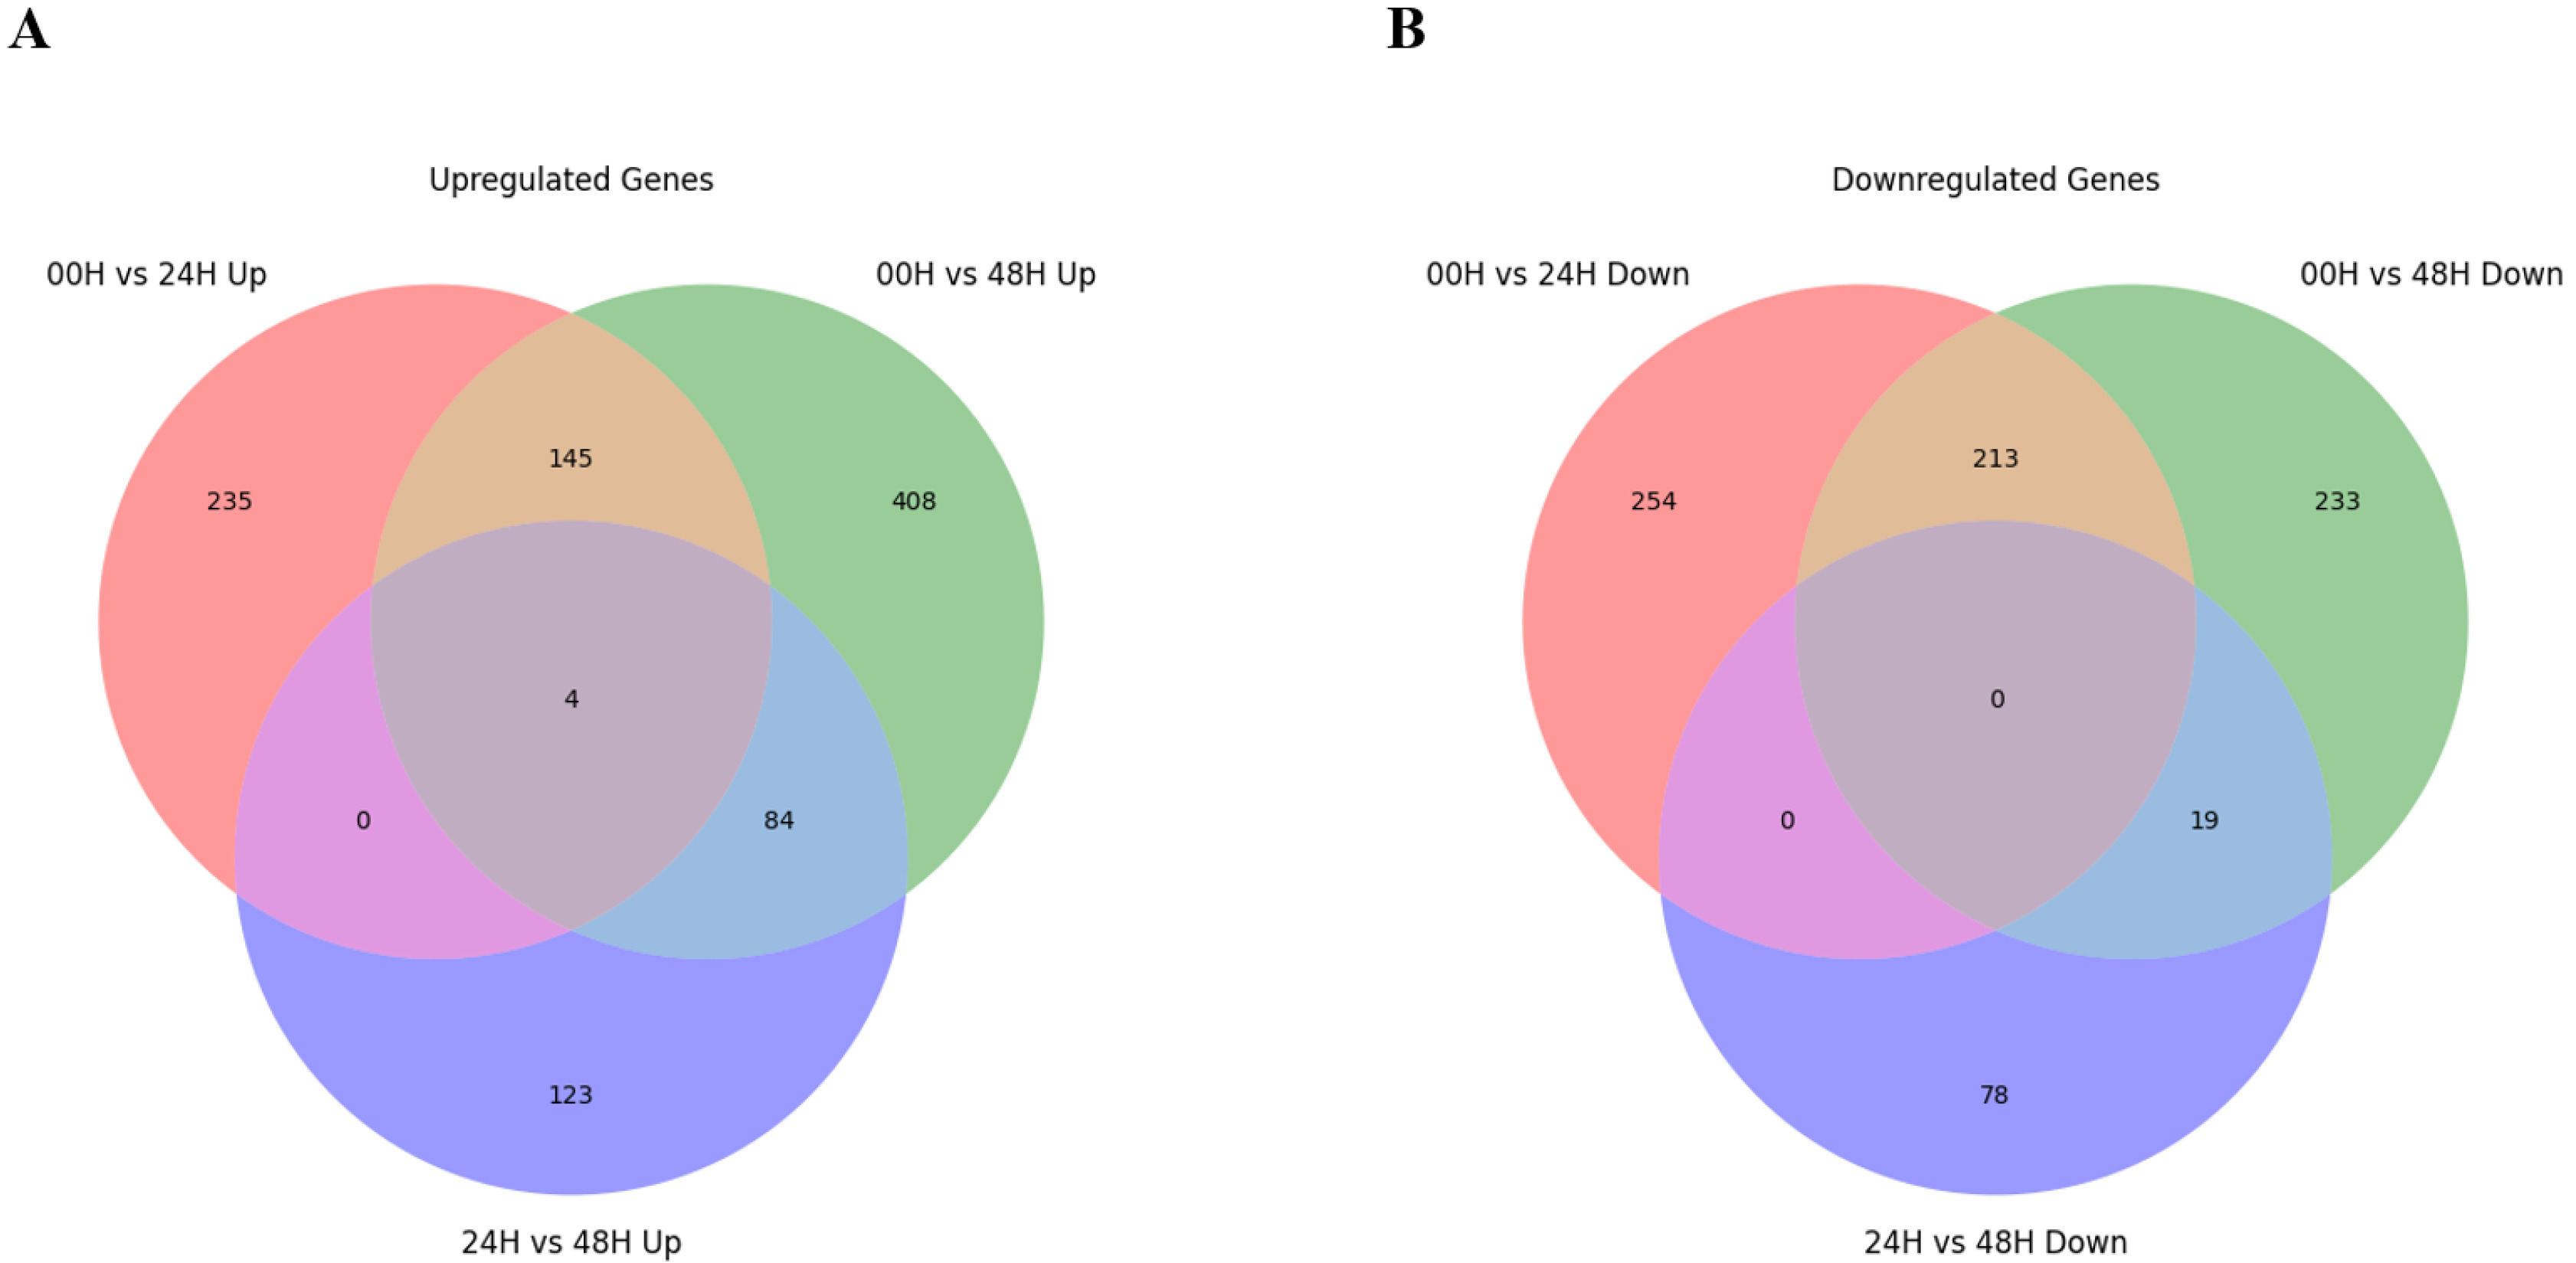
Fig. 5Heatmap analysis of differentially expressed genes (DEGs) at 0, 24, and 48 hours under salt stress, displaying the top 20 genes with the most significant differences. Genes were selected based on |log₂ fold change|≥3, and expression levels were visualized using log₁₀(FPKM+1) values. (A) Comparison between the 00H and 24H after salt treatment. (B) Comparison between the 00H and 48H after salt treatment. (C) Comparison between the 24H and 48H after salt treatment.
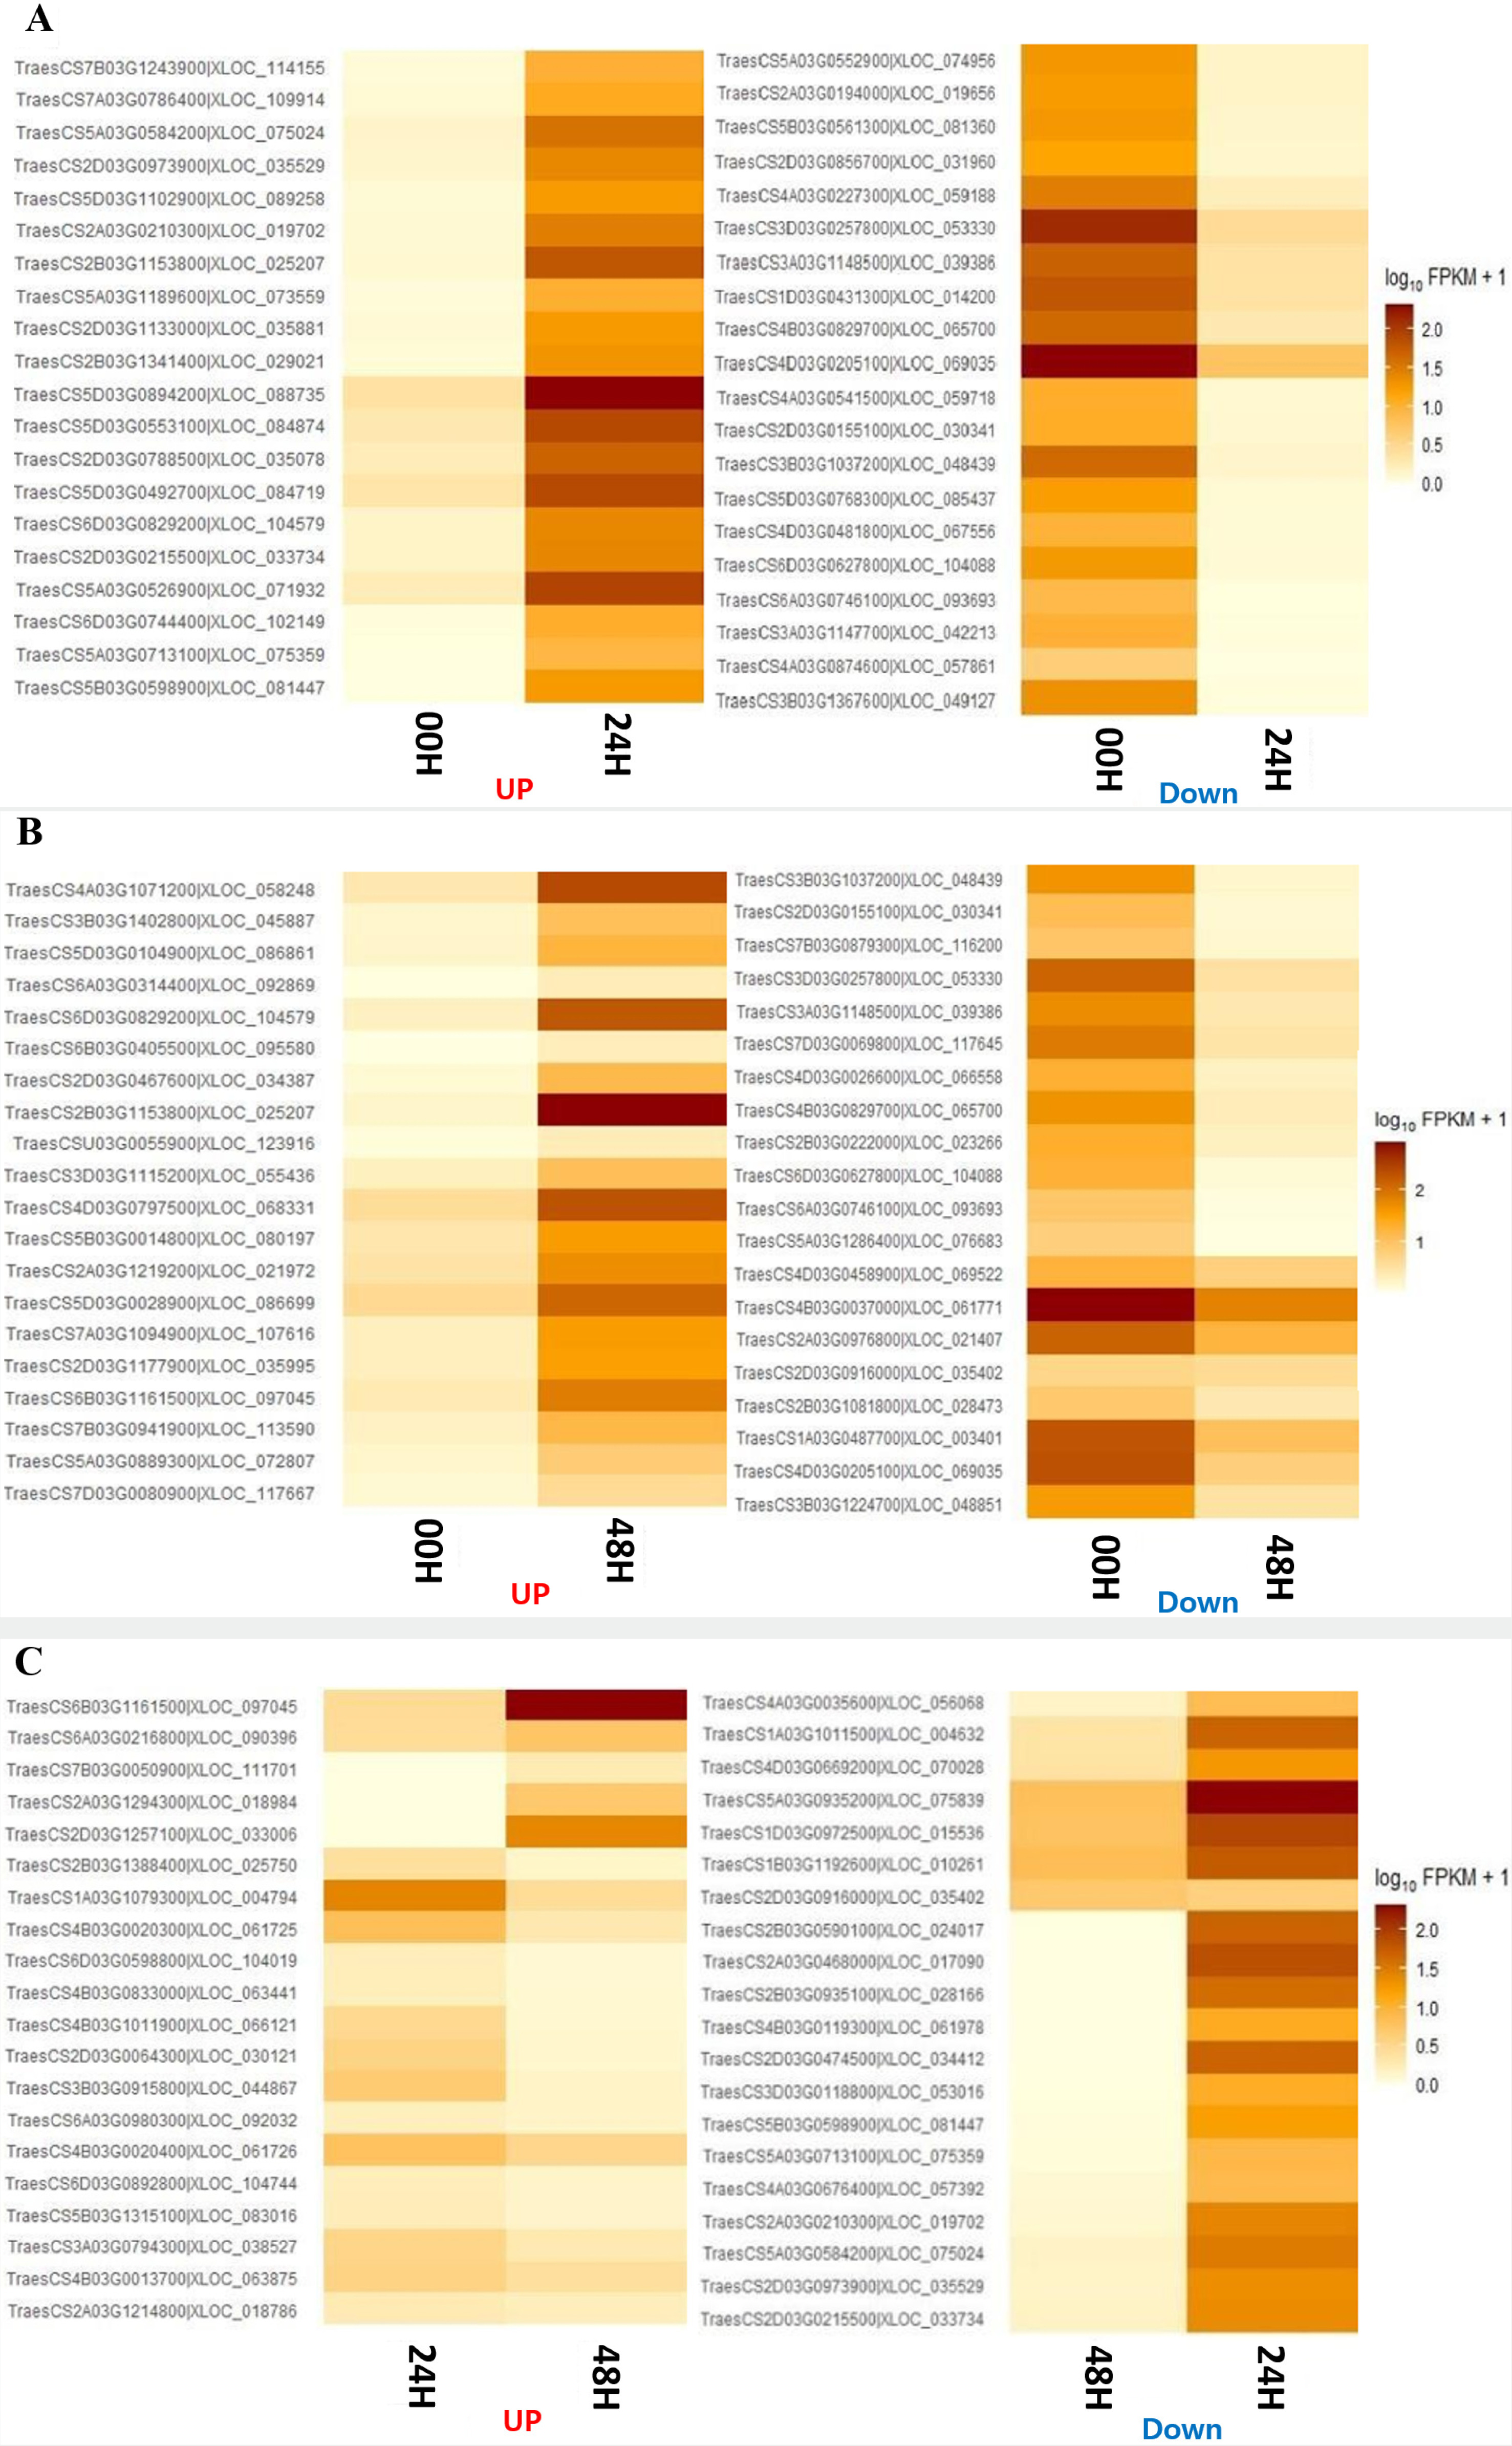
Fig. 6Distribution of overlapping or unique gene ontology terms through Venn diagrams for the 3 DEG combinations. (A) Up-regulated genes in 00H vs 24H, 00H vs 48H, and 24H vs 48H comparisons. (B) Down-regulated genes in 00H vs 24H, 00H vs 48H, and 24H vs. 48H comparisons.

Fig. 7Gene ontology analysis of DEGs composed of biological process, molecular function, and cellular component between the two genotypes at 00H and 48H after salt stress.

Fig. 8Percentage contribution of SNPs by effect type (high, moderate, and low, modifier) in three wheat leaf genotypes at 00H, 24H, and 48H after salt stress.
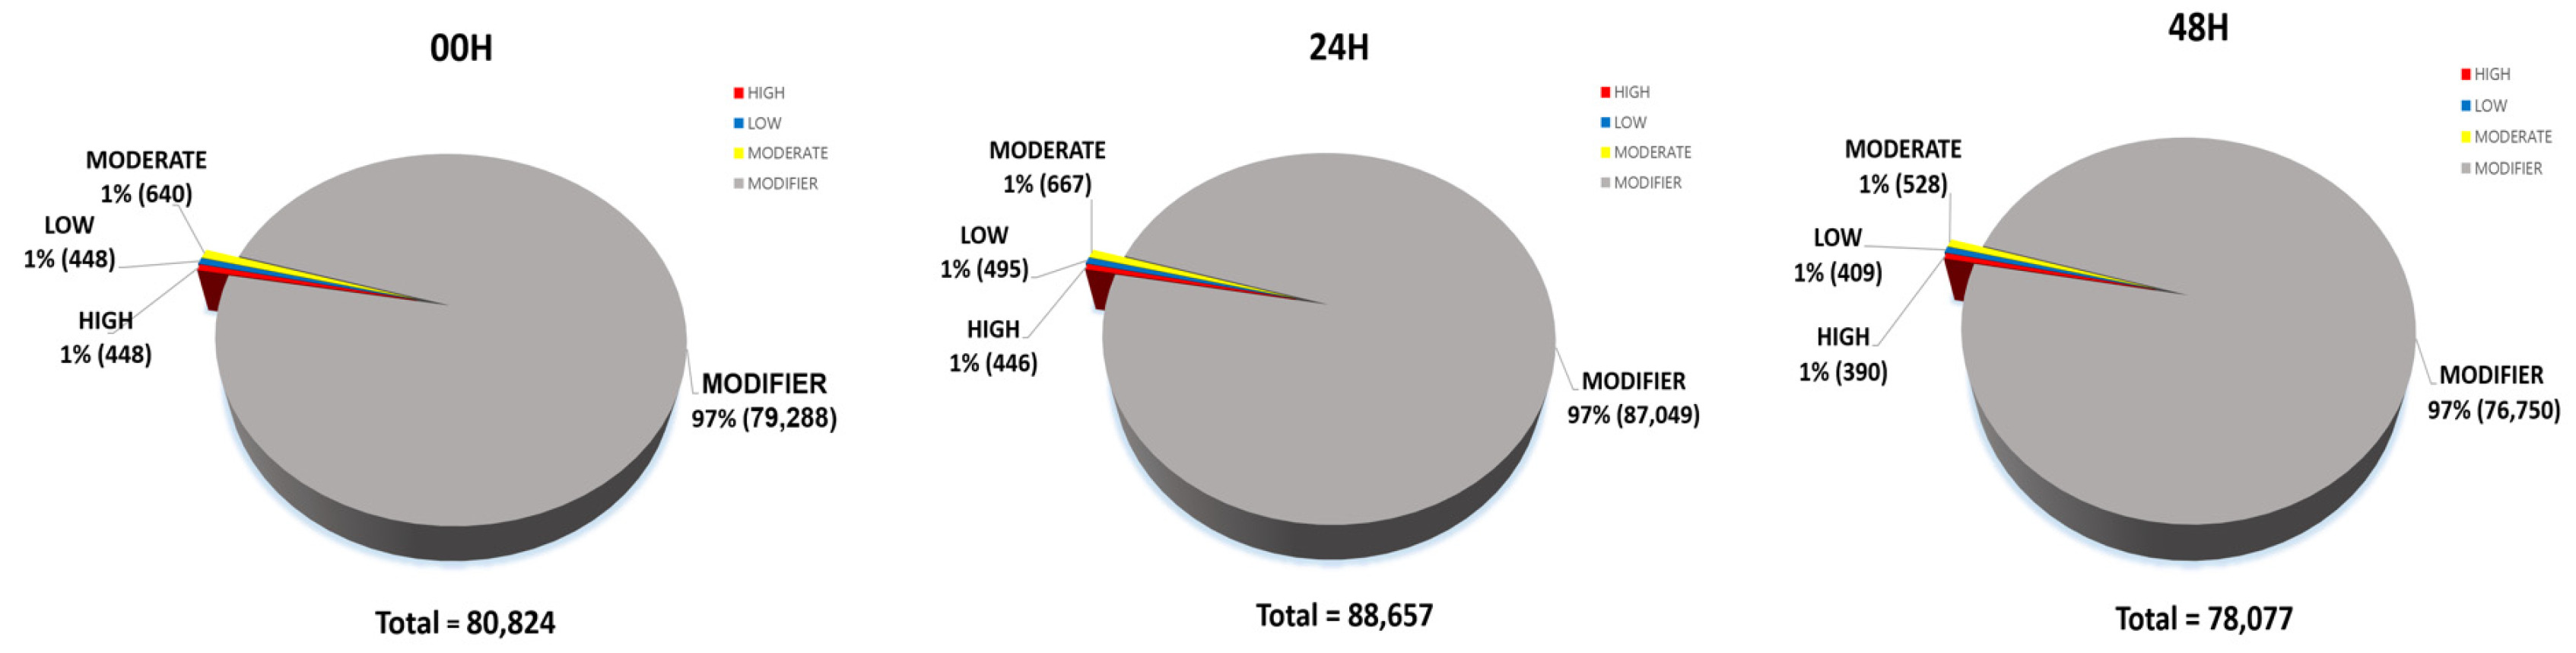
Fig. 9Detailed classification of each impact of SNPs (A) 00H. (B) 24H (C) 48H.

Fig. 10Distribution of Ka/Ks ratios of genes of 3 wheat leaves genotypes (A) 00H (B) 24H (C) 48H.
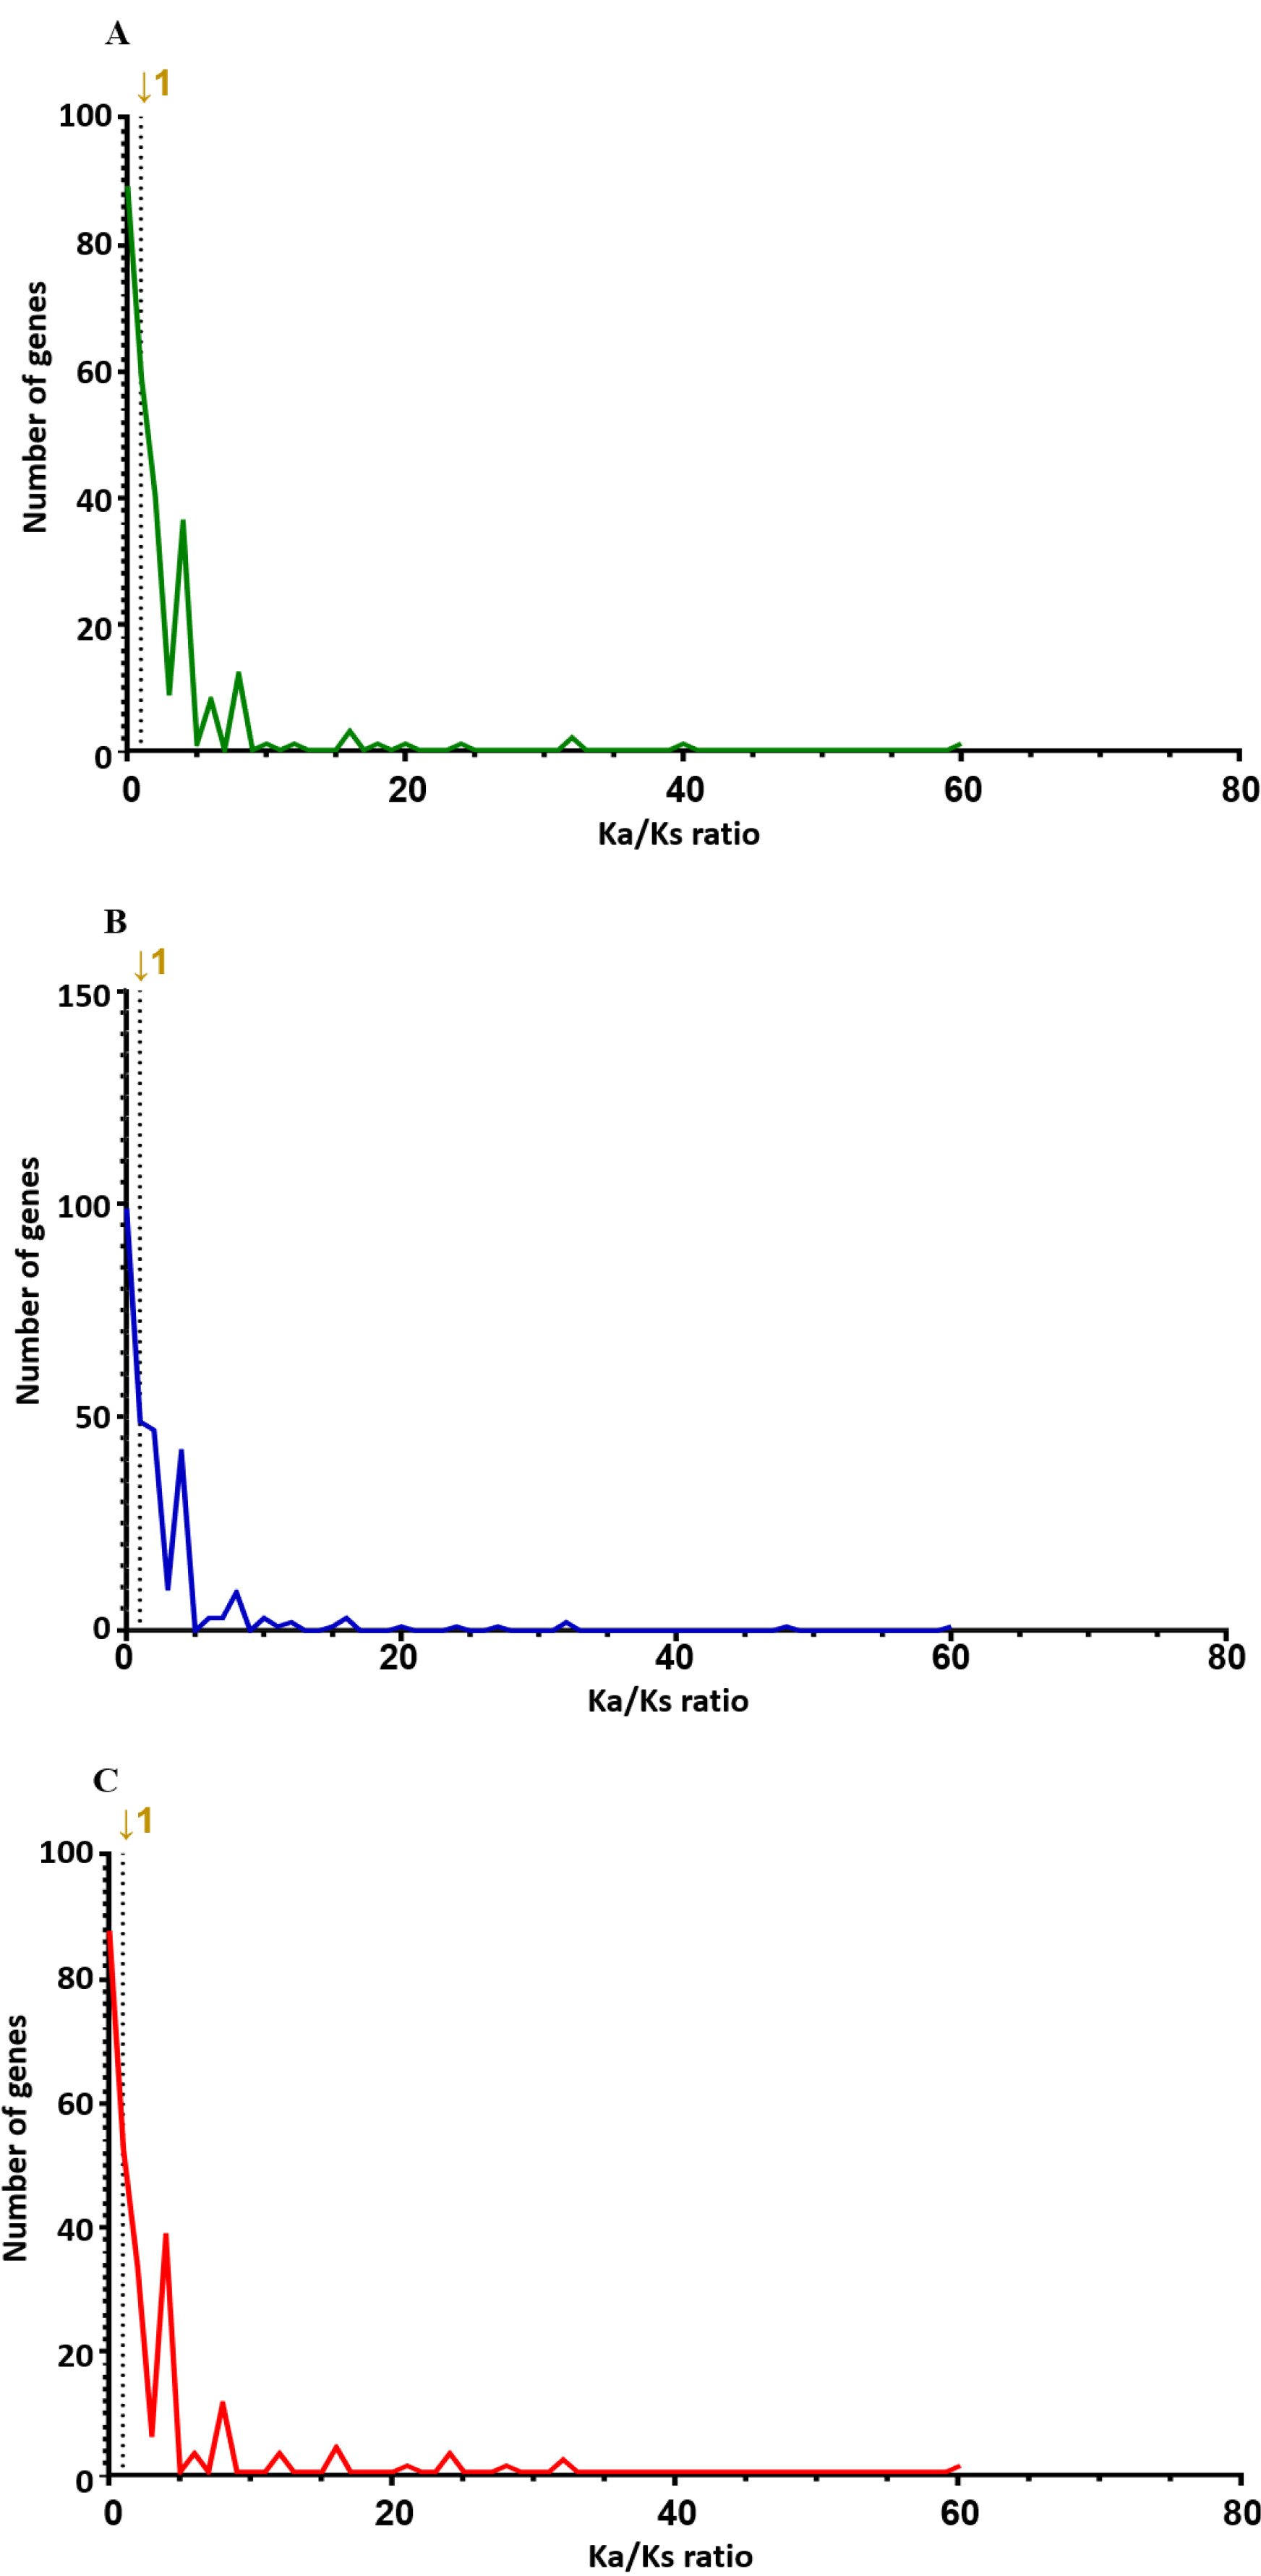
Table 1SNP distribution of genotypes at 00H, 24H, and 48H after salt treatment of the wheat leaves.
Table 1
|
Type of genotypes |
Type of region |
Type of effect |
Frequency of variants |
|
00H |
Coding |
Synonymous |
382 |
|
Non-synonymous |
935 |
|
UTR |
|
356 |
|
Splice region |
|
393 |
|
Intergenic |
|
66,793 |
|
Intron |
|
1,962 |
|
|
24H |
Coding |
Synonymous |
431 |
|
Non-synonymous |
998 |
|
UTR |
|
416 |
|
Splice region |
|
387 |
|
Intergenic |
|
73,175 |
|
Intron |
|
2,076 |
|
|
48H |
Coding |
Synonymous |
348 |
|
Non-synonymous |
820 |
|
UTR |
|
352 |
|
Splice region |
|
314 |
|
Intergenic |
|
64,761 |
|
Intron |
|
1,779 |
Table 2List of non-synonymous SNPs based genes at 00H after the salt treatment along with the number of non-synonymous SNPs.
Table 2
|
Gene Symbol |
The number of nonsynonymous SNPs |
Description |
|
TraesCS6A02G063000 |
13 |
Potassium transporter |
|
TraesCS3D02G034300 |
10 |
LRRNT_2 domain-containing protein |
|
TraesCS2D02G018100 |
6 |
Rx_N domain-containing protein |
|
TraesCS1B02G022900 |
5 |
FHA domain-containing protein |
|
TraesCS2D02G026600 |
5 |
Protein kinase domain-containing protein |
|
TraesCS1B02G248400 |
4 |
Threonyl-tRNA synthetase |
|
TraesCS2B02G044700 |
4 |
AAA domain-containing protein |
|
TraesCS2B02G044900 |
4 |
NB-ARC domain-containing protein |
|
TraesCS3A02G026700 |
4 |
Peroxin-14 |
|
TraesCS4A02G140700 |
4 |
Divinyl chlorophyllide a 8-vinyl- reductase, chloroplastic |
|
TraesCS5A02G326600 |
4 |
F-box domain-containing protein |
|
TraesCS6A02G070600 |
4 |
Methenyltetrahydrofolate cyclohydrolase |
|
TraesCS7A02G000300 |
4 |
NAC domain-containing protein |
|
TraesCS7A02G145100 |
4 |
Protein kinase domain-containing protein |
|
TraesCS7D02G050600 |
4 |
LRRNT_2 domain-containing protein |
|
TraesCS1B02G008700 |
3 |
Protein kinase domain-containing protein |
|
TraesCS1B02G220900 |
3 |
C2 NT-type domain-containing protein |
|
TraesCS2B02G094000 |
3 |
Dof-type domain-containing protein |
|
TraesCS5A02G326300 |
3 |
Protein DETOXIFICATION |
|
TraesCS6B02G040500 |
3 |
Mannosyltransferase |
|
TraesCS7D02G142600 |
3 |
H(+)-exporting diphosphatase |
|
TraesCS3D02G026400 |
2 |
Fructose-bisphosphate aldolase |
|
TraesCS4A02G073000 |
2 |
BZIP domain-containing protein |
|
TraesCS5A02G241900 |
2 |
Abhydrolase_3 domain-containing protein |
|
TraesCS5A02G309300 |
2 |
TCP domain-containing protein |
|
TraesCS6A02G086500 |
2 |
DUF4220 domain-containing protein |
|
TraesCS6B02G125100 |
2 |
F-box domain-containing protein |
|
TraesCS7A02G004100 |
2 |
Glutaredoxin domain-containing protein |
|
TraesCS1B02G032000 |
1 |
Protein kinase domain-containing protein |
|
TraesCS1B02G132500 |
1 |
NAB domain-containing protein |
|
TraesCS1B02G248700 |
1 |
Cytokinin dehydrogenase |
|
TraesCS1B02G465900 |
1 |
LRRNT_2 domain-containing protein |
Table 3List of non-synonymous SNPs based genes at 24H after the salt treatment, along with the number of non-synonymous SNPs.
Table 3
|
Gene Symbol |
The number of the nonsynonymous SNPs |
Description |
|
TraesCS6A02G063000 |
13 |
Potassium transporter |
|
TraesCS3D02G034300 |
12 |
LRRNT_2 domain-containing protein |
|
TraesCS1B02G022900 |
9 |
FHA domain-containing protein |
|
TraesCS7D02G142600 |
7 |
H(+)-exporting diphosphatase |
|
TraesCS2D02G026600 |
6 |
Protein kinase domain-containing protein |
|
TraesCS2B02G030600 |
5 |
CDT1 domain-containing protein |
|
TraesCS6A02G070600 |
5 |
Methenyltetrahydrofolate cyclohydrolase |
|
TraesCS7A02G004100 |
5 |
Glutaredoxin domain-containing protein |
|
TraesCS2D02G018100 |
4 |
Rx_N domain-containing protein |
|
TraesCS4A02G140700 |
4 |
Divinyl chlorophyllide a 8-vinyl- reductase, chloroplastic |
|
TraesCS7A02G000300 |
4 |
NAC domain-containing protein |
|
TraesCS1B02G008700 |
3 |
Protein kinase domain-containing protein |
|
TraesCS1B02G008800 |
3 |
LRRNT_2 domain-containing protein |
|
TraesCS1D02G019300 |
3 |
WAT1-related protein |
|
TraesCS2A02G138500 |
3 |
Glycosyltransferase |
|
TraesCS2B02G094000 |
3 |
Dof-type domain-containing protein |
|
TraesCS3A02G016200 |
3 |
Protein kinase domain-containing protein |
|
TraesCS4A02G053900 |
3 |
PPR_long domain-containing protein |
|
TraesCS5A02G326300 |
3 |
Protein DETOXIFICATION |
|
TraesCS7A02G145100 |
3 |
Protein kinase domain-containing protein |
|
TraesCS2A02G017200 |
2 |
Ubiquitin-like domain-containing protein |
|
TraesCS2D02G210400 |
2 |
Genome assembly, chromosome: II |
|
TraesCS3A02G026700 |
2 |
Peroxin-14 |
|
TraesCS3B02G293700 |
2 |
AB hydrolase-1 domain-containing protein |
|
TraesCS3D02G026400 |
2 |
Fructose-bisphosphate aldolase |
|
TraesCS4A02G073000 |
2 |
BZIP domain-containing protein |
|
TraesCS5A02G241900 |
2 |
Abhydrolase_3 domain-containing protein |
|
TraesCS6B02G125100 |
2 |
F-box domain-containing protein |
|
TraesCS1A02G001900 |
1 |
Peroxin-14 |
|
TraesCS1B02G020700 |
1 |
Protein kinase domain-containing protein |
|
TraesCS1B02G032000 |
1 |
Protein kinase domain-containing protein |
Table 4List of non-synonymous SNPs based genes at 48H after the salt treatment, along with the number of non-synonymous SNPs.
Table 4
|
Gene Symbol |
The number of the nonsynonymous SNPs |
Description |
|
TraesCS6A02G063000 |
14 |
Potassium transporter |
|
TraesCS1B02G022900 |
9 |
FHA domain-containing protein |
|
TraesCS2D02G026600 |
6 |
Protein kinase domain-containing protein |
|
TraesCS3D02G034300 |
6 |
LRRNT_2 domain-containing protein |
|
TraesCS7D02G142600 |
6 |
H(+)-exporting diphosphatase |
|
TraesCS1B02G220900 |
5 |
C2 NT-type domain-containing protein |
|
TraesCS1B02G008700 |
4 |
Protein kinase domain-containing protein |
|
TraesCS2B02G044700 |
4 |
AAA domain-containing protein |
|
TraesCS6A02G083500 |
4 |
F-box domain-containing protein |
|
TraesCS7A02G000300 |
4 |
NAC domain-containing protein |
|
TraesCS7A02G003000 |
4 |
PA domain-containing protein |
|
TraesCS2B02G094000 |
3 |
Dof-type domain-containing protein |
|
TraesCS5A02G326300 |
3 |
Protein DETOXIFICATION |
|
TraesCS6A02G070600 |
3 |
Methenyltetrahydrofolate cyclohydrolase |
|
TraesCS1D02G030900 |
2 |
GRAS domain-containing protein |
|
TraesCS3B02G293700 |
2 |
AB hydrolase-1 domain-containing protein |
|
TraesCS3D02G026400 |
2 |
Fructose-bisphosphate aldolase |
|
TraesCS4A02G073000 |
2 |
BZIP domain-containing protein |
|
TraesCS4A02G140700 |
2 |
Divinyl chlorophyllide a 8-vinyl- reductase, chloroplastic |
|
TraesCS5A02G241900 |
2 |
Abhydrolase_3 domain-containing protein |
|
TraesCS5A02G309300 |
2 |
TCP domain-containing protein |
|
TraesCS6B02G125100 |
2 |
F-box domain-containing protein |
|
TraesCS1B02G032000 |
1 |
Protein kinase domain-containing protein |
|
TraesCS1D02G451900 |
1 |
UDP-glucose 4-epimerase |
|
TraesCS2D02G081800 |
1 |
Genome assembly, chromosome: II |
|
TraesCS2D02G368100 |
1 |
Dus domain-containing protein |
|
TraesCS4A02G003900 |
1 |
TF-B3 domain-containing protein |
|
TraesCS4D02G357800 |
1 |
Protein-serine/threonine phosphatase |
|
TraesCS5A02G095500 |
1 |
Glutaredoxin domain-containing protein |
|
TraesCS5A02G314300 |
1 |
PORR domain-containing protein |
Table 5List of genes at 00H after the salt treatment along with the Ka/Ks ratio (Ka/Ks>1).
Table 5
|
Gene Symbol |
Ka/Ks ratio |
Description |
|
TraesCS5A02G326300 |
60 |
Protein DETOXIFICATION |
|
TraesCS1A02G001900 |
40 |
Peroxisomal membrane protein PEX14-like |
|
TraesCS4A02G073000 |
32 |
bZIP transcription factor 16 |
|
TraesCS1B02G008700 |
20 |
MDIS1-interacting receptor like kinase 2 |
|
TraesCS3A02G284800 |
16 |
Ultraviolet-B receptor UVR8 |
|
TraesCS7D02G134300 |
16 |
LRR receptor kinase SERK2-like |
|
TraesCS7A02G015300 |
12 |
Cysteine-rich receptor-like protein kinase 27 |
|
TraesCS1A02G001000 |
10 |
Harbinger transposase-derived nuclease domain |
|
TraesCS1A02G061200 |
8 |
Harbinger transposase-derived nuclease domain |
|
TraesCS1A02G218900 |
8 |
Putative dual specificity protein phosphatase DSP8 |
|
TraesCS2B02G213700 |
8 |
BTB/POZ domain-containing protein |
|
TraesCS2D02G368100 |
8 |
tRNA-dihydrouridine(20) synthase |
|
TraesCS5D02G367600 |
8 |
cleavage and polyadenylation specificity factor subunit 3-I |
|
TraesCS6A02G067100 |
8 |
Histone deacetylase complex subunit SAP18 |
|
TraesCS6B02G125100 |
8 |
F-box/LRR-repeat protein 14 |
|
TraesCS7D02G412900 |
6 |
Zinc transporter |
|
TraesCS6A02G056500 |
6 |
Protein NRT1/ PTR FAMILY 8.3 |
|
TraesCS5B02G351900 |
6 |
Peptidase S1, PA clan |
|
TraesCS2D02G018000 |
6 |
Pectate lyase |
|
TraesCS1A02G035000 |
6 |
Nuclear pore complex protein NUP43 |
Table 6List of genes at 24H after the salt treatment along with the Ka/Ks ratio (Ka/Ks>1).
Table 6
|
Gene Symbol |
Ka/Ks ratio |
Description |
|
TraesCS5A02G326300 |
60 |
Protein DETOXIFICATION |
|
TraesCS7A02G145100 |
48 |
Protein kinase domain |
|
TraesCS4A02G073000 |
32 |
bZIP transcription factor 16 |
|
TraesCS1B02G008700 |
24 |
MDIS1-interacting receptor like kinase 2 |
|
TraesCS3A02G284800 |
20 |
Ultraviolet-B receptor UVR8 |
|
TraesCS6B02G136900 |
16 |
Rhamnogalacturonate lyase |
|
TraesCS7D02G134300 |
16 |
LRR receptor kinase SERK2-like |
|
TraesCS6B02G124500 |
12 |
BRCT domain-containing protein |
|
TraesCS7A02G015300 |
11 |
Cysteine-rich receptor-like protein kinase 27 |
|
TraesCS1A02G001900 |
10 |
Peroxisomal membrane protein PEX14-like |
|
TraesCS1A02G061200 |
8 |
Harbinger transposase-derived nuclease domain |
|
TraesCS1A02G218900 |
8 |
Putative dual specificity protein phosphatase DSP8 |
|
TraesCS2B02G213700 |
8 |
BTB/POZ domain-containing protein |
|
TraesCS2D02G368100 |
8 |
tRNA-dihydrouridine (20) synthase |
|
TraesCS4A02G102700 |
8 |
DNA (cytosine-5)-methyltransferase CMT2-like |
|
TraesCS4A02G154100 |
8 |
Pumilio homolog 12 |
|
TraesCS5D02G367600 |
8 |
Cleavage and polyadenylation specificity factor subunit 3-I |
|
TraesCS6D02G229300 |
8 |
BEACH domain-containing protein C2 |
|
TraesCS1A02G035000 |
7 |
Nuclear pore complex protein NUP43 |
|
TraesCS6B02G125100 |
7 |
F-box/LRR-repeat protein 14 |
Table 7List of genes at 48H after the salt treatment along with the Ka/Ks ratio (Ka/Ks>1).
Table 7
|
Gene symbol |
Ka/Ks ratio |
Description |
|
TraesCS5A02G326300 |
60 |
Protein DETOXIFICATION |
|
TraesCS4A02G073000 |
32 |
bZIP transcription factor 16 |
|
TraesCS1B02G008700 |
28 |
MDIS1-interacting receptor like kinase 2 |
|
TraesCS3A02G284800 |
24 |
Ultraviolet-B receptor UVR8 |
|
TraesCS6D02G229300 |
24 |
BEACH domain-containing protein C2 |
|
TraesCS7A02G000300 |
16 |
NAC domain-containing protein 7 |
|
TraesCS7D02G134300 |
16 |
LRR receptor kinase SERK2-like |
|
TraesCS2B02G338300 |
12 |
Synaptonemal complex protein ZEP1 |
|
TraesCS4D02G357800 |
12 |
Protein phosphatase 2C |
|
TraesCS1A02G035000 |
8 |
Nuclear pore complex protein NUP43 |
|
TraesCS1A02G061200 |
8 |
Harbinger transposase-derived nuclease domain |
|
TraesCS1A02G218900 |
8 |
Putative dual specificity protein phosphatase DSP8 |
|
TraesCS2D02G161900 |
8 |
RNA-binding protein CP29B, chloroplastic |
|
TraesCS2D02G368100 |
8 |
tRNA-dihydrouridine (20) synthase |
|
TraesCS5A02G309300 |
8 |
Harbinger transposase-derived nuclease domain |
|
TraesCS5B02G226500 |
8 |
Microtubule-associated protein futsch |
|
TraesCS5D02G367600 |
8 |
Cleavage and polyadenylation specificity factor subunit 3-I |
|
TraesCS6B02G125100 |
8 |
F-box/LRR-repeat protein 14 |
|
TraesCS7B02G030600 |
8 |
Protein DETOXIFICATION |
|
TraesCS7A02G015300 |
6 |
Cysteine-rich receptor-like protein kinase 27 |
References
- Adiku S, Renger M, Wessolek G, Facklam M, Hecht-Bucholtz C. 2001. Simulation of the dry matter production and seed yield of common beans under varying soil water and salinity conditions. Agric Water Manag. 47(1): 55-68.
- Ahmad P, Prasad MNV. 2011. Abiotic stress responses in plants: metabolism, productivity and sustainability: Springer Science & Business Media.
- Almeida DM, Oliveira MM, Saibo NJ. 2017. Regulation of Na+ and K+ homeostasis in plants: towards improved salt stress tolerance in crop plants. Genet Mol Biol. 40(1 suppl 1): 326-345.
- Amirbakhtiar N, Ismaili A, Ghaffari M-R, Mirdar Mansuri R, Sanjari S, Shobbar Z-S. 2021. Transcriptome analysis of bread wheat leaves in response to salt stress. PLoS One. 16(7): e0254189.
- Bioinformatics, B. (2011). FastQC: a quality control tool for high throughput sequence data.
- Arif Y, Singh P, Siddiqui H, Bajguz A, Hayat S. 2020. Salinity induced physiological and biochemical changes in plants: An omic approach towards salt stress tolerance. Plant Physiol Biochem. 156: 64-77.
- Armstrong DL, Griffin K, Danner M. 1998. Better crops with plant food. Better Crops with Plant Food..
- Ashraf M, Akram NA. 2009. Improving salinity tolerance of plants through conventional breeding and genetic engineering: an analytical comparison. Biotechnol Adv. 27(6): 744-752.
- Ashraf M, Wu L. 1994. Breeding for salinity tolerance in plants. Crit Rev Plant Sci. 13(1): 17-42.
- Assaha DV, Ueda A, Saneoka H, Al-Yahyai R, Yaish MW. 2017. The role of Na+ and K+ transporters in salt stress adaptation in glycophytes. Front Physiol. 8: 509
- Barragan V, Leidi EO, Andres Z, Rubio L, De Luca A, Fernandez JA, et al. 2012. Ion exchangers NHX1 and NHX2 mediate active potassium uptake into vacuoles to regulate cell turgor and stomatal function in Arabidopsis. Plant Cell. 24(3): 1127-1142.
- Bhardwaj A, Dhar YV, Asif MH, Bag SK. 2016. In silico identification of SNP diversity in cultivated and wild tomato species: insight from molecular simulations. Sci Rep. 6(1): 38715
- Brenchley R, Spannagl M, Pfeifer M, Barker GL, D'Amore R, Allen AM, et al. 2012. Analysis of the bread wheat genome using whole-genome shotgun sequencing. Nature. 491(7426): 705-710.
- Cericola F, Jahoor A, Orabi J, Andersen JR, Janss LL, Jensen J. 2017. Optimizing training population size and genotyping strategy for genomic prediction using association study results and pedigree information. A case of study in advanced wheat breeding lines. PloS One. 12(1): e0169606.
- Chen G, Zou Y, Hu J, Ding Y. 2018. Genome-wide analysis of the rice PPR gene family and their expression profiles under different stress treatments. BMC Genomics. 19: 1-14.
- Cheng CY, Krishnakumar V, Chan AP, Schobel S, Town CD. Thibaud‐Nissen F2017. Araport11: a complete reannotation of the Arabidopsis thaliana reference genome. Plant J. 89(4): 789-804.
- Cooper HD, Hodgkin T, Spillane C. 2001. Broadening the genetic base of crops: an overview. pp. 1-23. In: HD Cooper, C Spillane, T Hodgkin (eds.). Broadening the genetic base of crop production. CABI Publishing. Wallingford:
- Cuartero J, Gomez-Guillamon M, Romero-Aranda R, Reina-Sanchez A, Caro M, Perez-Alfocea F, et al. 2003. Effects of salinity on tomato crop-approaches to reduce deleterious effects. pp. 85-113. In: A Läuchli, U Lüttge (eds.). Salinity: Environment - Plants - Molecules. Kluwer Academic Publishers. Dordrecht.
- Desa U. 2018. United Nations, Department of Economic and Social Affairs, Population Division. World Population Prospects 2018 (Online Edition. Rev 1). United Nations. New York..
- Dobin A, Davis CA, Schlesinger F, Drenkow J, Zaleski C, Jha S, et al. 2013. STAR: ultrafast universal RNA-seq aligner. Bioinformatics. 29(1): 15-21.
- Donovan J, Rutsaert P, Spielman D, Shikuku KM, Demont M. 2021. Seed value chain development in the Global South: Key issues and new directions for public breeding programs. Outlook Agric. 50(4): 366-377.
- Epstein E. 1977. Adaptation of crops to salinity. pp. 71-82. In: International Potash Institute (eds.). Physiological Aspects of Crop Productivity. International Potash Institute. Bern.
- Feng G, Zhang F, Li X, Tian C, Tang C, Rengel Z. 2002. Improved tolerance of maize plants to salt stress by arbuscular mycorrhiza is related to higher accumulation of soluble sugars in roots. Mycorrhiza. 12: 185-190.
- Food, Trade AOotUN, Division M.2014. Food Outlook: Biannual Report on Global Food Markets. October 2014: Food and Agriculture Organization of the United Nations.
- Gallagher JL. Pasternak D, San Pietro A, 1985. Halophytic crops for cultivation at seawater salinity. editors. Biosalinity in Action: Bioproduction with Saline Water. Martinus Nijhoff Publishers. Dordrecht: pp. 323-336.
- Gao L, Turner MK, Chao S, Kolmer J, Anderson JA. 2016. Genome wide association study of seedling and adult plant leaf rust resistance in elite spring wheat breeding lines. PLoS One. 11(2): e0148671.
- Glenn EP, O'Leary JW. 1985. Productivity and irrigation requirements of halophytes grown with seawater in the Sonoran Desert. J Arid Environ. 9(1): 81-91.
- Gordon A, Hannon G. 2014. FASTX-Toolkit. Hannon Lab. Cold Spring Harbor Laboratory. Available online: http://hannonlab.cshl.edu/fastx_toolkit/.
- Gupta R, Meghwal M, Prabhakar PK. 2021. Bioactive compounds of pigmented wheat (Triticum aestivum): Potential benefits in human health. Trends in food science & technology. 110: 240-252.
- Halliwell B. 2006. Reactive species and antioxidants. Redox biology is a fundamental theme of aerobic life. Plant Physiol. 141(2): 312-322.
- Hasegawa PM, Bressan RA, Zhu J-K, Bohnert HJ. 2000. Plant cellular and molecular responses to high salinity. Annual review of plant biology. 51(1): 463-499.
- Hu T, Banzhaf W. 2008. "Nonsynonymous to Synonymous Substitution Ratio: Measurement for Rate of Evolution in Evolutionary Computation. " Presented at International conference on parallel problem solving from nature..
- Hussein SO, Kovács F, Tobak Z. 2017. Spatiotemporal assessment of vegetation indices and land cover for Erbil city and its surrounding using MODIS imageries. J Environ Geogr. 10(1-2): 31-39..
- Jahromi F, Aroca R, Porcel R, Ruiz-Lozano JM. 2008. Influence of salinity on the in vitro development of Glomus intraradices and on the in vivo physiological and molecular responses of mycorrhizal lettuce plants. Microb Ecol. 55: 45-53.
- Juniper S, Abbott L. 1993. Vesicular-arbuscular mycorrhizas and soil salinity. Mycorrhiza. 4: 45-57.
- Keesstra SD, Geissen V, Mosse K, Piiranen S, Scudiero E, Leistra M, et al. 2012. Soil as a filter for groundwater quality. Curr Opin Environ Sustain. 4(5): 507-516.
- Kromdijk J, Long SP. 2016. One crop breeding cycle from starvation? How engineering crop photosynthesis for rising CO2 and temperature could be one important route to alleviation. Proceedings of the Royal Society B: Biological Sciences. 283(1826): 20152578.
- Mahajan MM, Goyal E, Singh AK, Gaikwad K, Kanika K. 2017. Transcriptome dynamics provide insights into long-term salinity stress tolerance in Triticum aestivum cv. Kharchia Local. Plant Physiol Biochem. 121: 128-139.
- Mao K, Dong Q, Li C, Liu C, Ma F. 2017. Genome wide identification and characterization of apple bHLH transcription factors and expression analysis in response to drought and salt stress. Front Plant Sci. 8: 480
- Marschner H. 1995. Mineral nutrition of higher plants (2nd ed). Institute of Plant Nutrition University of Hohenheim: Germany..
- Matsuoka Y. 2011. Evolution of polyploid Triticum wheats under cultivation: the role of domestication, natural hybridization and allopolyploid speciation in their diversification. Plant Cell Physiol. 52(5): 750-764.
- McMullen MD, Kresovich S, Villeda HS, Bradbury P, Li H, Sun Q, et al. 2009. Genetic properties of the maize nested association mapping population. Science. 325(5941): 737-740.
- Meng C, Quan T-Y, Li Z-Y, Cui K-L, Yan L, Liang Y, et al. 2017. Transcriptome profiling reveals the genetic basis of alkalinity tolerance in wheat. BMC Genomics. 18: 1-14.
- Morgil H, Gercek YC, Tulum I. 2020. Single nucleotide polymorphisms (SNPs) in plant genetics and breeding. In: A Yildiz (ed.). Recent Topics in Genetic Polymorphisms. IntechOpen. London:
- Munns R. 2005. Genes and salt tolerance: bringing them together. New Phytol. 167(3): 645-663.
- Munns R, Tester M. 2008. Mechanisms of salinity tolerance. Annu Rev Plant Biol. 59(1): 651-681.
- Okoniewski MJ, Miller CJ. 2006. Hybridization interactions between probesets in short oligo microarrays lead to spurious correlations. BMC Bioinformatics. 7: 1-14.
- Oyiga BC, Sharma RC, Baum M, Ogbonnaya FC, Léon J, Ballvora A. 2018. Allelic variations and differential expressions detected at quantitative trait loci for salt stress tolerance in wheat. Plant Cell Environ. 41(5): 919-935.
- Panahi B, Frahadian M, Dums JT, Hejazi MA. 2019. Integration of cross species RNA-Seq meta-analysis and machine-learning models identifies the most important salt stress-responsive pathways in microalga Dunaliella. Front Genet. 10: 752
- Pardo JM. 2010. Biotechnology of water and salinity stress tolerance. Curr Opin Biotechnol. 21(2): 185-196.
- Piot A, Prunier J, Isabel N, Klápště J, El-Kassaby YA, Villarreal Aguilar JC, et al. 2020. Genomic diversity evaluation of Populus trichocarpa germplasm for rare variant genetic association studies. Front Genet. 10: 1384
- Qi Y, Liu W, Qiu L, Zhang S, Ma L, Zhang H. 2010. Overexpression of glutathione S-transferase gene increases salt tolerance of Arabidopsis. Russ J Plant Physiol. 57: 233-240.
- Raherison E, Majidi MM, Goessen R, Hughes N, Cuthbert R, Knox R, et al. 2020. Evidence for the accumulation of nonsynonymous mutations and favorable pleiotropic alleles during wheat breeding. G3: Genes, Genomes, Genetics. 10(11): 4001-4011.
- Rasheed A, Xia X. 2019. From markers to genome-based breeding in wheat. Theor Appl Genet. 132: 767-784.
- Roberts A, Trapnell C, Donaghey J, Rinn JL, Pachter L. 2011. Improving RNA-Seq expression estimates by correcting for fragment bias. Genome Biol. 12: 1-14.
- Roth C, Liberles DA. 2006a. A systematic search for positive selection in higher plants (Embryophytes). BMC Plant Biol. 6(1): 1-11.
- Roy SJ, Negrão S, Tester M. 2014. Salt resistant crop plants. Curr Opin Biotechnol. 26: 115-124.
- Royce TE, Rozowsky JS, Gerstein MB. 2007. Toward a universal microarray: prediction of gene expression through nearest-neighbor probe sequence identification. Nucleic Acids Res. 35(15): e99
- Sanan-Mishra N, Pham XH, Sopory SK, Tuteja N. 2005. Pea DNA helicase 45 overexpression in tobacco confers high salinity tolerance without affecting yield. Proceedings of the National Academy of Sciences of the United States of America. 102(2): 509-514.
- Shabala S, Pottosin I. 2014. Regulation of potassium transport in plants under hostile conditions: implications for abiotic and biotic stress tolerance. Physiol Plant. 151(3): 257-279.
- Shanker A, Venkateswarlu B. 2011. Abiotic stress in plants: mechanisms and adaptations. BoD-Books on Demand. Norderstedt:
- Shannon M. Pasternak D, San Pietro A, 1985. Principles and strategies in breeding for higher salt tolerance. editors. Biosalinity in Action: Bioproduction with Saline Water. Martinus Nijhoff Publishers. Dordrecht: pp. 227-241.
- Shu Q, Forster B, Nakagawa H, Nakagawa H. 2012. Plant mutation breeding and biotechnology, CABI. Plant Breeding and Genetics Section. Joint FAO/IAEA Division of Nuclear Techniques in Food and Agriculture. International Atomic Energy Agency. Vienna, Austria: ISBN: 978-2.
- Sourdille P, Singh S, Cadalen T, Brown-Guedira GL, Gay G, Qi L, et al. 2004. Microsatellite-based deletion bin system for the establishment of genetic-physical map relationships in wheat (Triticum aestivum L.). Funct Integr Genomics. 4: 12-25.
- Surekha C, Kumari KN, Aruna L, Suneetha G, Arundhati A, Kavi Kishor P. 2014. Expression of the Vigna aconitifolia P5CSF129A gene in transgenic pigeonpea enhances proline accumulation and salt tolerance. Plant Cell Tissue Organ Cult. 116(1): 27-36.
- Tang W, Peng X, Newton RJ. 2005. Enhanced tolerance to salt stress in transgenic loblolly pine simultaneously expressing two genes encoding mannitol-1-phosphate dehydrogenase and glucitol-6-phosphate dehydrogenase. Plant Physiol Biochem. 43(2): 139-146.
- Tetteh RN. 2015. Chemical soil degradation as a result of contamination: A review. J Soil Sci Environ Manage. 6(11): 301-308.
- Trapnell C, Pachter L, Salzberg SL. 2009. TopHat: discovering splice junctions with RNA-Seq. Bioinformatics. 25(9): 1105-1111.
- Trapnell C, Roberts A, Goff L, Pertea G, Kim D, Kelley DR, et al. 2012. Differential gene and transcript expression analysis of RNA-seq experiments with TopHat and Cufflinks. Nat Protoc. 7(3): 562-578.
- Tuteja N. 2007. Mechanisms of high salinity tolerance in plants. Methods Enzymol. 428: 419-438.
- Ulukapi K, Nasircilar AG. 2015. "Developments of gamma ray application on mutation breeding studies in recent years.". Presented at International conference on advances in agricultural, biological & environmental sciences.
- Van Dijk M, Morley T, Rau ML, Saghai Y. 2021. A meta-analysis of projected global food demand and population at risk of hunger for the period 2010-2050. Nat Food. 2(7): 494-501.
- Velmurugan A, Swarnam P, Subramani T, Meena B, Kaledhonkar M. 2020. Water demand and salinity. Chapter 10 In: A Bódalo, E Gómez (eds.). Desalination-challenges and opportunities. IntechOpen. London:
- Wang D, Lu X, Chen X, Wang S, Wang J, Guo L, et al. 2020. Temporal salt stress-induced transcriptome alterations and regulatory mechanisms revealed by PacBio long-reads RNA sequencing in Gossypium hirsutum. BMC Genomics. 21: 1-15.
- Wang L, Liang W, Xing J, Tan F, Chen Y, Huang L, et al. 2013. Dynamics of chloroplast proteome in salt-stressed mangrove Kandelia candel (L.) Druce. J Proteome Res. 12(11): 5124-5136.
- Wang Z, Gerstein M, Snyder M. 2009. RNA-Seq: a revolutionary tool for transcriptomics. Nature reviews genetics. 10(1): 57-63.
- Wei-Feng X, Wei-Ming S, Ueda A, Takabe T. 2008. Mechanisms of salt tolerance in transgenic Arabidopsis thaliana carrying a peroxisomal ascorbate peroxidase gene from barley. Pedosphere. 18(4): 486-495.
- Wu B, Hu Y, Huo P, Zhang Q, Chen X, Zhang Z. 2017. Transcriptome analysis of hexaploid hulless oat in response to salinity stress. PloS One. 12(2): e0171451
- Wu P, Xie J, Hu J, Qiu D, Liu Z, Li J, et al. 2018. Development of molecular markers linked to powdery mildew resistance gene Pm4b by combining SNP discovery from transcriptome sequencing data with bulked segregant analysis (BSR-Seq) in wheat. Front Plant Sci. 9: 95
- Wu Y-Y, Chen Q-J, Chen M, Chen J, Wang X-C. 2005. Salt-tolerant transgenic perennial ryegrass (Lolium perenne L.) obtained by Agrobacterium tumefaciens-mediated transformation of the vacuolar Na+/H+ antiporter gene. Plant Science. 169(1): 65-73.
- Xie Q, Niu J, Xu X, Xu L, Zhang Y, Fan B, et al. 2015. De novo assembly of the Japanese lawngrass (Zoysia japonica Steud.) root transcriptome and identification of candidate unigenes related to early responses under salt stress. Front Plant Sci. 6: 610
- Xiong H, Guo H, Xie Y, Zhao L, Gu J, Zhao S, et al. 2017. RNAseq analysis reveals pathways and candidate genes associated with salinity tolerance in a spaceflight-induced wheat mutant. Sci Rep. 7(1): 2731
- Xu P, Wu X, Luo J, Wang B, Liu Y, Ehlers JD, et al. 2011. Partial sequencing of the bottle gourd genome reveals markers useful for phylogenetic analysis and breeding. BMC genomics. 12: 1-10.
- Yargholi B, Azarneshan S. 2014. Long-term effects of pesticides and chemical fertilizers usage on some soil properties and accumulation of heavy metals in the soil (case study of Moghan plain's (Iran) irrigation and drainage network). Int J Agric Sci. 7(8): 518.
- You Z, Zhang Q, Peng Z, Miao X. 2019. Lipid droplets mediate salt stress tolerance in Parachlorella kessleri. Plant Physiol. 181(2): 510-526.
- Younis A, Ramzan F, Ramzan Y, Zulfiqar F, Ahsan M, Lim KB. 2020. Molecular markers improve abiotic stress tolerance in crops: a review. Plants. 9(10): 1374
- Yu J, Wang J, Lin W, Li S, Li H, Zhou J, et al. 2005. The genomes of Oryza sativa: a history of duplications. PLoS biology. 3(2): e38.
- Zang Q-W, Wang C-X, Li X-Y, Guo Z-A, Jing R-L, Zhao J, et al. 2010. Isolation and characterization of a gene encoding a polyethylene glycol-induced cysteine protease in common wheat. J Biosci. 35: 379-388.
- Zhang H-X, Blumwald E. 2001. Transgenic salt-tolerant tomato plants accumulate salt in foliage but not in fruit. Nat Biotechnol. 19(8): 765-768.
- Zhu J-K. 2001. Plant salt tolerance. Trends in plant science. 6(2): 66-71.
- Zhu J-K. 2003. Regulation of ion homeostasis under salt stress. Curr Opin Plant Biol. 6(5): 441-445.
- Zörb C, Geilfus CM, Dietz KJ. 2019. Salinity and crop yield. Plant biology. 21: 31-38.