Abstract
Quantitative trait locus (QTL) analysis is a powerful approach for identifying variants associated with the phenotypic variation of complex traits. However, selecting optimal methods and pre-processing steps require considerable time and effort. In this study, we demonstrated applicability and replicability of machine learning (ML) models in QTL analysis by evaluating their performance in comparison with conventional QTL analysis methods using 142 recombinant inbred lines derived from two japonica rice cultivars, Koshihikari and Baegilmi. Random forest and gradient boosting models showed the highest predictive accuracy, and consistently identified three QTLs associated with heading date: qDTH3, qDTH6, and qDTH7. Moreover, ML-based QTL analysis detected minor-effect qDTH10, where Koshihikari allele promoted heading date when combined with Koshihikari alleles of qDTH6 and qDTH7. These results demonstrate the applicability of ML models in QTL analysis on bi-parental mapping population in rice.
-
Key words: Machine learning, QTL, Rice, Heading date
Introduction
Rice is a staple crop that provides the primary source of calorie intake for more than half of the world's population (
Muthayya et al. 2014). One of the key factors contributing to rice productivity is heading date, as it determines the seasonal and regional adaptability of the crop (
Izawa 2007). The wide variation in heading date is controlled by numerous quantitative trait loci (QTL), and continuous efforts have been made to understand and utilize their underlying genetic mechanisms (
Matsubara et al. 2018). QTL mapping is a common approach used to identify QTL based on the co-segregation of traits and genetic variants, typically derived from bi-parental F
2 populations or recombinant inbred lines (
McCough et al. 1995). However, while bi-parental QTL mapping is particularly effective for detecting major-effect QTLs, it may lack sufficient power to identify minor-effect QTLs. Additionally, limited cross-validation can reduce the robustness of the results, as the identified QTL may not be consistent across different genetic backgrounds.
Artificial intelligence (AI) refers to the development of computer systems capable of performing tasks such as learning, reasoning, problem-solving, and decision-making (
Ertel 2024). Machine learning (ML), a subset of AI, focuses on developing algorithms that enable prediction or decision-making by training on data without explicit programming (
Jordan et al. 2015). A particular focus of ML implementation has been on large data set, such as those used in phenotyping for genome-wide association study, or in analyzing genomic variants associated with specific traits. This approach has been studied in crops such as soybean (
Yoosefzadeh-Najafabadi et al. 2021), sorghum (
Ferguson et al. 2021), maize (
Yan et al. 2023), and wheat (
Tsai et al. 2020). Moreover, few studies have applied ML to bi-parental population for detecting QTLs associated with traits to enhance precision mapping in barely (
Bedo et al. 2008) and integrating ensemble learning approach on QTL analysis in maize (
Bian et al. 2015). However, the application of ML models for detecting QTLs in rice, particularly using bi-parental population and comparing them with conventional QTL mapping methods remain limited.
ML algorithms have gained considerable attention in plant breeding due to their capacity to model complex and non-linear relationship between genotypic and phenotypic data. Random forest (RF) and gradient boosting (GB) are ensemble learning methods based on decision trees, well-suited for capturing high-order interactions among variables (
Heslot et al. 2012). Extreme gradient boosting (XGB) is an advanced implementation of GB that incorporates regularization and parallelization to enhance predictive performance (
Chen et al. 2016). The k-nearest neighbors (KNN) algorithm is a non-parametric methods effective in capturing local data structures (
Peterson 2009), while support vector regression (SVR) is widely applied to address regression tasks involving high-dimensional input spaces (
Drucker et al. 1996). Integrating these diverse algorithms enables comprehensive exploration of genotype-phenotype associations and supports more accurate selection decisions in crop improvement programs.
Previously, we performed QTL analysis on rice heading date and identified three major heading QTLs using conventional QTL mapping methods (
Lee et al. 2024). In this study, we applied several ML algorithms to the existing data, evaluated best-performing ML model, and calculated feature importance to assess the replicability of ML models in detecting significant QTLs associated with heading date. Moreover, we identified minor-QTL using the ML models and examined the allelic combination of identified QTLs, providing insights into the fine-tuning of heading date for rice breeding programs.
Materials and Methods
Plant materials
A total of 142 recombinant inbred lines (RILs) derived from a cross between two
japonica rice varieties, Koshihikari and Baegilmi, previously described by (
Lee et al. 2024), were used in this study. All plant materials were cultivated in the experimental field of the National Institute of Crop and Food Science (NICS), in Wanju, South Korea, and managed according to the standard rice cultivation methods of NICS (
RDA 2012).
All phenotypic and genotypic data were obtained from the previous study (
Lee et al. 2024). A three-year trial of days to heading (DTH) values was used to calculate the best linear unbiased prediction (BLUP) for each RIL by fitting multi-year phenotypic data into a linear mixed model using the 'lme' package (
Bates 2014) in R. For genotypic data, a total of 128 high-quality single nucleotide polymorphisms (SNPs) were used for quantitative trait locus (QTL) analysis. For machine learning (ML) models, the genotypic data were encoded as follows: Koshihikari allele as 2, Baegilmi allele as 0, heterozygous as 1, and missing values as NA.
A linkage map spanning 1,293 cM was constructed using 128 SNPs from 142 RILs (
Mo et al. 2020). QTL analysis was conducted using QTL IciMapping 4.2 (
Meng et al. 2015). The Kosambi mapping function was applied to calculate recombination distances. Inclusive composite interval mapping of additive (ICIM-ADD) and single marker analysis (SMA) were used to detect QTLs with default parameters. Based on 1,000 permutation tests at
p=0.05, the calculated logarithm of odds (LOD) thresholds for ICIM-ADD and SMA were 2.8 and 2.7, respectively.
All ML analyses were conducted using the Scikit-learn library v.0.24.2 in Python (
Pedregosa et al. 2011). To predict DTH, the model was trained using 128 SNPs from 142 RILs. To ensure the robustness of the dataset, leave-one-out cross-validation (LOOCV) was employed, where a single observation was left out as the validation set while the remaining data were used for training. This study implemented five ML models: tree-based models including random forest (RF), gradient boosting (GB), and extreme gradient boosting (XGB); the non-parametric K-nearest neighbors (KNN); and the linear model, support vector regression (SVR). The receiver operating characteristics (ROC) and regression analysis were conducted to assess the accuracy of each model. For the ROC, area under the curve (AUC) value closer to 1 indicates perfect classification performance. For regression, mean squared error (MSE) and the coefficient of determination (R
2) were calculated to analyze the absolute size of errors and the proportion of variance explained.
Feature importance provides insight into which feature have the most significant impact on the model's prediction. In this study, 124 markers were treated as individual features to identify specific SNP associated with DTH. Feature importance was computed using the model's built-in attribute. To assess statistical significance of the feature importance, a permutation-based approach was employed. Specifically, the phenotype data (days to heading) was randomly permuted 100 times while keeping the genotype data fixed. For each permutation, the model was retrained, and feature importance scores were recorded to generate a null distribution for each feature. The 95th percentile of each null distribution was then calculated to establish a significance threshold corresponding to α=0.05. Feature importance scores from the original model that exceeded their respective 95th percentile thresholds were considered statistically significant at p<0.05.
Results
Performances of machine learning models to predict days to heading
The AUC based on the ROC curve indicate that the calculated AUC values of the five ML models ranged from 0.74 to 0.79, indicating moderate to good classification performance (
Fig. 1(a) and Supplementary
Table 1). RF and SVR demonstrated the highest classification performance, closely followed by GB and XGB, while KNN showed the lowest performance among classifiers. To further validate the models' performance, regression analyses were conducted to assess their predictive accuracy. Among the models, RF achieved the best balance of predictive accuracy explaining 46% total variance, followed by GB at 45%. XGB, SVR, and KNN explained 36%, 20%, and 6% of the total variance, respectively (
Fig. 1(b) and Supplementary
Table 1). These results suggest that the RF and GB models demonstrated the highest accuracy power in predicting DTH among RILs, and will be utilized for further investigations.
Our previous study (
Lee et al. 2024) using the same RIL population, identified three stable heading date QTLs (
qDTH3,
qDTH6, and
qDTH7) that were consistently detected over three years and revealed that
Hd16,
Hd1, and
Ghd7 underlie these QTLs (
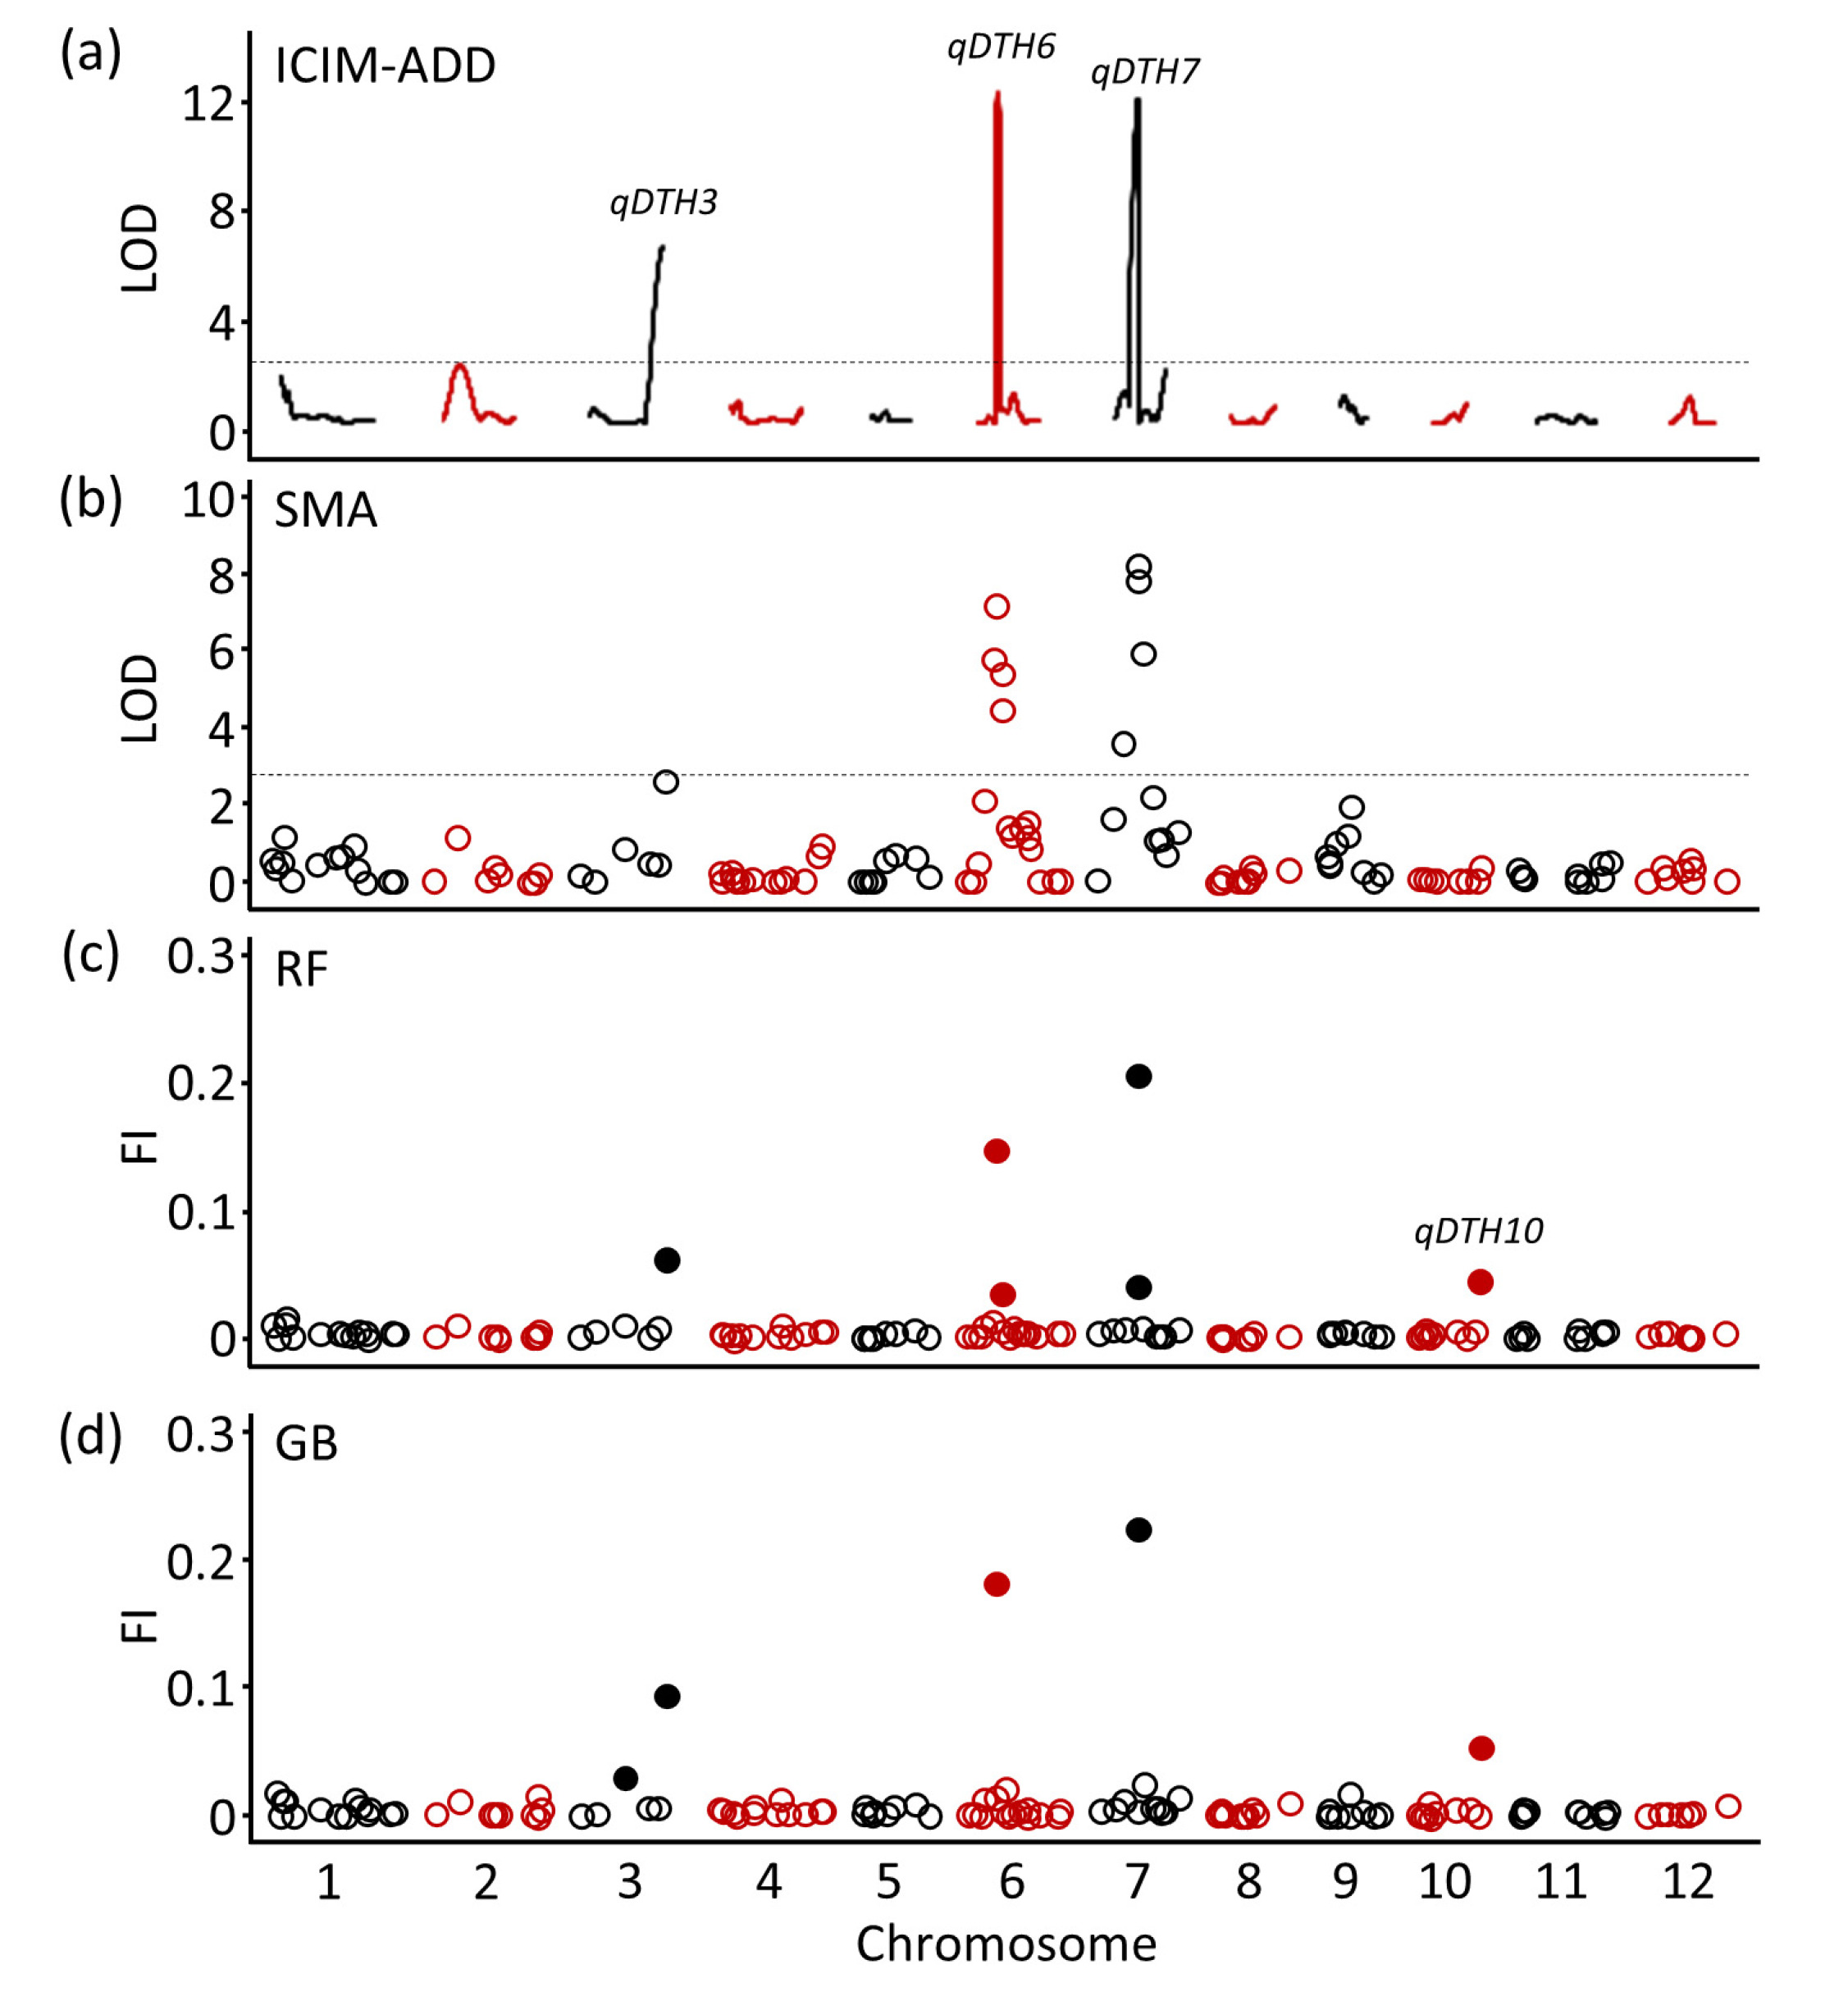
Mo et al. 2020). In this study, QTL analysis using BLUP values similarly detected
qDTH3,
qDTH6, and
qDTH7 on chromosomes 3, 6, and 7 using ICIM-ADD (
Fig. 2(a) and
Table 1) and SMA (
Fig. 2(b) and
Table 2). For QTL detection using ML models, the RF and GB models consistently identified
qDTH3 and
qDTH6 at the same position as ICIM-ADD and SMA, while
qDTH7 was consistent with SMA. The feature importance score for RF were 0.06, 0.15, and 0.21 for
qDTH3,
qDTH6, and
qDTH7 (
Fig. 2(c) and
Table 3), respectively, and for GB were 0.09, 0.18, and 0.22 (
Fig. 2(d) and
Table 3), respectively. Notably, a minor QTL,
qDTH10 was detected only by the ML models.
In the line with our previous study (
Lee et al. 2024;
Mo et al. 2020), our results also showed that the Koshihikari allele of
qDTH3 and Baegilmi alleles of
qDTH6 and
qDTH7 promoted heading date (
Fig. 3(a)). However, there was no significant difference in DTH between Koshihikari and Baegilmi alleles of
qDTH10. To further evaluate QTL interaction effect of
qDTH10, we observed that the QTL interaction between the Koshihikari alleles of
qDTH6 or
qDTH7 combined with the Koshihikari allele of
qDTH10 significantly promoted heading in the RIL population (
Fig. 3(b)).
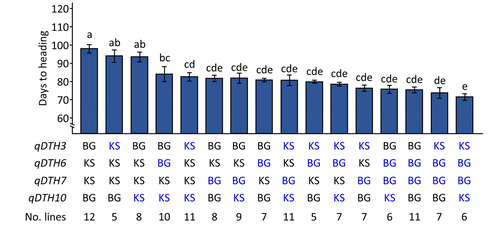
Our results indicate that the combination of
qDTH3BG+
qDTH6KS+
qDTH7KS+
qDTH10
BG exhibited the most delayed DTH (98.1 days) among the studied RIL population (
Fig. 4).
qDTH3BG and
qDTH10BG significantly promoted DTH by 3.9 days and 5.1 days, respectively. Moreover, allelic combination effect of
qDTH3KS+
qDTH10KS (-15.4 days) was greater than that of
qDTH6BG+
qDTH10KS (-13.8 days). Notably, no significant differences were observed among the combinations
qDTH7BG,
qDTH7BG+
qDTH10KS,
qDTH6BG,
qDTH3KS+
qDTH7BG+
qDTH10KS,
qDTH3KS+
qDTH6BG,
qDTH3KS+
qDTH6BG+
qDTH10KS,
qDTH3KS+
qDTH7BG, and
qDTH6BG+
qDTH7BG, with DTH reduction ranging from -21.8 days to -16.1 days. The combination of DTH-promoting alleles from all four QTLs led to a significant reduction in DTH by 26.1 days.
Discussion
QTL detection using ML models
The main objective of this study is to demonstrate the applicability of ML models in detecting significant QTLs associated with traits of interest. We developed and evaluated predictive models using various ML algorithms with genotypic and phenotypic data. Among the classification models, tree-based ensemble methods such as RF and GB demonstrated the highest predictive accuracy, as they are well-suited for categorical features without requiring extensive pre-processing (
Breiman 2001). In contrast, KNN and SVR were less effective for our data set, as they require specific pre-processing and proper scaling for categorical data (
Boriah et al. 2008;
García et al. 2015). ML algorithms evaluated in this study generally exhibited moderate predictive accuracy; nevertheless, they successfully identified significant QTLs consistent with those detected by conventional QTL mapping approaches, underscoring their practical utility in rice genetics. Numerous parametric and non-parametric models have been employed for genomic selection in rice, particularly for predicting flowering time. For instance, predictive abilities for flowering date among rice inbred lines have been reported to exhibit moderate accuracy, ranging from 0.35 to 0.60 (
Ben Hassen et al. 2018;
Isidro et al. 2015). Similarly, prediction accuracy for flowering time using RF ranged from 0.41 to 0.61 across dry and wet seasons in tropical environments (
Spindel et al. 2015). Efforts to improve predictive performance can be achieved through dimensionality reduction, which helps mitigate overfitting due to noise in the training data, and underfitting arising from overly simplified datasets. Furthermore, R
2 does not reliably capture the underlying non-linear interactions, therefore, it is essential to interpret R
2 values cautiously and to complement them with alternative performance metrics such as mean squared error or mean absolute error.
QTL detection using ML models produced results consistent with conventional QTL mapping methods, such as ICIM-ADD and SMA, in detecting
qDTH3 (S3_34851991) and
qDTH6 (S6_8634012). However, the region corresponding to
qDTH7 (S7_14589984) overlapped only with the QTL region identified by SMA. While the ICIM-ADD method offers precise localization of QTLs, ML models may not achieve the same level of positional accuracy as parametric methods. However, ICIM-ADD assumes an additive-dominance model, potentially limited to capture non-linear interactions (
Li et al. 2007). In contrast, ML models can detect non-linear effects and interactions, thereby providing an advantage in analyzing small effect QTLs (
Breiman 2001).
Consistent with previous study conducted using conventional QTL mapping methods (
Lee et al. 2024;
Mo et al. 2020), our ML models detected
qDTH3,
qDTH6, and
qDTH7, along with their underlying genes
Hd16 (
Hori et al. 2013),
Hd1 (
Yano et al. 2000), and
Ghd7 (
Xue et al. 2008), respectively. These QTLs exhibited significant variation between the Koshihikari and Baegilmi alleles. While the ML models also detected
qDTH10, no significant difference in DTH was observed between the Koshihikari and Baegilmi alleles. However, interactions between
qDTH10KS and either
qDTH6KS or
qDTH7KS significantly promoted DTH by 4.9 days and 5.2 days, respectively. These findings suggest that
qDTH10KS interacts with functional alleles of
Hd1 and
Ghd7. Moreover, allelic combinations of four QTLs indicated that
qDTH10KS exerts a DTH promoting effect when combined with the DTH promoting alleles of other three QTLs. Several cloned genes are located in the long-arm of chromosome 10, including
Early heading date 1 (
Ehd1) (
Doi et al. 2004),
Early heading date 2 (
Ehd2) (
Matsubara et al. 2008), and
Oryza sativa MADS56 (
OsMADS56) (
Ryu et al. 2009). Among them,
qDTH10 is positioned closest to
OsMADS56, a long-day repressor gene that encodes a MADS-box protein (
Ryu et al. 2009). Similar findings have been reported in investigations of minor-effect QTL using several segregating populations, revealing a
qHD10 in a similar genomic region (
Sun et al. 2018). The positional resolution of ML-based QTL identified from our bi-parental RIL population is limited, primarily due to the relatively wide intervals between genetic markers. This limitation reflects the high linkage disequilibrium (LD) in such population, where marker density may be insufficient to precisely localize QTLs to narrow genomic intervals, and thus increase the risk of false positives (Broman et al. 2009). In contrast, high-density markers allow more accurate estimation of LD, enabling the identification of tighter linkage blocks and improve mapping precision.
Genomic selection approaches primarily utilize additive genetic models. However, their predictive accuracies vary depending on how each algorithm captures trait variance and underlying genetic architecture. Enhancing these models by incorporating non-additive model effects, such as dominance and epistasis, may improve prediction although such effects are often genotype-specific and not reliably transmitted across generations (
Wang et al. 2018). Notably, the inclusion of epistatic interactions has been shown to enhance prediction accuracy for complex traits, as demonstrated in soybean RIL populations for somatic embryo number prediction (
Wang et al. 2017). While our study does not explicitly model two-locus epistatic interactions, the identification of a putative epistatic QTL,
qDTH10, suggests a potential benefit of integrating non-additive genetic components to improve trait prediction in rice breeding.
In conclusion, we demonstrated efficient application of ML models for QTL detection. Tree-based ensemble algorithms exhibited high predictive accuracy, identifying major QTLs consistent with conventional methods like ICIM-ADD and SMA. While ML models lack precise positional accuracy, they show potential in detecting non-linear interactions and minor effect QTLs. This approach is scalable and suitable for larger datasets in genome-wide association studies or genomic prediction, offering an efficient framework for dissecting complex traits.
Acknowledgments
This work was supported by the Rural Development Administration (RDA) of Republic of Korea, grant number PJ016997 (RS-2022-RD010220). This study was also supported by 2025 the RDA Fellowship Program of National Institute of Crop and Food Science, Rural Development Administration, Republic of Korea.
Fig. 1Evaluation of machine learning models. (a) Receiver operating characteristics (ROC) curve for five machine learning models. The area under curve (AUC) indicates the classification performance. Red dashed line indicates random classifier. (b) Regression plots showing the predicted (red) vs. actual (blue) values of testing set for five machine learning models. Each subplot includes the mean squared error (MSE) and coefficient of determination (R2). Random forest (RF), gradient boosting (GB), extreme gradient boosting (XGB), K-nearest neighbors (KNN), and support vector regression (SVR).
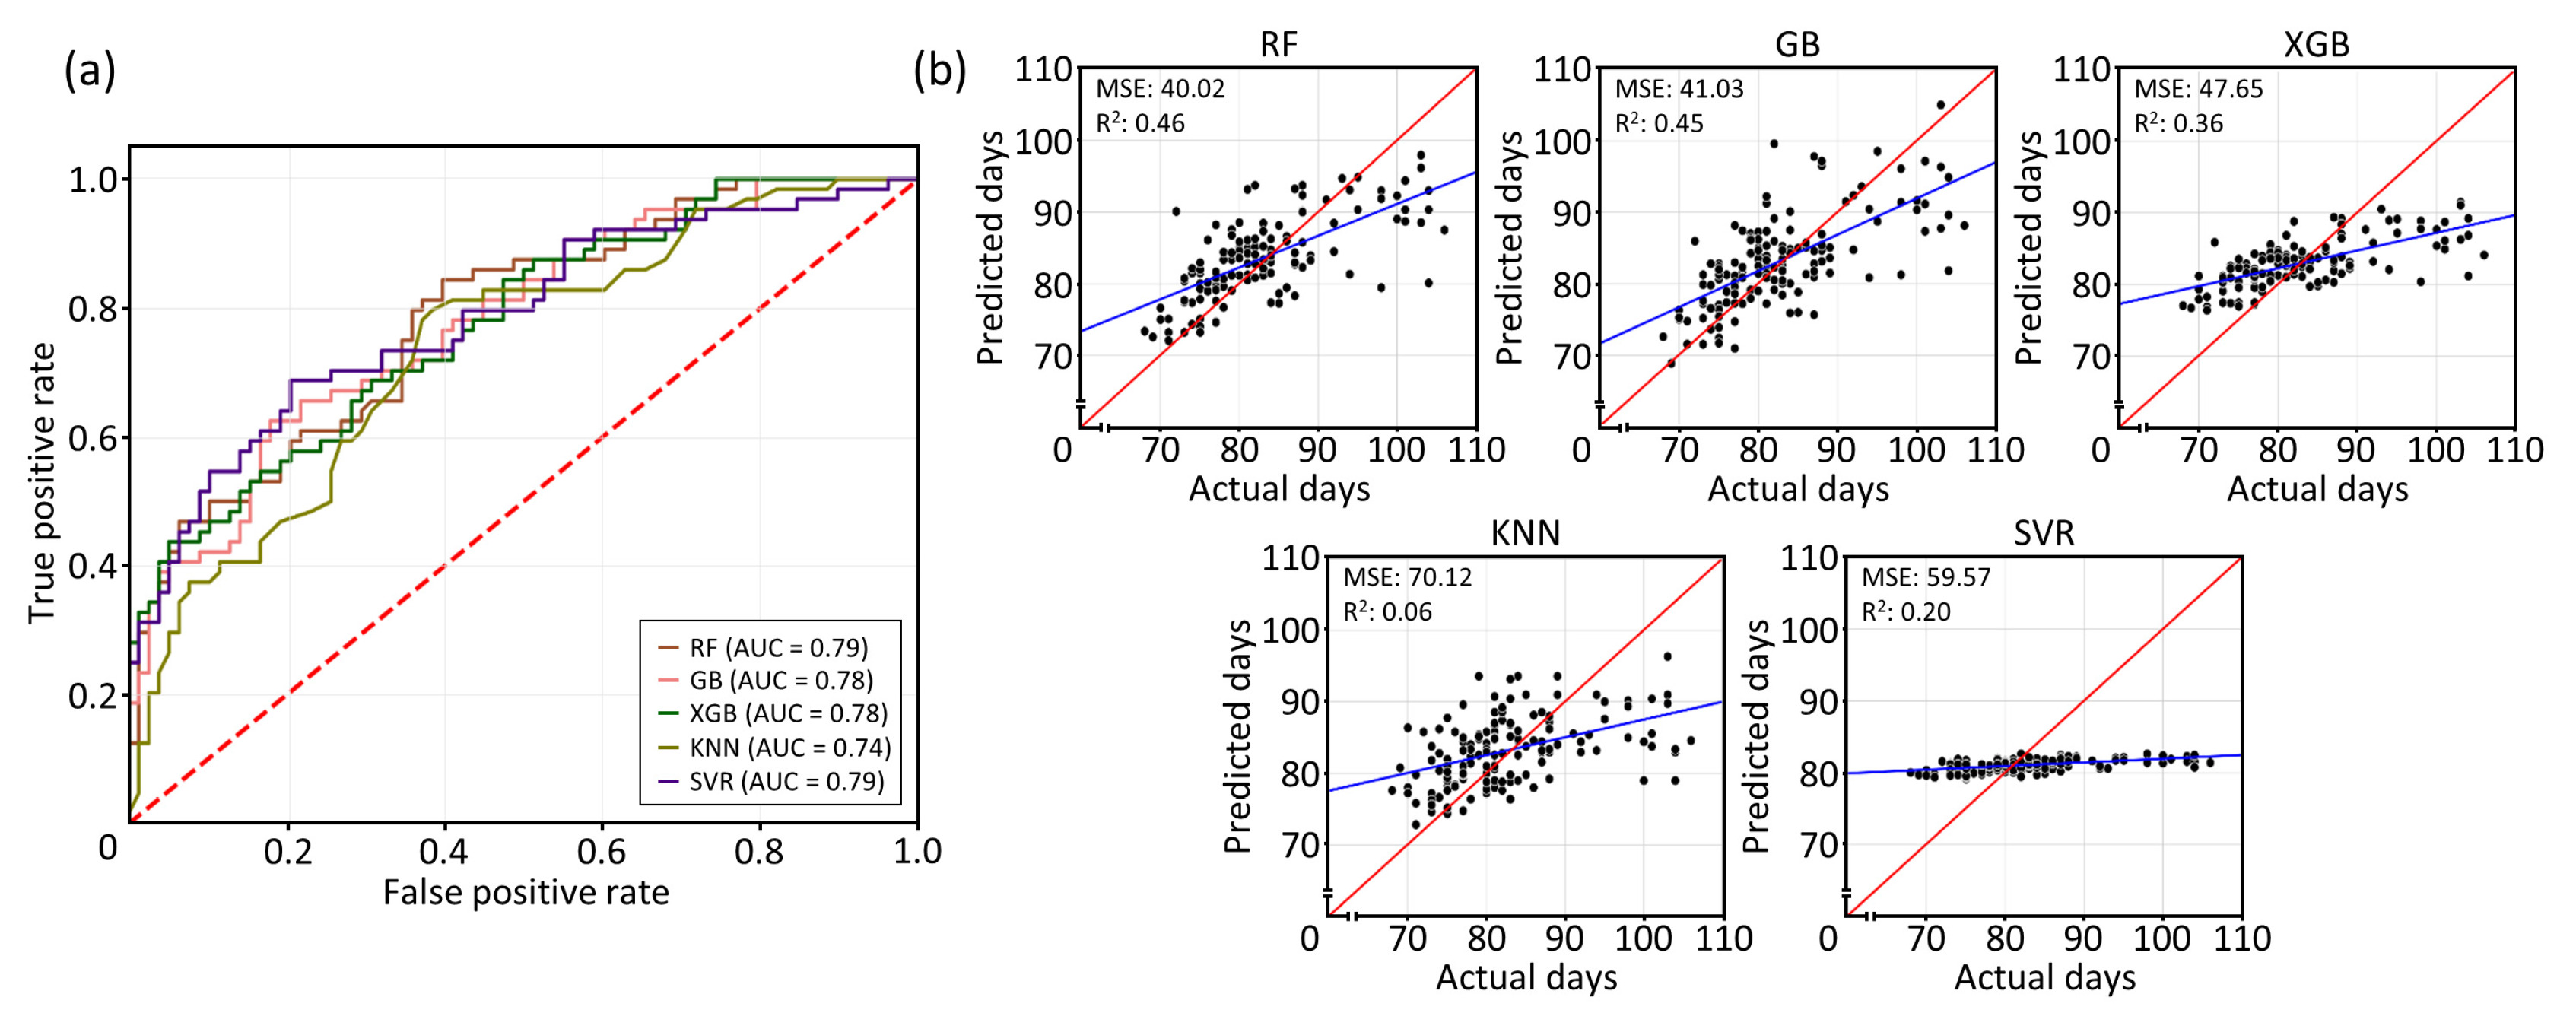
Fig. 2QTL detection for heading date using conventional and machine learning models. Conventional statistical approaches include (a) Inclusive composite interval mapping with additive effects (ICIM-ADD) and (b) Single marker analysis (SMA). Machine learning approaches of (c) Random forest (RF) and (d) Gradient boosting (GB). The horizontal dashed line denotes the logarithm of odds (LOD) threshold according to 1,000 permutation tests at p=0.05. The calculated LOD thresholds were 2.8 (ICIM-ADD) and 2.7 (SMA). Filled circle indicates permutation-based significance threshold of feature importance (FI) calculated at the 95th percentile.

Fig. 3Allelic effects of identified QTLs. (a) Boxplots showing the allelic effects of qDTH3, qDTH6, qDTH7, and qDTH10. (b) Allelic interaction between qDTH10 and qDTH3, qDTH6, and qDTH7. KS and BG indicate Koshihikari and Baegilmi alleles, respectively. ** and *** indicate significant differences at 0.01 and 0.001 probability levels, respectively.
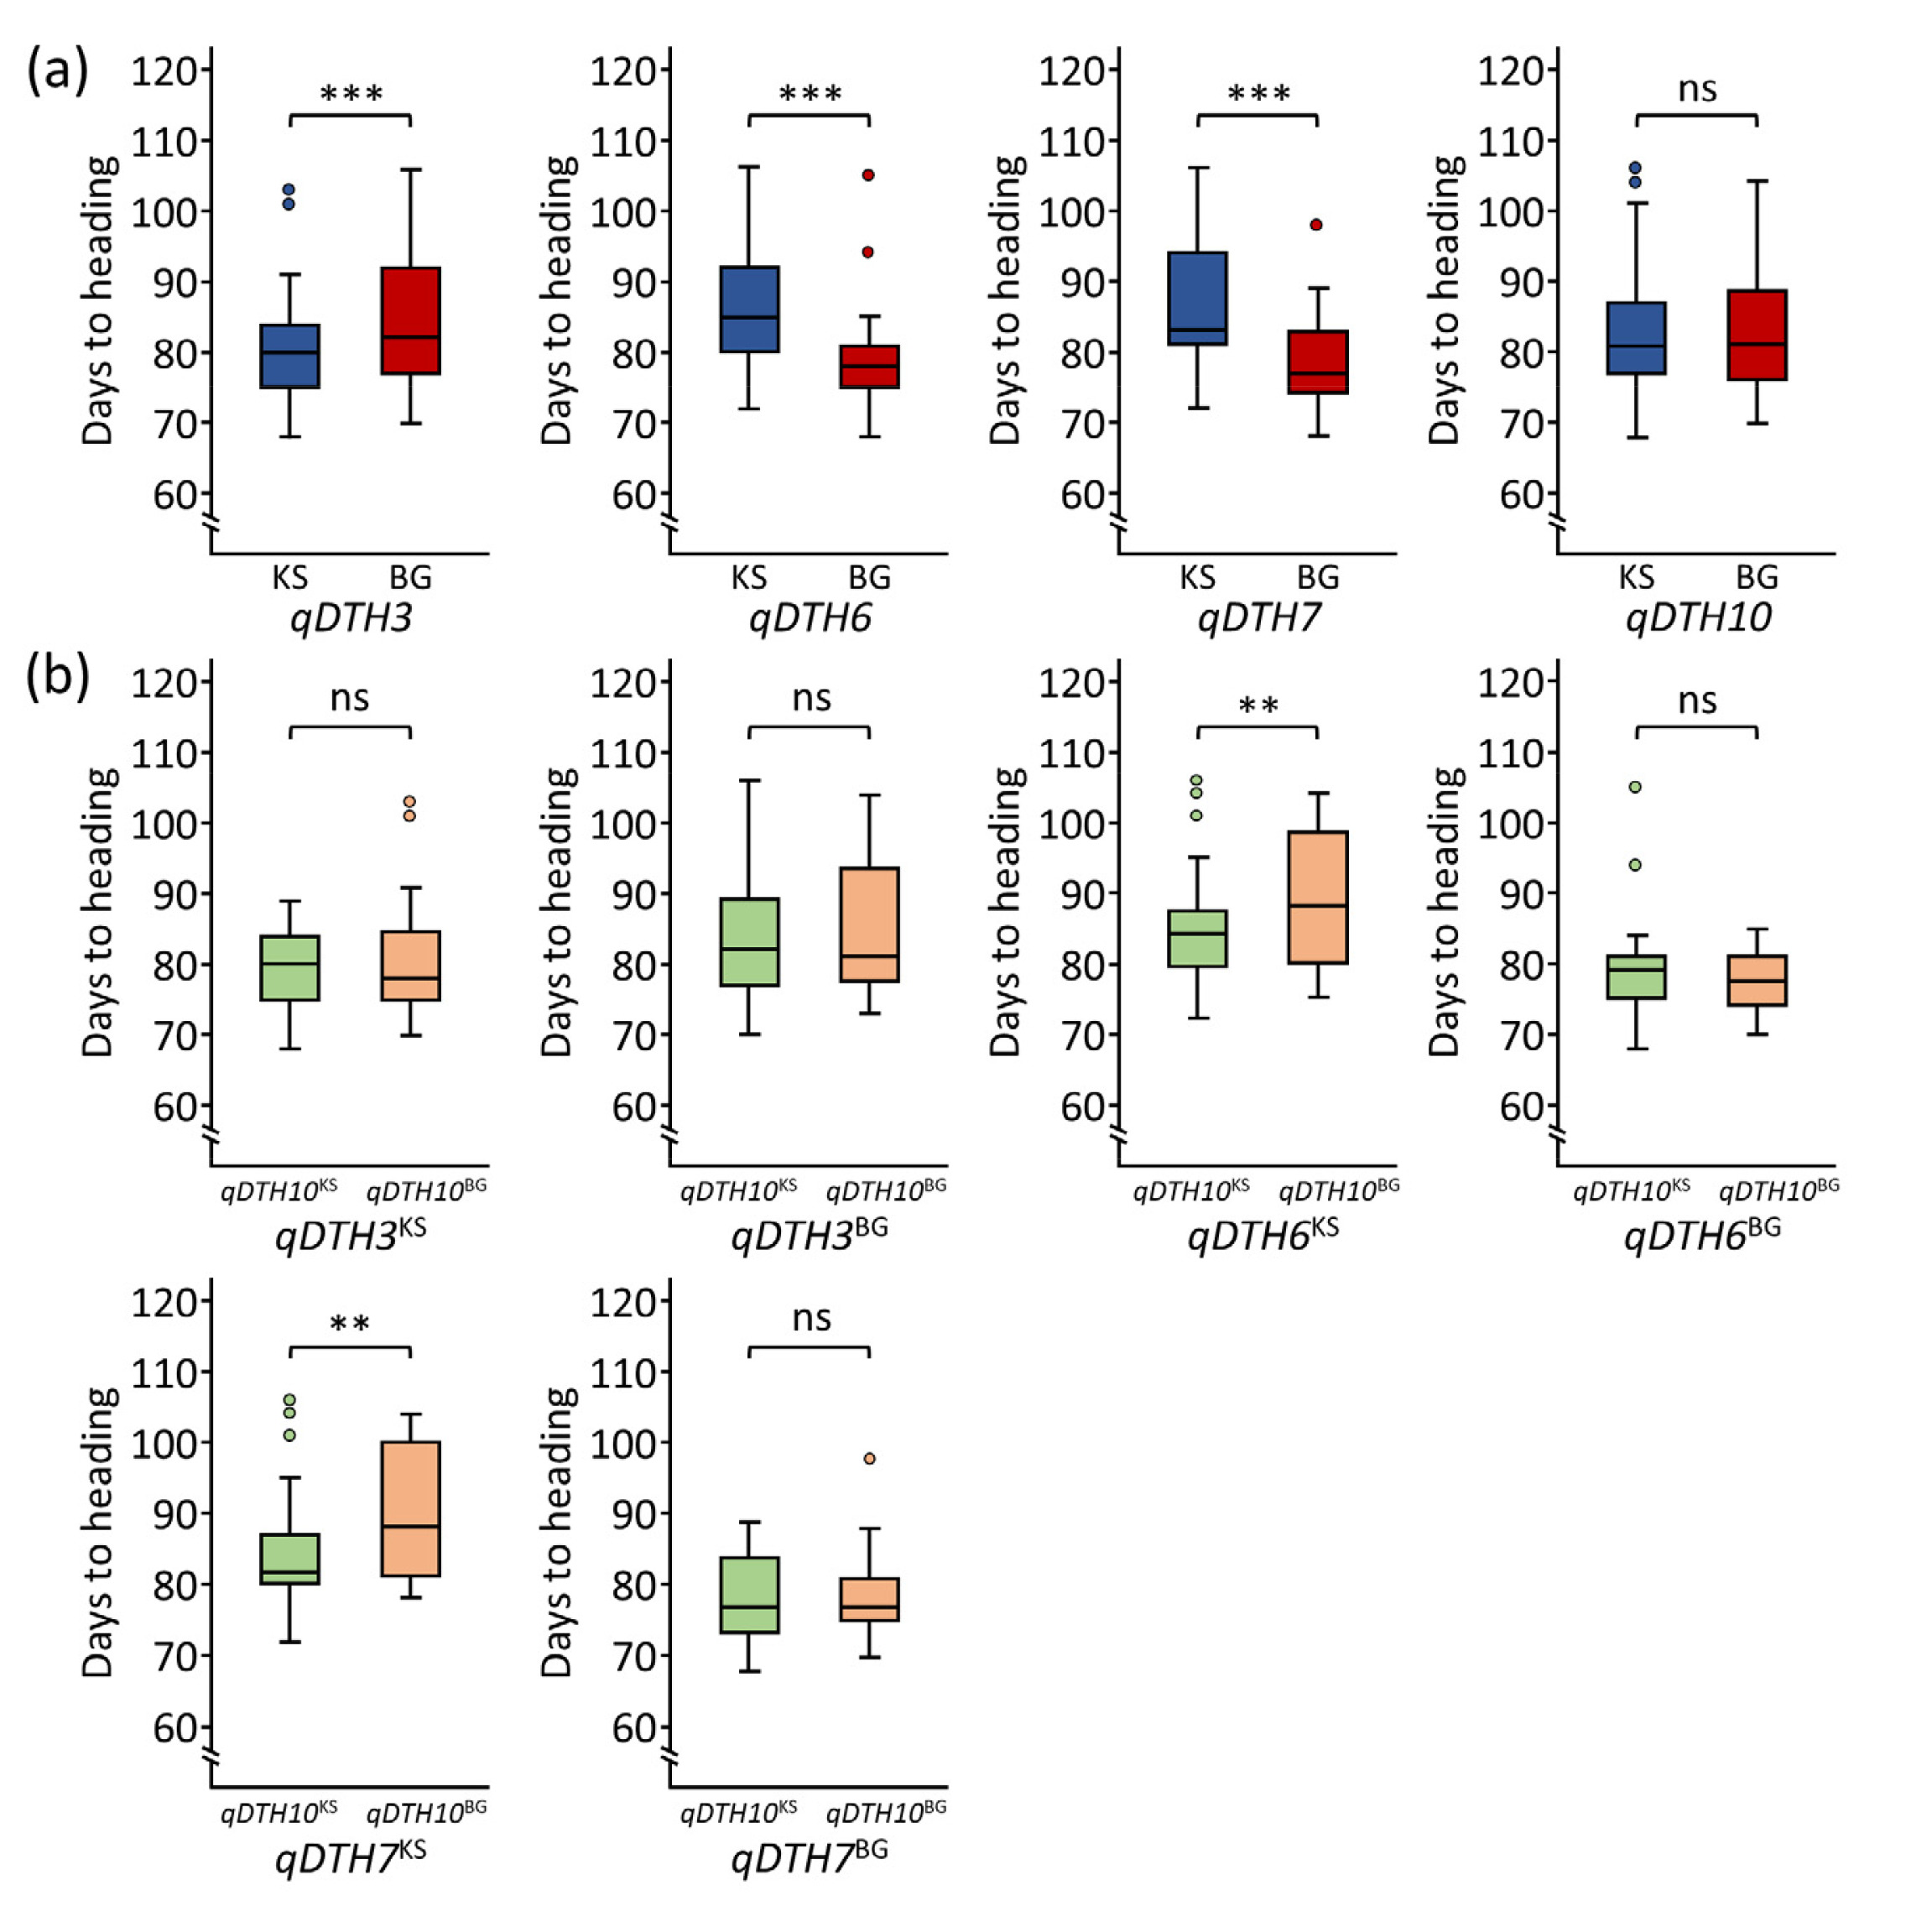
Fig. 4Effects of allelic combinations of qDTH3, qDTH6, qDTH7, and qDTH10 on days to heading in Koshikari/Baegilmi RILs. Blue font represents allele that promotes heading. Error bar indicates standard deviation of the mean. Different letters above the bar graphs indicate significant differences according to Scheffe's method for post hoc comparison at p≤0.05.

Table 1QTLs for heading date detected using the ICIM-ADD method
Table 1
|
QTL |
Chromosome |
Left marker |
Right marker |
LODz
|
PVEy (%) |
Addx
|
Candidate gene |
|
qDTH3
|
3 |
S3_28142709 |
S3_34851991 |
6.7 |
11.1 |
-3.1 |
Hd16
|
|
qDTH6
|
6 |
S6_8634012 |
S6_10449013 |
12.6 |
23.6 |
4.5 |
Hd1
|
|
qDTH7
|
7 |
S7_5256691 |
S7_10453336 |
12.4 |
22.0 |
4.3 |
Ghd7
|
Table 2QTLs for heading date detected using the SMA method
Table 2
|
QTL |
Chromosome |
Marker name |
LODz
|
PVEy (%) |
Addx
|
Candidate gene |
|
|
qDTH3
|
3 |
S3_34851991 |
2.6 |
3.1 |
-2.5 |
Hd16
|
|
qDTH6
|
6 |
S6_7908477 |
5.7 |
6.5 |
3.6 |
Hd1
|
|
S6_8634012 |
7.2 |
7.9 |
4.0 |
|
S6_10449013 |
5.4 |
6.1 |
3.5 |
|
S6_11017344 |
4.4 |
5.1 |
3.2 |
|
|
qDTH7
|
7 |
S7_5256691 |
3.6 |
4.2 |
2.9 |
Ghd7
|
|
S7_10453336 |
8.2 |
8.9 |
4.2 |
|
S7_14589984 |
7.9 |
8.6 |
4.1 |
|
S7_17610718 |
5.9 |
6.7 |
3.6 |
Table 3QTLs for heading date detected using machine learning models
Table 3
|
Model |
QTL |
Chromosome |
Marker name |
Feature importance |
|
Random forest |
qDTH3
|
3 |
S3_34851991 |
0.06 |
|
qDTH6
|
6 |
S6_8634012 |
0.15 |
|
S6_10449013 |
0.04 |
|
qDTH7
|
7 |
S7_10453336 |
0.04 |
|
S7_14589984 |
0.21 |
|
qDTH10
|
10 |
S10_22603997 |
0.05 |
|
Gradient boosting |
qDTH3
|
3 |
S3_21710263 |
0.03 |
|
S3_34851991 |
0.09 |
|
qDTH6
|
6 |
S6_8634012 |
0.18 |
|
qDTH7
|
7 |
S7_14589984 |
0.22 |
|
qDTH10
|
10 |
S10_22603997 |
0.05 |
References
- Bates D. 2014. Fitting linear mixed-effects models using lme4. arXiv preprint arXiv:1406.5823..
- Bedo J, Wenzl P, Kowalczyk A, Kilian A. 2008. Precision-mapping and statistical validation of quantitative trait loci by machine learning. BMC. Genet. 9: 1-18.
- Ben Hassen M, Cao TV, Bartholome J, Orasen G, Colombi C, Rakotomalala J, et al. 2018. Rice diversity panel provides accurate genomic predictions for complex traits in the progenies of biparental crosses involving members of the panel. Theor. Appl. Genet. 131: 417-435.
- Bian Y, Holland JB. 2015. Ensemble learning of QTL models improves prediction of complex traits. G3. 5: 2073-2084.
- Boriah S, Chandola V, Kumar V. 2008. Similarity measures for categorical data: A comparative evaluation. Presented at Proceedings of the 2008 SIAM international conference on data mining. pp. 243-254.
- Breiman L. 2001. Random forests. ML. 45: 5-32.
- Broman KW, Sen S. 2009. A Guide to QTL Mapping with R/qtl. Springer.
- Chen T, Guestrin C. 2016. Xgboost: A scalable tree boosting system. Presented at Proceedings of the 22nd acm sigkdd international conference on knowledge discovery and data mining. pp. 785-794.
- Doi K, Izawa T, Fuse T, Yamanouchi U, Kubo T, Shimatani Z, et al. 2004. Ehd1, a B-type response regulator in rice, confers short-day promotion of flowering and controls FT-like gene expression independently of Hd1. Genes. Dev. 18: 926-936.
- Drucker H, Burges CJ, Kaufman L, Smola A, Vapnik V. 1996. Support vector regression machines. Adv. Neural Inf. Process. Syst.
- Ertel W. 2024. Introduction to artificial intelligence. Springer Nature.
- Ferguson JN, Fernandes SB, Monier B, Miller ND, Allen D, Dmitrieva A, et al. 2021. Machine learning-enabled phenotyping for GWAS and TWAS of WUE traits in 869 field-grown sorghum accessions. Plant. Physiol. 187: 1481-1500.
- García S, Luengo J, Herrera F. 2015. Data preprocessing in data mining. Springer.
- Heslot N, Yang HP, Sorrells ME, Jannink JL. 2012. Genomic selection in plant breeding: a comparison of models. Crop. Sci. 52: 146-160.
- Hori K, Ogiso-Tanaka E, Matsubara K, Yamanouchi U, Ebana K, Yano M. 2013. Hd16, a gene for casein kinase I, is involved in the control of rice flowering time by modulating the day-length response. Plant. J. 76: 36-46.
- Isidro J, Jannink JL, Akdemir D, Poland J, Heslot N, Sorrells ME. 2015. Training set optimization under population structure in genomic selection. Theor. Appl. Genet. 128: 145-158.
- Izawa T. 2007. Adaptation of flowering-time by natural and artificial selection in Arabidopsis and rice. J. Exp. Bot. 58: 3091-3097.
- Jordan MI, Mitchell TM. 2015. Machine learning: Trends, perspectives, and prospects. Sci. 349: 255-260.
- Lee SY, Jeung JU, Mo Y. 2024. Allelic combinations of Hd1, Hd16, and Ghd7 exhibit pleiotropic effects on agronomic traits in rice. G3. 14: jkad300
- Li H, Ye G, Wang J. 2007. A modified algorithm for the improvement of composite interval mapping. Genet. 175: 361-374.
- Matsubara K, Yamanouchi U, Wang ZX, Minobe Y, Izawa T, Yano M. 2008. Ehd2, a rice ortholog of the maize INDETERMINATE1 gene, promotes flowering by up-regulating Ehd1. Plant. Physiol. 148: 1425-1435.
- Matsubara K, Yano M. 2018. Rice genomics, genetics and breeding. Springer. Singapore.
- McCough SR, Doerge RW. 1995. QTL mapping in rice. TiG. 11: 482-487.
- Meng L, Li H, Zhang L, Wang J. 2015. QTL IciMapping: Integrated software for genetic linkage map construction and quantitative trait locus mapping in biparental populations. Crop J. 3: 269-283.
- Mo Y, Jeong JM, Ha SK, Kim J, Lee C, Lee GP, et al. 2020. Characterization of QTLs and candidate genes for days to heading in rice recombinant inbred lines. Genes. 11: 957
- Muthayya S, Sugimoto JD, Montgomery S, Maberly GF. 2014. An overview of global rice production, supply, trade, and consumption. Ann. N. Y. Acad. Sci. 1324: 7-14.
- Pedregosa F, Varoquaux G, Gramfort A, Michel V, Thirion B, Grisel O, et al. 2011. Scikit-learn: Machine learning in Python. JMLR. 12: 2825-2830.
- Peterson LE. 2009. K-nearest neighbor. Scholarpedia. 4: 1883
- RDA 2012.2012. Manual for standard evaluation method in agricultural experiment and research. RDA Press Suwon. Korea.
- Ryu CH, Lee S, Cho LH, Kim SL, Lee YS, Choi SC, et al. 2009. OsMADS50 and OsMADS56 function antagonistically in regulating long day (LD)-dependent flowering in rice. Plant. Cell. Environ. 32: 1412-1427.
- Spindel J, Begum H, Akdemir D, Virk P, Collard B, Redona E, et al. 2015. Genomic selection and association mapping in rice (Oryza sativa): effect of trait genetic architecture, training population composition, marker number and statistical model on accuracy of rice genomic selection in elite, tropical rice breeding lines. PLoS. Genet. 11: e1004982
- Sun Z, Zhu Y, Chen J, Zhang H, Zhang Z, Niu X, et al. 2018. Minor-effect QTL for heading date detected in crosses between indica rice cultivar Teqing and near isogenic lines of IR24. Crop. J. 6: 291-298.
- Tsai H-Y, Janss LL, Andersen JR, Orabi J, Jensen JD, Jahoor A, et al. 2020. Genomic prediction and GWAS of yield, quality and disease-related traits in spring barley and winter wheat. Sci. Rep. 10: 3347
- Wang X, Li L, Yang Z, Zheng X, Yu S, Xu C, et al. 2017. Predicting rice hybrid performance using univariate and multivariate GBLUP models based on North Carolina mating design II. Hered. 118: 302-310.
- Wang X, Xu Y, Hu Z, Xu C. 2018. Genomic selection methods for crop improvement: Current status and prospects. Crop J. 6: 330-340.
- Xue W, Xing Y, Weng X, Zhao Y, Tang W, Wang L, et al. 2008. Natural variation in Ghd7 is an important regulator of heading date and yield potential in rice. Nat. Genet. 40: 761-767.
- Yan H, Guo H, Xu W, Dai C, Kimani W, Xie J, et al. 2023. GWAS-assisted genomic prediction of cadmium accumulation in maize kernel with machine learning and linear statistical methods. J. Hazard. Mater. 441: 129929
- Yano M, Katayose Y, Ashikari M, Yamanouchi U, Monna L, Fuse T, et al. 2000. Hd1, a major photoperiod sensitivity quantitative trait locus in rice, is closely related to the Arabidopsis flowering time gene CONSTANS. Plant Cell. 12: 2473-2483.
- Yoosefzadeh-Najafabadi M, Torabi S, Tulpan D, Rajcan I, Eskandari M. 2021. Genome-wide association studies of soybean yield-related hyperspectral reflectance bands using machine learning-mediated data integration methods. Front. Plant Sci. 12: 777028