Abstract
Rice domestication has led to cultivated rice with no or short awns. Discovery of novel genes associated to awn length is of paramount importance for understanding the molecular mechanisms for the transformation of wild rice long awns to awnless cultivated rice. In this study, we employed Next-Generation Sequencing based QTL-seq approach to identify genomic regions associated with awn length using mapping population derived from a cross between awnless Tun Sart and awned Sobaekmangsudo. QTL-seq analysis identified two awn length QTLs viz. qAwn-4 (12.8-20.3 Mb) and qAwn-8 (22.3-27.2 Mb) on chromosome 4 and 8, respectively. Based on the sequence comparison between the two parents, Os04g0350700 (bHLH transcription factor) was postulated to be the candidate of Awn-4 gene. Further discovery of the novel genes in qAwn-8 interval will provide insights into the genetic architecture of awn length.
-
Key words: Rice, QTL-seq, Bulk segregant analysis (BSA), Awn length
INTRODUCTION
Rice is originated from wild rice (
O. rufipogon Girff.) through domestication. This considerably changed the morpho-physiological characteristics of wild rice to in-crease cultivation efficiency, grain quality, and rice yield (
Fuller et al. 2010;
Huang et al. 2012). Compared to wild rice, cultivated rice typically exhibits favorable charac-teristics including erect growth, no or short awns, increased spikelet number per panicle, closed panicle, and reduced seed shattering and dormancy, all of which changed dramati-cally during domestication (
Kovach et al. 2007;
Sweeney and McCouch 2007).
Regent studies of the genetic mechanisms underlying the development of rice awns have suggested that awn devel-opment is a complex trait controlled by multiple genes. A total of 21 QTLs with major and minor effect on rice awn length in rice have been reported in the Gramene database (
https://archive.gramene.org/). However, only a few major QTLs have been identified and characterized at the molecular level.
An-1/RAE1 encodes a basic helix-loop-helix (bHLH) transcription factor that regulates the formation of awn primordia, cell division and grain length and reduces the grain number in wild rice (
Luo et al. 2013).
An-2/LABA1 encodes a cytokinin synthesis enzyme that promotes awn elongation by increasing cytokinin concentration in the awn primordia. It reduces the number of grains per panicle and tiller number per plant (
Gu et al. 2015;
Hua et al. 2015).
RAE2/GAD1/GLA encodes a secreted signal peptide that regulates awn development as well as the number of grains per panicle and grain length (
Bessho-Uehara et al. 2016;
Jin et al. 2016;
Zhang et al. 2019). The YABBY trans-cription factor
DL, auxin responsive factor
OsETTIN2, and RNA-dependent RNA polymerase
SHL2 are also involved in awn formation (
Toriba and Hirano 2014).
To identify novel genomic regions associated with awn length, we have performed QTL-seq (
Takagi et al. 2013), a combination of bulk segregant analysis (BSA) and whole genome re-sequencing of DNA pools. An F
2 population derived from a cross between Tun Sart (an awnless cul-tivar) and Sobaekmangsudo(an awned cultivar) were used. This study will provide a valuable genetic resource for future molecular breeding in rice.
MATERIALS AND METHODS
Plant materials
Two
japonica rice cultivars [awnless Tun Sart (IT 004483) and awned Sobaekmangsudo (IT 006737)] were used as parental lines to develop the 197 F
2 population. [To simplify the following description, we represent Tun Sart as RWG-45 and Sobaekmangsudo as RWG-111]. RWG-45 and RWG-111 are part of the 137 KRICE_CORE pop-ulation (
Kim et al. 2016) and both seeds were received from the Rural Development Administration (RDA) gene bank, Korea. F
2 population was obtained from Pusan national University, Miryung, Korea.
Phenotyping was carried out at Pusan University, Miryang, Korea using 197 individual F2 plants of RWG-45 × RWG-111. Three main panicles of each plant were used for pheno-typing and the awn length of the whole panicle was re-presented by the average of apical spikelets on each primary branch. Measuring the awn lengths was carried out two weeks after heading to avoid the awn breakage.
Construction of segregating pools
All young leaves of 197 individual F
2 plants were col-lected separately for total genomic DNA extraction using CTAB method (
Porebski et al. 1997), with minor modi-fications. The genomic DNA of 23 individuals with ex-tremely short awn (ESA) and 30 extremely long awn (ELA) were selected as two bulked pools of the F
2 popula-tion. Isolated DNA was quantified using a Nanodrop spectrophotometer (Thermo Scientific, Wilmington, USA). Equal amounts of DNA from the ESA and ELA individuals were mixed.
Total genomic DNA was extracted from two bulked pools, and it was used to construct paired-end libraries with an insert size of 151 bp using TruSeq Nano DNA Kit (Illumina, San Diego, CA, USA). These libraries were sequenced using the Illumina NGS platform at Macrogen (Seoul, Korea). After sequencing, raw reads filtering was performed by fastp program (
Chen et al. 2018). This data was aligned to the Nipponbare reference genome (IRGSP) by using the BWA program (
Li and Durbin 2009). Samtools and GATK were used to clean the BAM file and for SNP variation calling, respectively (
Li et al. 2009;
McKenna et al. 2010). VCF file was filtered by vcftools (
Danecek et al. 2011) to obtain high quality genotype data. The QTL-seq pipeline (QTL-seq version 2.1.3) (
Takagi et al. 2013;
Sugihara et al. 2022) was used for mapping the QTLs for
Awn genes.
To predict possible candidate genes associated with awn length, the following strategies were employed. First, we compared the DNA sequences of genes within the QTL regions between the two parents using the whole-genome DNA re-sequencing results to predict the candidate genes. Second, comparing the results with known genes/QTLs for awn length on 12 chromosomes in rice. Third, candidate genes were reselected according to their functional anno-tation from the rice genome database (
http://rice.uga.edu/).
RESULTS
Evaluation of the awn length
The awn length of the two parental cultivars, RWG-45 and RWG-111 (
Fig. 1A) along with their 197 F
2 population (
Fig. 1B), were evaluated two weeks after heeding. Sig-nificant difference of the awn length was observed between the two parents. The F
2 population showed awn length variation from 0.3 to 112.5 mm (
Fig. 1B). Among the 197 F
2 individuals, 23 extremely short awn and 30 extremely long awn plants were selected to prepare the ESA-pool and ELA-pool, respectively, which were then used for DNA re-sequencing.
We performed high-throughput genome sequencing using four samples including RWG-45, RWG-111, ESA-pool, ELA-pool and obtained a total of 238.9 million reads and 32.6 Gb of raw data (
Table 1). After cleaning the data by fastp, the average GC content was 42.310% and the Q30 of all the samples reached more than 91%. The mapped ratios between samples and the Nipponbare genome were 98.34%, 98.93%, 98.89%, and 98.94%, respectively. Most samples except RWG-111 (81.92%) showed properly paired ratio higher than 94% and unmapped ratio of all the sam-ples was lower than 1.7%. The average genome-coverage depth was 22X and the genome coverage was higher than 98%. These results suggest that the resequencing quality is confirmed and they could be used for the following analysis.
We obtained a total of 735,910 variants those were including 583,569 SNPs and 152,341 indels from the sam-ples. Among the 1,213.9 K annotations, 619.6 K, 51.4 K, and 22.3 K were located at intergenic region, intron, and exon, respectively. 10.2 K and 8.4 K of the annotations lo-cated at the exon region were non-synonymous and syn-onymous, respectively (
Table 2).
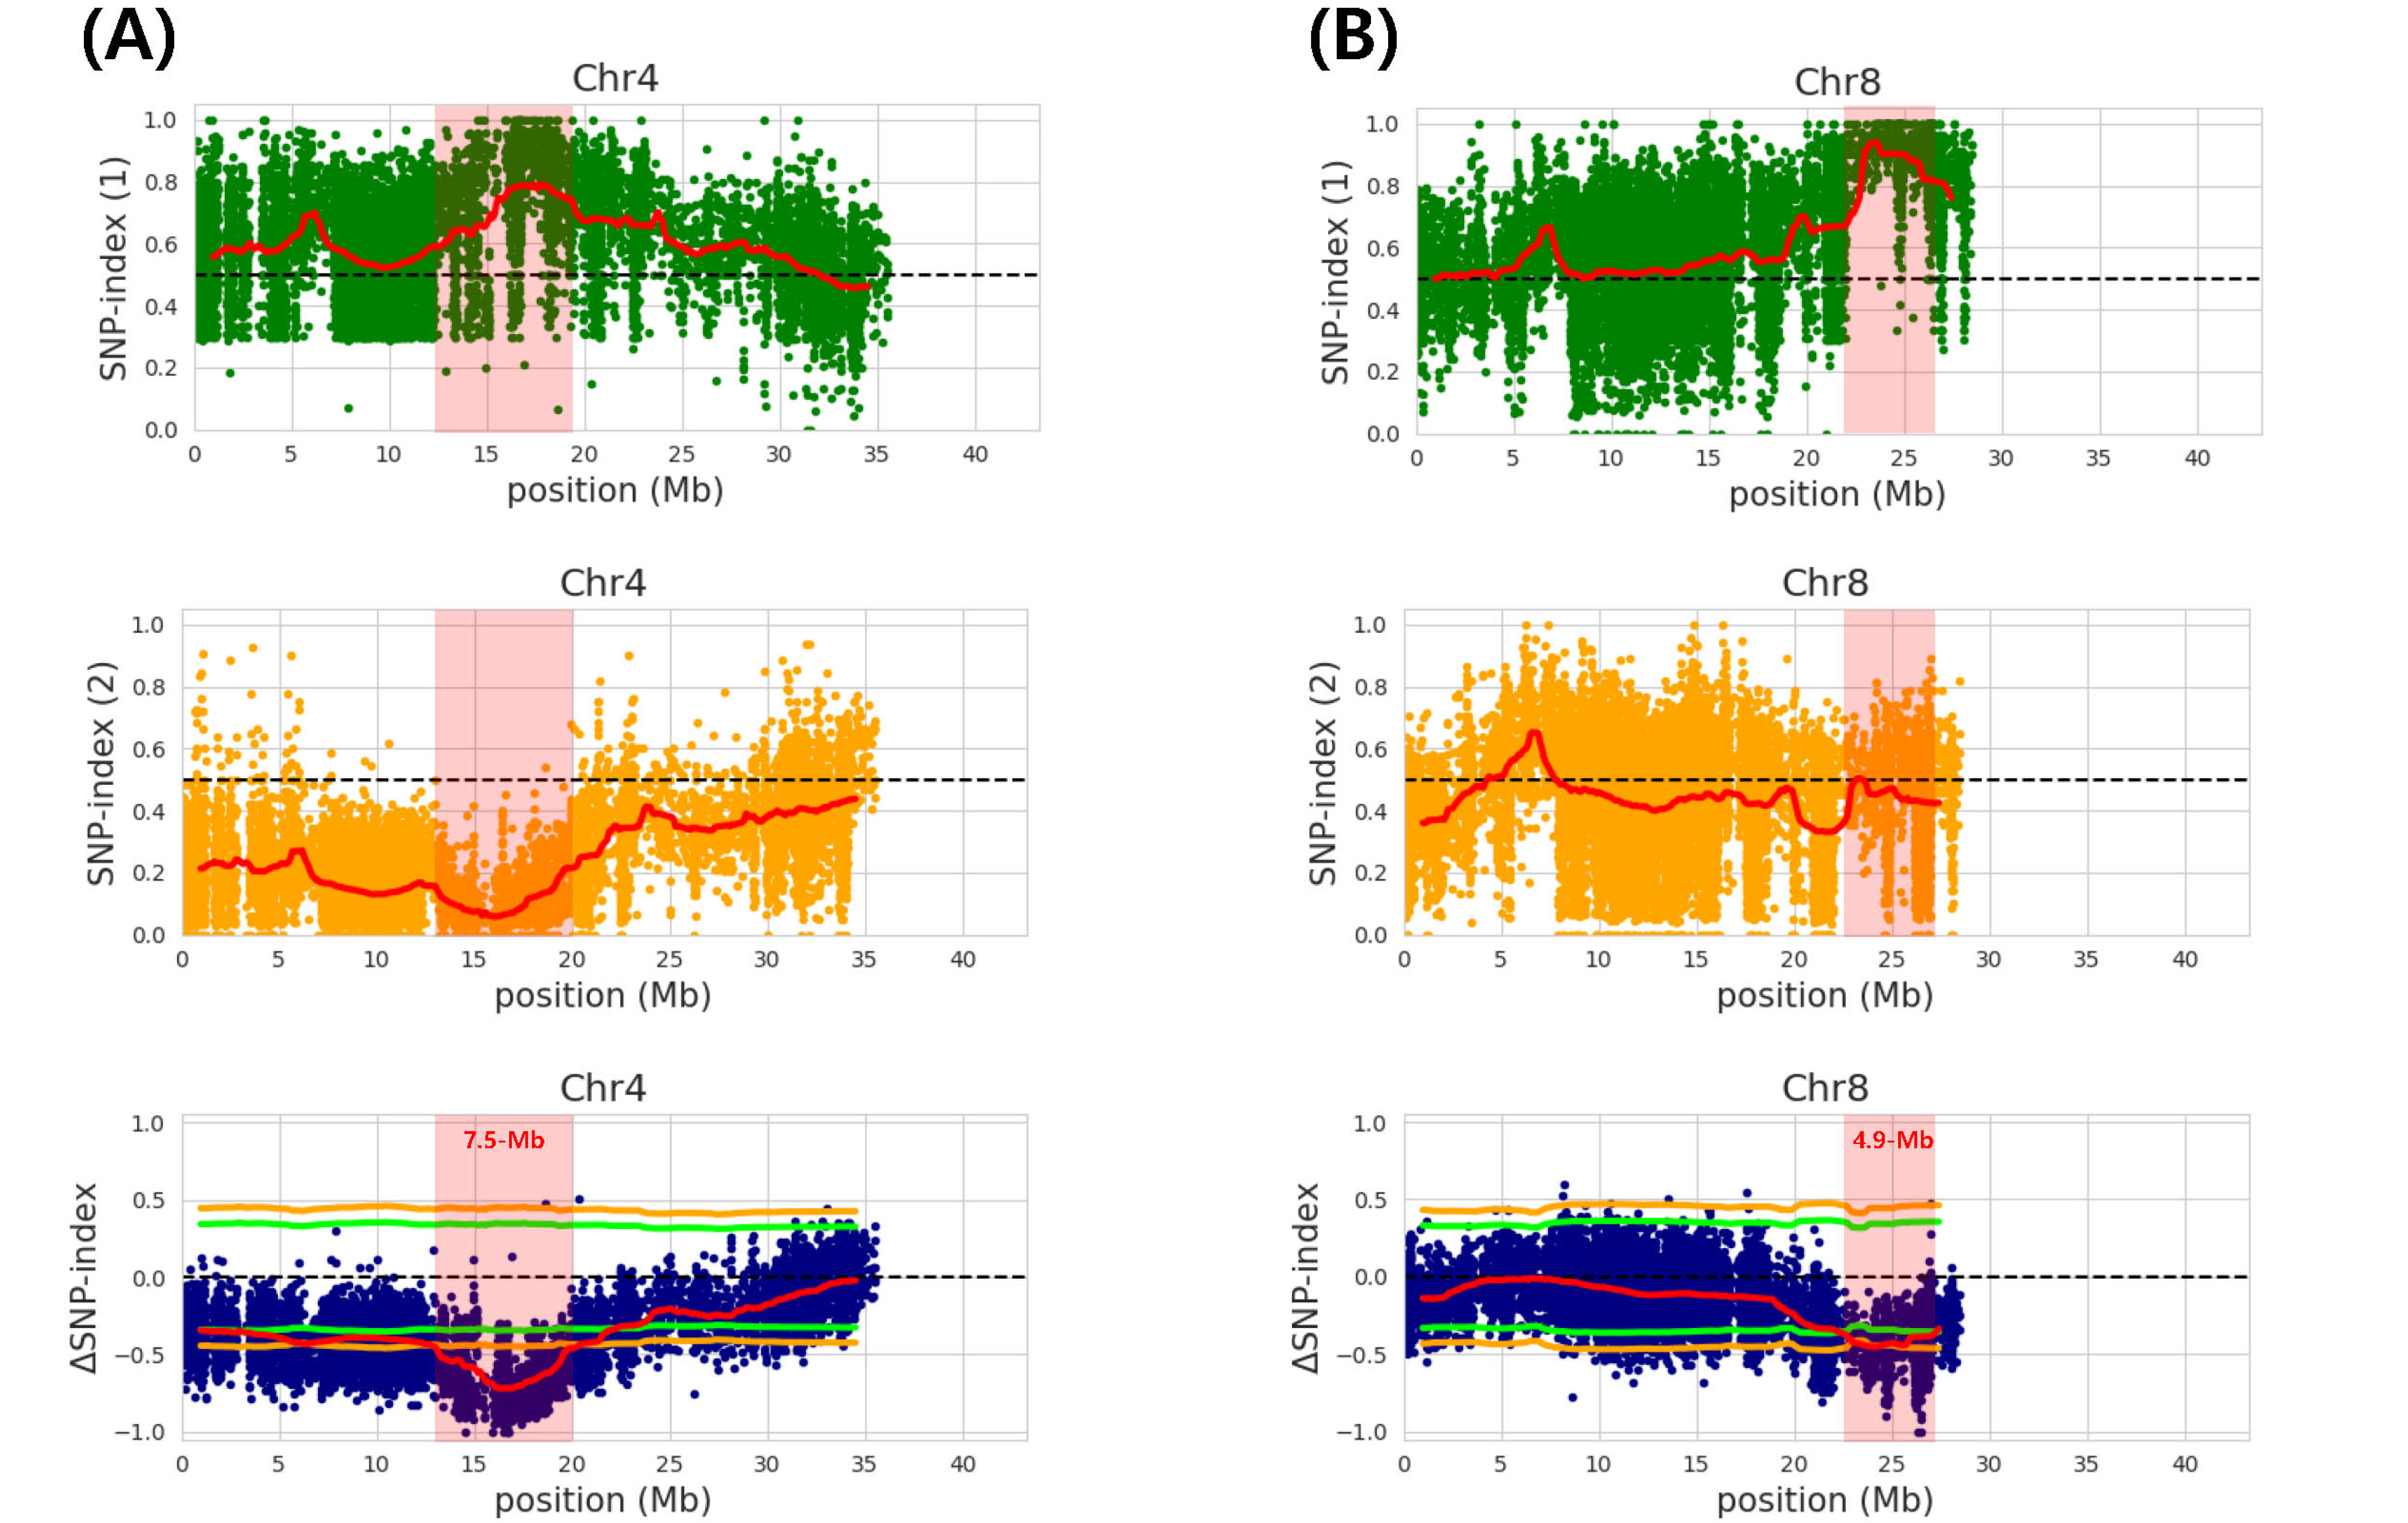
Two major peaks on chromosome 4 and 8 were iden-tified for awn length and named as
qAwn-4 and
qAwn-8, respectively (
Fig. 2). The
qAwn-4 was spanning 7.5-Mb (12.8-20.3 Mb) intervals on chromosome 4 and the accu-racy of this QTL was ascertained by a valid 99% Δ(SNP- index) significance level (
Fig. 2A,
Table 3). The other QTL,
qAwn-8, was spanning 4.9-Mb (22.3-27.2 Mb) inter-vals on chromosome 8 and the accuracy of this QTL was ascertained by a valid 95% Δ(SNP-index) significance level (
Fig. 2B,
Table 3). The
qAwn-4 coding region har-bored 1,352 SNPs and 302 indels, and the
qAwn-8 coding region harbored 880 SNPs and 254 indels (data not shown).
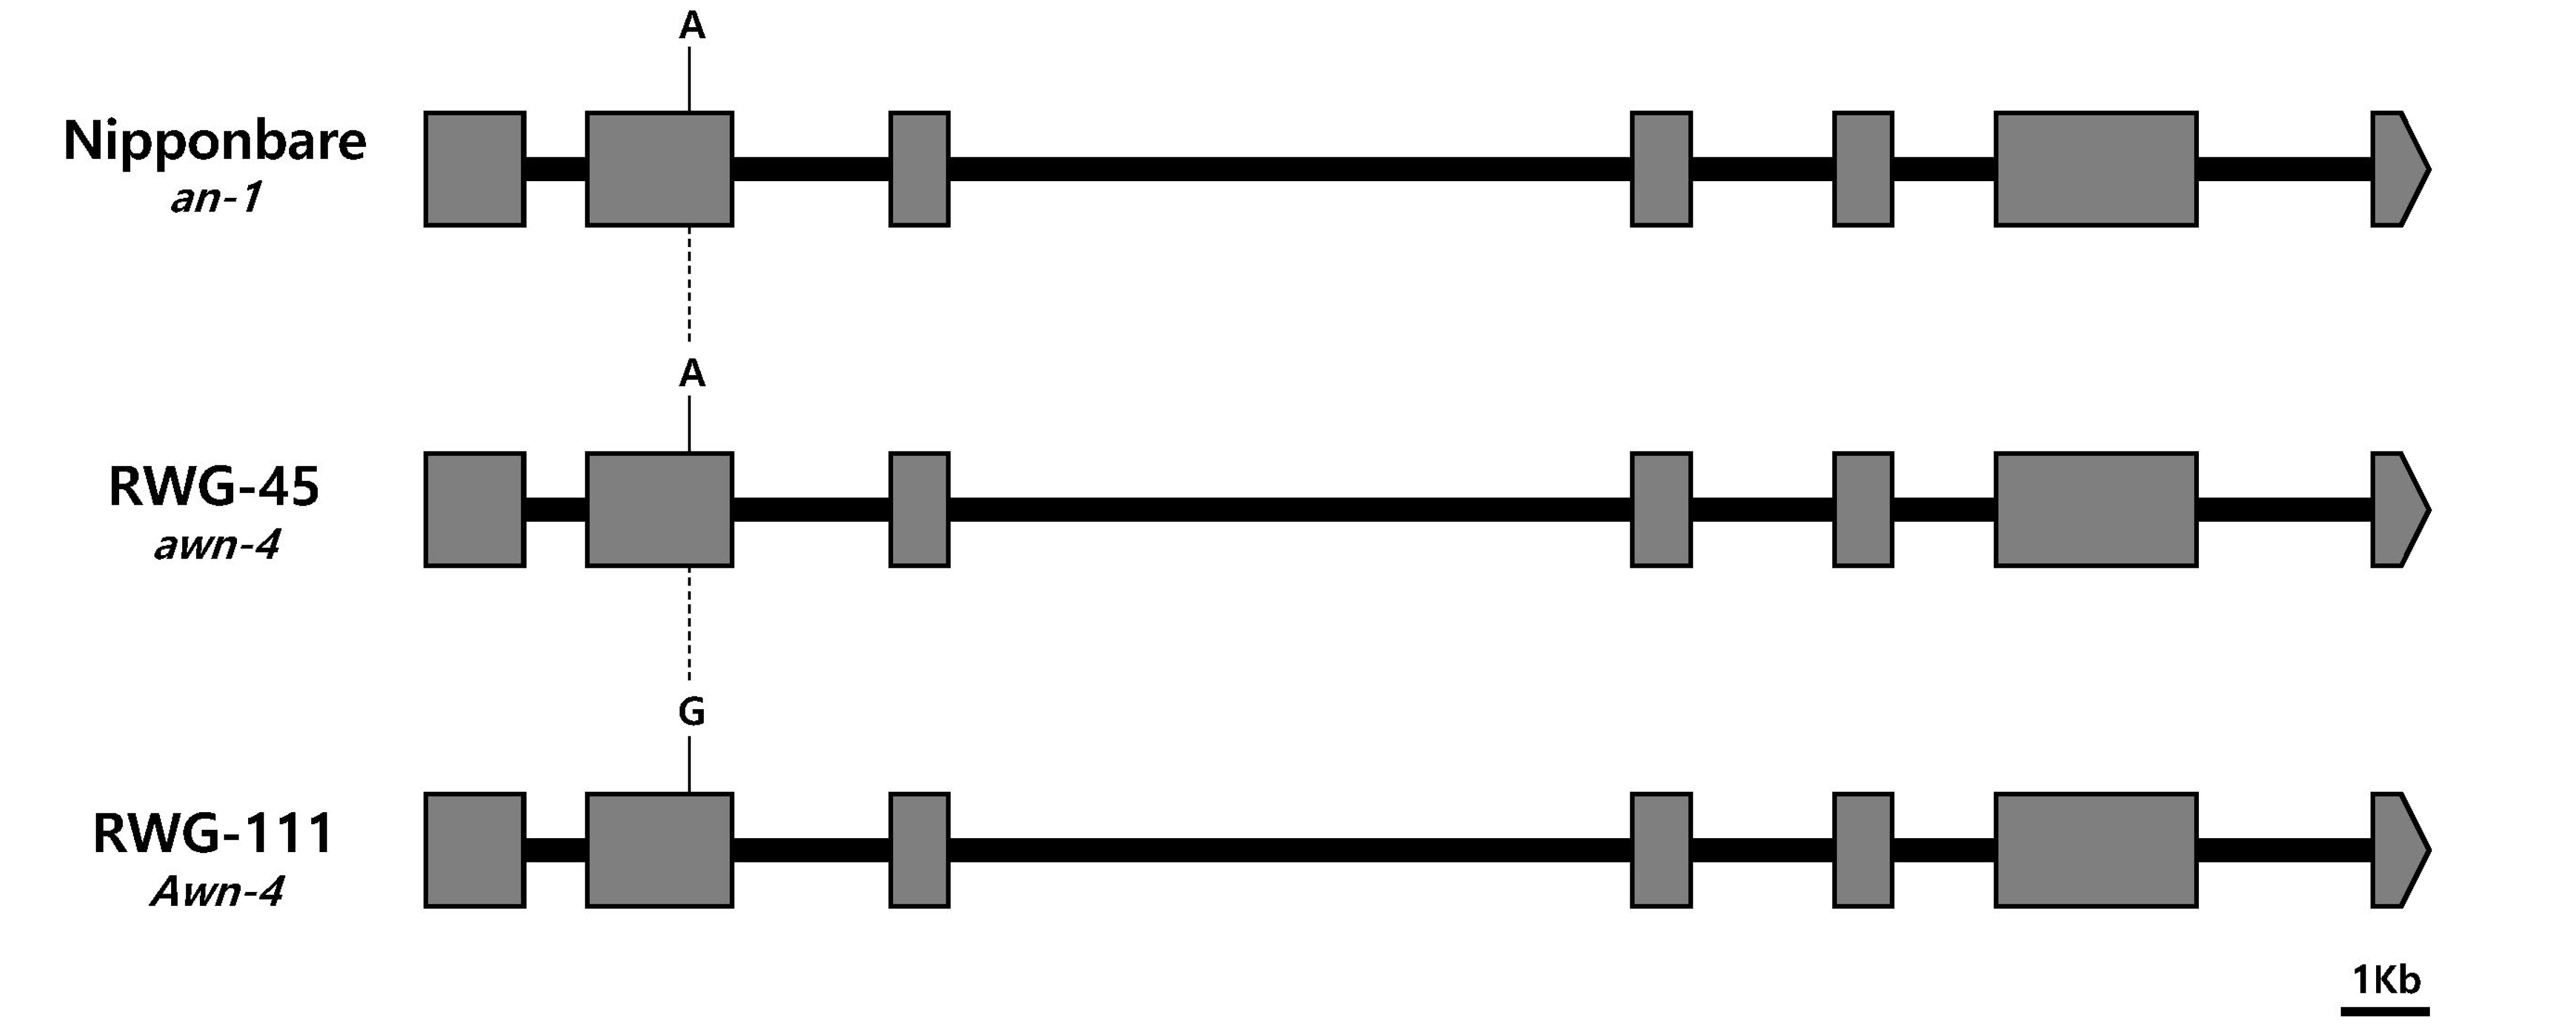
Genomic sequence comparison was made between the two parents based on the genes that were previously reported on the identified QTL regions. The
An-1 (
Os04g0350700), a major gene that regulates awn development, was located in the
qAwn-4 region. One SNP was identified in the second exon between awnless and awned plants in
Os04g0350700 (
Fig. 3). Another major gene
RAE2 (
Os08g0485500) was located in the
qAwn-8 region. However, no nucleotide variants were found between awnless and awned plants indicating the existence of a novel gene contributing to awn length (data not shown). Further analysis will be performed to narrow down the candidate region and to discover the novel genes.
DISCUSSION
Morpho-physiological traits of wild species have been modified to meet human needs during crop domestication. Wild rice typically exhibits long awns that help in seed dispersal and provide protection from predators under nat-ural conditions. However, in agriculture, long awns are inconvenient for pre-harvesting and post-harvesting because of its structure. Hence, rice domestication has led to culti-vated rice with no or short awns. Recently, studies have been conducted to elucidate the genetic mechanisms under-lying the rice awn development. Although several genes/ QTLs associated with awn development have been detected, only a few major QTLs have been cloned and characterized at the molecular level.
To identify the novel QTLs for awn length, two DNA pools with extreme phenotypic difference were used to perform QTL-seq analysis. We used the Δ(SNP-index) algorithm approach to map QTL regions at the 95% or 99% significance level. Two highly significant peaks (
qAwn-4 and
qAwn-8) were detected on chromosome 4 and 8, with the former mapped between 12.8-20.3 Mb and the latter between 22.3-27.2 Mb (
Fig. 2).
QTLs and genes for awn length on chromosome 4 and 8 have been previously reported. The
An-1 encoding a bHLH transcription factor was identified from wild rice (
O. rufipogon) and it regulates long awn formation (
Luo et al. 2013). This gene was detected in
qAwn-4 region. In chromosome 8, the location of
qAwn-8 in the present study was containing the previously reported gene,
RAE2 that encodes one member of the epidermal patterning factor-like protein (EFPL) family regulating awn formation (Bessho- Uehara
et al. 2016;
Jin et al. 2016;
Zhang et al. 2019).
Comparison between the genomic sequences of the two parents revealed that one SNP difference in the coding region of
An-1 (
Fig. 3), in which +244-bp (A > G) changes the amino acid sequence, suggesting that this SNP might be involved in awn formation and elongation. However, no SNPs were found between the sequence of the two parents in the coding region of
RAE2 suggesting that a novel gene associated to awn length might exist in the interval of
qAwn-8 which warrants further exploration. Therefore, further discovery of the novel genes will provide insights into the genetic architecture of awn length.
ACKNOWLEDGEMENTS
This work was supported by the Rural Development Administration, Republic of Korea (RS-2022-RD010201).
Fig. 1Comparison of the awn phenotypes between RWG- 45 and RWG-111. (A) Phenotypic comparison of seed arrays from mature spikelets of RWG-45 (left) and RWG-111 (right). (B) Frequency distribution of the awn length in the F2 population (RWG-45 × RWG-111).
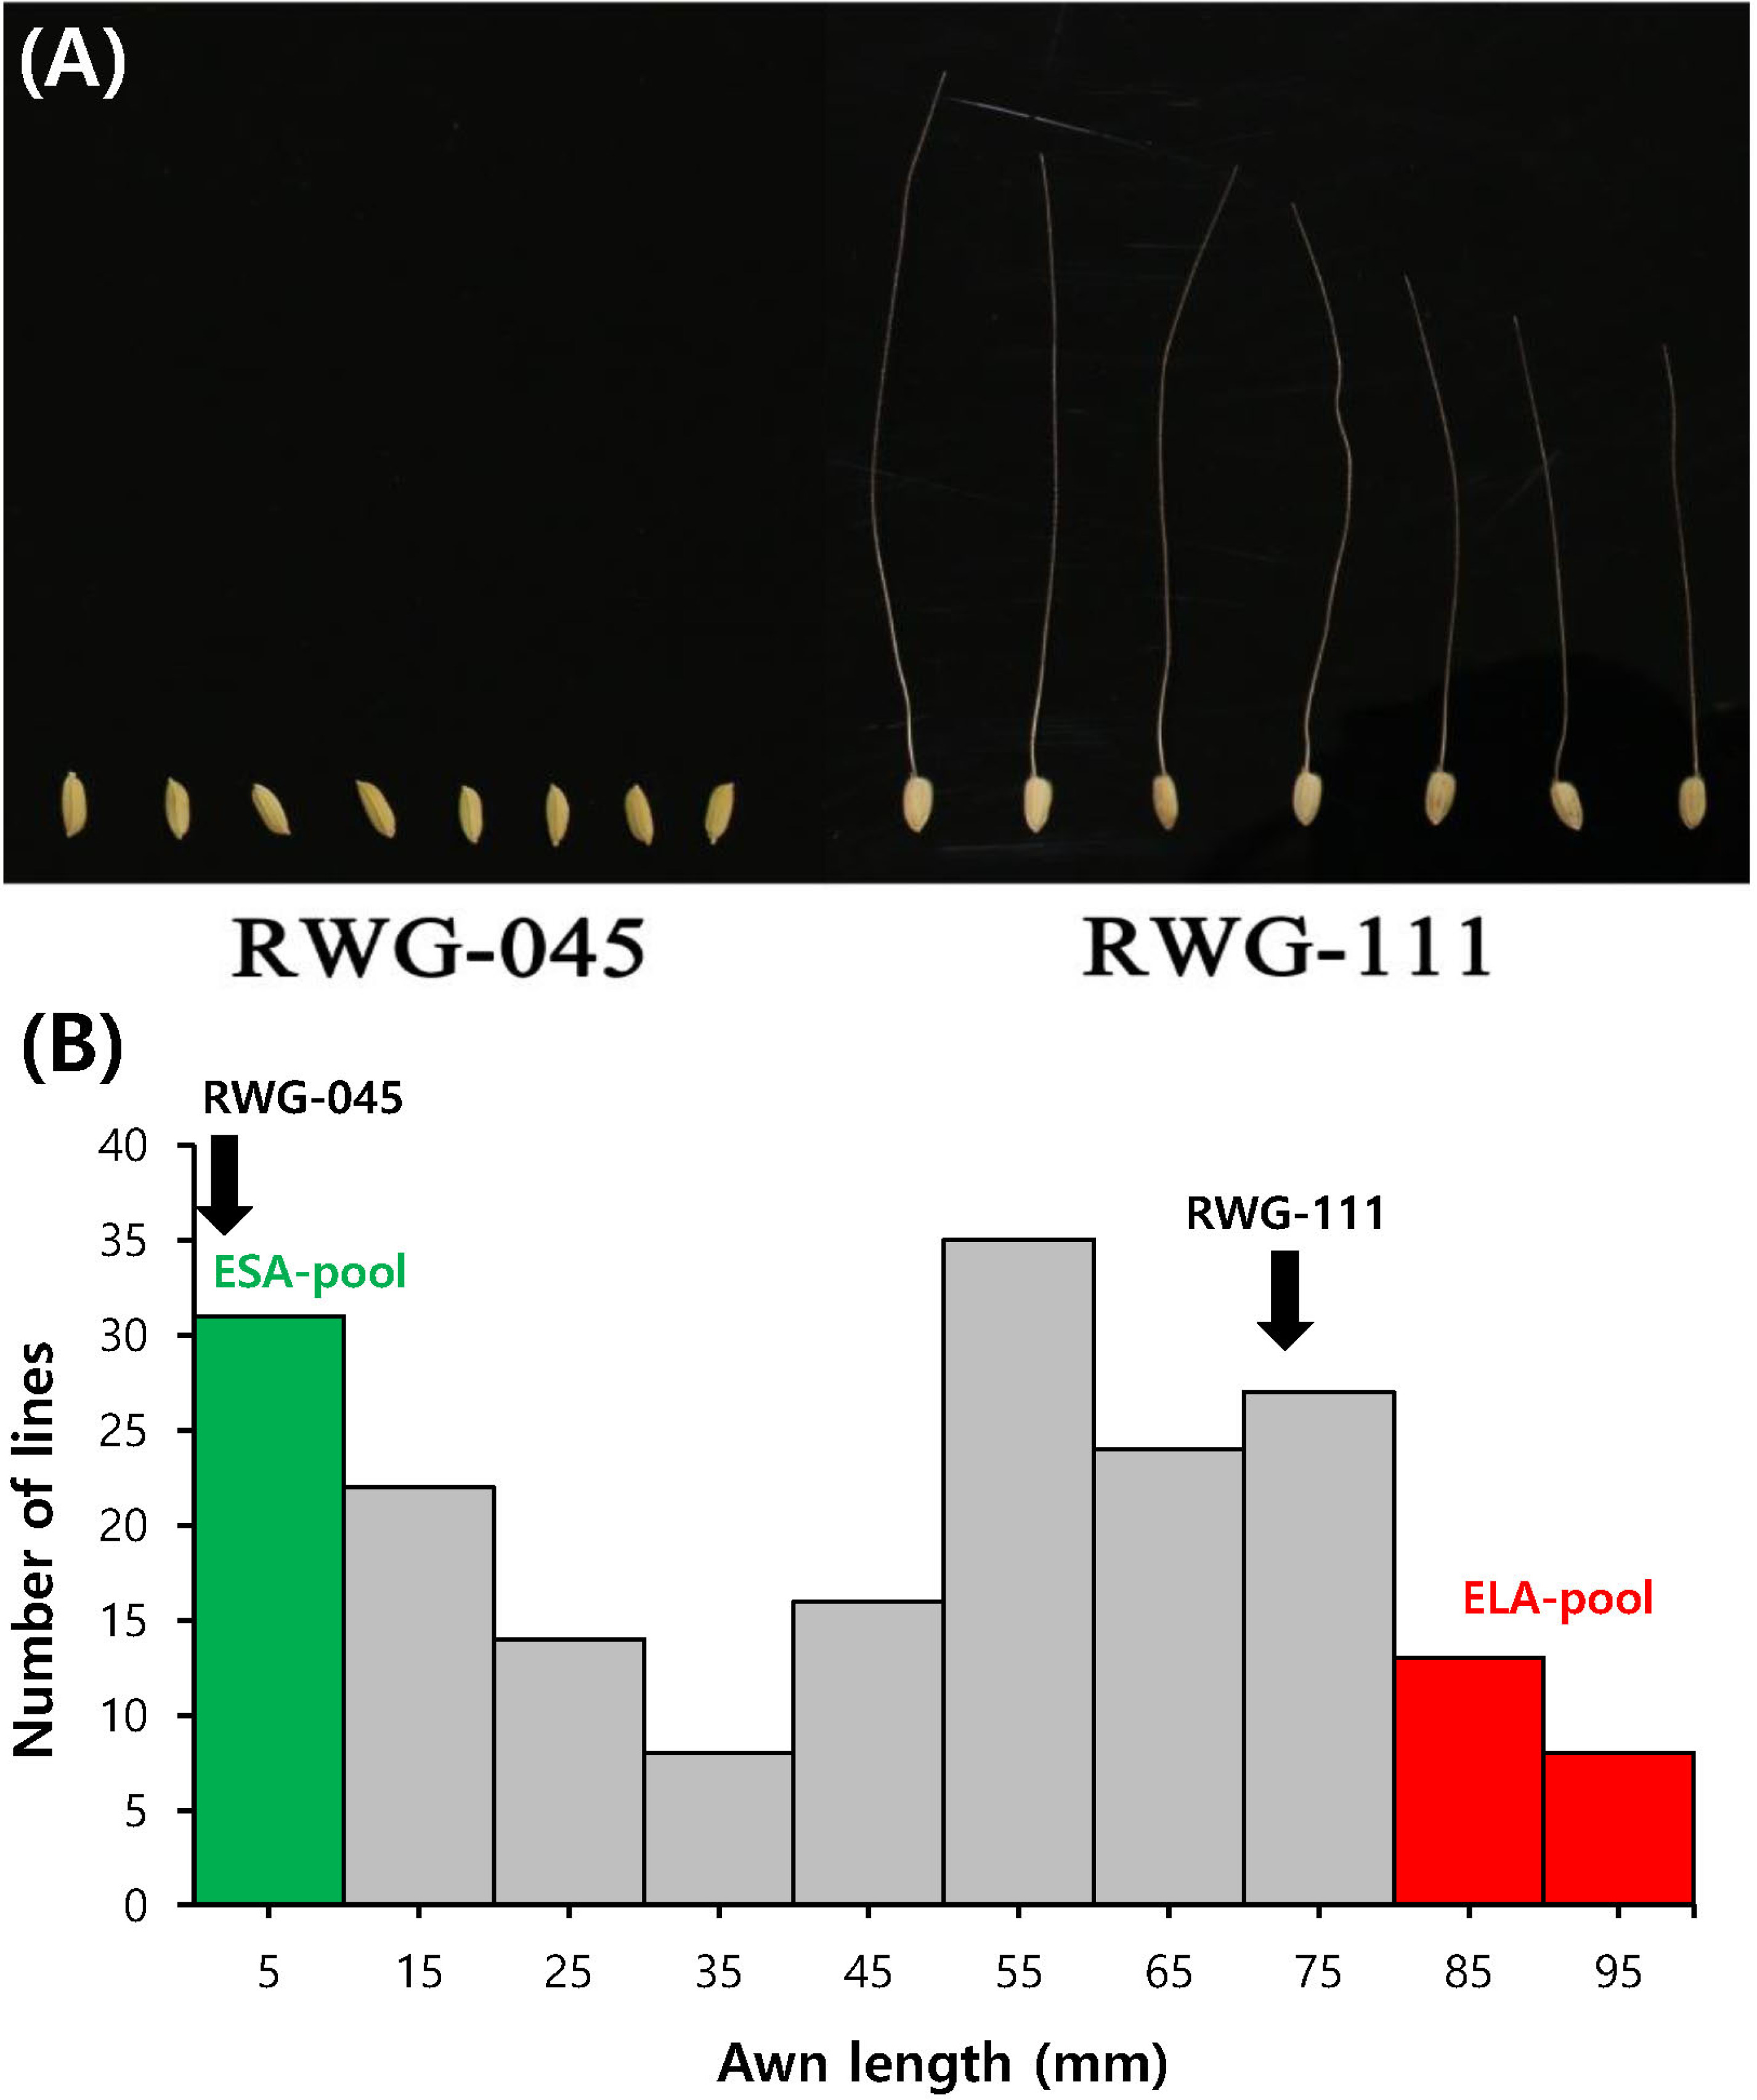
Fig. 2Single nucleotide polymorphism (SNP)-index charts. (A and B) SNP-index charts of awnless-pool (green), awned- pool (orange), and corresponding Δ(SNP-index) plots (blue) with 95-99% confidence interval borders of RWG-45 × RWG-111 for chromosome 4 (A) and chromosome 8 (B). Average values of Δ(SNP-index) are plotted with a 2 Mb sliding window and a 50 kb increment.

Fig. 3Sequence variation in an-1, awn-4, and Awn-4. The common variations among Nipponbare, RWG-45, and RWG-111 are indicated in this figure. Black bars represent introns and grey boxes represent coding regions. Bar = 1 kb.

Table 1Quantity of genome sequence obtained for each sample.
Table 1
Sample
ID |
Total
reads |
Total base |
GC
(%) |
AT
(%) |
Q20
(%) |
Q30
(%) |
Mapped
(%) |
Properly
paired (%) |
Unmapped
(%) |
Average
depth |
Genome
coverage (%) |
|
RWG-045 |
31,616,276 |
3,190,458,278 |
39.8 |
60.2 |
97.0 |
92.1 |
98.34 |
94.18 |
1.66 |
10X |
98.33 |
|
RWG-111 |
36,820,718 |
3,679,271,766 |
41.9 |
58.1 |
97.1 |
92.4 |
98.93 |
81.92 |
1.06 |
11X |
98.50 |
|
ESA-pool |
84,862,982 |
12,814,310,282 |
43.7 |
56.3 |
96.5 |
91.1 |
98.89 |
95.79 |
1.04 |
34X |
99.98 |
|
ELA-pool |
85,611,904 |
12,927,397,504 |
43.9 |
56.1 |
96.8 |
91.6 |
98.94 |
95.92 |
1.09 |
33X |
99.98 |
Table 2SNPs identified among two parents and two mixed pools.
Table 2
|
Type |
Number |
Ratio (%) |
|
SNP |
583,569 |
79.30 |
|
MNP |
0 |
0 |
|
INS |
75,284 |
10.23 |
|
DEL |
77,057 |
10.47 |
|
3’UTR |
11,772 |
0.97 |
|
5’UTR |
8,661 |
0.71 |
|
Downstream |
205,221 |
16.93 |
|
Exon |
22,380 |
14.52 |
|
Intergenic |
619,687 |
51.12 |
|
Intron |
51,482 |
4.25 |
|
Splice site acceptor |
75 |
0.01 |
|
Splice site donor |
81 |
0.01 |
|
Splice site region |
1,360 |
0.11 |
|
Transcript |
79,433 |
6.55 |
|
Upstream |
212,115 |
17.50 |
|
Missense |
10,208 |
54.32 |
|
Nonsense |
160 |
0.85 |
|
Silent |
8,425 |
44.83 |
Table 3QTLs associated with awn development identi-fied using QTL-seq.
Table 3
|
QTL name |
Chr. |
Start (Mb) |
End (Mb) |
Peak |
|
qAwn-4
|
4 |
12.8 |
20.3 |
‒0.6010 |
|
qAwn-8
|
8 |
22.3 |
27.2 |
‒0.4153 |
References
- Abebe T, Wise RP, Skadsen RW. 2009. Comparative tran-scriptional profiling established the awn as the major photosynthetic organ of the barley spike while the lemma and the palea primarily protect the seed. Plant Genome.. 2(3): https://doi.org/10.3835/plantgenome.2009.07.0019.
- Bessho-Uehara K, Wang DR, Furuta T, Minami A, Nagai K, Gamuyao R, et al. 2016. Loss of function at RAE2, a previously unidentified EPFL, is required for awnless-ness in cultivated Asian rice. Proc. Natl. Acad. Sci. U.S.A.. 113(32): 8969-8974. https://doi.org/10.1073/pnas.1604849113.
- Bin Rahman ANMRB, Zhang J. 2023. Trends in rice research: 2030 and beyond. Food Energy Secur.. 12(2): e390. https://doi.org/10.1002/fes3.390.
- Bommisetty R, Chakravartty N, Bodanapu R, Naik JB, Panda SK, Lekkala SP, et al. 2020. Discovery of genomic regions and candidate genes for grain weight employing next generation sequencing based QTL-seq approach in rice (Oryza sativa L.). Mol. Biol. Rep.. 47(11): 8615-8627. https://doi.org/10.1007/s11033-020-05904-7.
- Chen S, Zhou Y, Chen Y, Gu J. 2018. fastp: An ultra-fast all-in-one FASTQ preprocessor. Bioinformatics. 34(17): i884-i890. https://doi.org/10.1093/bioinformatics/bty560.
- Danecek P, Auton A, Abecasis G, Albers CA, Banks E, DePristo MA, et al. 2011. The variant call format and VCFtools. Bioinformatics. 27(15): 2156-2158. https:// doi.org/10.1093/bioinformatics/btr330.
- Elbaum R, Zaltzman L, Burgert I, Fratzl P. 2007. The role of wheat awns in the seed dispersal unit. Science. 316(5826): 884-886. https://doi.org/10.1126/science.1140097.
- Fuller DQ, Sato YI, Castillo C, Qin L, Weisskopf AR, Kingwell- Banham EJ, et al. 2010. Consilience of genetics and arch-aeobotany in the entangled history of rice. Archaeol. Anthropol. Sci.. 2(2): 115-131. https://doi.org/10.1007/s12520-010-0035-y.
- Gao Q, Wang H, Yin X, Wang F, Hu S, Liu W, et al. 2023. Identification of salt tolerance related candidate genes in 'sea rice 86' at the seedling and reproductive stages using QTL-Seq and BSA-Seq. Genes.. 14(2): Article 2. https://doi.org/10.3390/genes14020458.
- Gu B, Zhou T, Luo J, Liu H, Wang Y, Shangguan Y, et al. 2015. An-2 encodes a cytokinin synthesis enzyme that regulates awn length and grain production in rice. Mol. Plant.. 8(11): 1635-1650. https://doi.org/10.1016/j.molp.2015.08.001.
- Guo Z, Schnurbusch T. 2016. Costs and benefits of awns. J. Exp. Bot.. 67(9): 2533-2535. https://doi.org/10.1093/jxb/erw140.
- Hua L, Wang DR, Tan L, Fu Y, Liu F, Xiao L, et al. 2015. LABA1, a domestication gene associated with long, barbed awns in wild rice. Plant Cell.. 27(7): 1875-1888. https://doi.org/10.1105/tpc.15.00260.
- Huang X, Kurata N, Wei X, Wang ZX, Wang A, Zhao Q, et al. 2012. A map of rice genome variation reveals the origin of cultivated rice. Nature. 490(7421): Article 7421. https://doi.org/10.1038/nature11532.
- Jang SG, Lar SM, Zhang H, Lee AR, Lee JH, Kim NE, et al. 2020. Detection of whole-genome resequencing-based QTLs associated with pre-harvest sprouting in rice (Oryza sativa L.). Plant Breed. Biotechnol.. 8(4): 396-404. https://doi.org/10.9787/PBB.2020.8.4.396.
- Jin J, Hua L, Zhu Z, Tan L, Zhao X, Zhang W, et al. 2016. GAD1 encodes a secreted peptide that regulates grain number, grain length, and awn development in rice domestication. Plant Cell.. 28(10): 2453-2463. https://doi.org/10.1105/tpc.16.00379.
- Kim TS, He Q, Kim KW, Yoon MY, Ra WH, Li FP, et al. 2016. Genome-wide resequencing of KRICE_CORE re-veals their potential for future breeding, as well as func-tional and evolutionary studies in the post-genomic era. BMC Genom.. 17(1): 408. https://doi.org/10.1186/s12864-016-2734-y.
- Kovach MJ, Sweeney MT, McCouch SR. 2007. New insights into the history of rice domestication. Trends Genet.. 23(11): 578-587. https://doi.org/10.1016/j.tig.2007.08.012.
- Kumar R, Janila P, Vishwakarma MK, Khan AW, Manohar SS, Gangurde SS, et al. 2020. Whole-genome resequencing- based QTL-seq identified candidate genes and molecular markers for fresh seed dormancy in groundnut. Plant Biotechnol. J.. 18(4): 992-1003. https://doi.org/10.1111/pbi.13266.
- Lahari Z, Ribeiro A, Talukdar P, Martin B, Heidari Z, Gheysen G, et al. 2019. QTL-seq reveals a major root-knot nema-tode resistance locus on chromosome 11 in rice (Oryza sativa L.). Euphytica. 215(7): 117. https://doi.org/10.1007/s10681-019-2427-0.
- Li H, Durbin R. 2009. Fast and accurate short read alignment with Burrows-Wheeler transform. Bioinformatics. 25(14): 1754-1760. https://doi.org/10.1093/bioinformatics/btp324.
- Li H, Handsaker B, Wysoker A, Fennell T, Ruan J, Homer N, et al. 2009. The sequence alignment/map format and SAMtools. Bioinformatics. 25(16): 2078-2079. https://doi.org/10.1093/bioinformatics/btp352.
- Luo J, Liu H, Zhou T, Gu B, Huang X, Shangguan YZ, et al. 2013. An-1 encodes a basic helix-loop-helix protein that regulates awn development, grain size, and grain number in rice. Plant Cell.. 25(9): 3360-3376. https://doi.org/10.1105/tpc.113.113589.
- Maydup ML, Antonietta M, Guiamet JJ, Graciano C, López JR, Tambussi EA. 2010. The contribution of ear photo-synthesis to grain filling in bread wheat (Triticum aes-tivum L.). Field Crops Res.. 119(1): 48-58. https://doi.org/10.1016/j.fcr.2010.06.014.
- McKenna A, Hanna M, Banks E, Sivachenko A, Cibulskis K, Kernytsky A, et al. 2010. The genome analysis toolkit: a MapReduce framework for analyzing next-generation DNA sequencing data. Genom. Res.. 20(9): 1297-1303. https://doi.org/10.1101/gr.107524.110.
- Ntakirutimana F, Xie W. 2019. Morphological and genetic mechanisms underlying awn development in monocoty-ledonous grasses. Genes. 10(8): Article 8. https://doi.org/10.3390/genes10080573.
- Porebski S, Bailey LG, Baum BR. 1997. Modification of a CTAB DNA extraction protocol for plants containing high polysaccharide and polyphenol components. Plant Mol. Biol. Rep.. 15(1): 8-15. https://doi.org/10.1007/BF02772108.
- Sugihara Y, Young L, Yaegashi H, Natsume S, Shea DJ, Takagi H, et al. 2022. High-performance pipeline for MutMap and QTL-seq. PeerJ. 10: e13170. https://doi.org/10.7717/peerj.13170.
- Svizzero S, Ray A, Chakraborty D. 2019. Awn reduction and the domestication of Asian rice: A syndrome or crop improvement trait? Econ. Bot.. 73(4): 477-488. https://doi.org/10.1007/s12231-019-09465-0.
- Sweeney M, McCouch S. 2007. The Complex History of the Domestication of Rice. Ann. Bot.. 100(5): 951-957. https://doi.org/10.1093/aob/mcm128.
- Takagi H, Abe A, Yoshida K, Kosugi S, Natsume S, Mitsuoka C, et al. 2013. QTL-seq: Rapid mapping of quantitative trait loci in rice by whole genome resequencing of DNA from two bulked populations. Plant J.. 74(1): 174-183. https://doi.org/10.1111/tpj.12105.
- Takahashi N, Alterfa HAH, Sato T. 1986. Significant role of awn in rice plants. (1) A survey of agricultural value of rice awn. Significant Role of Awn in Rice Plants. (1) A Survey of Agricultural Value of Rice Awn. 35: 21-31.
- Toriba T, Hirano HY. 2014. The drooping leaf and OsETTIN2 genes promote awn development in rice. Plant J.. 77(4): 616-626. https://doi.org/10.1111/tpj.12411.
- Wang Y, Liu J, Meng Y, Liu H, Liu C, Ye G. 2021. Rapid identification of QTL for mesocotyl length in rice through combining QTL-seq and genome-wide association analysis. Front. Genet.. 12: https://www.frontiersin.org/articles/10.3389/fgene.2021.713446.
- Zhang Y, Zhang Z, Sun X, Zhu X, Li B, Li J, et al. 2019. Natural alleles of GLA for grain length and awn develop-ment were differently domesticated in rice subspecies japonica and indica. Plant Biotechnol. J.. 17(8): 1547-1559. https://doi.org/10.1111/pbi.13080.