Abstract
Spotted leaf mutants which produce necrotic lesions spontaneously are important sources to study programmed cell death in plant defense responses. A novel white-spotted leaf (wspl) mutant was induced from Ilpum, Korean japonica rice cultivar by the treatment of ethyl methane sulfonate (EMS). The phenotype of wspl mutant differed from that of other spotted leaf mutants in that not only brown spots but also white lesion mimic spots were observed on the tip of the leaves from the vegetative stage. Strong nitro blue tetrazolium (NBT) and 3, 3ʹ-diaminobenzidine (DAB) staining were observed on the older leaf of wspl mutant in microscopic reactive oxygen species (ROS) assay, and the chlorophyll content of wspl mutant maintained longer than wild-type in the old leaves. Genetic analysis revealed that the wspl mutant trait was controlled by a single recessive gene and the locus of wspl gene was mapped on the long arm of chromosome 5 between the flanking markers S05100 and S05112 (4.1 Mb). Through the combination of the genetic mapping and SNP analysis, two candidate genes for white-spotted leaf were identified in the genic region. A novel phenotype of white-spotted leaf mutant has not yet been reported, thus further study of the wspl mutant will contribute to understanding of the molecular mechanisms involved in lesion mimic phenotype in rice.
-
Key words: White-spotted leaf, ROS staining, Genetic mapping, Whole genome resequencing, Rice
INTRODUCTION
The spotted leaf or lesion mimic mutants develop spontaneous necrotic lesions without pathogen infections. The lesions of these mutants usually appear from the seedling to the tillering stage, whereas some of them are observed in the late growth stage, and the lesions generally have brownish color, such as reddish brown and dark brown (
Wu et al. 2008;
Huang et al. 2010). These phenotypes of cell necrosis in spotted leaf mutants are similar to programmed cell death (PCD) induced by the hypersensitive response (HR) at the infection site after pathogen recognition. Since the phenotypic similarity between lesion mimic and HR, the spotted leaf mutants are often called lesion mimic mutants (
Dietrich et al. 1994). PCD leads the rapid collapse of tissue to localize the pathogen by blocking it from the site of infection as a defense mechanism (
Dangl and Jones 2001;
Lorrain et al. 2004). In plants, PCD is involved in not only growth and developmental processes but defense responses against environmental stresses (
Williams and Dickman 2008). In addition, PCD is relevant to network of signaling pathways such as plant hormones, calcium, cyclic nucleotides and reactive oxygen species (ROS) (
Huysmans et al. 2017). The PCD associated with HR in plant-pathogen interaction has morphological similarities to animal apoptosis, which suggests that cell death mechanisms in plants may have points of similarity with animals that lead to defects in cellular level (
Elmore 2007).
In rice, more than 60 genes responsible for the spotted leaf or lesion mimic traits have been identified (
Wu et al. 2008;
Huang et al. 2010;
Shen et al. 2014). These genes mostly encodes proteins that regulate plant defense to pathogens and cell death. According to previous studies, spotted leaf or lesion mimic mutant genes of rice encode various functional proteins such as a heat stress transcription factor (HSF) protein (
Yamanouchi et al. 2002), U-box/armadillo (ARM) repeat protein (
Zeng et al. 2004), clathrin‐associated adaptor protein complex 1, medium subunit µ1 (AP1M1) (
Qiao et al. 2010), putative splicing factor 3b subunit 3 (SF3b3) (
Chen et al. 2012), eukaryotic translation elongation factor 1 alpha (eEF1A)-like protein (
Wang et al. 2017), ferredoxin-dependent glutamate synthase (Fd-GOGAT) (
Sun et al. 2017), mitogen-activated protein kinase kinase (MAPKKK) (
Lee et al. 2018), microtubule-interacting-and-transport (MIT) spastin protein (
Song et al. 2019). Recent studies have reported that lesion mimic or spotted leaf mutants are often associated with senescence. spotted leaf sheath (sles), lesion mimic and early senescence 1 (lmes1), spotted leaf4 (spl4), spotted leaf5 (spl5), spotted leaf28 (spl28), spotted leaf33 (spl33) mutants exhibited early senescence with lesion mimic spots on the leaf or leaf sheath in rice (
Qiao et al. 2010; Li et al. 2014; Jin et al. 2015;
Wang et al. 2017;
Lee et al. 2018;
Song et al. 2019). Most of the lesion mimic or spotted mutants associated with senescence were promoted their senescence process by mutation on the contrary, spl3 mutant was delayed senescence by impairing abscisic acid-responsive signaling (
Wang et al. 2015). These studies of the spl mutants and genes in rice indicate that multiple genetic mechanisms are involved in lesion mimic phenotypes.
In the present study, we identified and characterized a novel spotted leaf mutant, wspl in rice. In contrast to other spotted leaf or lesion mimic mutants which exhibited brown spots on leaves, white and brown spots were mixed up on the leaf in the wspl mutant. The phenotypic characterization and genetic analysis of wspl mutant will help us to elucidate the mechanism associated with white spotting on the leaf and PCD in rice.
MATERIALS AND METHODS
Plant materials and growth conditions
The white-spotted leaf (wspl) mutant was induced by the treatment of ethyl methane sulfonate (EMS) from Korean japonica cultivar, Ilpum. The mutant was selected from M2 generation and fixed in pure line by repeated selfing. All mutant and populations were grown in the experimental field and green house of Seoul National University in Suwon, Korea.
Characterization of the agronomic traits
Agronomic traits of the wspl mutant and wild-type plants were observed during various stages of development, and recorded for further analysis using SAS 9.2 (https://www. sas.com/). Agronomic traits, including heading date (HD), grain length (GL), grain width (GW), 1000 grain weight, grain fertility, culm length (CL), tiller number (TN), panicle number (PN), panicle length (PL) and panicle exsertion (PE) were evaluated in wspl mutant and wild-type plants. Ten plants of mutant and wild-type were evaluated for each agronomic traits.
Measurement of soil plant analysis development (SPAD) value
To verify the physiological characteristics of the white-spotted leaf mutant, the amount of chlorophyll present in plant leaves was measured using Minolta Chlorophyll Meter SPAD-502 (Minolta Camera Co., Japan). SPAD value was measured from the day of flowering until 20 days after flowering every five days in three spots (near the tip, basal half and near the basal) of flag leaf and the first leaf below the flag leaf from five plant replicates.
Detection of ROS accumulation of spotted leaf
The level of ROS accumulation was determined by a staining method previously described by
Mahalingam et al. (2006) with slight modifications. The upper three leaf blades on the main stem of the wspl mutant and wild type were used for staining. For superoxide anion (O2‒) detection, leaf samples were vacuumed (three cycles of 5 minutes each) and infiltrated in 0.5 mg/mL nitro blue tetrazolium (NBT) in 10 mM potassium phosphate buffer (pH 7.8) for 20 hours in the dark. Leaf samples were vacuum-infiltrated (three cycles of 5 minutes each) in 1 mg/mL 3, 3ʹ-diaminobenzidine (DAB) containing 10 mM MES (pH 6.5) for 22 hours in the dark to determine H2O2 level. Both reactions were performed until chlorophylls were completely removed, and then stopped reactions by transferring to 90% ethanol at 70℃. The cleared leaves were stored and photographed in 70% glycerol.
For genetic analysis,
wspl mutant were crossed with its wild-type plant, and F
2 populations were developed from the F
1. On the other hand, the mapping population was derived from the cross between mutant and Milyang23, and was used for genetic mapping. Bulked Segregant Analysis (BSA) strategy (
Michelmore et al. 1991) was conducted to determine the locus for
wspl trait. Each 10 mutant and 10 wild-type plants based on their phenotypes were selected from F
2 mapping populations. Equal concentration (50 ng/ mL) of DNA from individual plants which showed wild type and mutant type phenotype was pooled into two bulks, respectively. A total of 92 sequence tagged site (STS) markers of known chromosomal position throughout all chromosomes, which were designed in Crop Molecular Breeding Laboratory, Seoul National University (
Chin et al. 2007), were tested and then the linked markers were identified with these bulks. The candidate region was narrowed down with the additionally designed STS markers (
Table 1), based on the differences in sequences between the
japonica and
indica rice subspecies.
Genomic DNA was extracted from fresh young leaves using the modified CTAB method (
Murray and Thompson 1980). DNA sample was prepared by pooling DNAs (n = 20) from the F
2 progenies with the mutant phenotype derived from the cross between mutant and wild-type. DNA library for Illumina HiSeq2500 sequencing was constructed using a Truseq Nano DNA LT sample preparation kit (FC-121-4001). The qPCR was conducted using these libraries, and amplified clonal clusters were generated and performed paired-end sequencing using Illumina HiSeq2500 (250 cycles). Base calling was carried out by the Real Time Analysis (RTA) software.
To generate the Ilpum sequence as a reference, 173 million of Ilpum sequence reads at KOBIC (www.kobic.re. kr, No. 2013-10000-3) were aligned to the Nipponbare reference genome (build 5 genome sequence;
https://rgp.dna.affrc.go.jp/E/IRGSP/Build5/build5.html) using BWA (Bur rows-Wheeler Aligner) software (
Li and Durbin 2009). The Ilpum reference sequence was constructed by replacing Nipponbare nucleotides with the nucleotides of Ilpum at the 225,249 SNP positions that were identified between Nipponbare and Ilpum. Subsequently, 75 million paired-end short reads from the mutant type of F
2 bulked DNA were obtained, and filtered by phred quality score. The filtered and equalized short reads were aligned to Ilpum reference sequence using BWA software. The alignment data were converted to SAM/BAM files using SAMtools (
Li et al. 2009), and low-quality SNPs were removed with a Coval software (
Kosugi et al. 2013). After SNPs calling, causal SNPs and InDels involved in phenotype of mutant were detected by following modified MutMap method (
Abe et al. 2012): ⅰ) remove the same SNPs and InDels in wild-type and mutant; ⅱ) remove the common SNPs and InDels shared by at least two lines; ⅲ) calculate SNP index; ⅳ) pick homozygous SNPs and InDels (SNP index = 1) located in annotated gene region. SNP index is the ratio between the number of reads of a mutant SNP and the total number of reads at the each position.
RESULTS
Morphological characterization of wspl mutant
Brown spots or lesion mimics started to appear on the leaves near the tip of the mutant plant from the 5th leaf stage, and the spots increased from the tip to the basal part of the leaf with growth. Unlike other spl mutants, white spots were observed together with the brown spots in
wspl mutant at the late tillering stage. As they grew, both spots showed more clearly on the bottom leaves than upper leaves in the mutant plant (
Fig. 1B, C). Lesion formation became more severe at the heading stage, the tip of leaves began to lighten up and turned yellow toward the basal at the heading stage in
wspl mutant. However, the
wspl mutant displayed dark green leaf and leaf sheath across the entire life of plant except for leaf tips (
Fig. 1A).
Most of the agronomic traits of the
wspl mutant were similar to those of the wild-type. However, the CL of wspl mutant was significantly shorter, and TN and PN were significantly less than those of the wild-type, Ilpum. No significant differences were observed in PL and PE (
Fig. 2A). Leaf length and width were not severely reduced in
wspl mutant compared to the wild-type; however, significant difference was observed in the width of the first leaf in
wspl mutant (
Fig. 2B, C). For grain related agronomic traits, as shown in
Table 2, the significant difference was observed in 1000-grain weight which was decreased in
wspl mutant, whereas GL, GW, and fertility of the
wspl mutant were similar to those of the wild-type.
To establish the relation between spots and degree of chlorophyll content, SPAD values were measured in
wspl mutant and wild-type plants. SPAD value, indirect indicator of chlorophyll content, of the
wspl mutant plant was slightly higher than that of wild-type in both flag leaf and the first leaf (
Fig. 3A). In addition, although the lesions expanded more on the leaf, SPAD values on the leaves of
wspl mutant slightly decreased than wild-type on the first leaf (
Fig. 3B). These results indicate that
wspl mutant leaves naturally have higher chlorophyll content compared to the wild-type and the destruction of chlorophylls was not accelerated by the emergence of lesions.
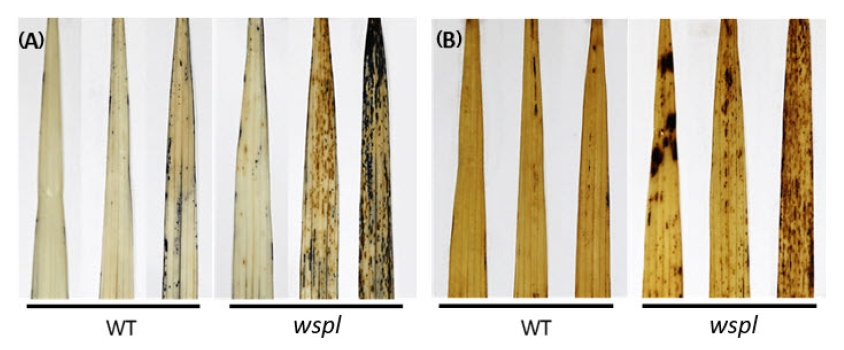
NBT and DAB historical staining were applied to determine ROS formation. Strong NBT staining, an indicator of superoxide anion (O
2
‒) accumulation, was observed in the second leaf below the flag leaf, whereas there was negligible difference in NTB staining of the flag leaf between
wspl mutant and wild-type (
Fig. 4A). Similar results were obtained with DAB staining, which indicated H
2O
2 accumulation. The older leaves, the thicker DAB staining was observed (
Fig. 4B). These results indicate that the lesion formation on the
wspl mutant leaf is strongly correlated with ROS accumulation.
F<sub>1</sub> plant derived from the cross between the <italic>wspl</italic> mutant and its wild-type, Ilpum showed the wild-type phenotype. In the F<sub>2</sub> population, segregation ratio of phenotype between the wild-type and the mutant-type was 3:1 suggesting that white-spotted leaf trait is controlled by a single recessive gene (
Table 3).
To determine the physical location of the
wspl gene, bulked segregant analysis (BSA) was performed using F
2 population derived from the cross between the
wspl mutant and Milyang23 and revealed that two flanking markers, S05080a and S05112 on the long arm of chromosome 5 were linked with the white-spotted leaf trait (
Fig. 5A). To narrow down the position of the
wspl locus, six additional STS markers (Table 1), which were located between two flanking markers were designed based on the variation of genome sequence from available databases (
http://www.ncbi.nih.gov/ and
http://www.rgp.dna.affrc.go.jp/). Of the 175 progenies, there were five recombinants between S05100 and S05112, and the flanking region was narrowed down up to 4.1 Mb (
Fig. 5B-D).
SNP and MutMap analysis were performed to identify the candidate gene and causal SNP position rapidly using whole-genome sequencing data of Ilpum and bulked F
2 progenies displaying the mutant phenotype. The bulked F
2 progenies DNA sequence reads were aligned to the Ilpum reference sequence, then we calculated the SNP index of each SNP position and generated SNP index plots. As shown in
Fig. 6, the average SNP index peak was detected from 22.18 Mb to 25.58 Mb on chromosome 5, suggesting that this locus is the most probable region for the candidate gene. Combining the results of MutMap analysis and brief genetic mapping, we identified two homozygous SNPs with an SNP index of 0.9 to 1 in the genic region within the candidate region based on Rice Genome Annotation Project database (
http://rice.plantbiology.msu.edu/) (
Table 4). There were two predicted genes,
LOC_Os05g0482400 and
LOC_Os05g0490000 harboring homozygous SNPs in the coding region. Among the candidate genes,
Os05g0482400 encodes Cytochrome P450 family protein and
Os05g0490000 encodes KRR1 interacting protein 1 domain containing protein. Further studies will be needed to validate the gene affecting white-spotted leaf in rice.
DISCUSSION
Spots or lesion mimics show various phenotypic class. Diverse color and size of lesions have been reported, and the time and conditions of lesions appearance are different in the mutants (
Lorrain et al. 2003). In this study, we identified a novel white-spotted leaf (
wspl) mutant induced by EMS treatment from Ilpum.
wspl mutant was genetically controlled by a single recessive gene located on the long arm of chromosome 5. Unlike other spl mutants re ported previously, the
wspl mutant has a unique color of lesion on the leaves. The white spots showed together with brown spots in
wspl mutant. The white spots/lesions were not observed in the young leaves but increased in number as the leaves matured (
Fig. 1B, C).
spl20 is the only spl mutant which has small and white spots or lesion mimics reported in rice so far.
spl20 mutant was identified from the fast neutron treated mutant lines of the
indica cultivar IR64, and small and white dots on the leaves appeared about two weeks after sowing but usually became inconspicuous later (
Wu et al. 2008).
spl20 mutant has white lesions only, while
wspl mutant mixed up white and brown spots on the leaves. In addition, the lesions lasted until late growth stage in
wspl mutant, whereas the white lesions were vanished after tillering stage in
spl20 mutant. Different phenotype of the spotted leaf mutants which have white spots suggests that lesion mimics are caused by genes involved in different biological processes, and
wspl mutant would be a useful source for dissecting the mechanism of programmed cell death related to spots or lesion mimics.
Using SPAD value, we measured the chlorophyll content in the leaves of
wspl mutant and wild-type. Interestingly, the chlorophyll content was higher in
wspl mutant leaves than that of the wild-type, and
wspl mutant leaf maintained higher chlorophyll content compared to wild-type at the flag leaf and the first leaf below the flag leaf (
Fig. 3). Despite the density of lesion mimics being higher in the first leaf than flag leaf, the difference of chlorophyll content between
wspl mutant and wild-type was greater in the first leaf. However, in most previous studies, the chlorophyll content was decreased in the leaves of spl or lesion mimic mutants. Moreover, these mutants were strongly relate to the early senescence phenotype in mutant leaves which may be caused by the formation of spots (
Xu et al. 2014;
Sun et al. 2017;
Lee et al. 2018). As shown in
Fig. 1A, the
wspl mutant exhibited dark green color in the leaf and leaf sheath compared to wild-type, and leaf senescence was delayed until late growth stage, except for the tip of the leaves, although the spots or lesion mimics were dispersed on the leaves. We assume that “stay green-like” character of
wspl mutant might contribute to maintain high level of chlorophyll contents in the leaves. In addition, several lesion mimic mutants are defect in chlorophyll biosynthesis or degradation result in abnormal accumulation of photoreactive molecules and ROS production (
Bruggeman et al. 2015). Defects in chlorophyll catabolic pathway is also able to lead to cell death. For example, disruption of enzymes involved in the degradation of chlorophyll generates spontaneous lesions. (
Mach et al. 2001;
Tanaka et al. 2003). These studies indicate that regulation of chlorophyll biosynthesis and degradation is essential to cell survival or death. Further studies are needed to elucidate the relationship between chlorophyll contents and the spotted leaf phenotype in rice.
In this study, we identified and characterized the white-spotted leaf rice mutant. Further studies including cloning and the functional study of wspl mutant gene are needed to be performed, and will help expanding the knowledge of programmed cell death and defense mechanism in rice.
ACKNOWLEDGEMENTS
This study was supported by a grant from the Next-Generation BioGreen 21 Program (No. PJ013165) of the Rural Development Administration, Korea.
Fig. 1Morphological comparisons between wild-type and wspl mutant plants. Plant of (A) wild-type (left) and wspl mutant (right) at the ripening stage (bar = 20 cm). (B) Lesion mimic phenotype of wild-type. (C) Lesion mimic phenotype of wspl mutant; first (left), second (middle), third (right) leaves from the top of wild-type and wspl mutant at the late vegetative stage.
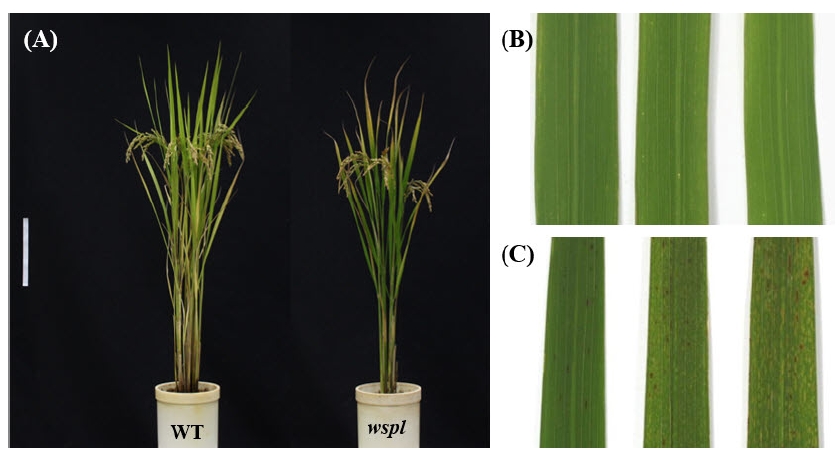
Fig. 2Comparison of the agronomic traits between wild-type and wspl mutant. Comparison of the (A) culm length (CL), tiller number (TN), panicle number (PN), panicle length (PL), panicle exsertion (PE), (B) leaf length and (C) leaf width of flag leaf and the first leaf below the flag leaf of wild-type and wspl. Error bar represents SD (n > 10) and statistically calculated by Student’s t-test (*, ** stand for significant at the 0.05 and 0.01 probability levels, respectively).
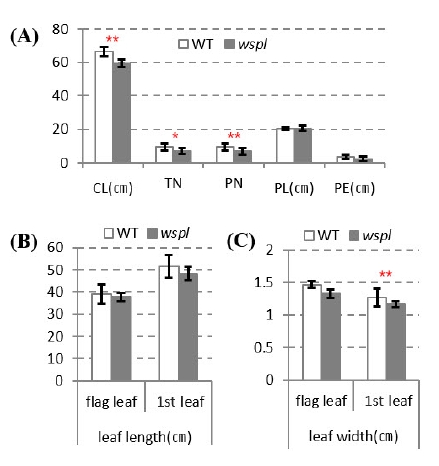
Fig. 3Comparison of the chlorophyll contents using SPAD. Chlorophyll contents in (A) flag leaf and (B) the first leaf below the flag leaf of wild-type and wspl mutant. SPAD value were measured at the indicated times after flowering (DAF, days after flowering). Data show means and SD of biological replicates (n > 5).
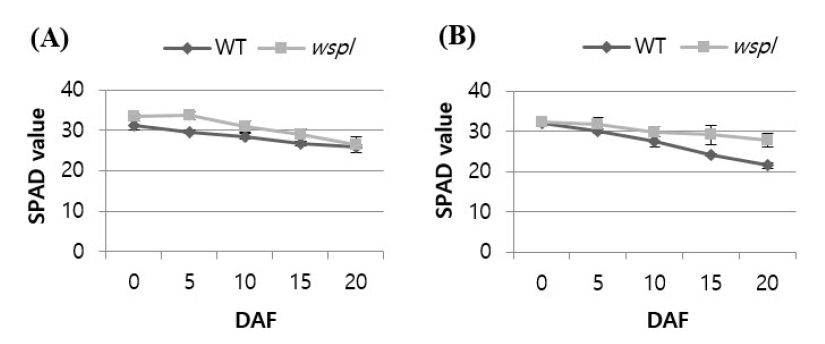
Fig. 4ROS staining in the wspl mutant and wild-type leaf. ROS staining using the flag leaf (left), the first (middle), and the second (right) leaves below the flag leaf of wild-type and wspl mutant at heading stage. (A) NBT staining, (B) DAB staining.

Fig. 5Bulked segregant analysis, and genetic and physical maps of the containing wspl locus. (A) The two flanking markers, S05080a and S05112 determined by bulked segregant analysis (BSA) from F2 population; 1: wspl, 2: Milyang23, 3, 4: Mutant type bulks, 5, 6: Wild-type bulks. (B) Primary mapping of wspl locus on the long arm of chromosome 5 between S05080a and S05112. (C) Fine mapping of candidate region using additional STS markers. (D) Graphical genotype results of the fine mapping. W: Wild type, M: Mutant type, H: heterozygous type.
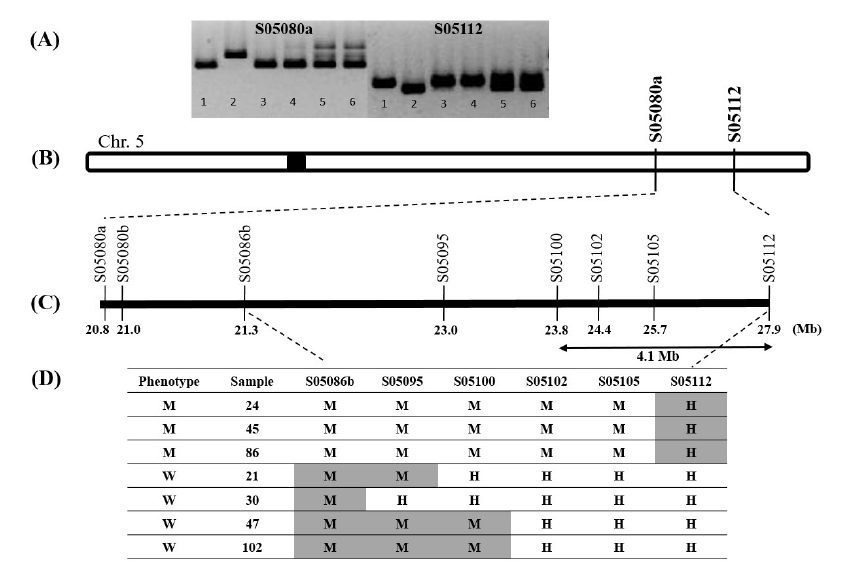
Fig. 6SNP index plot of chromosome 5 for identification of genomic regions harboring the causal mutation of wspl gene. Blue dots indicate SNP index values at a given SNP position. Red line represents the sliding window average of SNP index values of the 4 Mb interval with 10 kb increments. Green line shows the sliding window average of 95% confidence interval. Orange line shows the sliding window average of 99% confidence interval. Blue shaded area indicates the region presumably harboring the causal mutation.
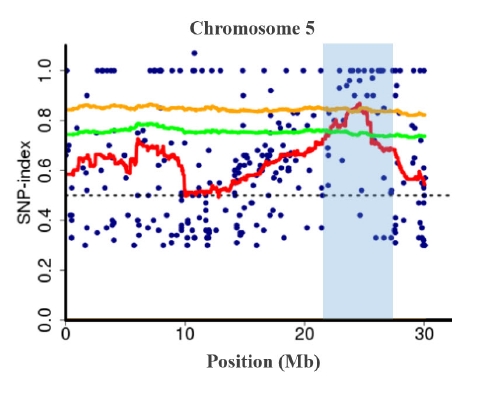
Table 1PCR-based molecular markers designed for fine mapping.
Table 1
|
Marker |
Forward primer (5ʹ → 3ʹ) |
Reverse primer (5ʹ → 3ʹ) |
Physical Position (Build5) |
|
S05080a |
TGGCCAACTTTGGGAATTTA |
AAGAGTCGTGCAAATGAAAAGA |
20804350 - 20804578 |
|
S05080b |
ACTTCATGCAGCCCACGTA |
CACGAGCTCTCCTCCAAGAC |
21003920 - 21004165 |
|
S05086b |
CGTTTGATCGTTCAGTTTCG |
GATTTTGCCGCTAGCTGACT |
21295727 - 21295971 |
|
S05095 |
AGGCAGCAAGAGCATACCAT |
CACTTGACCCTTGCAGGAAT |
22968727 - 22968913 |
|
S05100 |
CACATTTGACAATATGGGCC |
TCAGATTTACGTGGGTGTTT |
23767244 - 23767356 |
|
S05102 |
GGGCTGATATGTTCCTCGAA |
TCAAGAGGAGACCATAACCATTG |
24396221 - 24396397 |
|
S05105 |
TGGCGTCCAAGAAGTAGGTC |
TCTCTTGAAATCAACCCATCAA |
25704179 - 25704411 |
|
S05112 |
GCGCTCTTACCACATCAAGA |
GTTGAGTGAAGCAGCGAATG |
27884417 - 27884596 |
Table 2Comparison of grain related agronomic traits between wild-type and wspl mutant.
Table 2
|
|
HD |
GL (mm) |
GW (mm) |
1000 grain weight (g) |
Grain fertility (%) |
|
Wild-type |
24-Aug |
5.53 ± 0.18 |
3.33 ± 0.15 |
25.97 ± 0.09 |
82.15 ± 7.98 |
|
wspl
|
20-Aug |
5.58 ± 0.10 |
3.37 ± 0.05 |
21.12 ± 0.32**
|
85.64 ± 5.46 |
Table 3Genetic segregation of wspl mutant in F2 population developed from the cross between the wspl mutant and its wild-type, Ilpum.
Table 3
|
Total |
Wild type |
Mutant type |
c2 (3:1) (P = 0.05, c2 = 3.841) |
|
190 |
148 |
42 |
0.085 |
Table 4Candidate genes and SNPs position in candidate region for wspl trait.
Table 4
|
Position |
Status |
Reference |
Query |
Region |
Gene ID (RAP-DB/MSU) |
Description |
|
23834064 |
Difference |
C |
T |
CDS |
Os05g0482400 |
Os05g40384 |
Cytochrome P450 family protein |
|
24174423 |
Difference |
C |
T |
CDS |
Os05g0490000 |
Os05g41100 |
KRR1 interacting protein 1 domain containing protein |
References
Reference
- Abe A, Kosugi S, Yoshida K, Natsume S, Takagi H, Kanzaki H, et al. 2012. Genome sequencing reveals agronomically important loci in rice using. MutMap. Nat. Biotechnol.. 30: 174-178.
- Bruggeman Q, Raynaud C, Benhamed M, Delarue M. 2015. To die or not to die? Lessons from lesion mimic mutants. Front. Plant Sci.. 6: 24
- Chen XF, Hao L, Pan JW, Zheng XX, Jiang GH, Jin Y, et al. 2012.
SPL5, a cell death and defense-related gene, encodes a putative splicing factor 3b subunit 3 (SF3b3) in rice. Mol. Breed.. 30: 939-949.
- Chin JH, Kim JH, Jiang W, Chu SH, Woo MO, Han L, et al. 2007. Identification of subspecies-specific STS markers and their association with segregation distortion in rice (Oryza sativa L.). J. Crop Sci. Biotech.. 10: 175-184.
- Dangl JL, Jones JDG. 2001. Plant pathogens and integrated defence responses to infection. Nature. 411: 826-833.
- Dietrich RA, Delaney TP, Uknes SJ, Ward ER, Ryals JA, Dangl JL. 1994. Arabidopsis mutants simulating disease resistance response. Cell. 77: 565-577.
- Dietz KJ, Turkan I, Krieger-Liszkay A. 2016. Redox-and reactive oxygen species-dependent signaling into and out of the photosynthesizing chloroplast. Plant Physiol.. 171: 1541-1550.
- Elmore S. 2007. Apoptosis: a review of programmed cell death. Toxicol. Pathol.. 35: 495-516.
- Gill SS, Tuteja N. 2010. Reactive oxygen species and antioxidant machinery in abiotic stress tolerance in crop plants. Plant Physiol. Biochem.. 48: 909-930.
- Huang HL, Ullah F, Zhou DX, Yi M, Zhao Y. 2019. Mechanisms of ROS regulation of plant development and stress responses. Front. Plant Sci.. 10: 800
- Huang QN, Yang Y, Shi YF, Chen J, Wu JI. 2010. Spotted-leaf mutants of rice (Oryza sativa). Rice Sci.. 17: 247-256.
- Huang SB, Van Aken, Schwarzlander M, Belt K, Millar AH. 2016. The roles of mitochondrial reactive oxygen species in cellular signaling and stress response in plants. Plant Physiol.. 171: 1551-1559.
- Huysmans M, Lema AS, Coll NS, Nowack MK. 2017. Dying two deaths -programmed cell death regulation in development and disease. Curr. Opin. Plant Biol.. 35: 37-44.
- Jabs T, Dietrich RA, Dangl JL. 1996. Initiation of runaway cell death in an Arabidopsis mutant by extracellular superoxide. Science. 273: 1853-1856.
- Jin B, Zhou XR, Jiang BL, Gu ZM, Zhang PH, Qian Q, et al. 2015. Transcriptome profiling of the spl5 mutant reveals that SPL5 has a negative role in the biosynthesis of serotonin for rice disease resistance. Rice (N. Y.). 8: 18
- Kosugi S, Natsume S, Yoshida K, Maclean D, Cano L, Kamoun S, et al. 2013. Coval: improving alignment quality and variant calling accuracy for next-generation sequencing data. PLoS One. 8: e75402.
- Lee D, Lee G, Kim B, Jang S, Lee Y, Yu Y, et al. 2018. Identification of a spotted leaf sheath gene involved in early senescence and defense response in rice. Front. Plant Sci.. 9: 1274
- Li H, Durbin R. 2009. Fast and accurate short read alignment with Burrows-Wheeler transform. Bioinformatics. 25: 1754-1760.
- Li H, Handsaker B, Wysoker A, Fennell T, Ruan J, Homer N, et al. 2009. The Sequence Alignment/Map format and SAMtools. Bioinformatics. 25: 2078-2079.
- Li Z, Zhang YX, Liu L, Liu QE, Bi ZZ, Yu N, et al. 2014. Fine mapping of the lesion mimic and early senescence 1 (lmes1) in rice (Oryza sativa). Plant Physiol. Biochem.. 80: 300-307.
- Lorrain S, Lina BQ, Auriac MC, Kroj T, Saindrenan P, Nicole M, et al. 2004. Vascular associated death1, a novel gram domain-containing protein, is a regulator of cell death and defense responses in vascular tissues. Plant Cell. 16: 2217-2232.
- Lorrain S, Vailleau F, Balaque C, Roby D. 2003. Lesion mimic mutants: keys for deciphering cell death and defense pathways in plants? Trends Plant Sci.. 8: 263-271.
- Mach JM, Castillo AR, Hoogstraten R, Greenberg JT. 2001. The Arabidopsis-accelerated cell death gene ACD2 encodes red chlorophyll catabolite reductase and suppresses the spread of disease symptoms. Proc. Natl. Acad. Sci. U.S.A.. 98: 771-776.
- Mahalingam R, Jambunathan N, Gunjan SK, Faustin E, Weng H, Ayoubi P. 2006. Analysis of oxidative signalling induced by ozone in Arabidopsis thaliana
. Plant Cell Environ.. 29: 1357-1371.
- Michelmore RW, Paran I, Kesseli RV. 1991. Identification of markers linked to disease-resistance genes by bulked segregant analysis: a rapid method to detect markers in specific genomic regions by using segregating populations. Proc. Natl. Acad. Sci. U.S.A.. 88: 9828-9832.
- Mittler R. 2017. ROS are good. Trends Plant Sci.. 22: 11-19.
- Murray MG, Thompson WF. 1980. Rapid isolation of high molecular-weight plant DNA. Nucleic Acids Res.. 8: 4321-4325.
- Parent C, Capelli N, Dat J. 2008. Reactive oxygen species, stress and cell death in plants. C. R. Biol.. 331: 255-261.
- Qiao Y, Jiang W, Lee J, Park B, Choi MS, Piao R, et al. 2010. SPL28 encodes a clathrin-associated adaptor protein complex 1, medium subunit mu 1 (AP1M1) and is responsible for spotted leaf and early senescence in rice (Oryza sativa). New Phytol.. 185: 258-274.
- Sandalio LM, Romero-Puertas MC. 2015. Peroxisomes sense and respond to environmental cues by regulating ROS and RNS signalling networks. Ann. Bot.. 116: 475-485.
- Shen HC, Shi YF, Feng BH, Wang HM, Xu X, Huang QN, et al. 2014. Identification and genetic analysis of a novel rice spotted-leaf mutant with broad-spectrum resistance to Xanthomonas oryzae pv. oryzae
. J. Intergr. Agric.. 13: 713-721.
- Song G, Kwon CT, Kim SH, Shim Y, Lim C, Koh HJ, et al. 2019. The rice SPOTTED LEAF4 (SPL4) encodes a plant spastin that inhibits ROS accumulation in leaf development and functions in leaf senescence. Front. Plant Sci.. 9: 1925
- Sun LT, Wang YH, Liu LL, Wang CM, Gan T, Zhang ZY, et al. 2017. Isolation and characterization of a spotted leaf 32 mutant with early leaf senescence and enhanced defense response in rice. Sci. Rep.. 7: 41846
- Tanaka R, Hirashima M, Satoh S, Tanaka A. 2003. The Arabidopsis-accelerated cell death gene ACD1 is involved in oxygenation of pheophorbide a: inhibition of the pheophorbide a oxygenase activity does not lead to the "Stay-Green" phenotype in Arabidopsis. Plant Cell Physiol.. 44: 1266-1274.
- Tsukagoshi H, Busch W, Benfey PN. 2010. Transcriptional regulation of ROS controls transition from proliferation to differentiation in the root. Cell. 143: 606-616.
- Wang SA, Lei CL, Wang JL, Ma J, Tang S, Wang CL, et al. 2017. SPL33, encoding an eEF1A-like protein, negatively regulates cell death and defense responses in rice. J. Exp. Bot.. 68: 899-913.
- Wang SH, Lim JH, Kim SS, Cho SH, Yoo SC, Koh HJ, et al. 2015. Mutation of SPOTTED LEAF3 (SPL3) impairs abscisic acid-responsive signalling and delays leaf senescence in rice. J. Exp. Bot.. 66: 7045-7059.
- Williams B, Dickman M. 2008. Plant programmed cell death: can't live with it; can't live without it. Mol. Plant Pathol.. 9: 531-544.
- Wu CJ, Bordeos A, Madamba MRS, Baraoidan M, Ramos M, Wang GL, et al. 2008. Rice lesion mimic mutants with enhanced resistance to diseases. Mol. Genet. Genomics. 279: 605-619.
- Xu X, Zhang LL, Liu BM, Ye YF, Wu YJ. 2014. Characterization and mapping of a spotted leaf mutant in rice (Oryza sativa). Genet. Mol. Biol.. 37: 406-413.
- Yamanouchi U, Yano M, Lin HX, Ashikari M, Yamada K. 2002. A rice spotted leaf gene, SpI7, encodes a heat stress transcription factor protein. Proc. Natl. Acad. Sci. U.S.A.. 99: 7530-7535.
- Zeng LR, Qu SH, Bordeos A, Yang CW, Baraoidan M, Yan HY, et al. 2004. Spotted leaf11, a negative regulator of plant cell death and defense, encodes a U-box/armadillo repeat protein endowed with E3 ubiquitin ligase activity. Plant Cell. 16: 2795-2808.