Abstract
The objective of this study was to develop high-throughput SNP or SNP-based markers by re-sequencing of two peanut cultivars, ‘K-Ol’ and ‘Pungan’. The whole genome re-sequencing for the two cultivars was performed to produce sequences of 35.3 × 10⁹ bp with 350 × 106 reads and 32.0 × 10⁹ bp with 318 × 106 reads, respectively. As compared with the peanut reference genome, the distribution of homozygous and heterozygous SNPs on each chromosome showed very similar patterns between ‘K-Ol’ and ‘Pungan’, and most of them were in intergenic-region regardless of the peanut cultivars and reference genome type. The SNPs identified between the two peanut cultivars were evenly distributed across chromosomes of peanut diploid A and B reference genomes. It indicated that these SNPs could be available to construct a genetic map using the segregating population derived from a cross between ‘K-Ol’ and ‘Pungan’. Total 61 CAPS marker were developed and tested for their availability. Of the CAPS markers, 60 CAPS markers produced normal PCR products and 18 out of them presented polymorphism among 6 peanut varieties. Results of the present study could provide useful genetic resources to facilitate marker-assisted selection for breeding programs as well as germplasm screening for peanut.
-
Key words: Molecular marker, Peanut, Polymorphism, Resequencing, SNP
INTRODUCTION
Peanut (
Arachis hypogaea L.), also called groundnut, is a grain legume crop, which is widely cultivated in tropical and subtropical regions in more than 100 countries. Peanut has been used as a major source of vegetable protein and oil with high percentage of unsaturated fatty acid including oleic acid (
Moore and Knauft 1989;
Zhou et al. 2014).
Peanut is an allotetraploid (AABB; 2n = 4x = 40) derived from a single recent hybridization event between two diploid species,
A. duranensis (A genome) and
A. ipaensis (B genome) followed by polyploidization. Cultivated peanut has a large genome size (2,800 Mb/1C) and genome sizes of two donor diploid species composing cultivated peanut are 1.25 Gb for
A. duranensis and 1.56 Gb for
A. ipaensis, respectively (
Kochert et al. 1996;
Moretzsohn et al. 2013). Especially, a sum of genome size of the two donor species is almost similar with that of cultivated peanut, indicating there have been few changes in genome size since the polyploidization as well as cultivation (
Bertioli et al. 2016). Different from other polyploid species, peanut has very low genetic diversity because the single recent polyploidization caused significant decrease in genetic diversity. Because of its monomorphic genetic characteristics, the development of molecular markers and genetic maps for molecular breeding programs for peanut has been a formidable task (
Gautami et al. 2012;
Zhou et al. 2014).
During the last decade, there have been significant advances in next generation sequencing technology (NGS) and cost for sequencing has been dramatically decreased. In addition, it is true that productivity and accuracy of sequencing data have been innovatively improved. Especially, whole genome study using
de nove assembly, re-sequencing, and several bioinformatics approaches enables to produce large numbers of single nucleotide polymorphism (SNP) and simple sequence repeat (SSR) in complex genome (
Yang et al. 2012;
Lee et al. 2015;
Bertioli et al. 2016;
Kang et al. 2016).
Genomics-assisted breeding (GAB) using large genomic data associated with important agronomic traits enable to develop new cultivars much quicker than traditional breeding approaches. Fine genetic mapping composed of thousands of molecular markers to identify genes controlling target traits and re-sequencing strategy based on reference sequence for re-sequencing parental lines of breeding population have largely been conducted in these days. Genetic variation from the above approaches could provide important information on gene discovery and identification associated with target traits (
Kang et al. 2016;
Lee et al. 2016).
Recently,
Zhou et al. (2014) constructed a SNP-based genetic linkage map in cultivated peanut based on large scale marker development using double-digest restriction-site-associated DNA sequencing (ddRADseq). Two peanut lines and 166 of their recombinant inbred lines (RILs) were used for development of markers and high resolution genetic mapping. Through ddRADseq, high-throughput genotyping method using NGS technology, total 14,663 SNPs were developed and SNP-based genetic linkage map with 1,765 SNP markers was constructed.
Pandey et al. (2017) successfully applied QTL-seq approach based on whole-genome re-sequencing in peanut and allele-specific diagnostic markers were identified for three SNPs for rust resistance and one SNP for late leaf spot resistance.
Information on reference genome sequence enables to save time and effort for developing molecular markers as well as to have pivotal effects to improve development and accuracy of massive markers. In the case of peanut, reference sequences of two donor diploid species composing peanut have released in 2016 (1,211 Mb for
A. duranensis and 1,512 Mb for
A. ipaensis). Based on the diploid reference genome sequences, research focusing on identifying genes and SNP associated with important traits are underway (
Bertioli et al. 2016;
Zhao et al. 2016;
Pandey et al. 2017).
The objective of the present study was to develop SNP and CAPS markers by re-sequencing two peanut germplasm ‘K-Ol’ and ‘Pungan’ for future genetic study and molecular breeding for improving important agronomic traits in peanut. The information on molecular markers from this study could provide useful guideline and information for peanut breeding programs.
MATERIALS AND METHODS
Plant material and DNA preparation
Two peanut cultivars, K-Ol (
Arachis hypogaea ssp.
fastigiata L.) and Pungan (
Arachis hypogaea ssp.
hypogaea L.), developed by the National Institute of Crop Science, Rural Development Administration, in the Republic of Korea were used for genome re-sequencing. K-Ol is shinpung plant type with high oleic acid (>80%) content. Pungan is Virginia elect-type with high luteolin content. Genomic DNAs from the cultivars were extracted from young leaves by the cetyltrimethyl ammonium bromide (CTAB) protocol with slight modification (
Saghai-Maroof et al. 1984). The quality and quantity of the DNA were examined using a NanoDrop ND-1000 (Thermo Fisher Scientific Inc., USA) and electrophoresis in 1% agarose gel.
Paired-end read libraries were prepared for sequencing and sequencing was performed on Illumina HiSeq2000 (Illumina Inc., San Diego, CA, USA). DynamicTrim and LenthSort programs of SolexaQA package (
Cox et al. 2010) were used to trim short reads in sequencing data. After trimming, reads with read lengths of >25 bp and phred score of >20 were only used for read mapping to reference sequence.
The processed reads were then firstly mapped (the first paired mapping) to the peanut reference sequences using BWA software (0.6.1-r104) (
Li and Durbin 2009). The first paired mapping was a pre-process to classify sample reads into A and B genome of cultivated peanut. The paired mapping using classified A and B genome reads to the peanut reference sequence was performed by the BWA software with the following options: maximum number of gap extensions (−e) = 50, seed length (−l) = 30, maximum differences in the seed (−k) = 1, number of threads (−t) = 16, mismatch penalty (−M) = 6, gap open penalty (−O) = 15, and gap extension penalty (−E) = 8. The variations in samples were extracted by SAMtools software (
Li et al. 2009) with following options: minimum mapping quality for SNPs (−Q) = 30, minimum mapping quality for gaps (−q) = 15, minimum read depth (−d) = 3, maximum read depth (−D) = 89, min Indel score for nearby SNP filtering (−G) = 30, SNP within INT bp around a gap to be filtered (−w) = 15, and window size for filtering dense SNPs (−W) = 15.
SNP files from comparison both K-Ol and Pungan to the peanut reference genome were analyzed and SNP matrix between K-Ol and Pungan was extracted. Based on the reference genome sequence, called SNP locus was classified into intergenic or genic-region. According to positions of SNPs between K-Ol and Pungan, SNP markers for high resolution melting (HRM) and cleaved amplified polymorphic sequence (CAPS) were developed. Primer design using the peanut reference genome was conducted by Primer3 (v2.3.5) (
Untergrasser et al. 2012). Validation of developed makers was performed by the PCR protocol described by
Jun et al. (2013). CAPS marker analysis for each PCR product was conducted by treatment of four restriction enzymes including
AseI,
MseI,
MspI, and
PstI, respectively.
RESULTS
Sequencing and read mapping to the reference genome sequence
The whole genome re-sequencing for K-Ol and Pungan produced sequences of 35.3 × 10
9 bp with 350 × 10
6 reads and 32.0 × 10
9 bp with 318 × 10
6 reads, respectively (
Table 1). After quality trimming of raw sequence, K-Ol produced about 28.6 × 10
9 bp with 320 × 10
6 read (81.2% of raw data) and Pungan produced approximately 26.8 × 10
9 bp with 295 × 10
6 read (83.4% of raw data).
Total reads of each sample were mapped to diploid reference genome (~2.8 Gbp). As the results of K-Ol, 210 × 10
6 read to
A. duranensis (AA) genome and 241 × 10
6 read to
A. ipaensis (BB) genome were mapped and these mapped reads covered 65.5% and 79.1% of the reference genome regions (
Table 2). In the case of Pungan, 199 × 10
6 read to
A. duranensis (AA) genome and 225 × 10
6 read to
A. ipaensis (BB) genome were mapped and these mapped reads covered 64.5% and 77.9% of the reference genome regions (
Table 2).
Based on the peanut reference genome, raw SNP from the peanut cultivars were identified. In the comparison between K-Ol and the peanut reference genome, 1,954,267 SNPs for
A. duranensis (AA) and 353,490 for
A. ipaensis (BB) were identified. Among them, homozygous type SNPs were 1,765,631 (~90%) for
A. duranensis (AA) and 150,960 (~43%) for
A. ipaensis (BB) (
Table 3). In the case of SNPs identified in
A. duranensis (AA), chromosome 3 had the highest SNPs (272,114) while chromosome 8 had the lowest (117,051) (
Supplementary Table S1). In the case of SNPs in
A. ipaensis (BB), SNPs numbers in each chromosome ranged from 17,381 for chromosome 5 to 13,505 for chromosome 2.
In the comparison between Pungan and the peanut reference genome, 1,870,117 SNPs for
A. duranensis (AA) and 335,659 for
A. ipaensis (BB) were identified. Among them, homozygous type SNPs were 1,689,908 (~90%) for
A. duranensis (AA) and 143,080 (~43%) for
A. ipaensis (BB) (
Table 3). Homozygous SNP ratio on each chromosome ranged from 259,689 for chromosome 3 to 108,705 for chromosome 8 in
A. duranensis (AA). In the case of
A. ipaensis (BB), chromosome 6 had the highest SNPs (17,482) while chromosome 2 had the lowest SNPs (12,458) (
Supplementary Table S2).
Based on gene annotation data in the peanut reference genome, homozygous SNPs identified in K-Ol and Pungan were classified according to their genomic locations (
Table 4). In the case of K-Ol, 1,650,059 (~94.1%) out of 1,752,218 homozygous SNPs were located in intergenic-region while 102,159 (5.9%) SNPs were in genic-region across
A. duranensis (AA) genome. In the
A. ipaensis (BB) genome, 141,608 (~94.0%) out of 150,581 homozygous SNPs were located in intergenic-region while 8,973 (~6.0%) SNPs were in genic-region. In the case of Pungan, 1,582,350 (~94.4%) out of 1,676,623 homozygous SNPs were settled in intergenic-region while 94,273 (~5.6%) SNPs were mapped on genic-region in
A. duranensis (AA) genome. In the
A. ipaensis (BB) genome, 134,386 (~94.2%) out of 142,693 homozygous SNPs were located in intergenic-region while 8,307 (~5.8%) SNPs were in genic-region. Regardless of cultivars and the reference genomes, most of the SNPs showed a tendency to locate in intergenic-region (
Table 4,
Supplementary Figs. S1 and S2).
We compared the SNP matrix corresponding to each reference genome, and select SNPs polymorphic between matrixes. In the case of
A. duranensis (AA) genome, 8,876 out 2,235,941 SNP loci presented polymorphism between K-Ol and Pungan while 19,260 out of 485,176 SNP loci showed polymorphism between two peanut cultivars in
A. ipaensis (BB) genome (
Table 5,
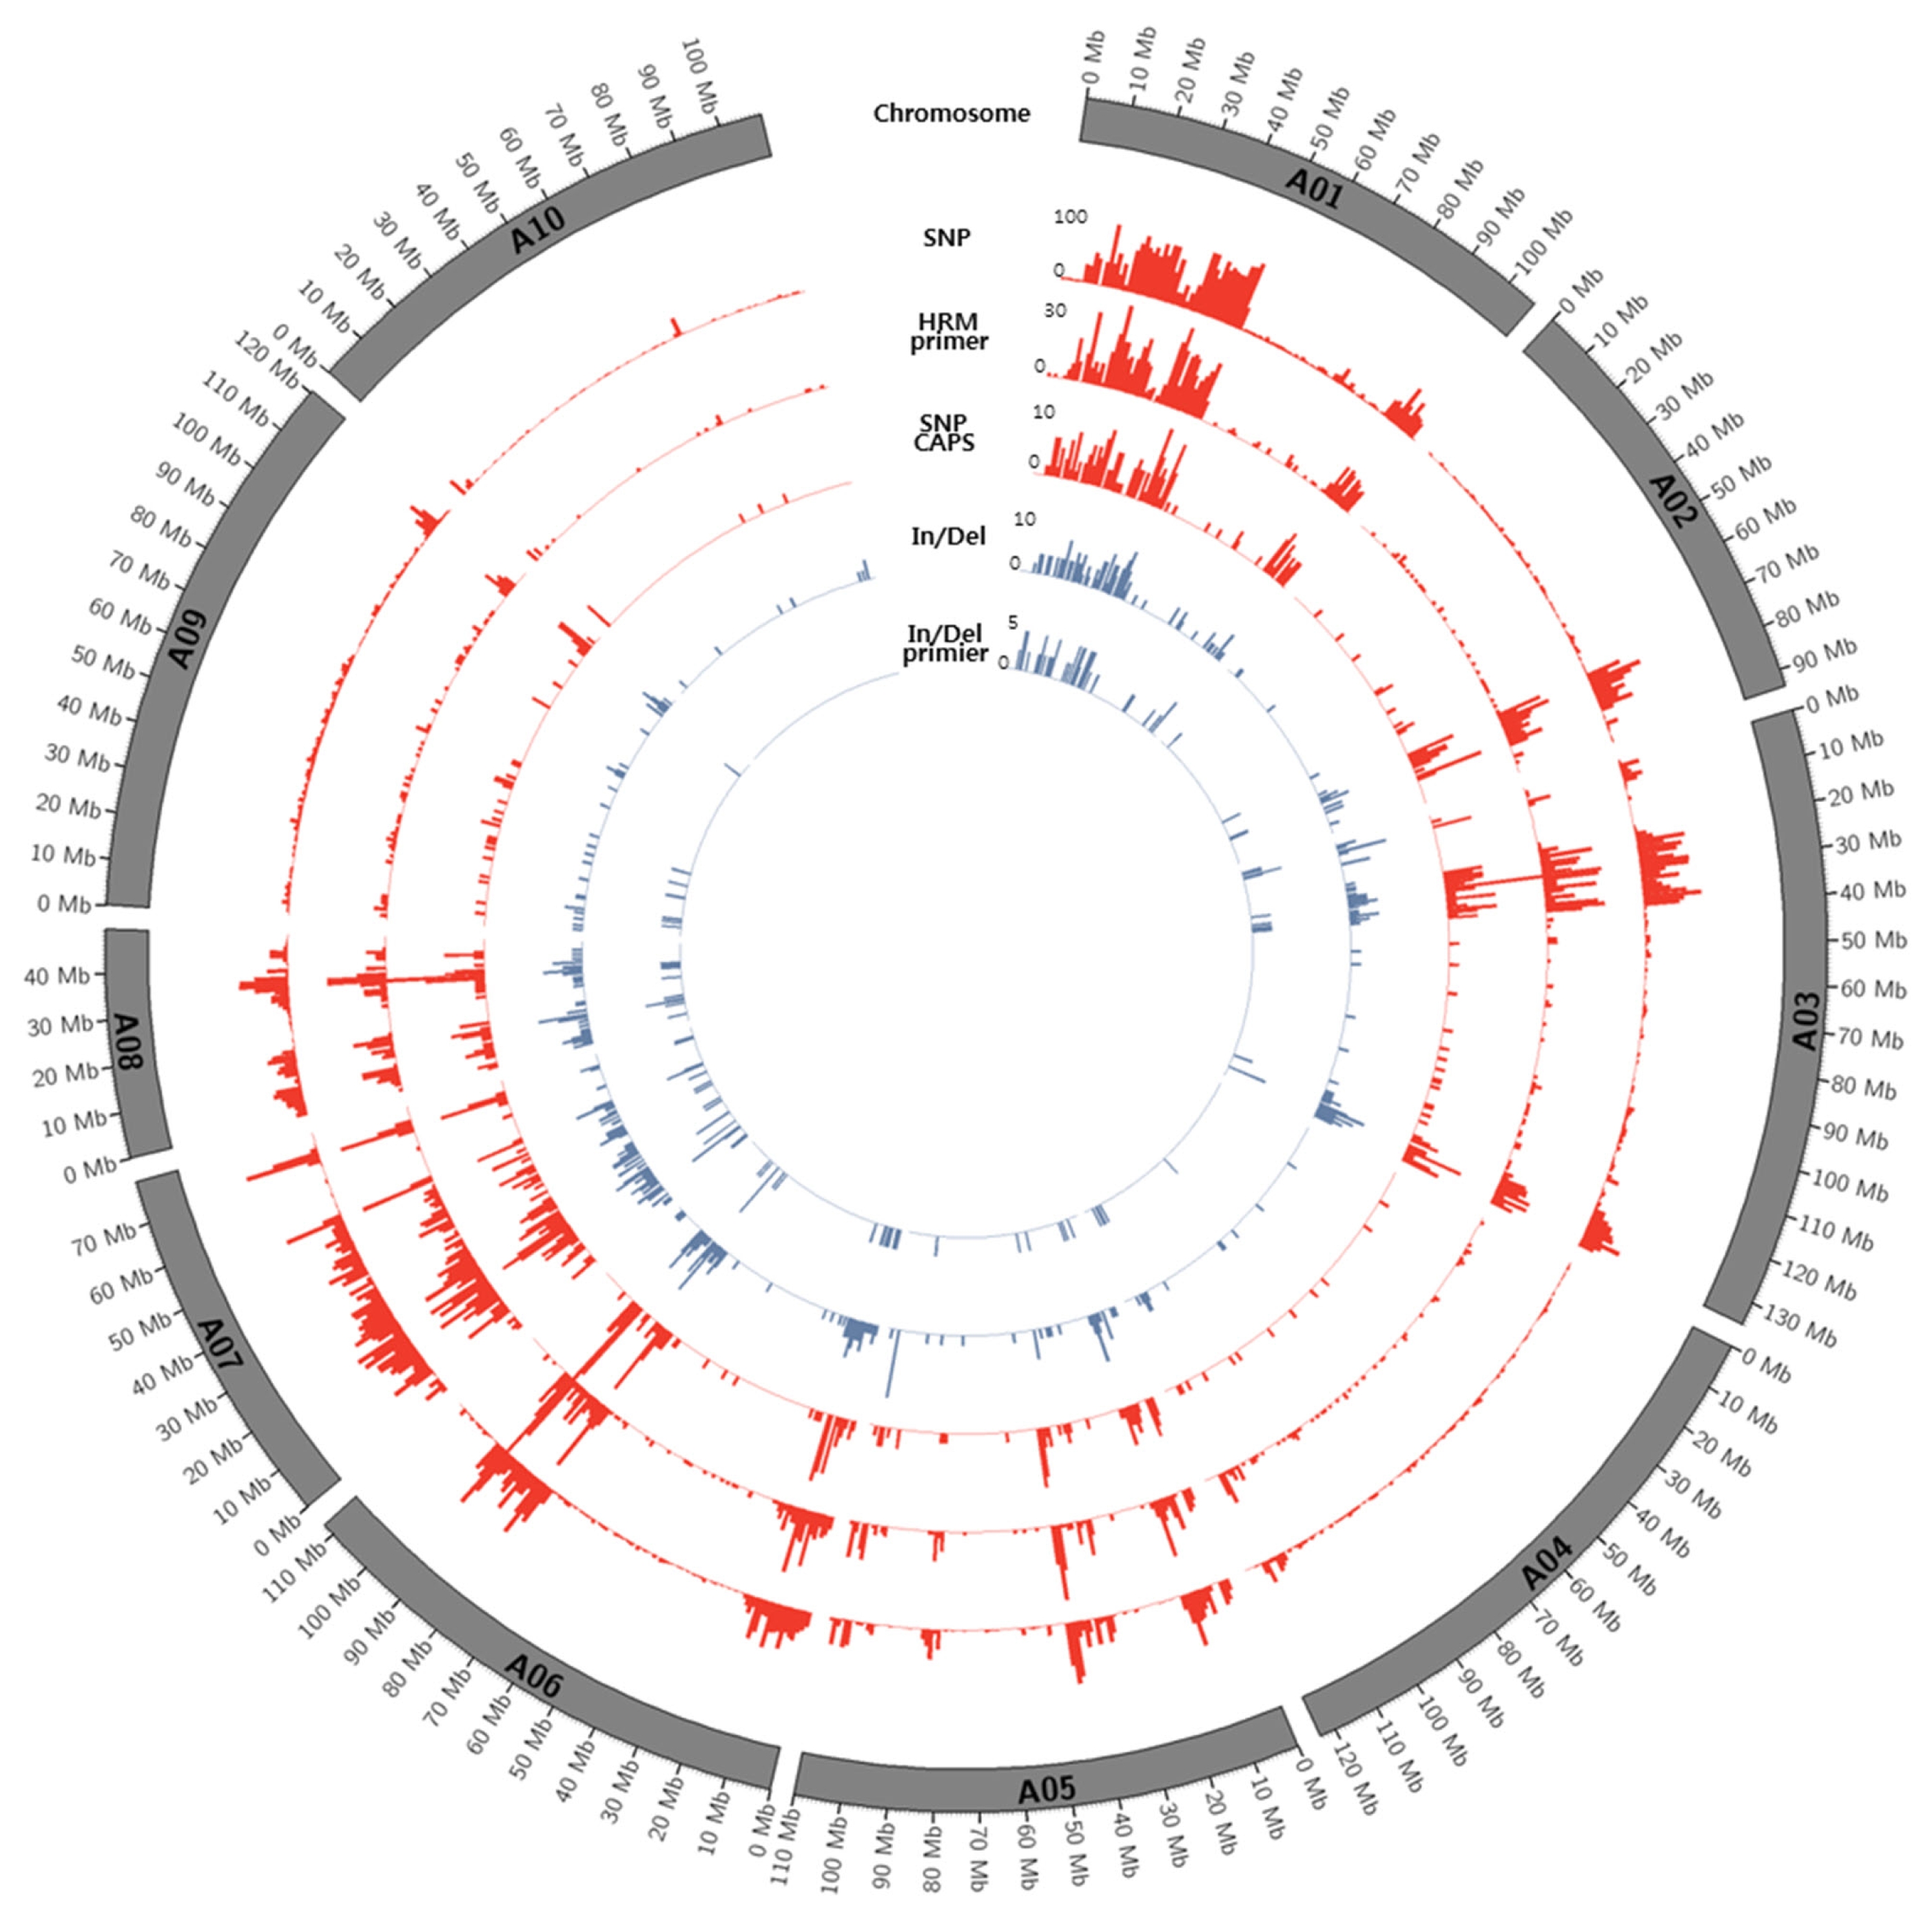
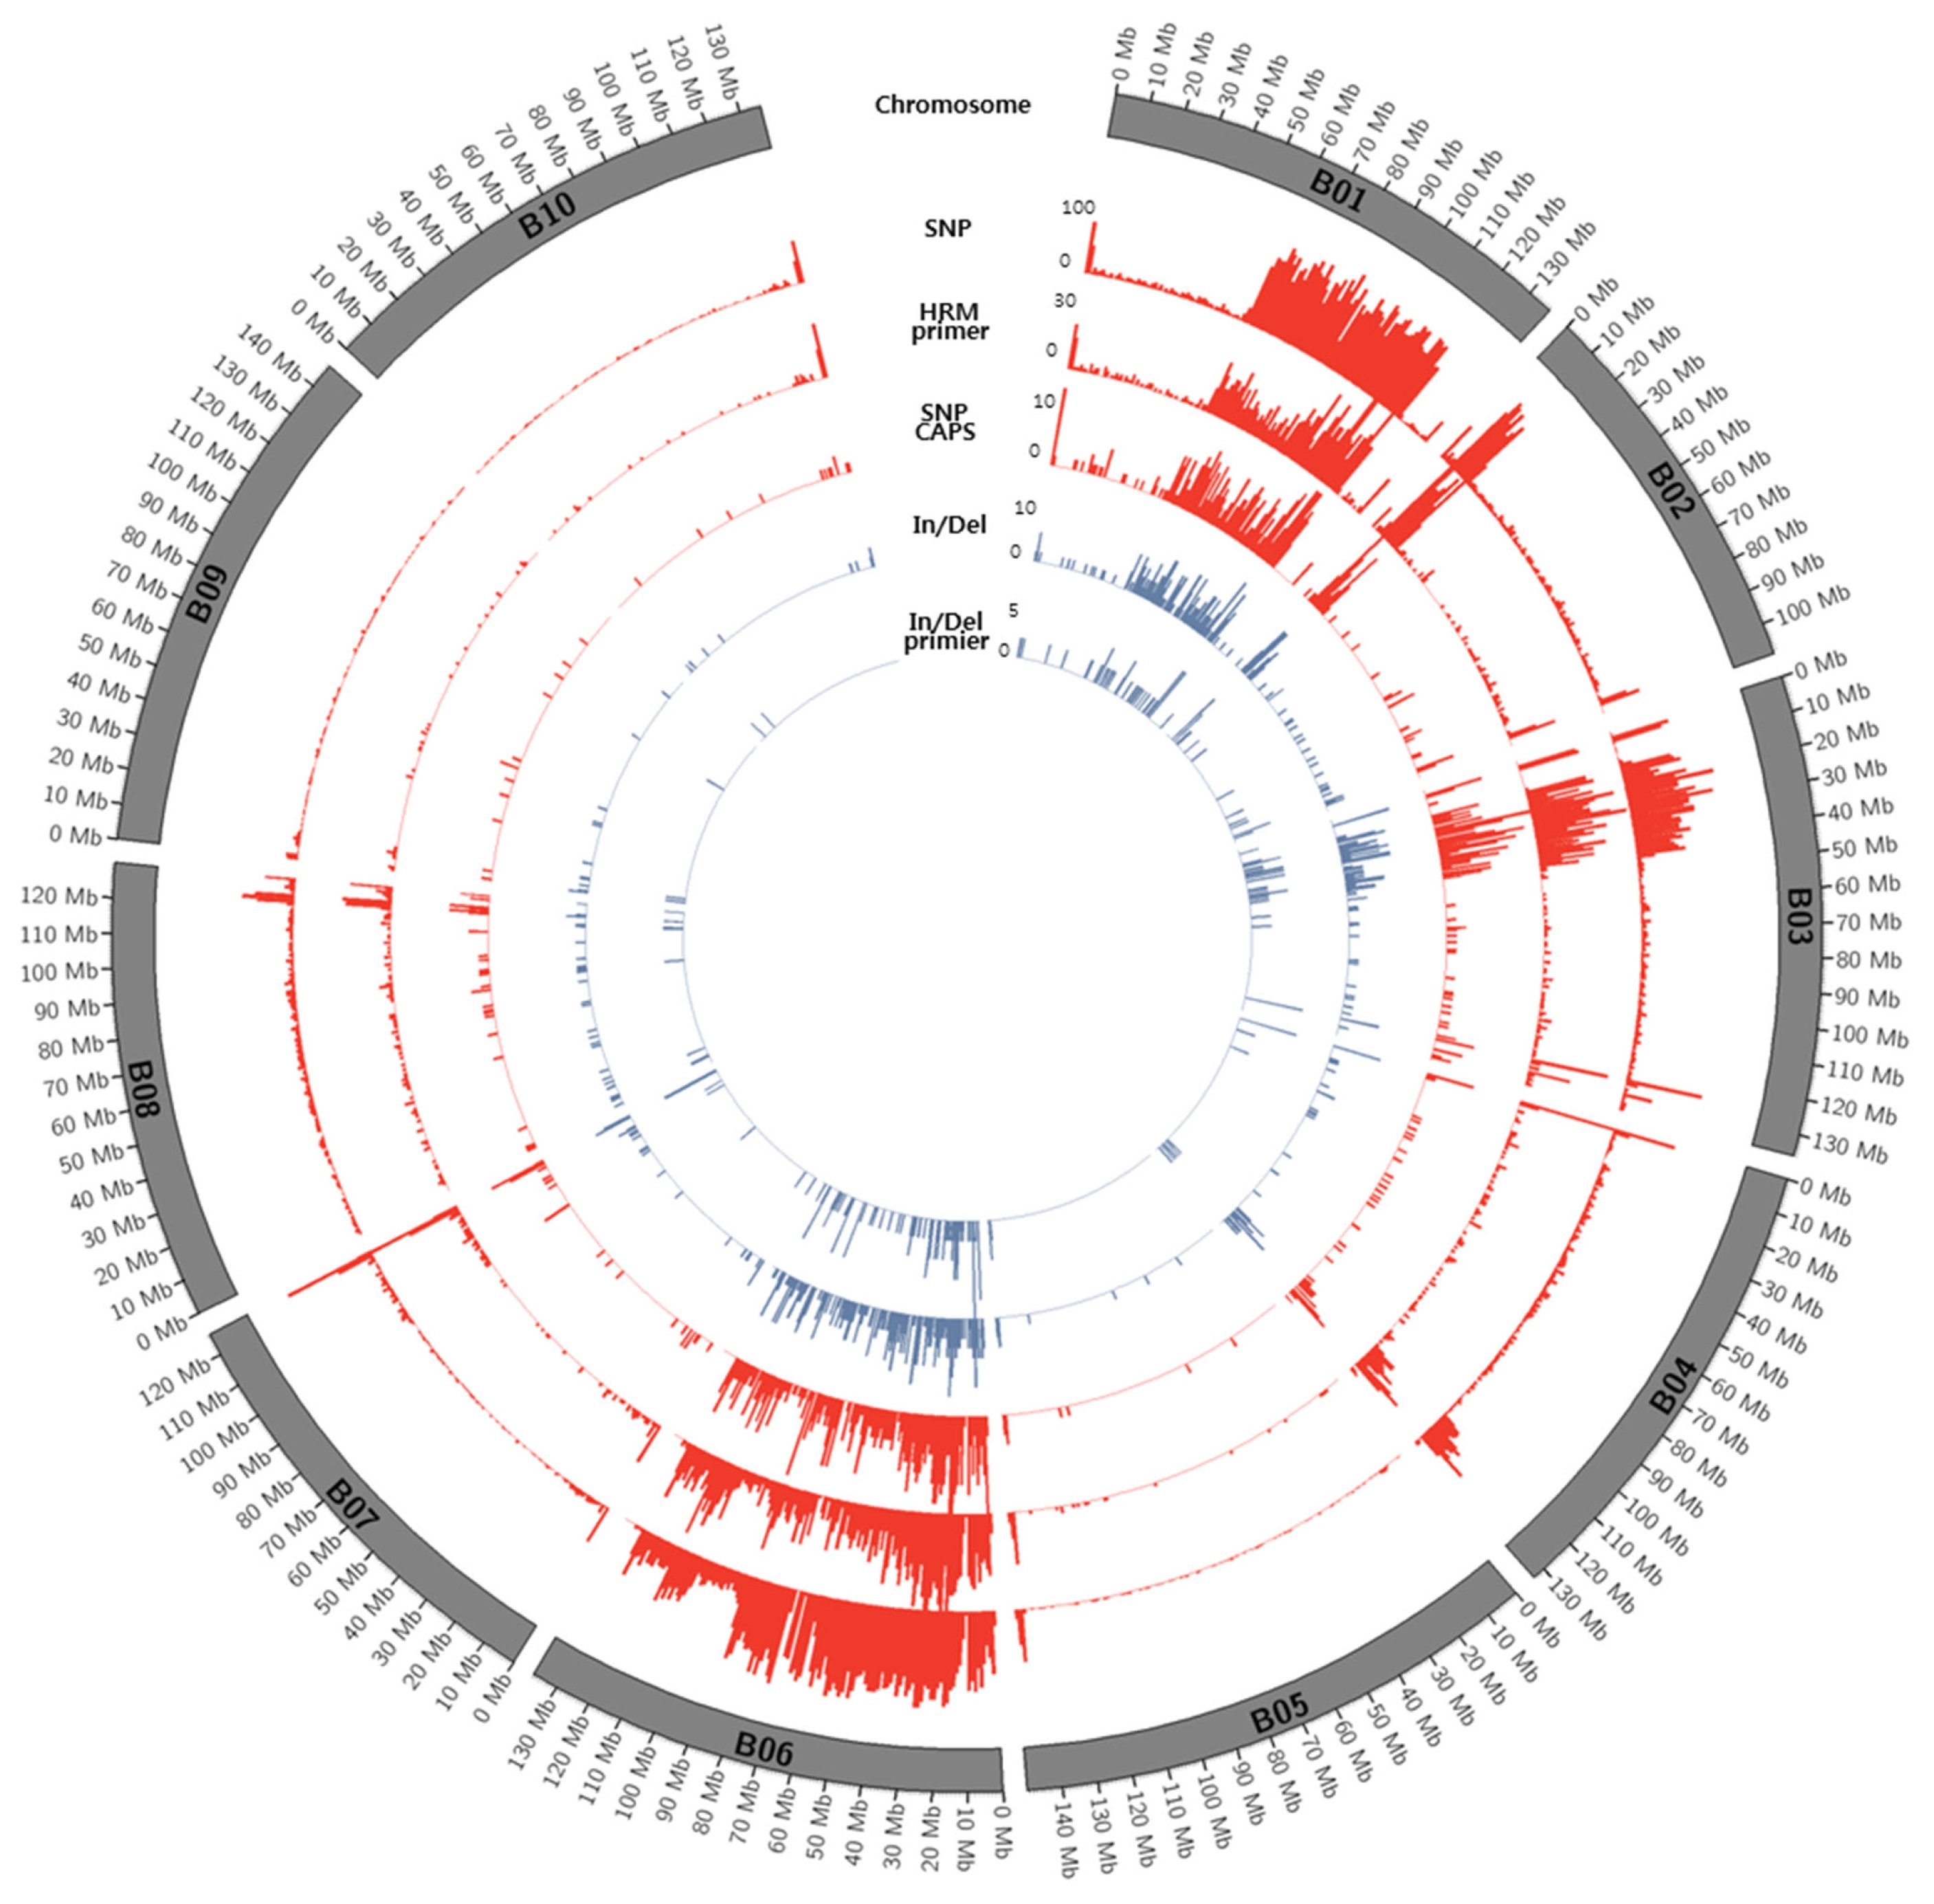
Supplementary Tables S3 and S4). Information on distribution (per 1 Mb across chromosomes) of homozygous SNPs derived from comparison between the two peanuts were displayed in
Figs. 1 and
2.
According to discovered SNP information in the present study, HRM primers which could be used for both genetic mapping and evaluation of genetic diversity in peanut were developed (
Supplementary Tables S5 and S6). We selected only the primer sets their expected PCR-product sequences from the peanut reference genome can match exactly on position in the contigs derived from read mapping. As a result, a total of 2,413 HRM primers for
A. duranensis (AA) and 4,315 for
A. ipaensis (BB) were developed. In addition, CAPS primers were developed based on identified SNP in this study and the peanut reference genome (
Supplementary Tables S7 and S8). As a result, unique SNP loci which could be detected by CAPS primer were 694 for
A. duranensis (AA) and 1,148 for
A. ipaensis (BB). Most of the SNP loci have recognition site for multiple restriction enzymes. To confirm a real efficiency of CAPS primers developed in the study, a total of 61 CAPS markers were tested using six peanut germplasms (IT030862, IT030953, IT172656, IT185076, IT191443, and IT191558) obtained from National Agrobiodiversity Center, Rural Development Administration, in the Republic of Korea. Sixty (98%) CAPS primers produced normal PCR product and 18 (30%) out of them exhibited polymorphism in the tested peanut germplasms (
Supplementary Table S9).
DISCUSSION
Although identification of accurate SNP is still very difficult and laborious procedure due to the ambiguous read mapping of highly similar homeologous genomic regions, many studies for SNP marker development in auto-and allo-polyploid crops have been successfully performed (
Trick et al. 2009;
Byers et al. 2012; Uitdewilligen
et al. 2013;
Clevenger et al. 2015). As we know, because peanut is polypoid with a large genome size and has very narrow genetic diversity, it is really hard to find DNA polymorphism in peanut germplasm. For this reasons, the genetic map with 897 markers including 895 SSRs and two CAPS markers based on eleven different mapping populations has been used as a reference map until the construction of a SNP-base high density genetic map using NGS technology (
Zhou et al. 2014). However, as the reference genome sequences of diploid peanut were recently released, SNP discovery and utilization for molecular marker will be accelerated in cultivated peanut breeding and research programs.
This article is the first report on high-throughput SNP discovery and development of SNP-based marker using Korean peanut cultivars. In the present study, six peanut germplasms tested for genetic diversity were arbitrarily selected, therefore there is a possibility that they have a similar genetic backgrounds, which can result in relatively low genetic polymorphism. However, the fact that most of the primer sets produced normal PCR products is considered, SNP and SNP-based molecular markers developed in the present study could provide useful genetic information and materials for future peanut breeding programs and genetic diversity study.
When K-Ol and Pungan compared to the peanut reference genome, the distribution of homozygous and heterozygous SNPs on each chromosome presented very similar patterns as well as relatively few SNPs and homozygous SNPs were identified in
A. ipaensis (BB) than
A. duranensis (AA) (
Supplementary Figs. S3 and S4). This low level of SNP ratio could be explained by high levels of similarity of B subgenome between cultivated peanut and
A. ipaensis (
Bertioli et al. 2016).
Distribution of SNPs between K-Ol and Pungan showed significant deviation according to chromosomal regions and the frequency of SNPs detected along chromosomes were relatively low. We cannot overlook the fact that these results might be caused by errors in the statistical analysis such as NGS read mapping. However, the identified SNPs were evenly distributed across all chromosomes of peanut’s diploid A and B reference genomes, indicating that these SNPs could be useful to construct a genetic map using the segregating population derived from a cross between ‘K-Ol’ and ‘Pungan’ as well as to develop a huge number of SNP markers.
Highly biased SNP calling along with chromosomes especially in the chromosomes; B01, B06, A01, and A07 may indicate inaccurate or ambiguous reads mapping to the reference genome. This is fundamental limitation of SNP calling using diploid ancestor genomes because these genomic regions may have gone through several chromosomal rearrangement after allopolyploidization event between A and B genomes. Therefore, it is necessary to construct the peanut (Arachis hypogaea L.) reference genome sequences with the aid of diploid ancestor genomes of peanut and recent long reads technologies.
Supplementary Information
ACKNOWLEDGEMENTS
This work was supported by a 2-year Research Grant of Pusan National University.
Fig. 1Circos diagram depicting the distribution of SNPs and In/Dels between K-Ol and Pungan in the 10 peanut chromosomes of A. duranensis.

Fig. 2Circos diagram depicting the distribution of SNPs and In/Dels between K-Ol and Pungan in the 10 peanut chromosomes of A. ipaensis.

Table 1Summary of raw read quality control.
Table 1
|
Samples |
Total bases (No. of reads) |
Coverage (X)z)
|
|
|
Read 1 |
Read 2 |
Sum |
|
Raw reads |
K-Ol |
17,681,188,472 (175,061,272) |
17,681,188,472 (175,061,272) |
35,362,376,944 (350,122,544) |
≒ 12.63 |
|
Pungan |
16,052,491,762 (158,935,562) |
16,052,491,762 (158,935,562) |
32,104,983,524 (317,871,124) |
≒ 11.47 |
|
Trimmed |
K-Ol |
14,400,357,851 (160,427,843) |
14,215,159,983 (160,427,843) |
28,615,517,834 (320,855,686) |
≒ 10.22 |
|
Pungan |
13,475,010,896 (147,525,768) |
13,373,825,045 (147,525,768) |
26,848,835,941 (295,051,536) |
≒ 9.59 |
Table 2Summary of classified read mapping results.
Table 2
|
Sample |
Reference genome |
No. of mapped read |
No. of classified read |
Mapped region (%)z)
|
|
K-Ol |
Arachis duranensis (AA) |
210,695,983 |
64,828,731 |
710,474,308 (65.53%) |
|
Arachis ipaensis (BB) |
241,468,779 |
95,601,527 |
1,070,679,528 (79.09%) |
|
Pungan |
Arachis duranensis (AA) |
199,086,651 |
57,405,353 |
699,344,215 (64.50%) |
|
Arachis ipaensis (BB) |
225,326,014 |
83,644,716 |
1,055,006,157 (77.93%) |
Table 3Summary of SNP detection.
Table 3
|
Reference |
Sample |
Total SNP |
Homozygous SNP |
Heterozygous SNP |
Ambiguous SNPz)
|
|
Arachis duranensis (AA) |
K-Ol |
1,954,267 |
1,765,631 |
74,050 |
114,586 |
|
Pungan |
1,870,117 |
1,689,908 |
70,939 |
109,270 |
|
Arachis ipaensis (BB) |
K-Ol |
353,490 |
150,960 |
85,887 |
116,643 |
|
Pungan |
335,659 |
143,080 |
82,495 |
110,084 |
Table 4SNP classification by genomic locations.
Table 4
|
Reference |
Samples |
Total SNP |
No. of anchored SNP |
Region |
Total |
Homo zygous |
Hetero zygous |
Ambi guousz)
|
|
Arachis duranensis (AA) |
K-Ol |
1,954,267 |
1,936,323 |
Intergenic-region |
1,821,294 |
1,650,059 |
66,422 |
104,813 |
|
|
|
Genic-region |
115,029 |
102,159 |
5,814 |
7,056 |
|
|
|
CDS |
36,869 |
31,719 |
2,415 |
2,735 |
|
|
|
Intron |
78,214 |
70,485 |
3,401 |
4,328 |
|
Pungan |
1,870,117 |
1,852,330 |
Intergenic-region |
1,745,895 |
1,582,350 |
63,442 |
100,103 |
|
|
|
Genic-region |
106,435 |
94,273 |
5,720 |
6,442 |
|
|
|
CDS |
34,494 |
29,620 |
2,393 |
2,481 |
|
|
|
Intron |
71,989 |
64,695 |
3,331 |
3,963 |
|
Arachis ipaensis (BB) |
K-Ol |
353,490 |
351,233 |
Intergenic-region |
317,280 |
141,608 |
73,214 |
102,458 |
|
|
|
Genic-region |
33,953 |
8,973 |
11,924 |
13,056 |
|
|
|
CDS |
12,785 |
3,292 |
4,595 |
4,898 |
|
|
|
Intron |
21,185 |
5,682 |
7,338 |
8,165 |
|
Pungan |
335,659 |
333,465 |
Intergenic-region |
301,771 |
134,386 |
70,657 |
96,728 |
|
|
|
Genic-region |
31,694 |
8,307 |
11,066 |
12,321 |
|
|
|
CDS |
12,068 |
3,065 |
4,323 |
4,680 |
|
|
|
Intron |
19,645 |
5,248 |
6,750 |
7,647 |
Table 5Summary of polymorphic SNPs detected between two peanut samples.
Table 5
|
Reference |
No. of SNP lociz)
|
Classificationy)
|
K-Ol vs. Pungan |
|
Arachis duranensis (AA) |
2,235,941 |
Polymorphic loci |
8,876 |
|
|
Non-polymorphic loci |
1,499,325 |
|
Arachis ipaensis (BB) |
485,176 |
Polymorphic loci |
19,260 |
|
|
Non-polymorphic loci |
130,416 |
References
- Bertioli DJ, Cannon SB, Froenicke L, Huang G, Farmer AD, Cannon EK, et al. 2016. The genome sequences of Arachis duranensis and Arachis ipaensis, the diploid ancestors of cultivated peanut. Nat Genet. 48: 438-446.
- Byers RL, Harker DB, Yourstone SM, Maughan PJ, Udall JA. 2012. Development and mapping of SNP assays in allotetraploid cotton. Theor Appl Genet. 124: 1201-1214.
- Clevenger J, Chavarro C, Pearl SA, Ozias-Akins P, Jackson SA. 2015. Single nucleotide polymorphism identification in polyploids: A review, example, and recommendations. Mol Plant. 8: 831-846.
- Cox MP, Peterson DA, Biggs PJ. 2010. SolexaQA: At-a-glance quality assessment of Illumina second-generation sequencing data. BMC Bioinformatics. 11: 485
- Gautami B, Foncéka D, Pandey MK, Moretzsohn MC, Sujay V, Qin H, et al. 2012. An international reference consensus genetic map with 897 marker loci based on 11 mapping populations for tetraploid groundnut (Arachis hypogaea L.). PLoS ONE. 7: e41213
- Jun TH, Rouf Mian MA, Michel AP. 2013. Genetic mapping of three quantitative trait loci for soybean aphid resistance in PI 567324. Heredity. 111: 16-22.
- Kang YJ, Ahn YK, Kim KT, Jun TH. 2016. Resequencing of Capsicum annuum parental lines (YCM334 and Taean) for the genetic analysis of bacterial wilt resistance. BMC Plant Biol. 16: 235
- Kochert G, Stalker HT, Gimenes M, Galgaro L, Lopes CR, Moore K. 1996. RFLP and cytogenetic evidence on the origin and evolution of allotetraploid domesticated peanut, Arachis hypogaea (Leguminosae). Am J Bot. 83: 1282-1291.
- Lee J, Izzah NK, Choi BS, Joh HJ, Lee SC, Perumal S, et al. 2016. Genotyping-by-sequencing map permits identification of clubroot resistance QTLs and revision of the reference genome assembly in cabbage (Brassica oleracea L.). DNA Res. 23: 29-41.
- Lee J, Izzah NK, Jayakodi M, Perumal S, Joh HJ, Lee HJ, et al. 2015. Genome-wide SNP identification and QTL mapping for black rot resistance in cabbage. BMC Plant Biol. 15: 32
- Li H, Durbin R. 2009. Fast and accurate short read alignment with Burrows-Wheeler transform. Bioinformatics. 25: 1754-1760.
- Li H, Handsaker B, Wysoker A, Fennell T, Ruan J, Homer N, et al. 2009. The Sequence Alignment/Map format and SAMtools. Bioinformatics. 25: 2078-2079.
- Moore KM, Knauft DA. 1989. The inheritance of high oleic acid in peanut. J Hered. 80: 252-253.
- Moretzsohn MC, Gouvea EG, Inglis PW, Leal-Bertioli SCM, Valls JEM, Bertioli DJ. 2013. A study of the relationships of cultivated peanut (Arachis hypogaea) and its most closely related wild species using intron sequences and microsatellite markers. Ann. Botany. 111: 113-126.
- Pandey MK, Khan AW, Singh VK, Vishwakarma MK, Shasidhar Y, Kumar V, et al. 2017. QTL-seq approach identified genomic regions and diagnostic markers for rust and late leaf spot resistance in groundnut (Arachis hypogaea L.). Plant Biotechnol J. 15: 927-941.
- Saghai-Maroof MA, Soliman KM, Jorgensen RA, Allard RW. 1984. Ribosomal DNA spacer-length polymorphisms in barley: Mendelian inheritance, chromosomal location, and population dynamics. Proc Natl Acad Sci USA. 81: 8014-8018.
- Trick M, Long Y, Meng J, Bancroft I. 2009. Single nucleotide polymorphism (SNP) discovery in the polyploid Brassica napus using Solexa transcriptome sequencing. Plant Biotechnol J. 7: 334-346.
- Uitdewilligen JGAML, Wolters AMA, D’hoop BB, Borm TJA, Visser RGF, van Eck HJ. 2015. A next-generation sequencing method for genotyping-by-sequencing of highly heterozygous autotetraploid Potato. PLoS ONE. 10: e0141940
- Untergasser A, Cutcutache I, Koressaar T, Ye J, Faircloth BC, Remm M, et al. 2012. Primer3-new capabilities and interfaces. Nucleic Acids Res. 40: e115
- Yang H, Tao Y, Zheng Z, Li C, Sweetingham MW, Howieson JG. 2012. Application of next-generation sequencing for rapid marker development in molecular plant breeding: a case study on anthracnose disease resistance in Lupinus angustifolius L. BMC Genomics. 13: 318
- Zhao Y, Zhang C, Chen H, Yuan M, Nipper R, Prakash CS, et al. 2016. QTL mapping for bacterial wilt resistance in peanut (Arachis hypogaea L.). Mol Breed. 36: 13
- Zhou X, Xia Y, Ren X, Chen Y, Huang L, Huang S, et al. 2014. Construction of a SNP-based genetic linkage map in cultivated peanut based on large scale marker development using next-generation double-digest restriction-site-associated DNA sequencing (ddRADseq). BMC Genomics. 15: 351