Abstract
Sixty-nine Rubus accessions were analyzed to determine the genetic relationships using simple sequence repeat (SSR) markers. Twenty-three SSR markers generated a total of 351 alleles from all accessions, with an average of 15.3 alleles per locus. The average value of polymorphism information content was 0.76, ranging from 0.52 to 0.91. As a result of population structure analysis, 69 Rubus accessions of six Rubus species were subdivided into six subpopulations. Four subpopulations included distinct Rubus species accessions; pop2 (Rubus crataegifolius var. subcuneatus, 2 accessions), pop3 (R. crataegifolius Bunge., 18 accessions), pop4 (R. fruticosus L., 3 accessions) and pop6 (R. coreanus Miq., 36 accessions) while The pop1 and pop5 mainly included R. idaeus L. and R. parvifolius L., respectively. In cluster analysis, 69 Rubus accessions were divided into three groups. Group I contained 35 Rubus accessions, which consisted of six Rubus species. Groups II and III had 30 and 4 Rubus accessions, respectively. They consisted of only R. coreanus. The uncertain diversity of species and artificial groups of the Rubus genus has created confusion with respect to the correct classification of the species at both commercial and scientific levels. The results of the present study will provide basic information for phylogeny, taxonomy and breeding programs of Rubus species.
-
Key words: Genetic diversity, Rubus species, Simple sequence repeat, STRUCTURE
INTRODUCTION
Rubus (Rosaceae) is a large genus including diverse species and is grown extensively worldwide at altitudes ranging from 0 to 4,500 m above sea level (
Marulanda et al. 2012a). Among the flowering plant species,
Rubus genus is reported to contain approximately 800 species due to biological processes such as hybridization, apomixis, and polyploidy which weaken species boundaries (
Thompson 1995;
Alice and Campbell 1999).
Rubus has been divided into 12 subgenera; subgenera
Idaeobatus,
Dalibarda, and
Anoplobatus are predominantly diploid, whereas
Dalibardastrum,
Malachobatus, and
Orobatus are exclusively polyploid (
Thompson 1995;
Thompson 1997). Among the
Rubus genus, only a few species such as raspberries, blackberries, dewberries, arctic fruits and flowering raspberries have been domesticated and utilized in breeding programs (
Jennings 1988).
Since the distinction and characterization of
Rubus genetic resources using morphological markers is difficult because of complexity of the
Rubus genus, molecular markers might be reliable means for cultivar identification and assessment of genetic relatedness and diversity in these collections (
Castillo et al. 2010). Several studies of the
Rubus species have used molecular markers such as amplified fragment length polymorphism (AFLP) (
Graham et al. 2004), internal transcribed spacer (ITS) (
Alice and Campbell 1999), Random amplification of polymorphic DNA (RAPD) (
Graham et al. 1997), and simple sequence repeat (SSR) (
Graham et al. 2004;
Dossett et al. 2012;
Marulanda et al. 2012b) to assess the genetic diversity (GD) and population structures.
Microsatellite loci present a relatively high frequency in the eukaryotic genome and show high reproducibility and polymorphism as a codominant molecular marker. Due to these properties, microsatellite markers have been widely used for GD and population analysis in diverse crops (
Feingold et al. 2005;
Laurent et al. 2007;
Lee et al. 2015). Especially for the
Rubus species,
Lewers et al. (2008) developed microsatellite markers from an expressed sequence tag library of blackberry (
Rubus L.) cultivars, and
Castillo et al. (2010) isolated twelve microsatellite markers from enriched genomic libraries of red raspberry (
Rubus idaeus) and blackberry (
R. hybrid). The use of these markers made it possible to analyze the genetic constitution of the hybrids and to perform further phylogenetic and evolutionary studies in
Rubus (
Alice 2002).
Recently, our lab reported 97 novel microsatellite markers acquired from
R. coreanus, and tested cross-amplification in other
Rubus species (
Lee et al. 2015). The aim of the current study is to survey the polymorphism of the previously reported microsatellite markers in diverse
Rubus accessions, and to evaluate the distribution of genetic variability and population structure of conserved
Rubus diversity.
MATERIALS AND METHODS
Plant materials
Sixty-nine
Rubus accessions obtained from Gochang Blackraspberry Research Institute (GBRI), Republic of Korea were used for DNA extraction and further analysis. Plants of the following species were included:
R. coreanus (36 accessions),
R. crataegifolius (18 accessions),
R. idaeus (5 accessions),
R. fruticosus (4 accessions),
R. crataegifolius var.
subcuneatus (3 accessions), and
R. parvifolius (3 accessions) (
Table 1).
Genomic DNA was extracted from bulked samples using Plant DNAzol reagent (Invitrogen, Carlsbad, CA, USA) following the instructions provided by the manufacturer. The DNA concentration was determined using a NanoDrop (ND-1000; NanoDrop, Wilmington, DE, USA). The final concentration of each DNA sample was adjusted to 20 ng/μl. The M13-tail at the 5′-end region with the polymerase chain reaction (PCR) method was used to measure the size of the amplified products (
Schuelke 2000). Genotyping was carried out using 23 SSR markers listed in
Table 2. A set of the polymorphic SSR markers was obtained from the data previously reported by
Lee et al. (2015). Amplified fluorescent-labeled PCR products were analyzed on an ABI-Prism 3130×1 Genetic Analyzer (Applied Biosystems, Foster City, CA, USA). Fragments were sized and scored into alleles using GeneMapper v4.0 (Applied Biosystems).
The total number of alleles, allele frequency, gene diversity and polymorphism information content (PIC) per individual SSR locus were calculated with the Power-Marker version 3.25 (
Liu and Muse 2005). The unweighted pair group method with an arithmetic mean (UPGMA) dendrogram was constructed to visualize the phylogenetic distribution of accessions using the software MEGA version 5.03 (
Tamura et al. 2007). Principal co-ordinate analysis (PCoA) in GenAlEx 6.5 was used to further examine the genetic relationships among the detected populations on the basis of the SSR data (
Peakall and Smouse 2012). STRUCTURE software (V2.3.4) was used to detect the possible subpopulations (K=1 to K=10) with a model allowing for admixture and correlated allele frequencies using a burn-in period of 50,000 and MCMC repeats of 50,000 followed by three iterations (
Pritchard et al. 2000). The optimal number of populations corresponds to the highest peak in the ΔK graph and the accessions with membership probabilities ≥70% were assigned to each subpopulation (
Evanno et al. 2005).
RESULTS
The 23 SSR markers produced 351 alleles and the number of detected alleles over all loci across genotypes ranged from 6 (GB-RC-098) to 24 (GR-RC-167), with an average of 15.3 alleles per locus (
Table 2). With respect to the indices for comparing genetic variability, we calculated PIC and GD values for the used SSR primers; PIC value ranged from 0.52 (GB-RC-098) to 0.91 (GB-RC-167 and GB-RC-245), with an average value of 0.76 and GD value ranged from 0.55 (GB-RC-077) to 0.92 (GB-RC-245), with an average value of 0.78.
The distribution of genetic variation among and within the six populations of accessions was estimated by analysis of molecular variance (AMOVA), which revealed that 26% of total variation was among populations, and 56% of variation was within individuals (
Table 3). PCoA with SSR markers showed that large diversity existed in
Rubus species. The first three axes explained 31.7% of cumulative variation. The exhibited
Rubus genotypes were grouped into four broad groups across the two axes (
Fig. 1). The genotypes belonging to the species
R. coreanus and
R. crataegifolius were separate from the other species.
To study the population structure, a model-based STRUCTURE was used to determine the genetic relationship among individual
Rubus accessions (
Fig. 2A). This model assumes that the number of populations was k and the loci were independent and in Hardy-Weinberg equilibrium. K=1 to 10 populations were tested, Ln(PD) kept on increasing with increasing population number but there was no clear population structure, therefore Ln(PD) derived Δk was plotted against the K to determine the number of populations. At K=6, maximum Δk was found and this was considered as the number of populations for 69
Rubus accessions. Pop-1 included six accessions, pop-2 included two accessions, pop-3 included 18 accessions, pop-4 included three accessions, pop-5 included four accessions, and pop-6 included 36 accessions. Pop-2, pop-3, pop-4, and pop-6 included only one species;
R. crataegifolius var.
subcuneatus,
R. crataegifolius,
R. fruticosus, and
R. coreanus, respectively. Pop-1 included five
R. idaeus and one
R. fruticosus accessions, whereas pop-5 contained three
R. parvifolius and one
R. crataegifolius var.
subcuneatus accessions.
The phylogenetic tree based on a genetic distance matrix could be divided into three major groups (
Fig. 2B). Cluster I was further sub-grouped into cluster Ia which contained six
Rubus accessions (one
R. idaeus L. and five
R. idaeus L.), cluster Ib contained 27 accessions (three
R. crataegifolius var.
subcuneatus, three
R. fruticosus L., three
R. parvifolius L., and 18
R. crataegifolius Bunge.) and cluster Ic contained two accessions (
R. coreanus Miquel). Similarly, cluster II was sub-grouped into four clusters; cluster IIa, cluster IIb, cluster IIc and cluster IId that contained eight, six, ten, and six
R. idaeus L accessions, respectively. Cluster III contained only 4 accessions (
R. idaeus L). Cluster I consisted of six
Rubus species, while cluster II and III contained only
R. coreanus.
DISCUSSION
Our result revealed a high mean number of alleles per locus (15.3) and a high PIC value (0.76).
Dossett et al. (2012) and
Marulanda et al. (2012a) reported that the mean number of alleles per locus was 8.6 (range, 2–24) in 146 black raspberry accessions and 4.6 (range, 3–16) in 39
Rubus accessions, respectively.
Castillo et al. (2010) showed 7.5 (range, 1–15) alleles in 48 red raspberry accessions and 14.4 (range, 3–29) alleles in 48 blackberry accessions, respectively.
Castillo et al. (2010) reported an average PIC value of 0.55 in the red raspberry collection, and
Dossett et al. (2012) reported an average PIC value of 0.49 using 21 SSR markers in wild and cultivated black raspberry. These results indicate that the 23 SSR markers acquired from
R. coreanus might be useful sources for performing genetic studies in
Rubus species although it seemed that the higher PIC value obtained in our study was due to various
Rubus species
The AMOVA analysis revealed that high genetic variability existed among and within
Rubus species in the study population.
Marulanda et al. (2012a) reported that the variation of
Rubus species was mostly attributed to individual variation.
Kollmann et al. (2000) concluded that genetic variability in
Rubus was determined by the plant propagation system and they demonstrated that there was an effect of cross-pollination between polyploid
Rubus species. According to the population structure and phylogenetic analysis based on SSR profiles, the sixty-nine accessions were distinguished by species in a rough way. However, two accessions, GCB0068 (
R. fruticosus) and GCB0002 (
R. crataegifolius var.
subcuneatus), were tied into other
Rubus species groups. This result might be caused by the species complexity and weaken species boundaries of geuns
Rubus (
Thompson 1995;
Alice and Campbell 1999).
It is important to evaluate the genetic background of germplasm for the use of genetic resources (
Mariac et al. 2006;
Tani et al. 2006). Fundamental information on the genetic differences in
Rubus species is essential for efficient conservation and management strategies for germplasm. The uncertain diversity of species and artificial groups of the
Rubus genus have created confusion with respect to the correct classification of the species at both commercial and scientific levels. The use of these new microsatellite markers will have a major impact on genetic analysis such as GD and evolutionary relationship among
Rubus species. The results of this study will provide information for future breeding programs and would be useful for the evaluation and conservation of genetic resources in various
Rubus species.
ACKNOWLEDGEMENTS
This research was supported by a Research Program (Code no. PJ008623) of Agricultural Science and Technology Development funded by National Institute of Agricultural Science, Rural Development Administration, Republic of Korea.
Fig. 1Principal coordinates analysis among Rubus genotypes based on genetic distance.
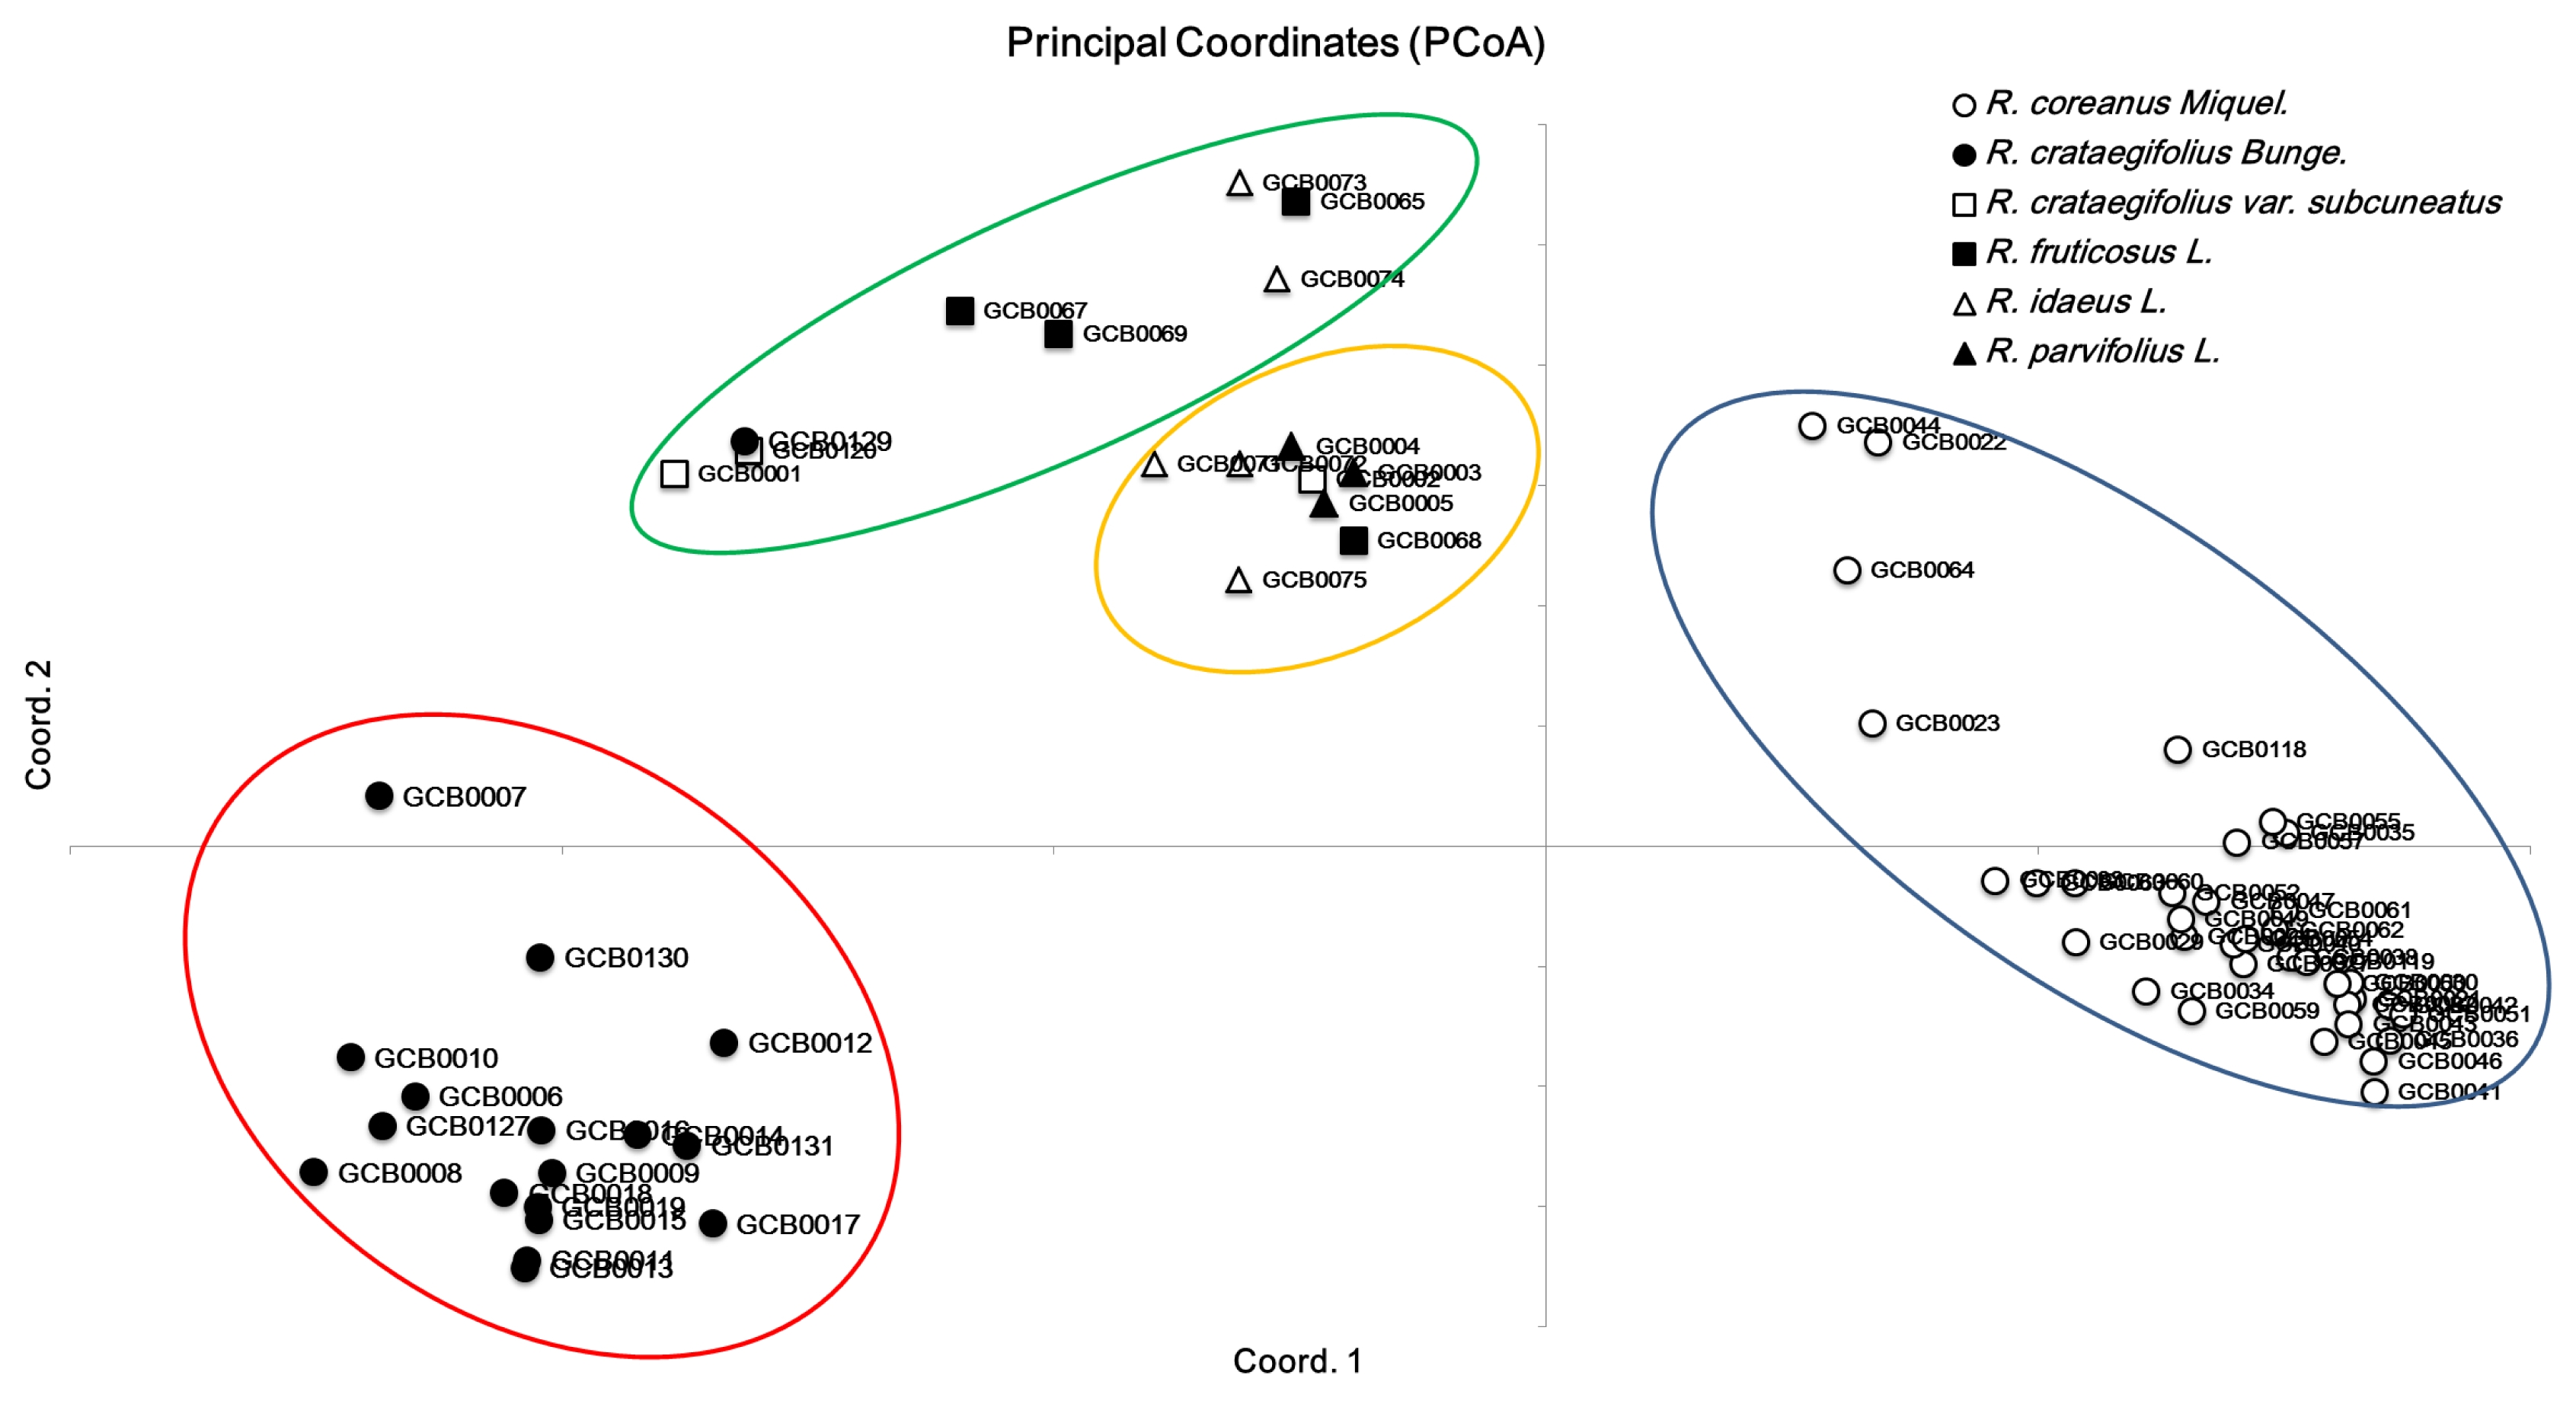
Fig. 2Model-based population structure (A) and phylogenetic dendrogram (B) based on simple sequence repeat profiles in Rubus species.
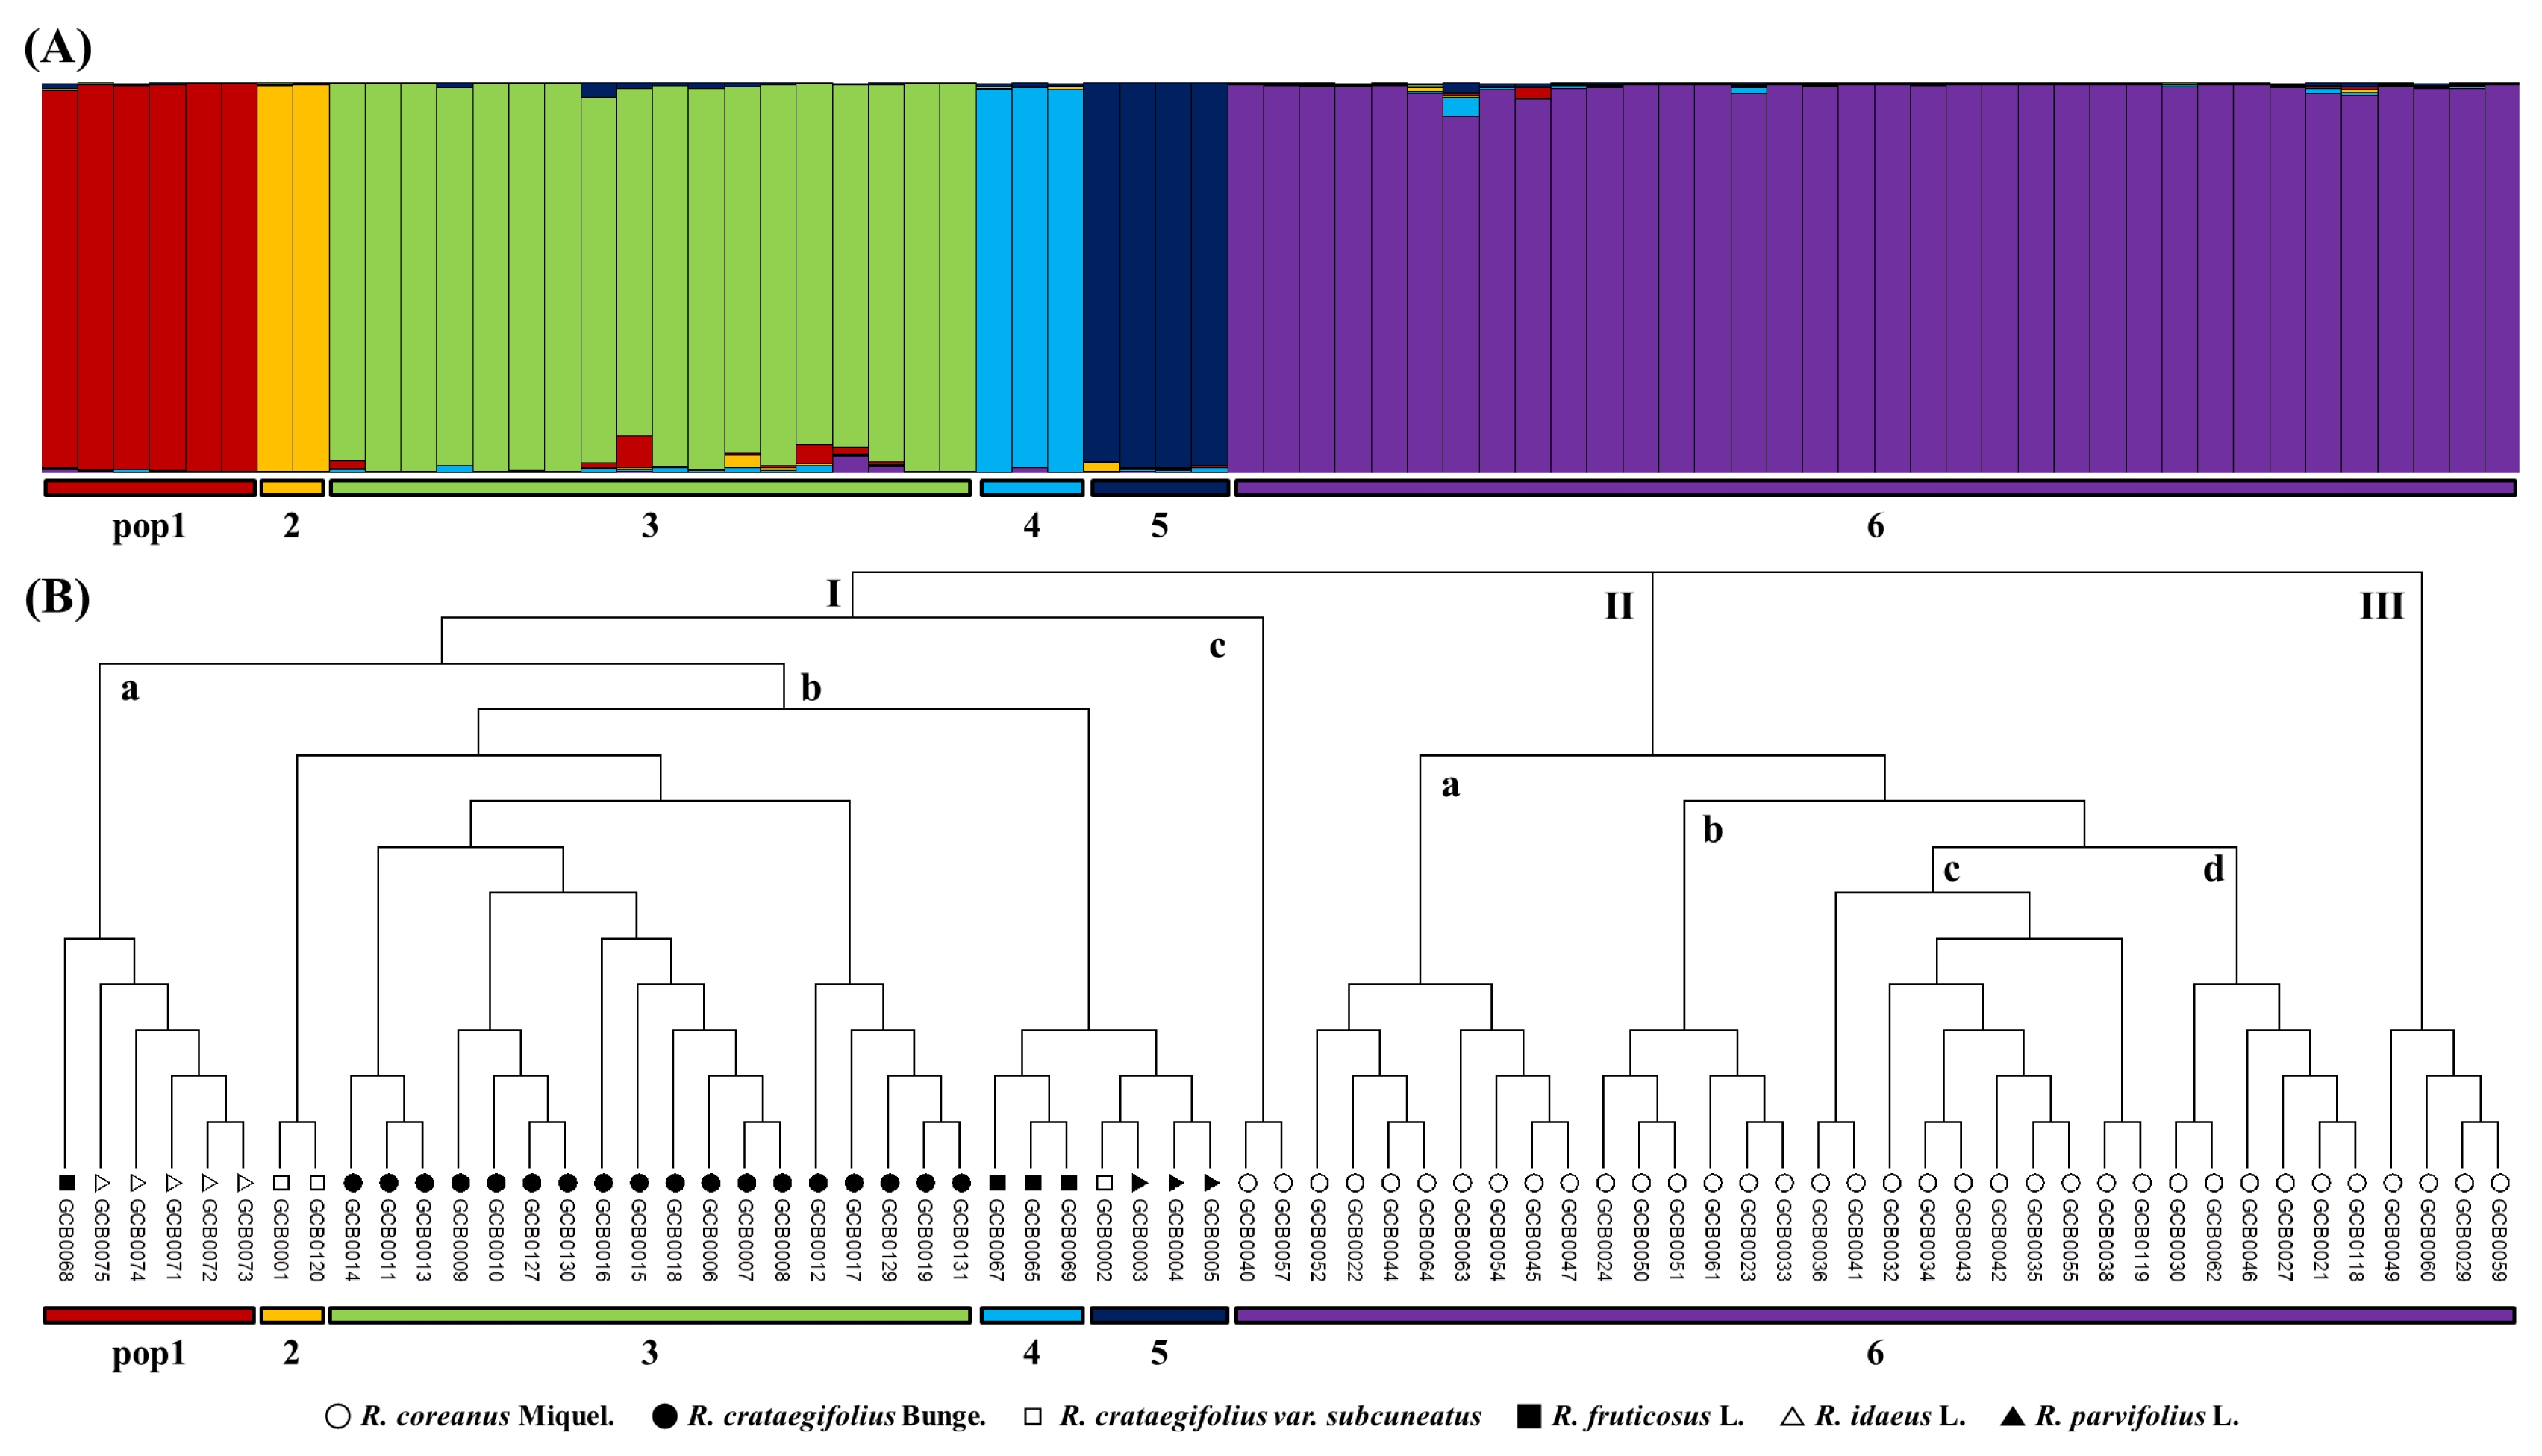
Table 1List of 69 accessions belonging to the genus Rubus in this study.
Table 1
|
Rubus species |
Accession number |
|
Rubus coreanus Miq. |
GCB0021 |
GCB0030 |
GCB0038 |
GCB0045 |
GCB0052 |
GCB0061 |
|
GCB0022 |
GCB0032 |
GCB0040 |
GCB0046 |
GCB0054 |
GCB0062 |
|
GCB0023 |
GCB0033 |
GCB0041 |
GCB0047 |
GCB0055 |
GCB0063 |
|
GCB0024 |
GCB0034 |
GCB0042 |
GCB0049 |
GCB0057 |
GCB0064 |
|
GCB0027 |
GCB0035 |
GCB0043 |
GCB0050 |
GCB0059 |
GCB0118 |
|
GCB0029 |
GCB0036 |
GCB0044 |
GCB0051 |
GCB0060 |
GCB0119 |
|
R. crataegifolius Bunge. |
GCB0006 |
GCB0009 |
GCB0012 |
GCB0015 |
GCB0018 |
GCB0129 |
|
GCB0007 |
GCB0010 |
GCB0013 |
GCB0016 |
GCB0019 |
GCB0130 |
|
GCB0008 |
GCB0011 |
GCB0014 |
GCB0017 |
GCB0127 |
GCB0131 |
|
R. crataegifolius var. subcuneatus
|
GCB0001 |
GCB0002 |
GCB0120 |
|
|
|
|
R. fruticosus L. |
GCB0065 |
GCB0067 |
GCB0068 |
GCB0069 |
|
|
|
R. idaeus L. |
GCB0071 |
GCB0072 |
GCB0073 |
GCB0074 |
GCB0075 |
|
|
R. parvifolius L. |
GCB0003 |
GCB0004 |
GCB0005 |
|
|
|
Table 2List of simple sequence repeat primers used for genotyping of 69 Rubus materials.
Table 2
|
Primer |
Accession No. |
R-motif |
Size (bp) |
NAz)
|
GD |
Ho |
PIC |
MAF |
|
GB-RC-074 |
JX976555 |
(AG)15 |
138–236 |
14 |
0.75 |
0.50 |
0.72 |
0.40 |
|
GB-RC-077 |
JX976557 |
(AAC)9 |
190–212 |
10 |
0.55 |
0.48 |
0.53 |
0.66 |
|
GB-RC-078 |
JX976558 |
(GCA)6 |
156–252 |
17 |
0.87 |
0.81 |
0.86 |
0.22 |
|
GB-RC-091 |
JX976559 |
(AG)15 |
235–271 |
17 |
0.87 |
0.46 |
0.85 |
0.25 |
|
GB-RC-098 |
JX976560 |
(GCA)4 |
201–222 |
6 |
0.57 |
0.29 |
0.52 |
0.61 |
|
GB-RC-100 |
JX976561 |
(AG)6 |
210–322 |
24 |
0.91 |
0.40 |
0.90 |
0.19 |
|
GB-RC-105 |
JX976562 |
(GT)8 |
141–183 |
13 |
0.77 |
0.78 |
0.75 |
0.42 |
|
GB-RC-109 |
JX976563 |
(TC)12 |
165–205 |
20 |
0.86 |
0.47 |
0.85 |
0.25 |
|
GB-RC-111 |
JX976564 |
(CA)11 |
166–248 |
11 |
0.65 |
0.67 |
0.62 |
0.56 |
|
GB-RC-138 |
JX976565 |
(ACACTC)4 |
199–227 |
15 |
0.79 |
0.47 |
0.76 |
0.34 |
|
GB-RC-141 |
JX976566 |
(GA)6 |
163–225 |
18 |
0.65 |
0.42 |
0.64 |
0.58 |
|
GB-RC-145 |
JX976568 |
(AC)9,(CAA)5 |
256–294 |
8 |
0.61 |
0.19 |
0.55 |
0.55 |
|
GB-RC-146 |
JX976569 |
(CTT)5 |
158–194 |
9 |
0.63 |
0.25 |
0.58 |
0.54 |
|
GB-RC-166 |
JX976570 |
(TTGAAG)6 |
167–213 |
18 |
0.87 |
0.50 |
0.86 |
0.19 |
|
GB-RC-167 |
JX976571 |
(TC)17 |
187–267 |
26 |
0.91 |
0.82 |
0.91 |
0.17 |
|
GB-RC-178 |
JX976572 |
(CA)15 |
151–211 |
19 |
0.88 |
0.74 |
0.87 |
0.24 |
|
GB-RC-186 |
JX976573 |
(TTG)5 |
267–305 |
17 |
0.79 |
0.67 |
0.77 |
0.36 |
|
GB-RC-191 |
JX976574 |
(GA)6 |
271–309 |
14 |
0.88 |
0.77 |
0.87 |
0.17 |
|
GB-RC-193 |
JX976575 |
(GA)18 |
273–295 |
12 |
0.86 |
0.74 |
0.85 |
0.21 |
|
GB-RC-194 |
JX976576 |
(ACA)8 |
237–261 |
9 |
0.70 |
0.54 |
0.66 |
0.49 |
|
GB-RC-211 |
JX976578 |
(GGA)7 |
188–210 |
12 |
0.84 |
0.45 |
0.82 |
0.33 |
|
GB-RC-243 |
JX976581 |
(TGT)9 |
156–248 |
21 |
0.81 |
0.49 |
0.79 |
0.32 |
|
GB-RC-245 |
JX976582 |
(AG)14 |
250–300 |
21 |
0.92 |
0.70 |
0.91 |
0.13 |
|
Total |
351 |
- |
- |
- |
- |
|
Mean |
15.3 |
0.78 |
0.55 |
0.76 |
0.35 |
Table 3Summary analysis of molecular variance for simple sequence repeat markers.
Table 3
|
Source |
dfz)
|
SS |
MS |
Est. Var. |
% |
|
Among species |
5 |
287.203 |
57.441 |
2.688 |
26 |
|
Among accessions |
63 |
592.906 |
9.411 |
1.847 |
18 |
|
Within accessions |
69 |
394.500 |
5.717 |
5.717 |
56 |
|
Total |
137 |
1274.609 |
|
10.253 |
100 |
References
- Alice LA. 2002. Evolutionary relationships in Rubus (Rosaceae) based on molecular data. International Society for Horticultural Science (ISHS). Leuven, Belgium: pp. 79-83.
- Alice LA, Campbell CS. 1999. Phylogeny of Rubus (rosaceae) based on nuclear ribosomal DNA internal transcribed spacer region sequences. Am J Bot. 86: 81-97.
- Castillo NRF, Reed BM, Graham J, Fernández-Fernández F, Bassil NV. 2010. Microsatellite markers for raspberry and blackberry. J Am Soc Hortic Sci. 135: 271-278.
- Dossett M, Bassil NV, Lewers KS, Finn CE. 2012. Genetic diversity in wild and cultivated black raspberry (Rubus occidentalis L.) evaluated by simple sequence repeat markers. Genet Resour Crop Evol. 59: 1849-1865.
- Evanno G, Regnaut S, Goudet J. 2005. Detecting the number of clusters of individuals using the software STRUCTURE: a simulation study. Mol Ecol. 14: 2611-2620.
- Feingold S, Lloyd J, Norero N, Bonierbale M, Lorenzen J. 2005. Mapping and characterization of new EST-derived microsatellites for potato (Solanum tuberosum L.). Theor Appl Genet. 111: 456-466.
- Graham J, Smith K, MacKenzie K, Jorgenson L, Hackett C, Powell W. 2004. The construction of a genetic linkage map of red raspberry (Rubus idaeus subsp. idaeus) based on AFLPs, genomic-SSR and EST-SSR markers. Theor Appl Genet. 109: 740-749.
- Graham J, Squire GR, Marshall B, Harrison RE. 1997. Spatially dependent genetic diversity within and between colonies of wild raspberry Rubus idaeus detected using RAPD markers. Mol Ecol. 6: 1001-1008.
- Jennings DL. 1988. Raspberries and blackberries: their breeding, diseases and growth. Academic Press. London.
- Kollmann J, Steinger T, Roy BA. 2000. Evidence of sexuality in European Rubus (Rosaceae) species based on AFLP and allozyme analysis. Am J Bot. 87: 1592-1598.
- Laurent V, Devaux P, Thiel T, Viard F, Mielordt S, Touzet P, et al. 2007. Comparative effectiveness of sugar beet microsatellite markers isolated from genomic libraries and GenBank ESTs to map the sugar beet genome. Theor Appl Genet. 115: 793-805.
- Lee GA, Song JY, Choi HR, Chung JW, Jeon YA, Lee JR, et al. 2015. Novel microsatellite markers acquired from Rubus coreanus Miq. and cross-amplification in other Rubus species. Molecules. 20: 6432-6442.
- Lewers KS, Saski CA, Cuthbertson BJ, Henry DC, Staton ME, Main DS, et al. 2008. A blackberry (Rubus L.) expressed sequence tag library for the development of simple sequence repeat markers. BMC Plant Biol. 8: 69
- Liu K, Muse SV. 2005. PowerMarker: an integrated analysis environment for genetic marker analysis. Bioinformatics. 21: 2128-2129.
- Mariac C, Luong V, Kapran I, Mamadou A, Sagnard F, Deu M, et al. 2006. Diversity of wild and cultivated pearl millet accessions (Pennisetum glaucum [L.] R. Br.) in Niger assessed by microsatellite markers. Theor Appl Genet. 114: 49-58.
- Marulanda M, Lopez AM, Uribe M. 2012a. Genetic diversity and transferability of rubus microsatellite markers to South American Rubus species. Caliskan M, editor. The molecular basis of plant genetic diversity. InTech. Rijeka, Croatia.
- Marulanda M, López AM, Uribe M. 2012b. Molecular characterization of the Andean blackberry, Rubus glaucus, using SSR markers. Genet Mol Res. 11: 322-331.
- Peakall R, Smouse PE. 2012. GenAlEx 6.5: genetic analysis in Excel. Population genetic software for teaching and research: an update. Bioinformatics. 28: 2537-2539.
- Pritchard JK, Stephens M, Donnelly P. 2000. Inference of population structure using multilocus genotype data. Genetics. 155: 945-959.
- Schuelke M. 2000. An economic method for the fluorescent labeling of PCR fragments. Nat Biotechnol. 18: 233-234.
- Tamura K, Dudley J, Nei M, Kumar S. 2007. MEGA4: Molecular Evolutionary Genetics Analysis (MEGA) software version 4.0. Mol Biol Evol. 24: 1596-1599.
- Tani N, Yoshimaru H, Kawahara T, Hoshi Y, Nobushima F, Yasui T. 2006. Determination of the genetic structure of remnant Morus boninensis Koidz. trees to establish a conservation program on the Bonin Islands. Japan BMC Ecol. 6: 14
- Thompson MM. 1995. Chromosome numbers of Rubus cultivars at the National Clonal Germplasm Repository. Hortscience. 30: 1453-1456.
- Thompson MM. 1997. Survey of chromosome numbers in Rubus (Rosaceae: Rosoideae). Ann Missouri Bot Gard. 84: 128-164.


