Abstract
Rice varieties developed through the inter-specific crosses between Asian (Oryza sativa L.) and African cultivated rice (O. glaberrima Steud.) have contributed to yield enhancement of African rice. However, the genetic diversity and genetic structure of the African varieties have rarely been reported. In this study, we characterized 40 rice varieties including rice released in Africa based on eleven yield related agronomic traits and 96 single nucleotide polymorphism (SNP) markers. They were grouped into three categories based on the cluster analysis using agronomic traits. Meanwhile, they were grouped into two distinct clusters, indica- and japonica-type, based on the genetic distance using 96 SNP markers. CG14, which belongs to O. glaberrima, was found to be an admixture type between indica and japonica. The number of secondary branches (SBs) was the only agronomic trait which was significantly different between two groups. The results of this study provide basic agronomic and genomic information of cultivated and tested rice varieties for Africa, that would be helpful for further rice varietal improvement in Africa.
-
Key words: African rice, Agronomic traits, Single nucleotide polymorphism, Genetic diversity
INTRODUCTION
Genus Oryza comprises two cultivated and 22 wild species (
Vaughan et al. 2003;
Jena 2010). Two species of the cultivated rice,
Oryza sativa and
O. glaberrima, were originated from Asia and West Africa, respectively. Asian cultivated rice (
O. sativa L.) consists of two major subspecies,
indica and
japonica. The
japonica rice is divided into two subgroups as temperate and tropical
japonica, and
indica has several subgroups adapted to diverse environments (
Khush 1997). African cultivated rice (
O. glaberrima) has survived and developed the mechanisms to adapt and protect against biotic and abiotic stresses. African cultivated rice has two major ecotypes: floating photosensitive ecotype and early erect ecotype. Floating photosensitive ecotype varieties are grown in deep water including coastal mangrove areas and early erect ecotype varieties are grown in upland or moderately flooded lowlands (
Sarla and Swamy 2005). Natural hybridization and admixture with its wild parents and
O. sativa can be found in the African rice cultivated area. There are many varieties showing great performance to abiotic and biotic stresses such as drought, flood, pests and diseases in African rice varieties (
Agnoun et al. 2012). Nevertheless, Asian rice is rapidly replacing African rice in terms of cultivated area mainly due to low yield potential and high shattering habit of African rice varieties (
Jones et al. 1997).
NERICA (NEw RICe for Africa) rice varieties have been developed by Africa Rice Center (ARC) in collaboration with the national partners to increase of rice production in Africa. The NERICA varieties were obtained from the interspecific hybridization between
O. glaberrima and
O. sativa. Rice breeders have incorporated many desirable traits from the two species preferable by the farmers encountering the harsh environment in Africa. The first generation of NERICA varieties (NERICA 1 to NERICA 11) were developed from crosses between CG14 (
O. glaberrima) and WAB56-104 (an upland improved variety of
O. sativa spp.
japonica). Subsequently NERICAs 12 to 18 were developed from the two crosses: CG14× WAB 56-50 and CG14×WAB 181-18 (
Somado et al. 2008). All 18 NERICA varieties were suitable for the upland rice ecology of Sub-Saharan Africa (SSA) (
Semagn et al. 2006).
Many of high-yield potential varieties must have been developed as well. As a general approach to identify the genetic contribution to high productivity, understanding of genetic diversity is essential for effective conservation and utilization of rice genetic resources (
Tu et al. 2007). Molecular markers utilize a naturally occurring polymorphisms in DNA sequences such as insertions, deletions, and substitutions. DNA markers can be utilized at any developmental stage of plant and any environmental conditions throughout the genome with relatively simple way (
Joshi et al. 1999). A DNA marker based on single nucleotide polymorphisms (SNPs) is replacing the conventional DNA markers. SNPs are potential to increase the speed and reduce the cost for genotyping with high-throughput. Differences in DNA sequences reflect genetic variations and high-throughput SNP genotyping is a useful method for revealing rice genetic diversity (
Zhao et al. 2010;
Thomson et al. 2014).
In this study, a total of 40 rice varieties including three check varieties and 37 germplasm released in Africa were characterized. The genetic variability among these cultivars are rarely known though it has been used in various rice improvement programs. Therefore, the current study was conducted for the characterization of these varieties with 11 agronomic traits using 96 SNP markers.
MATERIALS AND METHODS
Plant materials
A total of 40 rice varieties were used in this study (
Table 1). These varieties were obtained from Ethiopian Institute of Agricultural Research, except for three check cultivars which were obtained from Crop Molecular Breeding Laboratory of Seoul National University. The 37 varieties were introduced to Ethiopian Institute of Agricultural Research from ARC in which the varieties were tested for Multi Environmental Trials. A total of 18 varieties out of them were developed or originated from ARC, ten from India, two from Vietnam, two from Bangladesh, two from Pakistan, one from Iran and two from International Rice Research Institute. Three check varieties were IR64 (
indica), Nipponbare (temperate
japonica) and Malagkit Sinaguing (tropical
japonica). In 2014, all varieties were planted at the rate of one plant per hill and grown by conventional cultural practices at the Experimental Farm of Seoul National University in Suwon, Korea.
The following 11 agronomic traits were used for characterization of 40 varieties: panicle number per plant (PN), plant height (PH), panicle length (PL), number of primary branch (PB), number of SB, number of spikelet per panicle (SP), spikelet fertility (SPF), 1,000 grain weight (KGW), grain width (GW), grain length (GL), and grain shape (GS). PN was measured as number of panicles in one plant. PH was measured in centimetres from soil surface to tip of the longest flag leaf. PL was measured in centimetres from panicle neck to panicle tip. PB and SB was calculated as the number of PB and SB per one panicle, respectively. SP was calculated as the average number of SP. SPF was calculated as filled grain per total number of spikelet in a panicle, and the values were transformed into percentage.
Harvested grains were air-dried and stored at room temperature before measurement. Ten fully filled grains harvested from each variety were used to measure GL and GW at 0.01 mm precision using digital microscope and SmartGrain Version 1.2 software (
Tanabata et al. 2012) GS was calculated as GL divided by GW. KGW was measured in grams as the weight of 1,000 fully ripened (14% moisture) grains per germplasm. For each germplasm, six well-grown plants were selected and used for characterization using agronomic traits.
One-way analysis of variance (ANOVA) was performed and least significant difference (LSD) was used to detect significant differences of agronomic traits among the 40 varieties using SAS software (Statistical Analysis System) version 9.2 (2008; SAS Institute, Cary, NC, USA). Coefficients of variation (CV %) were determined as indicators of variation. Cluster analysis was conducted using UPGMA (Unweighted Pair Group Method with Arithmetic Mean). Similarity matrix and distance matrix were calculated based on Pearson’s coefficient using web software DendroUPGMA (
http://genomes.urv.cat/UPGMA) (
Garcia-Vallvé et al. 1999). Dendrogram was visualized in Molecular Evolutionary Genetics Analysis version 6.0; MEGA6 (
Tamura et al. 2013). Duncan’s multiple-range test and Student’s t-test were used to detect significances of eleven agronomic traits among subpopulations using SAS 9.2.
The young leaves of rice seedlings were collected at 3–4 leaf stage. Total genomic DNA was extracted from young leaf tissue using modified CTAB method (
Murray and Thompson 1980). DNA concentration was normalized using a NanoDrop spectrophotometer (Thermo Scientific, Wilmington, DE, USA). DNA stocks were diluted to 50 ng/μl as working solutions.
The 96-plex SNP set developed in Crop Molecular Breeding Lab., Seoul National University was used for genotyping (unpublished). The 96 SNPs were evenly distributed on rice genome and the interval of adjacent SNPs was 4–5 Mb. Each SNP represented indica/japonica difference in twelve rice chromosomes. The 96.96 Dynamic Arrays using the BioMark HD System (Fluidigm Corp, San Francisco, CA, USA) according to the manufacturer’s instruction. Genotypes based on BioMark HD measurements were made using the Fluidigm SNP Genotyping Analysis software.
Genotype data analysis
Major allele frequency (MAF), Number of alleles (NA), Heterozygosity, and polymorphism information content (PIC) of 96 SNPswere analysed using PowerMarker V3.25 (
Liu and Muse 2005). A model-based Bayesian approach implemented in the software package STRUCTURE 2.3.4 (
Pritcharda et al. 2010) was used to estimate the number of subpopulations (
k=1 to
k=10) given an admixture model with correlated allele frequencies. Simulations were run with 100,000 burn-in period and 100,000 Markov Chain Monte Carlo (MCMC) repeats followed ten independent iterations. The optimal number of subpopulations corresponds to the highest peak in the Delta
k graph (
Evanno et al. 2005) and the germplasm with membership probabilities show more than 70% were assigned to each subpopulation. PowerMarker V3.25 (
Liu and Muse 2005) was used to calculate genetic distance based on CS Chord (
Cavalli-Sforza and Edwards 1967) and construct an un-weighted pair group methods with arithmetic mean algorithm (UPGMA) dendrogram, which visualized in Molecular Evolutionary Genetics Analysis version 6.0; MEGA6 (
Tamura et al. 2013).
RESULTS
Diversity and correlations of agronomic traits
The average value and variance for the eleven agronomic traits of 40 rice varieties were presented in
Table 2. They showed highly significant phenotypic variations (
P<0.01) in all traits, indicating that the presence of high phenotypic diversity among 40 varieties of rice. To compare the variability of a morphological trait among 40 rice varieties, the coefficient of variations (CVs) were calculated. CVs of each trait ranged from 10.83% to 33.58%. The highest CV of 39.42% was observed for the number of SB, while the lowest CV of 10.83% was exhibited for the PL. Among those agronomic traits, number of PB showed positive significant correlation with number of SB and number of SP; however, number of panicle (PN) did not have significant correlation with other traits. Moreover, PH and PL showed significant correlation only to each other (
Table 3).
Cluster analysis was performed to elucidate the relationship among the genotypes and the dendrogram generated by UPGMA is displayed (
Fig. 1). The UPGMA based dendrogram showed three distinct groups, G1, G2 and G3. Of three check varieties, both tropical and temperate
japonica varieties, Malagkit Sinaguing and Nipponbare, respectively were grouped into G3 together with CG14 and three more varieties. On the other hand, IR64,
indica check accession, was clustered into G2 comprising of 25 varieties including all NERICAs.
Each groups showed peculiar agronomic traits which represent the group categories (
Table 4). G1, including nine varieties, showed significantly different from G2 and G3 with the highest number of PB (13.56±1.22), number of SB (56.78±5.58), and spikelet number per panicle (287.26±33.93). Significantly lowest SPF (64.24±12.87), KGW (18.51±4.48) and GL (6.85±0.61) were also observed in G1. However, G2, comprising 25 varieties showed no significantly outstanding value in all traits. G3 of six varieties with the tallest PH (135.47±23.03) and small panicle characteristics with the lowest number of SB (18.44±5.71) and number of SP (114.95±19.34). Although, G3 showed small panicle, SPF (86.84±7.78), KGW (31.17±7.30), and GW (3.39±0.52) represented the highest value which was significantly different from both groups, G1 and G2.
All the varieties were genotyped with the 96-plex
indica/
japonica SNP set using Fluidigm BioMark HD system. The SNP markers were evenly distributed across the 12 rice chromosomes, with the number of SNP markers per chromosome varying from 7 (chromosome 7, 9, 10, 11, and 12) to 11 (chromosome 1) and average SNP interval of chromosome varying 3.8 Mb (chromosome 9) to 5 Mb (chromosome 11). 96-plex
indica/
japonica SNP set was developed based on SNP, which almost showed bi-allele, between
indica and
japonica. Hence the average NA was 2.04 among the varieties. The MAF per SNP ranged from 0.500 (id10000113) to 0.950 (id1010652, id3007541, id4003524, wd8001250, id8004111, id12005212), with an average value of 0.834. Of the 96 SNPs, the overall PIC value ranged from 0.0905 (id1010652, id3007541, id4003524, wd8001250, id8004111, id12005212) to 0.4023 (id4007882), with an average value of 0.2145. Almost all SNPs showed no heterozygosity with an average value of 0.096 and id4007882 showed the highest heterozygosity (0.300) (
Appendix).
To determine the genetic relationship among individual rice varieties, STRUCTURE analysis was conducted based on 96 SNP genotype. In the model-based grouping analysis, Ln
P(D) value exhibited a high turning point at
k=2 (
Fig. 2A). Evanno’s Delta
k also exhibited a sharp peak at
k=2 (
Fig. 2B). Both Ln
P(D) and Delta
k values indicated two distinct groups most possibly among 40 varieties. At
k=2, two populations correspond to
indica type and
japonica type. Out of 37 varieties, 34 varieties were grouped into
indica type and the two varieties, ESMET115 (26) and NERICA4 (34) were clustered into
japonica type. However, an admixed accession, CG14 (35) showed a probability of less than 70% to both
indica and
japonica types (
Fig. 2C).
A UPGMA dendrogram of 40 varieties was constructed based on CS Chord (
Cavalli-Sforza and Edwards 1967) genetic distance using 96 SNP markers (
Fig. 3). It revealed genetic relationships fairly consistent with the STRUCTURE-based membership assignment for the most of the varieties. The UPGMA dendrogram showed that the rice varieties were separated according to their sub-specific genomic composition, i.e.,
indica type and
japonica type.
Average value of the traits in each variety was represented in
Table 5. There was narrow range of agronomic trait variability between
indica and
japonica groups formed based on SNP markers. The number of SB was the only agronomic traits found significantly different between these two groups.
DISCUSSION
The varieties in this study were divided into three groups based on the eleven agronomic traits. The G1 showed big panicle characteristics with the highest PB, SB, and SP. However, the G1 showed the lowest SPF and KGW with relatively small grain. G3 showed the tallest PH and small panicle characteristics with the lowest SB and SP. Although, G3 showed small panicle, those SPF, KGW, and GW represented highest value among three groups (
Table 4). Rice yield is determined by several yield components including number of plants per unit area, number of panicles per plant, number of grains per panicle, SPF, and grain weight. We calculated yield potential per plant for three groups by the equation [PN×SP×(SPF/100)×(KGW/1,000)]. G2 showed the highest grain yield potential per plant (45.33 g) within the three groups (G1, 41.74 g; G3, 40.26 g), despite no significantly outstanding value among those traits. IR64 (
indica reference), all NERICA cultivars and almost ARC originated germplasm were clustered in the G2 (
Table 1,
Fig. 1). Those varieties which to belong G2 were supposed to be developed for high yield potential in Africa.
As results of model-based structural analysis and genetic distance based cluster analysis using 96 SNP markers, all the varieties were classified into two distinct groups,
indica type and
japonica type, except CG14 which showed admixture type.
Jones et al. (1997) described CG14 is one of parental
O. glaberrima accession used in generation of the NERICA cultivars that revolutionized rice cultivation in West Africa by combining the high-yielding traits of Asian rice with the adaptive traits of West African rice. In this study, CG14 was not clearly distinguished from Asian cultivated rice based on 96 SNPs. Since the 96-plex
indica/
japonica SNP set was developed for assay the differences between
indica and
japonica in
O. sativa, not for between
O. glaberrima and
O. sativa.
Including IR64 (
indica check variety), NERICA-L-16 and NERICA-L-19, the cultivar from cross between
O. glaberrima and
indica rice (TOG5681/3*IR64), were clustered in the same group based on both agronomic traits and SNP markers. However, NRICA4 and ESMET115 which were placed together with IR64 using agronomic traits were found to be grouped with
japonica and tropical
japonica check varieties (Nipponbare and Malagkit sinaguing) based on clusters formed using SNPs markers. Similarly, non-consistent placement of other cultivars was observed in the groups identified using SNPs markers and agronomic traits. The pedigree of NERICA4; WAB 56-104/CG14//2*WAB 56-104, indicated it was designed to have high genetic composition of
japonica parent, WAB 56-104.
Wang et al. (2013) have suggested that inconsistent results of clusters based on morphological traits and DNA markers might be caused by different purposes for which traits are manipulated in the process of crop improvement and diversified habitats during breeding period. Accordingly, genetic diversity based on agronomic traits may differ from that based on SNP markers in this study, probably caused by selection pressure in breeding process and environmental condition. In addition, the agronomic data were not related to subspecies specific traits but yield related agronomic traits.
In conclusion, the result of genetic diversity analysis using 11 agronomic traits and 96 SNP markers implied that about 78% of ARC originated varieties were developed for high yield potential by hybridization between O. glaberrima and O. sativa belonged to G2, agronomic trait based group, where high yielding potential was recorded for the group as compared to the others. The agronomic and genomic information of these rice varieties are expected to be helpful for further varietal improvement in rice breeding program in Africa.
Supplementary Information
ACKNOWLEDGEMENTS
This work was supported by a grant from the Next- Generation BioGreen 21 Program (Plant Molecular Breeding Center No. PJ01102401), Rural development Administration, Republic of Korea.
Fig. 1UPGMA Dendrogram of 40 varieties based on 11 agronomic traits. The colour of each germplasm corresponds to three subpopulations (G1, blue; G2, green; G3, red).
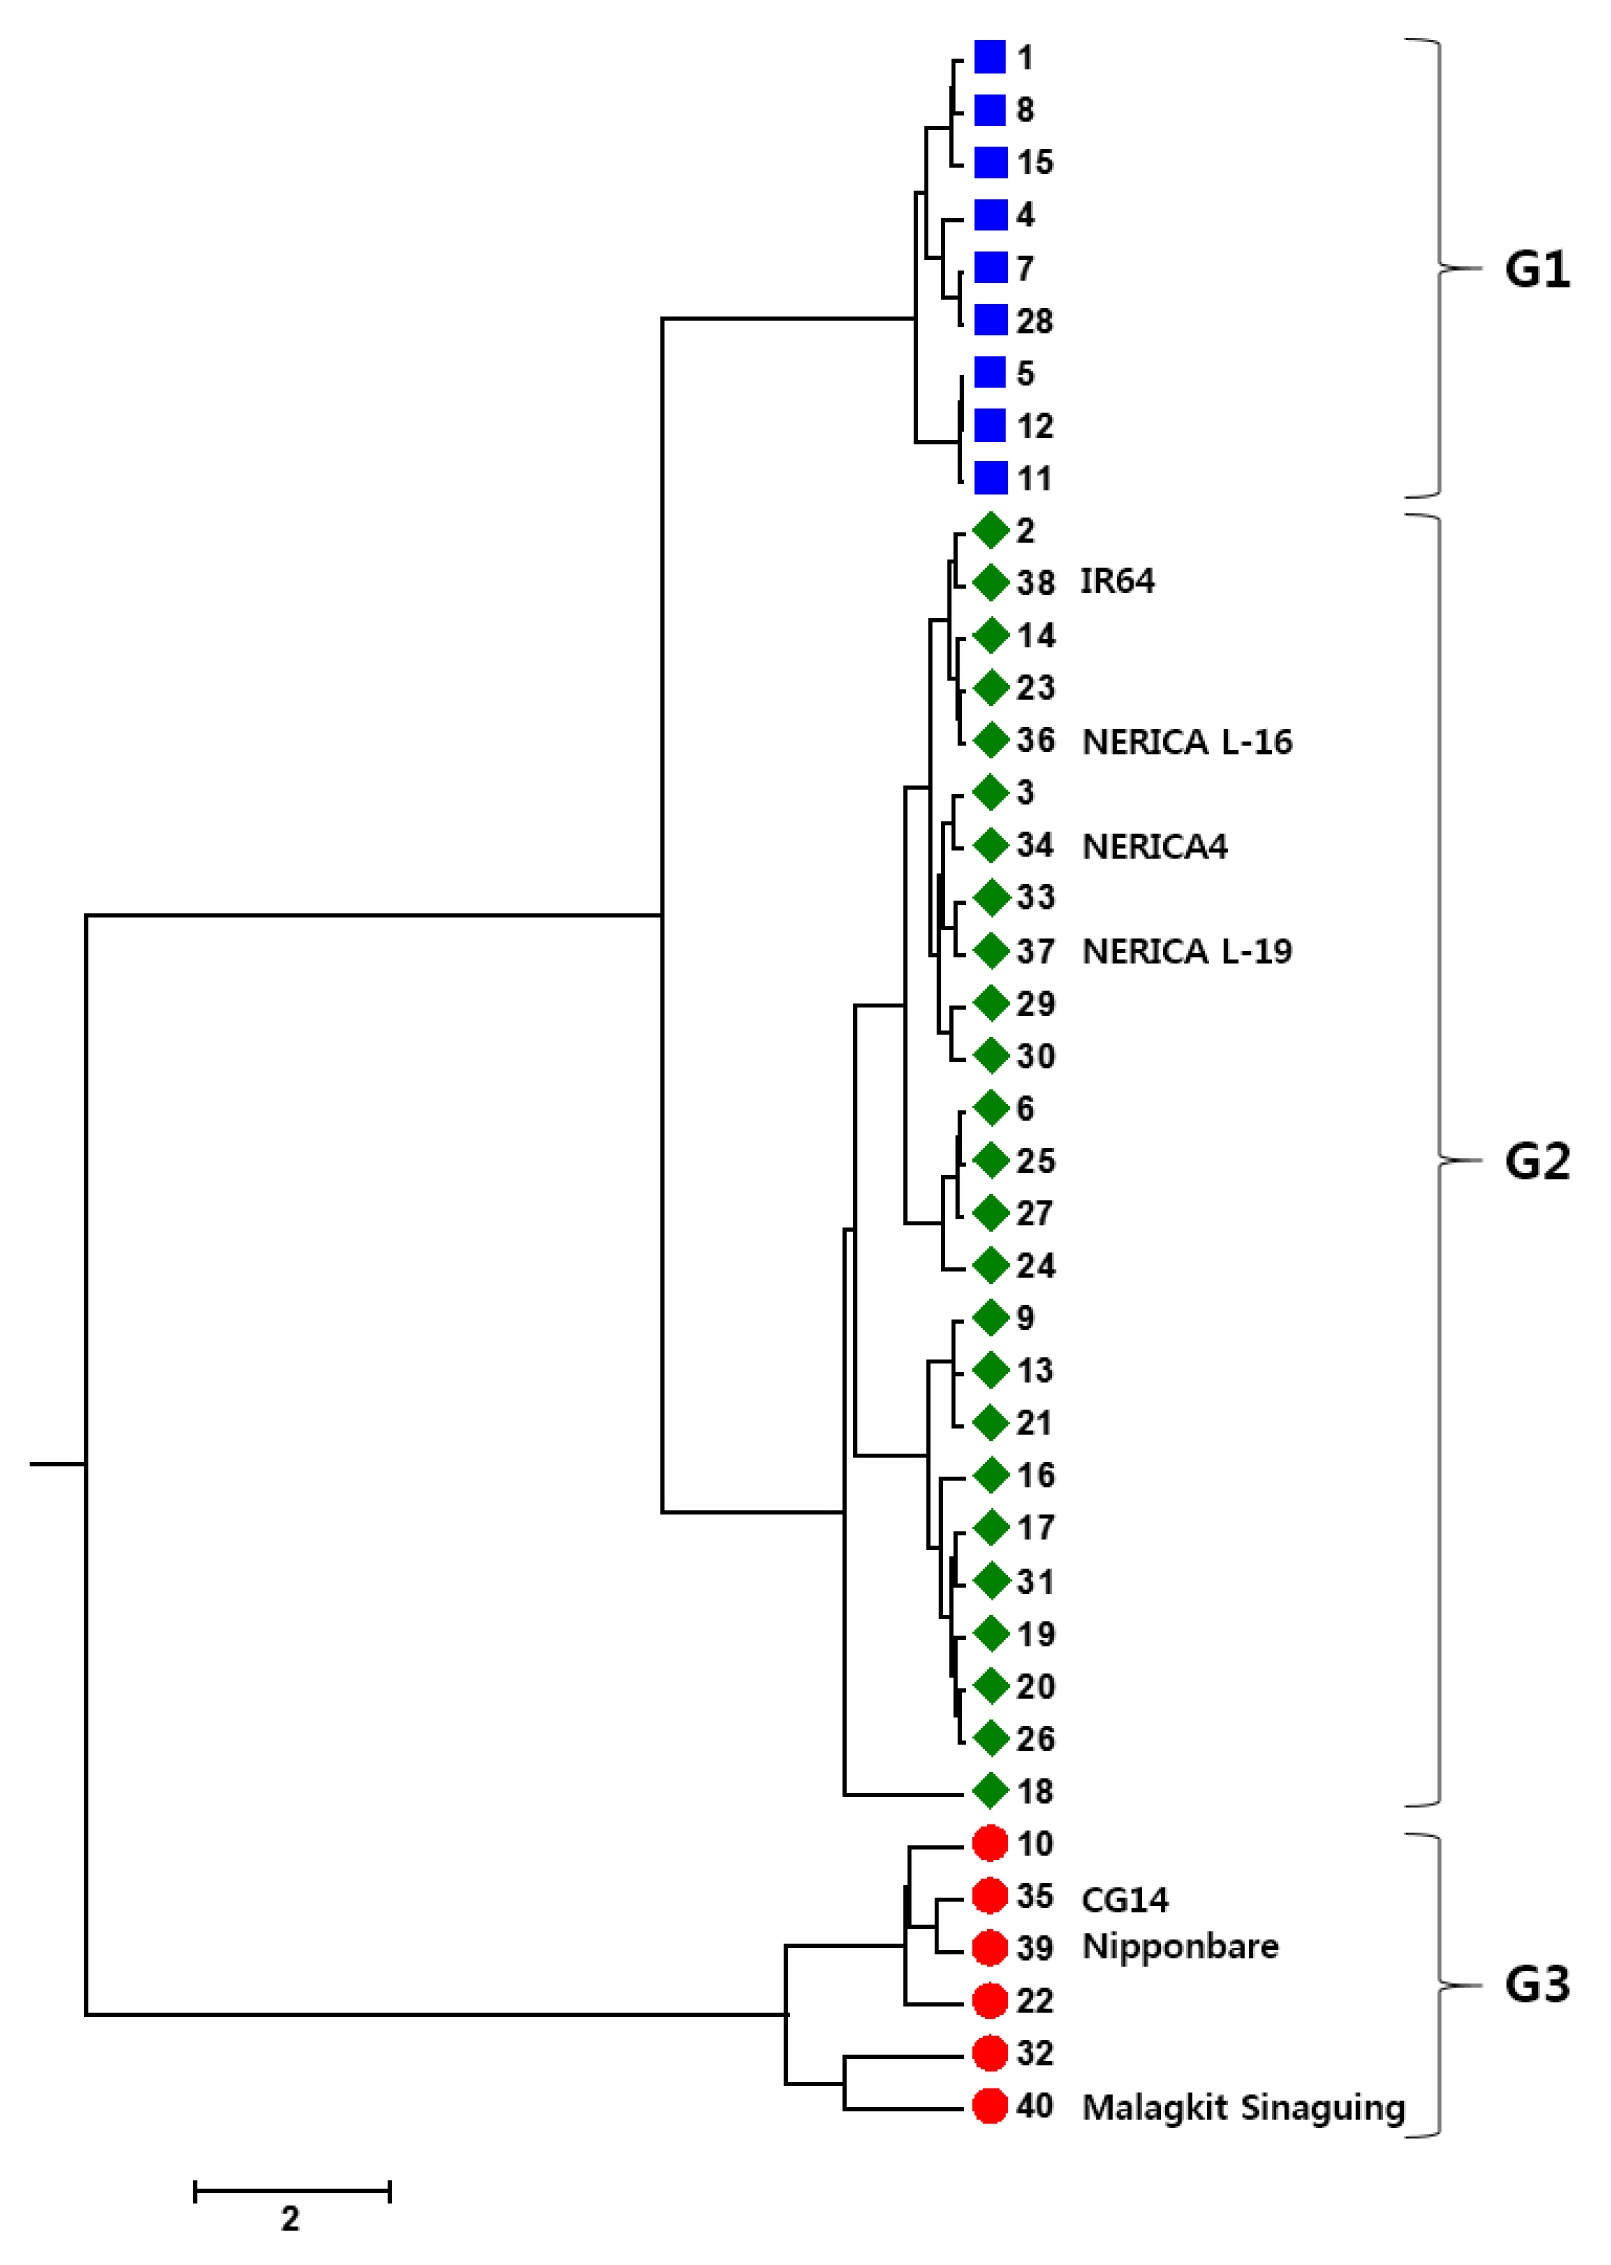
Fig. 2STRUCTURE analysis of 40 varieties based on 96 single nucleotide polymorphisms. (A) plot of Ln P(D), (B) plot of Delta k with K=1–10, (C) population structure of 40 germplasms at K=2.
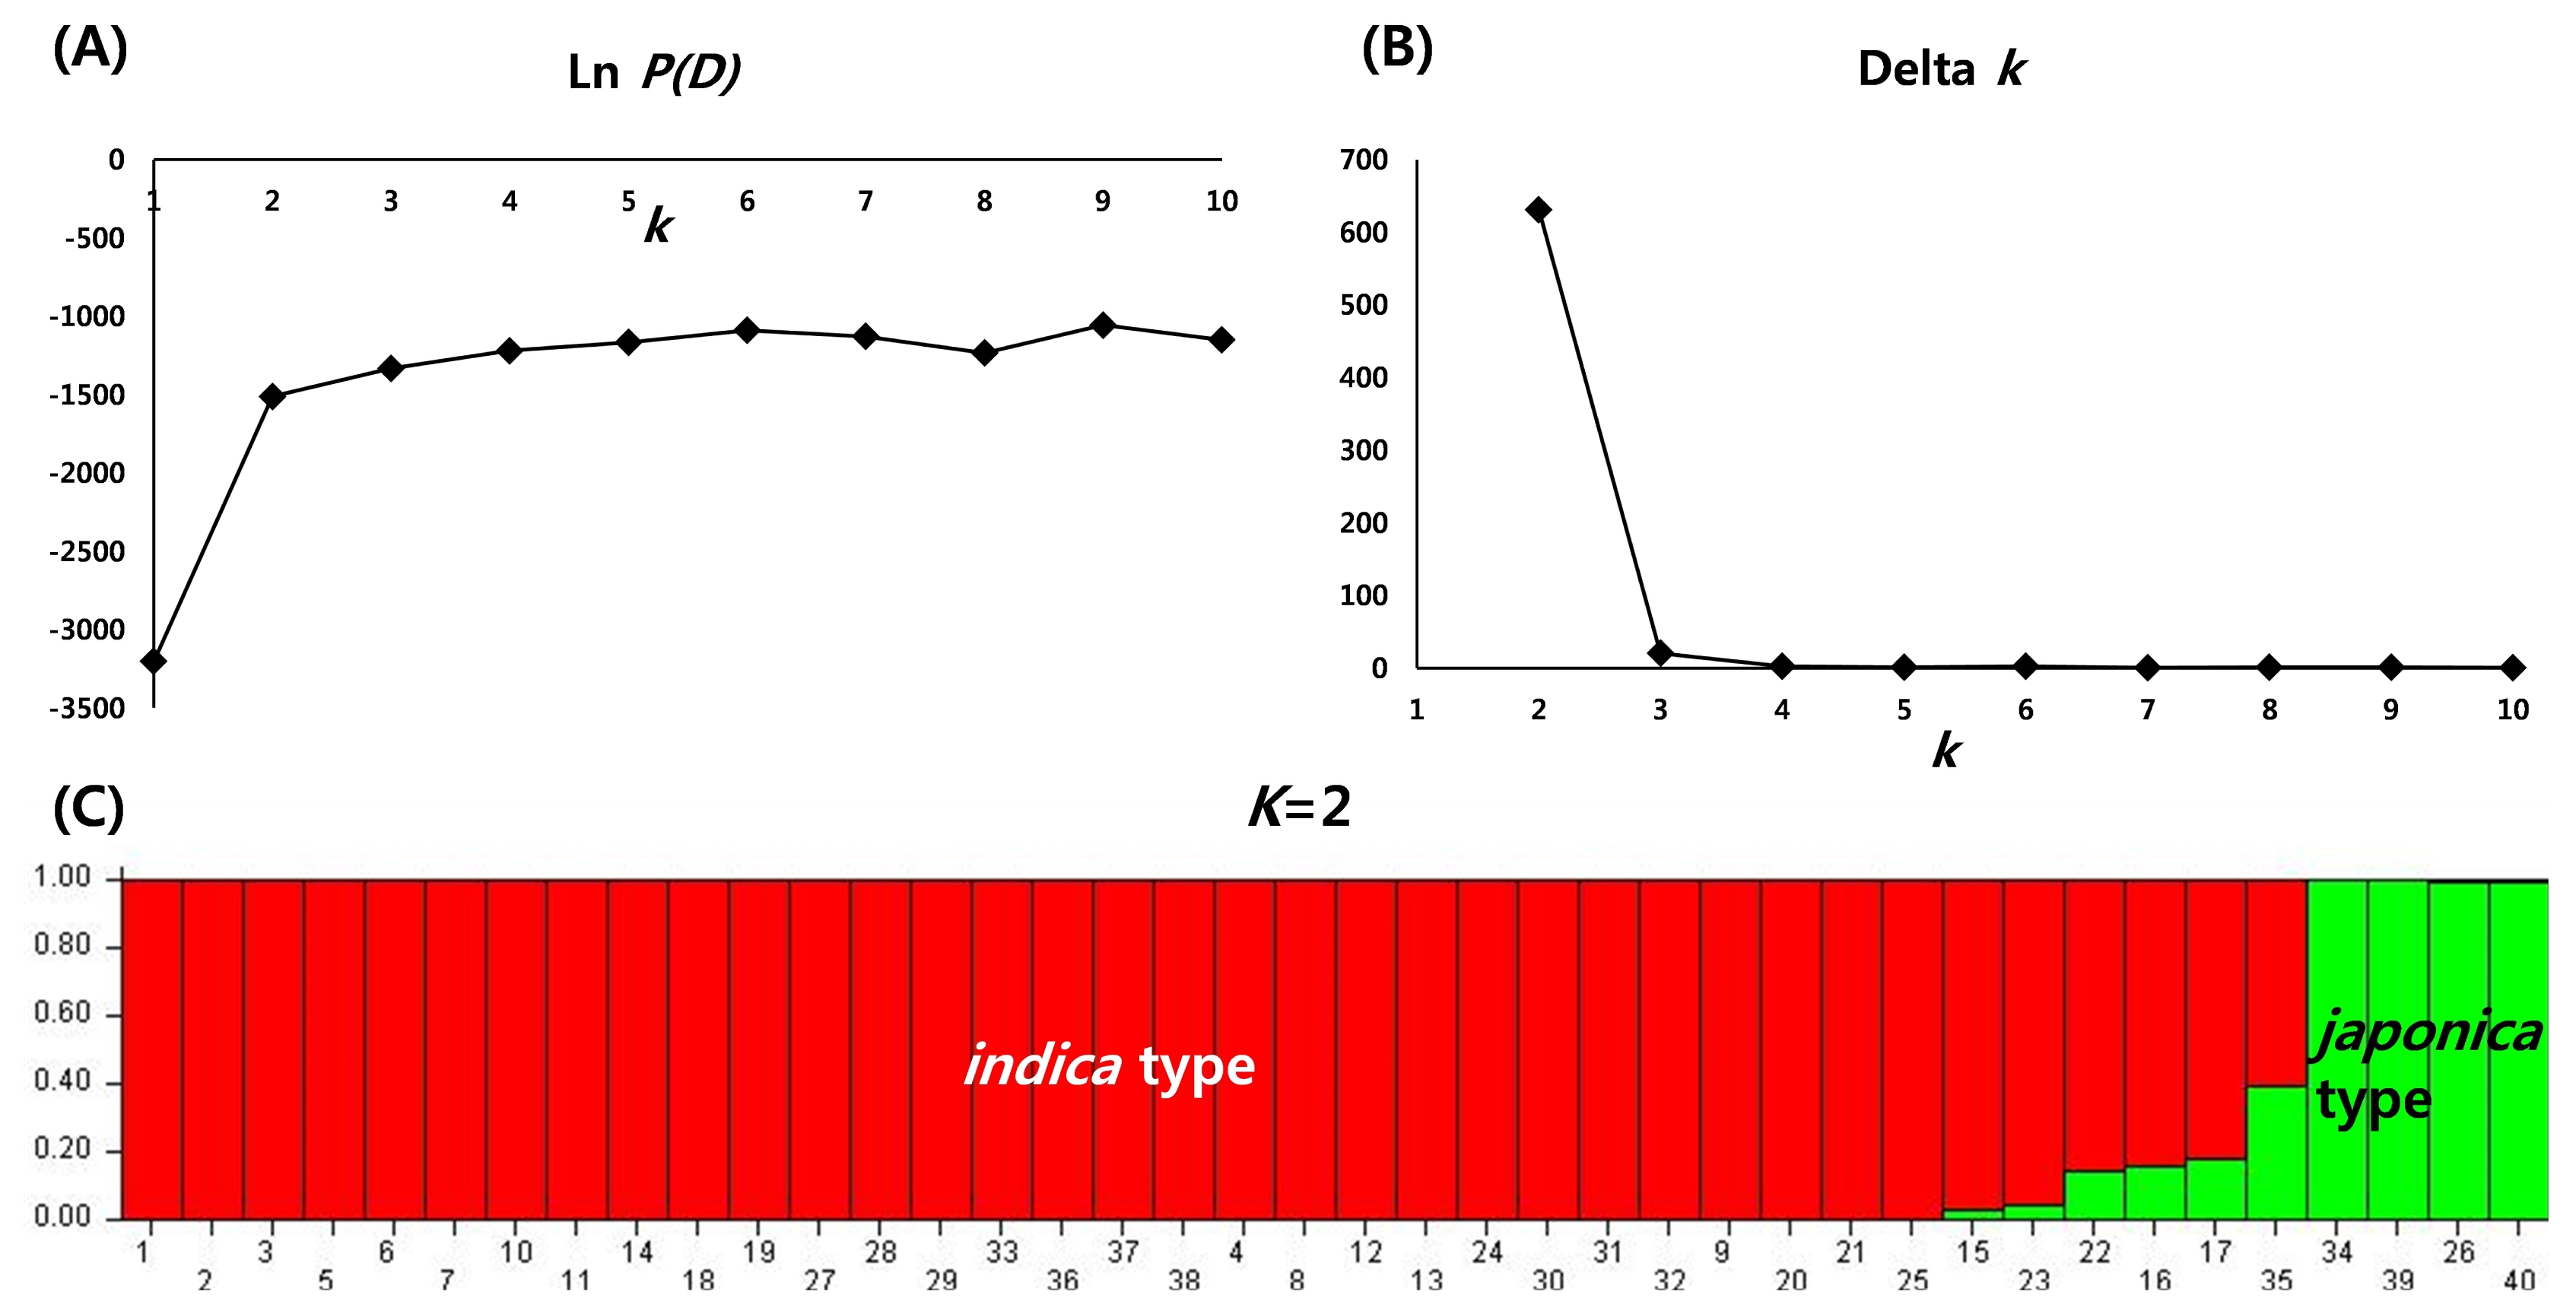
Fig. 3UPGMA dendrogram based on CS Chord (1967) genetic distance using 96 single nucleotide polymorphism markers. The colour of each germplasm corresponds to subpopulation assignment by STRUCTURE (indica type, red; japonica type, green; admixed ancestry, grey; Reference cultivars are 38, 39, and 40).
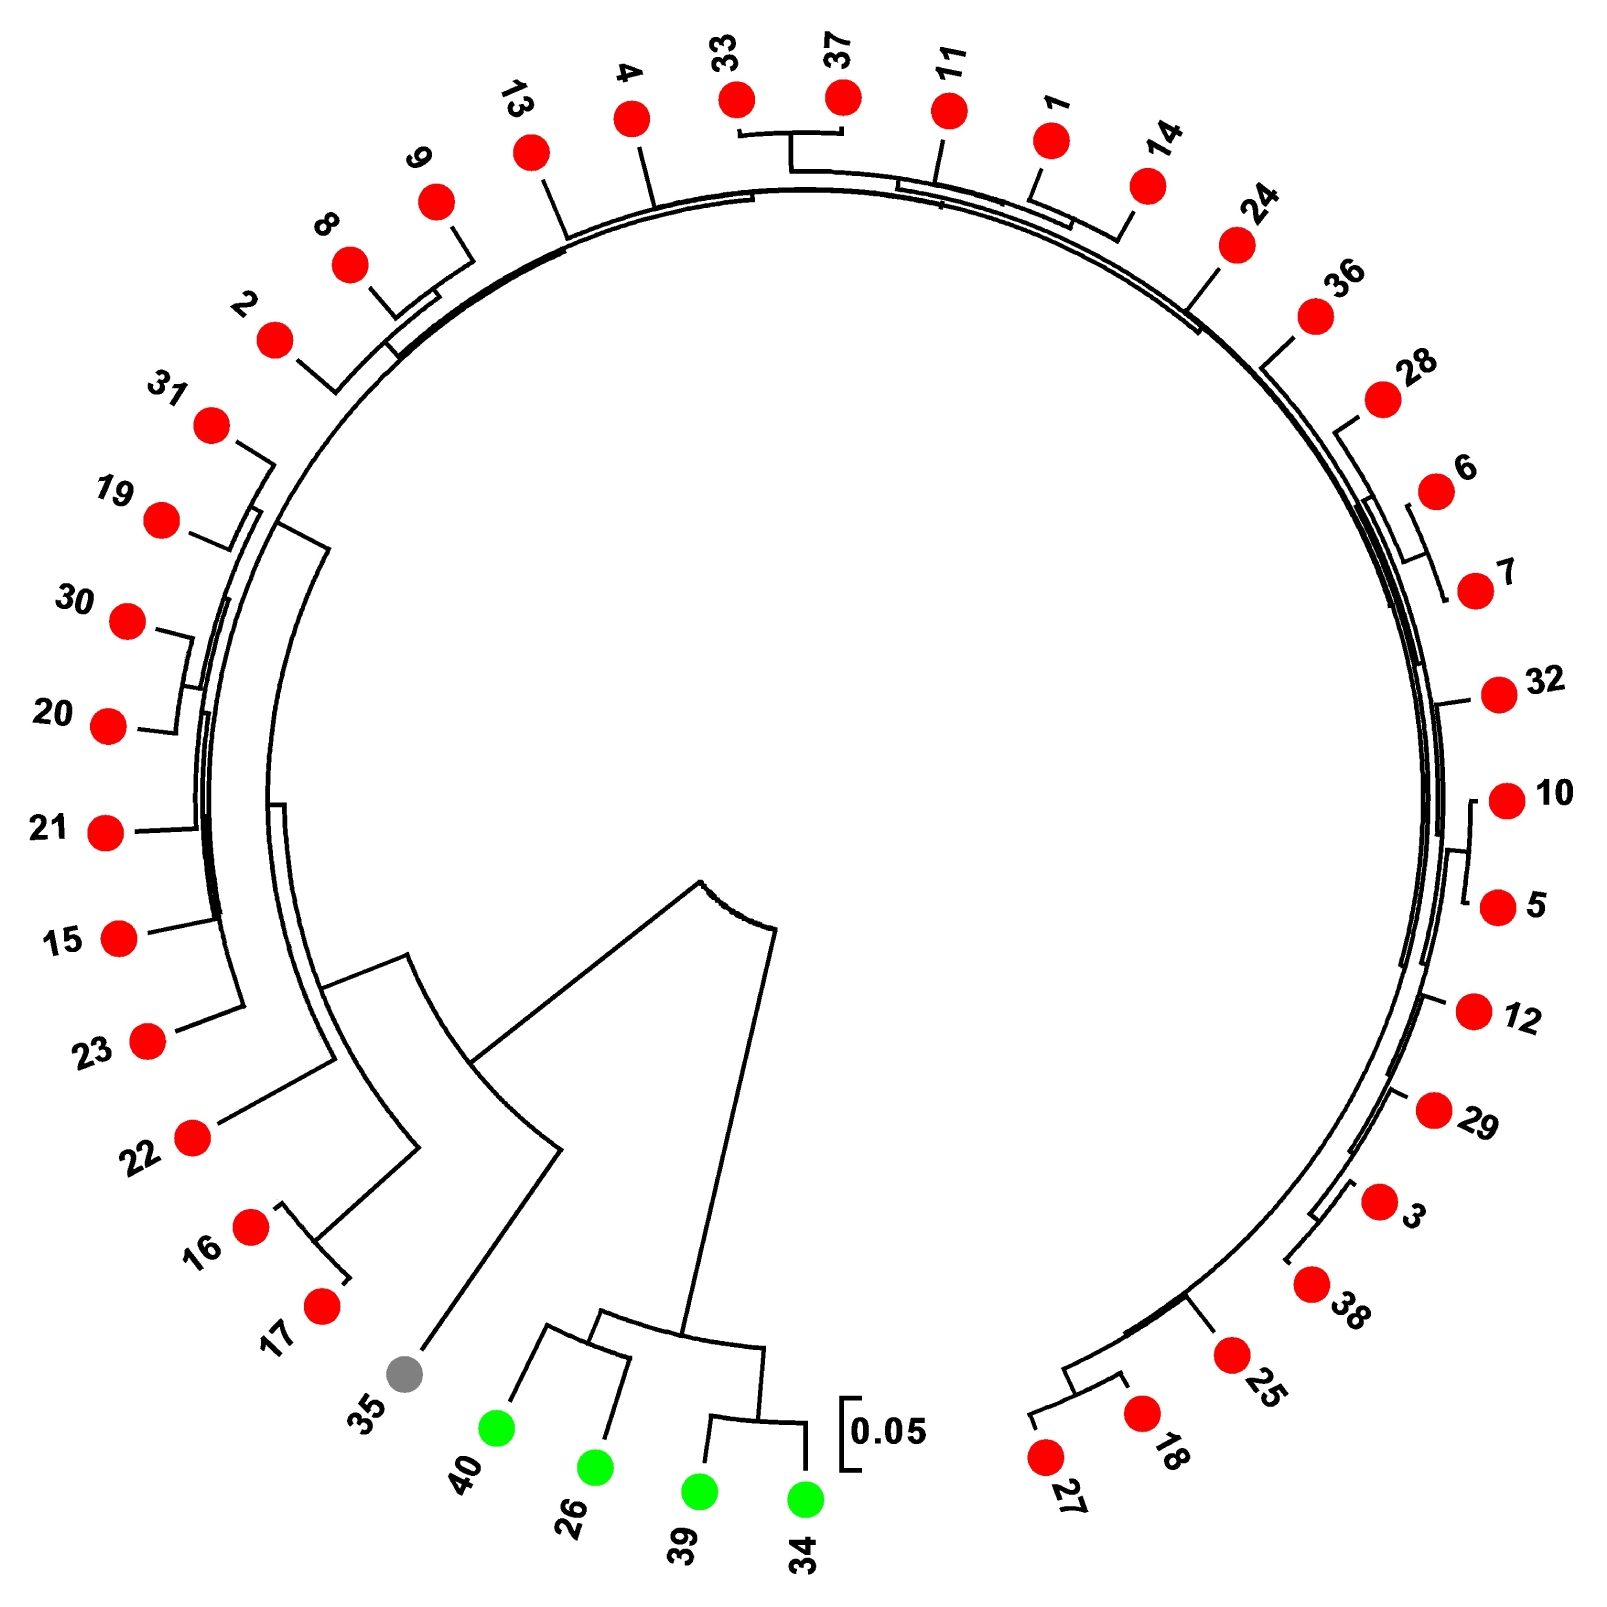
Table 1List of 40 varieties used in this study.
Table 1
|
Code |
Variety |
Origin |
Seed source |
|
1 |
AAI R 4 |
India |
EIARz)
|
|
2 |
AD 04022 |
India |
EIAR |
|
3 |
AMOL 1 |
Iran |
EIAR |
|
4 |
CB04-110 |
India |
EIAR |
|
5 |
CB05-501 |
India |
EIAR |
|
6 |
CB06-505 |
India |
EIAR |
|
7 |
CB06-541 |
India |
EIAR |
|
8 |
CB06-550 |
India |
EIAR |
|
9 |
IET 21119 |
India |
EIAR |
|
10 |
MTU-1098 |
India |
EIAR |
|
11 |
MTU-1115 |
India |
EIAR |
|
12 |
OM 5628 |
Vietnam |
EIAR |
|
13 |
OMCF 6 |
Vietnam |
EIAR |
|
14 |
BRRI dhan 48 |
Bangladesh |
EIAR |
|
15 |
BR7232-6-2-3 |
Bangladesh |
EIAR |
|
16 |
TAK RATIA |
Pakistan |
EIAR |
|
17 |
TOOR THULLA |
Pakistan |
EIAR |
|
18 |
IR10N105 |
IRRIz)
|
EIAR |
|
19 |
ESMET101 |
ARCz)
|
EIAR |
|
20 |
ESMET102 |
ARC |
EIAR |
|
21 |
ESMET103 |
ARC |
EIAR |
|
22 |
ESMET106 |
ARC |
EIAR |
|
23 |
ESMET107 |
ARC |
EIAR |
|
24 |
ESMET110 |
ARC |
EIAR |
|
25 |
ESMET114 |
ARC |
EIAR |
|
26 |
ESMET115 |
ARC |
EIAR |
|
27 |
ESMET116 |
ARC |
EIAR |
|
28 |
ESMET118 |
ARC |
EIAR |
|
29 |
ESMET120 |
ARC |
EIAR |
|
30 |
ESMET121 |
ARC |
EIAR |
|
31 |
ESMET122 |
ARC |
EIAR |
|
32 |
ESMET126 |
ARC |
EIAR |
|
33 |
IR70031-4B-R-9-3-1 |
IRRI |
EIAR |
|
34 |
NERICA4 |
ARC |
EIAR |
|
35 |
CG14 |
Senegal |
EIAR |
|
36 |
NERICA L-16 |
ARC |
EIAR |
|
37 |
NERICA L-19 |
ARC |
EIAR |
|
38 |
IR64 |
IRRI |
SNUz)
|
|
39 |
Nipponbare |
Japan |
SNU |
|
40 |
Malagkit Sninaguing |
Philippines |
SNU |
Table 2Eleven agronomic traits of 40 rice varieties tested in 2014.
Table 2
|
PNz)
|
PH (cm) |
PL (cm) |
PB |
SB |
SP |
SPF (%) |
KGW (g) |
GL (mm) |
GW (mm) |
GS |
|
Average |
13.32**
|
111.02**
|
24.28**
|
12.08**
|
35.62**
|
189.18**
|
74.54**
|
24.71**
|
7.68**
|
2.90**
|
2.71**
|
|
SD |
3.83 |
19.29 |
2.59 |
1.48 |
13.85 |
62.74 |
11.82 |
5.73 |
0.92 |
0.41 |
0.51 |
|
Min. |
5.00 |
82.33 |
17.33 |
9.33 |
14.00 |
87.67 |
48.27 |
14.27 |
6.27 |
2.29 |
1.90 |
|
Max. |
21.67 |
176.00 |
32.67 |
15.67 |
67.67 |
340.67 |
97.31 |
42.88 |
10.23 |
4.09 |
3.92 |
|
CV % |
29.14 |
17.60 |
10.83 |
12.43 |
39.42 |
33.58 |
16.06 |
23.46 |
12.09 |
14.31 |
19.00 |
Table 3Correlation matrix among the eleven agronomic traits of 40 varieties.
Table 3
|
Traits |
PNz)
|
PH |
PL |
PB |
SB |
SP |
SPF |
KGW |
GW |
GL |
|
PH |
0.29 |
|
|
|
|
|
|
|
|
|
|
PL |
0.27 |
0.55** |
|
|
|
|
|
|
|
|
|
PB |
−0.19 |
0.20 |
0.17 |
|
|
|
|
|
|
|
|
SB |
−0.29 |
−0.13 |
0.10 |
0.63** |
|
|
|
|
|
|
|
SP |
−0.30 |
−0.11 |
0.09 |
0.69** |
0.97** |
|
|
|
|
|
|
SPF |
0.31 |
0.20 |
−0.08 |
−0.24 |
−0.55** |
−0.52** |
|
|
|
|
|
KGW |
−0.01 |
0.25 |
0.11 |
−0.14 |
−0.64* |
−0.62** |
0.50** |
|
|
|
|
GW |
−0.20 |
0.19 |
0.22 |
−0.08 |
−0.23 |
−0.23 |
0.34* |
0.65** |
|
|
|
GL |
0.24 |
0.10 |
−0.03 |
0.08 |
−0.56** |
−0.53** |
0.11 |
0.48** |
−0.22 |
|
|
GS |
0.29 |
−0.09 |
−0.20 |
−0.01 |
−0.19 |
−0.16 |
−0.15 |
−0.15 |
−0.81** |
0.74** |
Table 4Average values and SD of each group clustered based on the eleven agronomic traits.
Table 4
|
Group |
|
PNz)
|
PH (cm) |
PL (cm) |
PB |
SB |
SP |
SPF (%) |
KGW (gm) |
GL (mm) |
GW (mm) |
GS |
|
G1 (n=9) |
Average |
12.22a |
106.67b |
24.11a |
13.56a |
56.78a |
287.26a |
64.24c |
18.51c |
6.85b |
2.73b |
2.55a |
|
SD |
4.05 |
9.50 |
2.24 |
1.22 |
5.58 |
33.93 |
12.87 |
4.48 |
0.61 |
0.35 |
0.41 |
|
G2 (n=25) |
Average |
13.81a |
106.71b |
24.47a |
11.85b |
32.12b |
171.69b |
75.29b |
25.39b |
7.91a |
2.84b |
2.85a |
|
SD |
3.27 |
17.43 |
2.56 |
1.31 |
6.95 |
28.19 |
9.32 |
3.39 |
0.82 |
0.33 |
0.54 |
|
G3 (n=6) |
Average |
12.94a |
135.47a |
23.69a |
10.78b |
18.44c |
114.95c |
86.84a |
31.17a |
7.97a |
3.39a |
2.38a |
|
SD |
6.02 |
23.03 |
3.70 |
0.81 |
5.71 |
19.34 |
7.78 |
7.30 |
1.13 |
0.52 |
0.37 |
Table 5Average values and standard (SD) of each group clustered based on 96 single nucleotide polymorphisms.
Table 5
|
Group |
|
PNz)
|
PH (cm) |
PL (cm) |
PB |
SBz)
|
SP |
SPF (%) |
KGW (gm) |
GL (mm) |
GW (mm) |
GS |
|
japonica type (n=4) |
Average |
10.17 |
124.71 |
22.33 |
11.58 |
22.00 |
140.84 |
80.05 |
30.12 |
8.24 |
3.25 |
2.55 |
|
SD |
3.87 |
34.25 |
3.62 |
1.23 |
9.64 |
47.59 |
10.61 |
8.59 |
1.35 |
0.48 |
0.30 |
|
indica type (n=35) |
Average |
13.68 |
109.50 |
24.49 |
12.13 |
37.13 |
194.56 |
73.92 |
24.11 |
7.62 |
2.86 |
2.73 |
|
SD |
3.77 |
17.35 |
2.46 |
1.53 |
13.70 |
63.30 |
12.09 |
5.24 |
0.87 |
0.40 |
0.53 |
References
- Agnoun Y, Biaou SSH, Sié M, Vodouhè RS, Ahanchédé A. 2012. The African rice Oryza glaberrima Steud: knowledge distribution and prospects. Int J Biol. 4: 158-180.
- Cavalli-Sforza LL, Edwards AW. 1967. Phylogenetic analysis. Models and estimation procedures. Am J Hum Genet. 19: 233-257.
- Evanno G, Regnaut S, Goudet J. 2005. Detecting the number of clusters of individuals using the software STRUCTURE: a simulation study. Mol Ecol. 14: 2611-2620.
- Garcia-Vallvé S, Palau J, Romeu A. 1999. Horizontal gene transfer in glycosyl hydrolases inferred from codon usage in Escherichia coli and Bacillus subtilis. Mol Biol Evol. 16: 1125-1134.
- Jena KK. 2010. The species of the genus Oryza and transfer of useful genes from wild species into cultivated rice, O. sativa. Breed Sci. 60: 518-523.
- Jones MP, Dingkuhn M, Aluko GK, Semon M. 1997. Interspecific Oryza sativa L. X O. glaberrima Steud. progenies in upland rice improvement. Euphytica. 94: 237-246.
- Joshi SP, Ranjekar PK, Gupta VS. 1999. Molecular markers in plant genome analysis. Curr Sci. 77: 230-240.
- Khush GS. 1997. Origin, dispersal, cultivation and variation of rice. Plant Mol Biol. 35: 25-34.
- Liu K, Muse SV. 2005. PowerMarker: an integrated analysis environment for genetic marker analysis. Bioinformatics. 21: 2128-2129.
- Murray MG, Thompson WF. 1980. Rapid isolation of high molecular weight plant DNA. Nucleic Acids Res. 8: 4321-4325.
- Pritcharda JK, Wena X, Falushb D. 2010. Documentation for structure software: version 2.3. Pritchard Lab.. Stanford, CA.
- Sarla N, Swamy BM. 2005. Oryza glaberrima: a source for the improvement of Oryza sativa. Curr Sci. 89: 955-963.
- Semagn K, Ndjiondjopd MN, Cissoko M. 2006. Micro-satellites and agronomic traits for assessing genetic relationships among 18 New Rice for Africa (NERICA) varieties. Afr J Biotechnol. 5: 800-810.
- Somado EA, Guei RG, Keya SO. 2008. NERICA®: the new rice for Africa: a compendium. Africa Rice Center (WARDA). Cotonou, Benin.
- Tamura K, Stecher G, Peterson D, Filipski A, Kumar S. 2013. MEGA6: molecular evolutionary genetics analysis version 6.0. Mol Biol Evol. 30: 2725-2729.
- Tanabata T, Shibaya T, Hori K, Ebana K, Yano M. 2012. SmartGrain: high-throughput phenotyping software for measuring seed shape through image analysis. Plant Physiol. 160: 1871-1880.
- Thomson M. 2014. High-throughput SNP genotyping to accelerate crop improvement. Plant Breed Biotech. 2: 195-212.
- Tu M, Lu BR, Zhu Y, Wang Y. 2007. Abundant within-varietal genetic diversity in rice germplasm from Yunnan Province of China revealed by SSR fingerprints. Biochem Genet. 45: 789-801.
- Vaughan DA, Morishima H, Kadowaki K. 2003. Diversity in the Oryza genus. Curr Opin Plant Biol. 6: 139-146.
- Wang L, Jiao S, Jiang Y, Yan H, Su D, Sun G, et al. 2013. Genetic diversity in parent lines of sweet sorghum based on agronomical traits and SSR markers. Field Crops Res. 149: 11-19.
- Zhao K, Wright M, Kimball J, Eizenga G, McClung A, Kovach M, et al. 2010. Genomic diversity and introgression in O. sativa reveal the impact of domestication and breeding on the rice genome. PLoS One. 5: e10780


