Abstract
Tomato (Solanum lycopersicum L.) is one of the most economically important plants in the family Solanaceae. Understanding its genetic diversity of accessions is vital for additional collection of tomato germplasms. The objective of this study was to determine the genetic diversity and population structure of 355 tomato accessions from Asia using 18 simple-sequence repeats (SSRs). A total of 176 alleles were detected at an average of ten alleles per SSR locus. The average major allele frequency and polymorphic information content were 0.69 and 0.39, respectively. Model-based structure analysis revealed two subpopulations (88%), including admixtures (11%) in the 355 Asian tomato accessions, consistent with clustering results based on genetic distance. The overall FST value was 0.135, indicating a moderate differentiation between the inferred subpopulations. Analysis of molecular variance showed that the genetic variance among geographical groups was less than 6%, in contrast to 86% of genetic variance among individuals. The results from this study will provide important information for future germplasm conservation and improvement programs for tomato.
-
Key words: Tomato, Genetic diversity, Population structure, Simple sequence repeats
INTRODUCTION
Tomato (
Solanum lycopersicum) belongs to the family of
Solanaceae. It ranks the first in the world of vegetables, accounts for 14% of world vegetable production (over 100 million metric tons/year) (
Food and Agriculture Organisation [FAO] 2010). Tomato is a rich source of micro-nutrients for human diet. It has multipurpose uses in both fresh and processed food industries. Sustainable cultivation, conservation, and utilization of tomato germplasms are imperative due to its agronomic importance. However, cultivated tomatoes have several bottlenecks due to their Latin American origin and related domestication, leading to drastic reduction of their genetic diversities. Identification of variabilities among Genbank accessions is vital for the maintenance and utilization of their germplasms (
Lee et al. 2015).
In 1998, the Human Genome Project introduced the use of single nucleotide polymorphisms (SNPs) as markers (
Wang et al. 2008). Since then, SNPs have become increasingly important as genetic markers for studying the evolutionary history of populations (
Gupta et al. 2012;
Singh et al. 2015). The release of the tomato genome sequence has expedited the characterization of SNPs, allowing SNPs to be the most effective and useful genetic markers in modern tomato breeding programs (
Tomato Genome Consortium 2012).
Aflitos et al. (2014) have employed the whole-genome sequencing strategy to explore the genetic variations in tomatoes by using SNPs. Numerous verified SNPs have been successfully used to develop tomato cultivars for practical use (
Labate and Baldo 2005;
Shirasawa et al. 2010). However, this technology remains in the laboratories because it needs special equipment and finical support. In contrast, SSR marker is simple to use. It has been used widely in genetic analysis of many crop species. The present study was to evaluate the genetic diversity (GD) and population structures of tomato accessions collected from Asian countries using polymorphic SSR markers.
MATERIALS AND METHODS
Plant materials
A total of 355 Asian tomato accessions (
Table 1,
Supplement Table 1) were used in this study. These accessions were collected from six different Asian geographical origins. Seeds were obtained from the National Agrobiodiversity Center at the Rural Development Administration, Republic of Korea.
DNA was extracted from fresh leaves of each accession using Qiagen DNA extraction kit (Qiagen Korea, Seoul, Korea). The purity and concentration of extracted DNA were estimated using a NanoDrop ND-1000 spectrophotometer (NanoDrop Technologies, Inc., Wilmington, DE, USA). The final concentration of each DNA sample was adjusted to 20 ng/μl. For SSR assays, a total of 18 polymorphic SSR markers were selected from SOL Genomics Network (
https://solgenomics.net) and those reported previously (
Kwon et al. 2009;
Geethanjali et al. 2010;
Geethanjali et al. 2011). SSR alleles were amplified with fluorescent labelled primers, resolved on ABI Prism 3100 DNA sequencer (Applied Biosystems, Foster City, CA, USA) using GeneScan 3.7 software (Applied Biosystems), and sized precisely using GeneScan 500 ROX (6-carbon-X-rhodamine) molecular size standards (35–500 bp) and Genotyper 3.7 software (Applied Biosystems).
Genetic analysis package PowerMarker ver. 3.23 (
Liu and Muse 2005) was used to determine the variability at each locus, including the number of alleles (NA), major allele frequency (M
AF), number of genotypes (NG), observed heterozygosity (H
O), GD, and polymorphic information content (PIC). Neighbor-joining method based on genetic distance matrix was used to construct a phylogram using MEGA4 software (
Tamura et al. 2007).
Possible population structures were analyzed using model-based software program Structure 2.3.3 (
Pritchard et al. 2000;
Falush et al. 2003) for the 355 Asian tomato accessions and a model allowing admixture and correlated allele frequencies. Three runs of Structure were performed with the number of clusters (
K) set from 1 to 10. The average likelihood value, L(
K), across all runs was calculated for each
K. In this model, several subpopulations (
K) were assumed to be present, each of which was characterized by a set of allele frequencies for each locus. Individuals in the sample were assigned to subpopulations or jointly to two or more subpopulations if their genotypes were admixed. The model choice criterion to detect the most likely value of
K was ΔK, an ad hoc quantity related to the second-order change in the log probability of data (LnP[D]) with respect to the number of clusters inferred by Structure (
Evanno et al. 2005). An individual was assigned to a subpopulation group if >80% of its genome fraction value was derived from that group.
In addition, analysis of molecular variance (AMOVA) was performed using GENALEX 6.5 (
Peakall and Smouse 2012) to estimate the genetic structures between and among geographical groups. The significance of variance component was tested by permuting DNA marker data 999 times. Principal component analysis (PCA) was applied to show the distribution of individual accessions in scatter diagram. Two-dimension PCA graph was drawn using the GENALEX 6.5 package.
RESULTS
SSR polymorphism in the entire accession
SSR polymorphisms in these 355 Asian tomato accessions were measured in terms of numbers of alleles, gene diversity, and PIC using the PowerMarker software ver. 3.23 (
Liu and Muse 2005). The 18 SSR markers revealed 176 alleles among these Asian tomato accessions representing 25 countries (
Table 1). SSR loci diversity data are summarized in
Table 2. Allelic richness per locus varied widely among markers, ranging from 2 to 25 (SLM6-5h), with an average of nine alleles per locus. The frequency of major alleles per locus ranged from 0.26 (SLM12-31f) to 0.97 (214 N), with an average value of 0.69 per marker. Of the 18 SSR markers, the overall PIC value ranged from 0.05 (214 N) to 0.84 (SLM12-31f), with an average value of 0.39.
The population structure of the 355 Asian tomato accessions was inferred by using Structure V2.3.3 based on 18 SSR markers. At this level, individual proportions of membership in each group were estimated using multi- allele data set and the results suggested the existence of some population structure. However, the distribution of L(K) did not indicate a clear mode for the true K (
Fig. 1A). Thus, ad hoc quantity (ΔK) was used to overcome the difficulty of interpreting the real K values (
Evanno et al. 2005). The true value of K was determined by illustration of the peak based on ΔK. A highest peak of ΔK for the 355 accessions was found for K=2 (
Fig. 1B), indicating that the entire population could be grouped into two subpopulations (Pop1 and Pop2).
Based on membership fractions, accessions with the probability of ≥88% were assigned to corresponding subpopulation (pop1 and pop2) while the others were categorized as admixture (
Fig. 2). In addition, accessions under different subpopulations were categorized as pure or admixture using structure analysis for categorization purpose. Accessions with more than 0.80 score were considered as pure while those with less than 0.80 score were considered as admixture. The pop1, pop2, and admix categories included 211, 103, and 41 accessions, respectively (
Fig. 2). The mean genetic diversities for each SSR locus in pop1 and pop2 of Asian tomato were 0.32 and 0.50, respectively. The mean PIC values for each SSR locus in pop1 and pop2 were 0.30 and 0.46, respectively (
Table 3). Comparative study showed that the accessions from pop2 (GD=0.50, PIC=0.46) possessed greater genetic diversities than pop1 (GD=0.32, PIC=0.30). Similarly, the average allele number in pop2 (7.6) was higher than that in pop1 (6.0), with an average of 6.8 for the two inferred clusters (
Table 3).
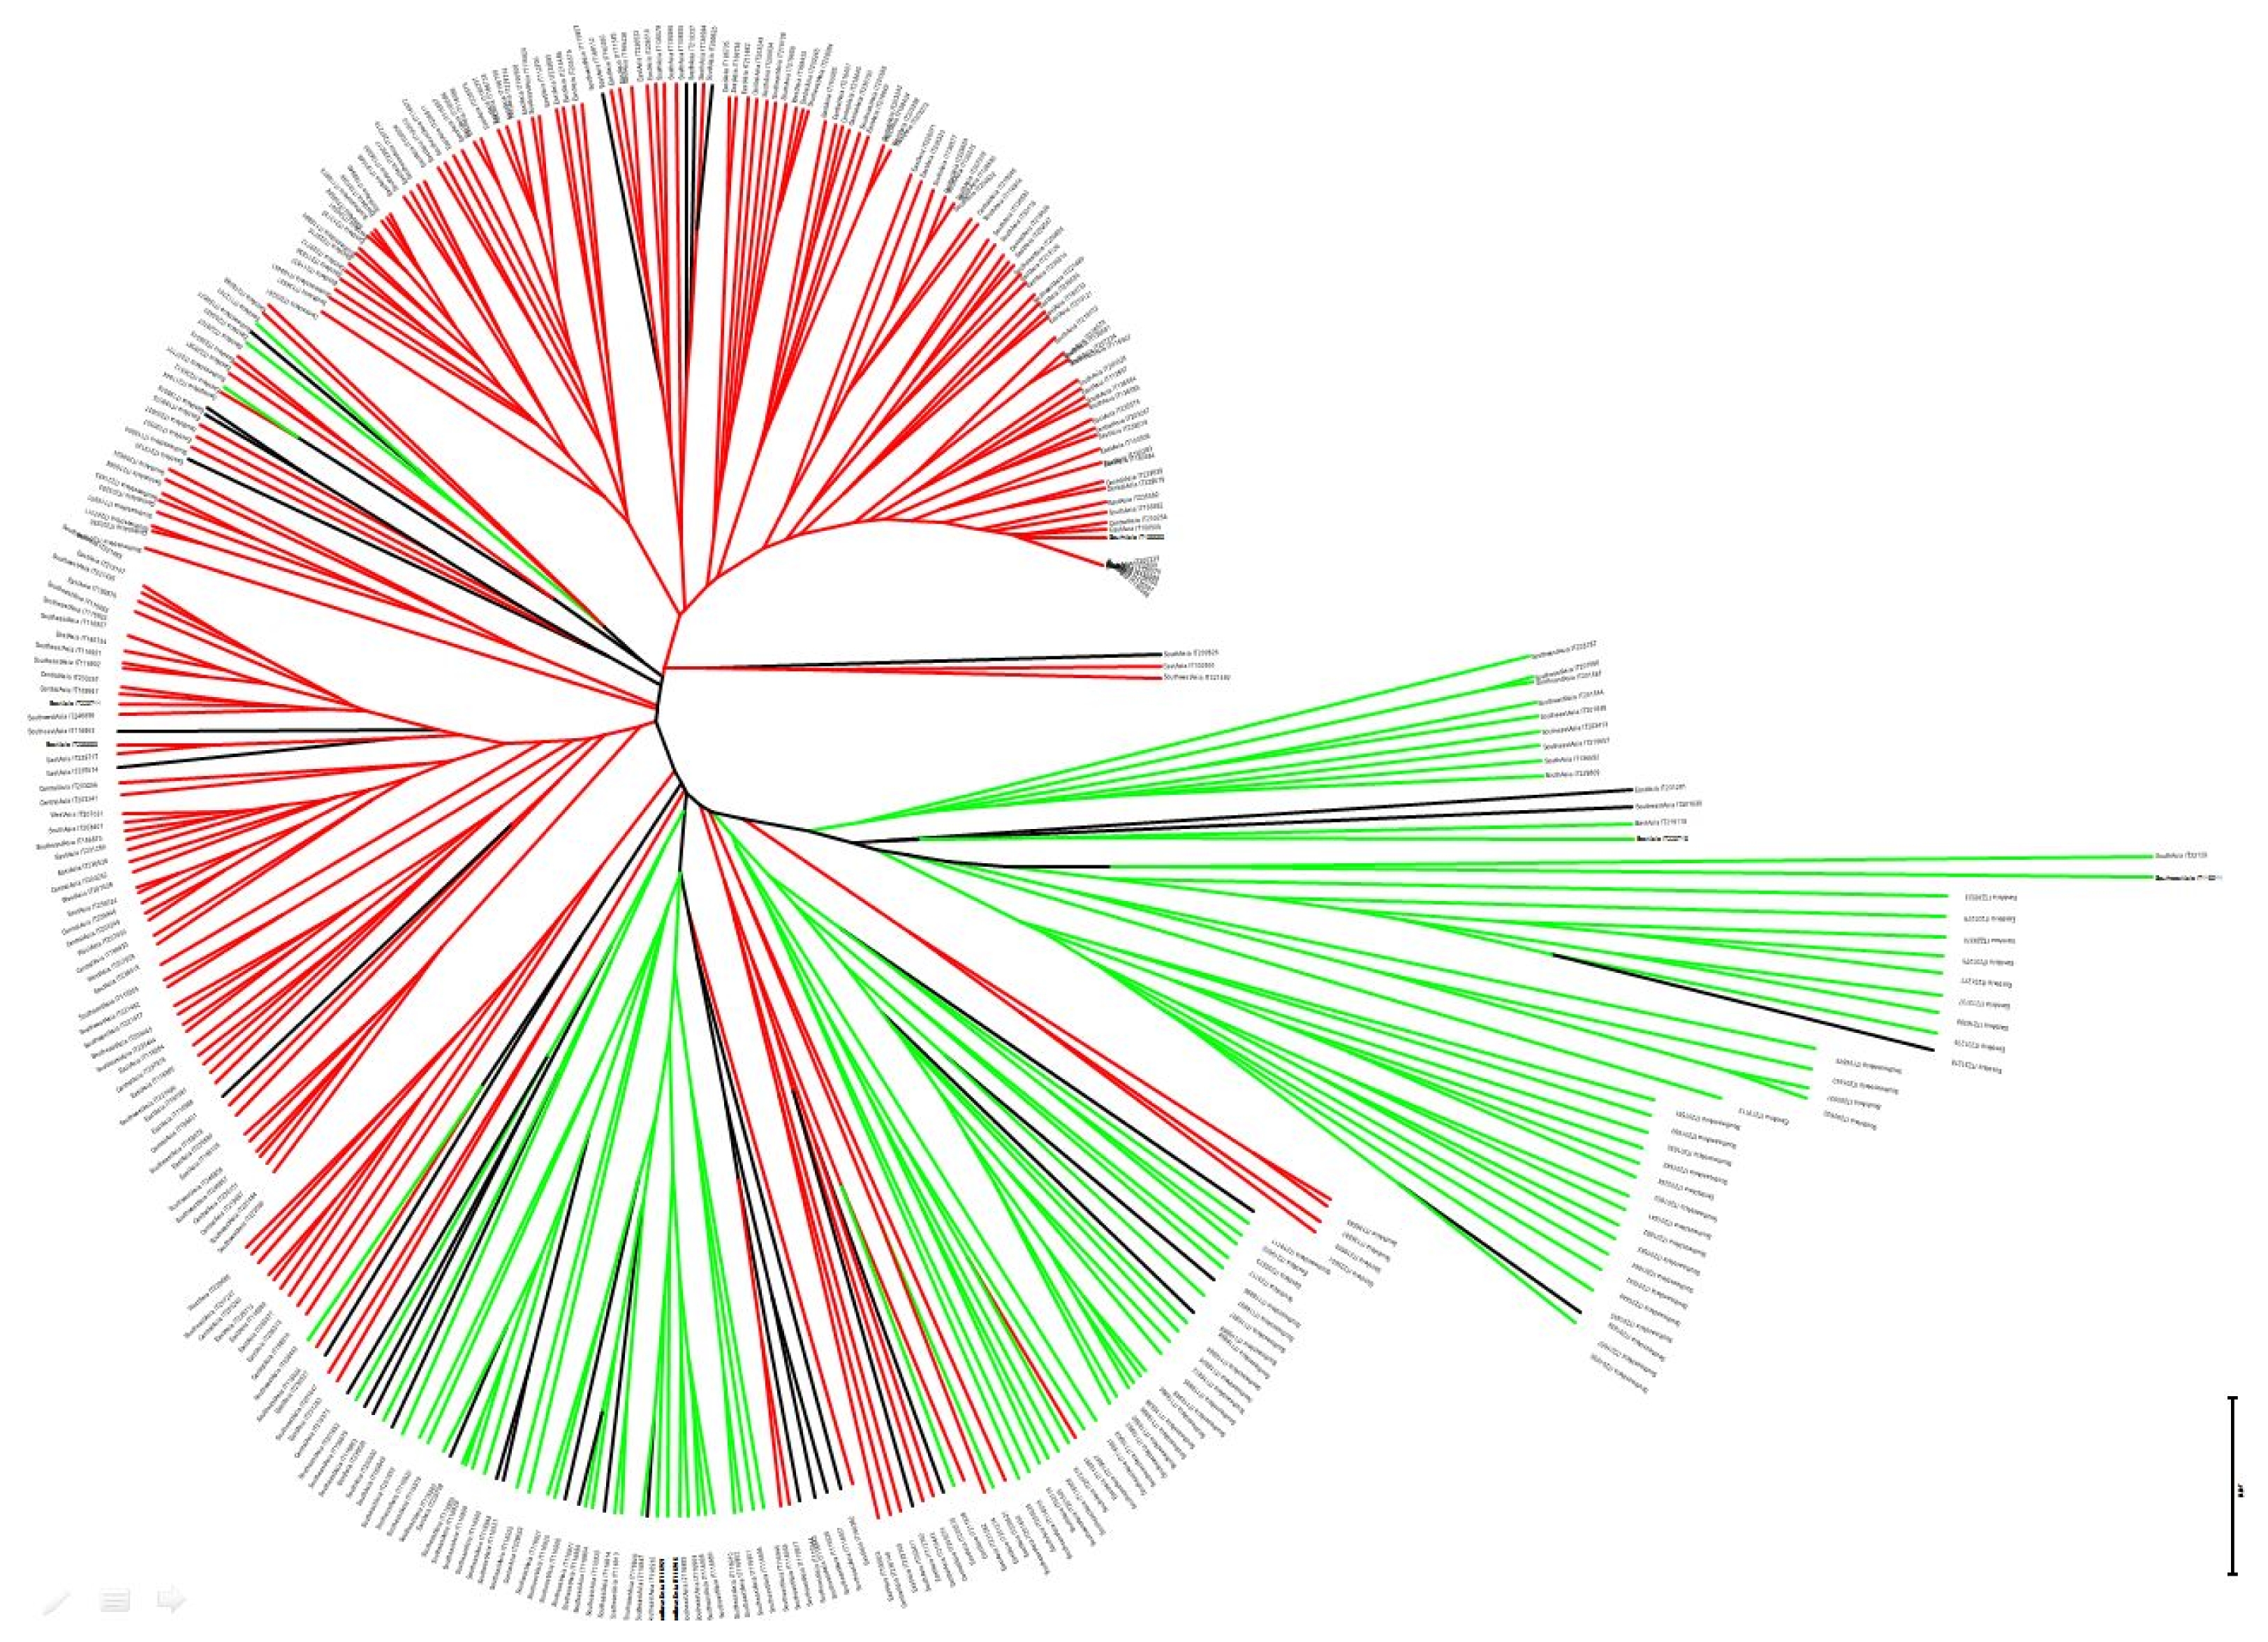
Clustering analysis based on unrooted neighbor-joining tree revealed a similar trend to that based on genetic similarity analysis using model-based Structure (
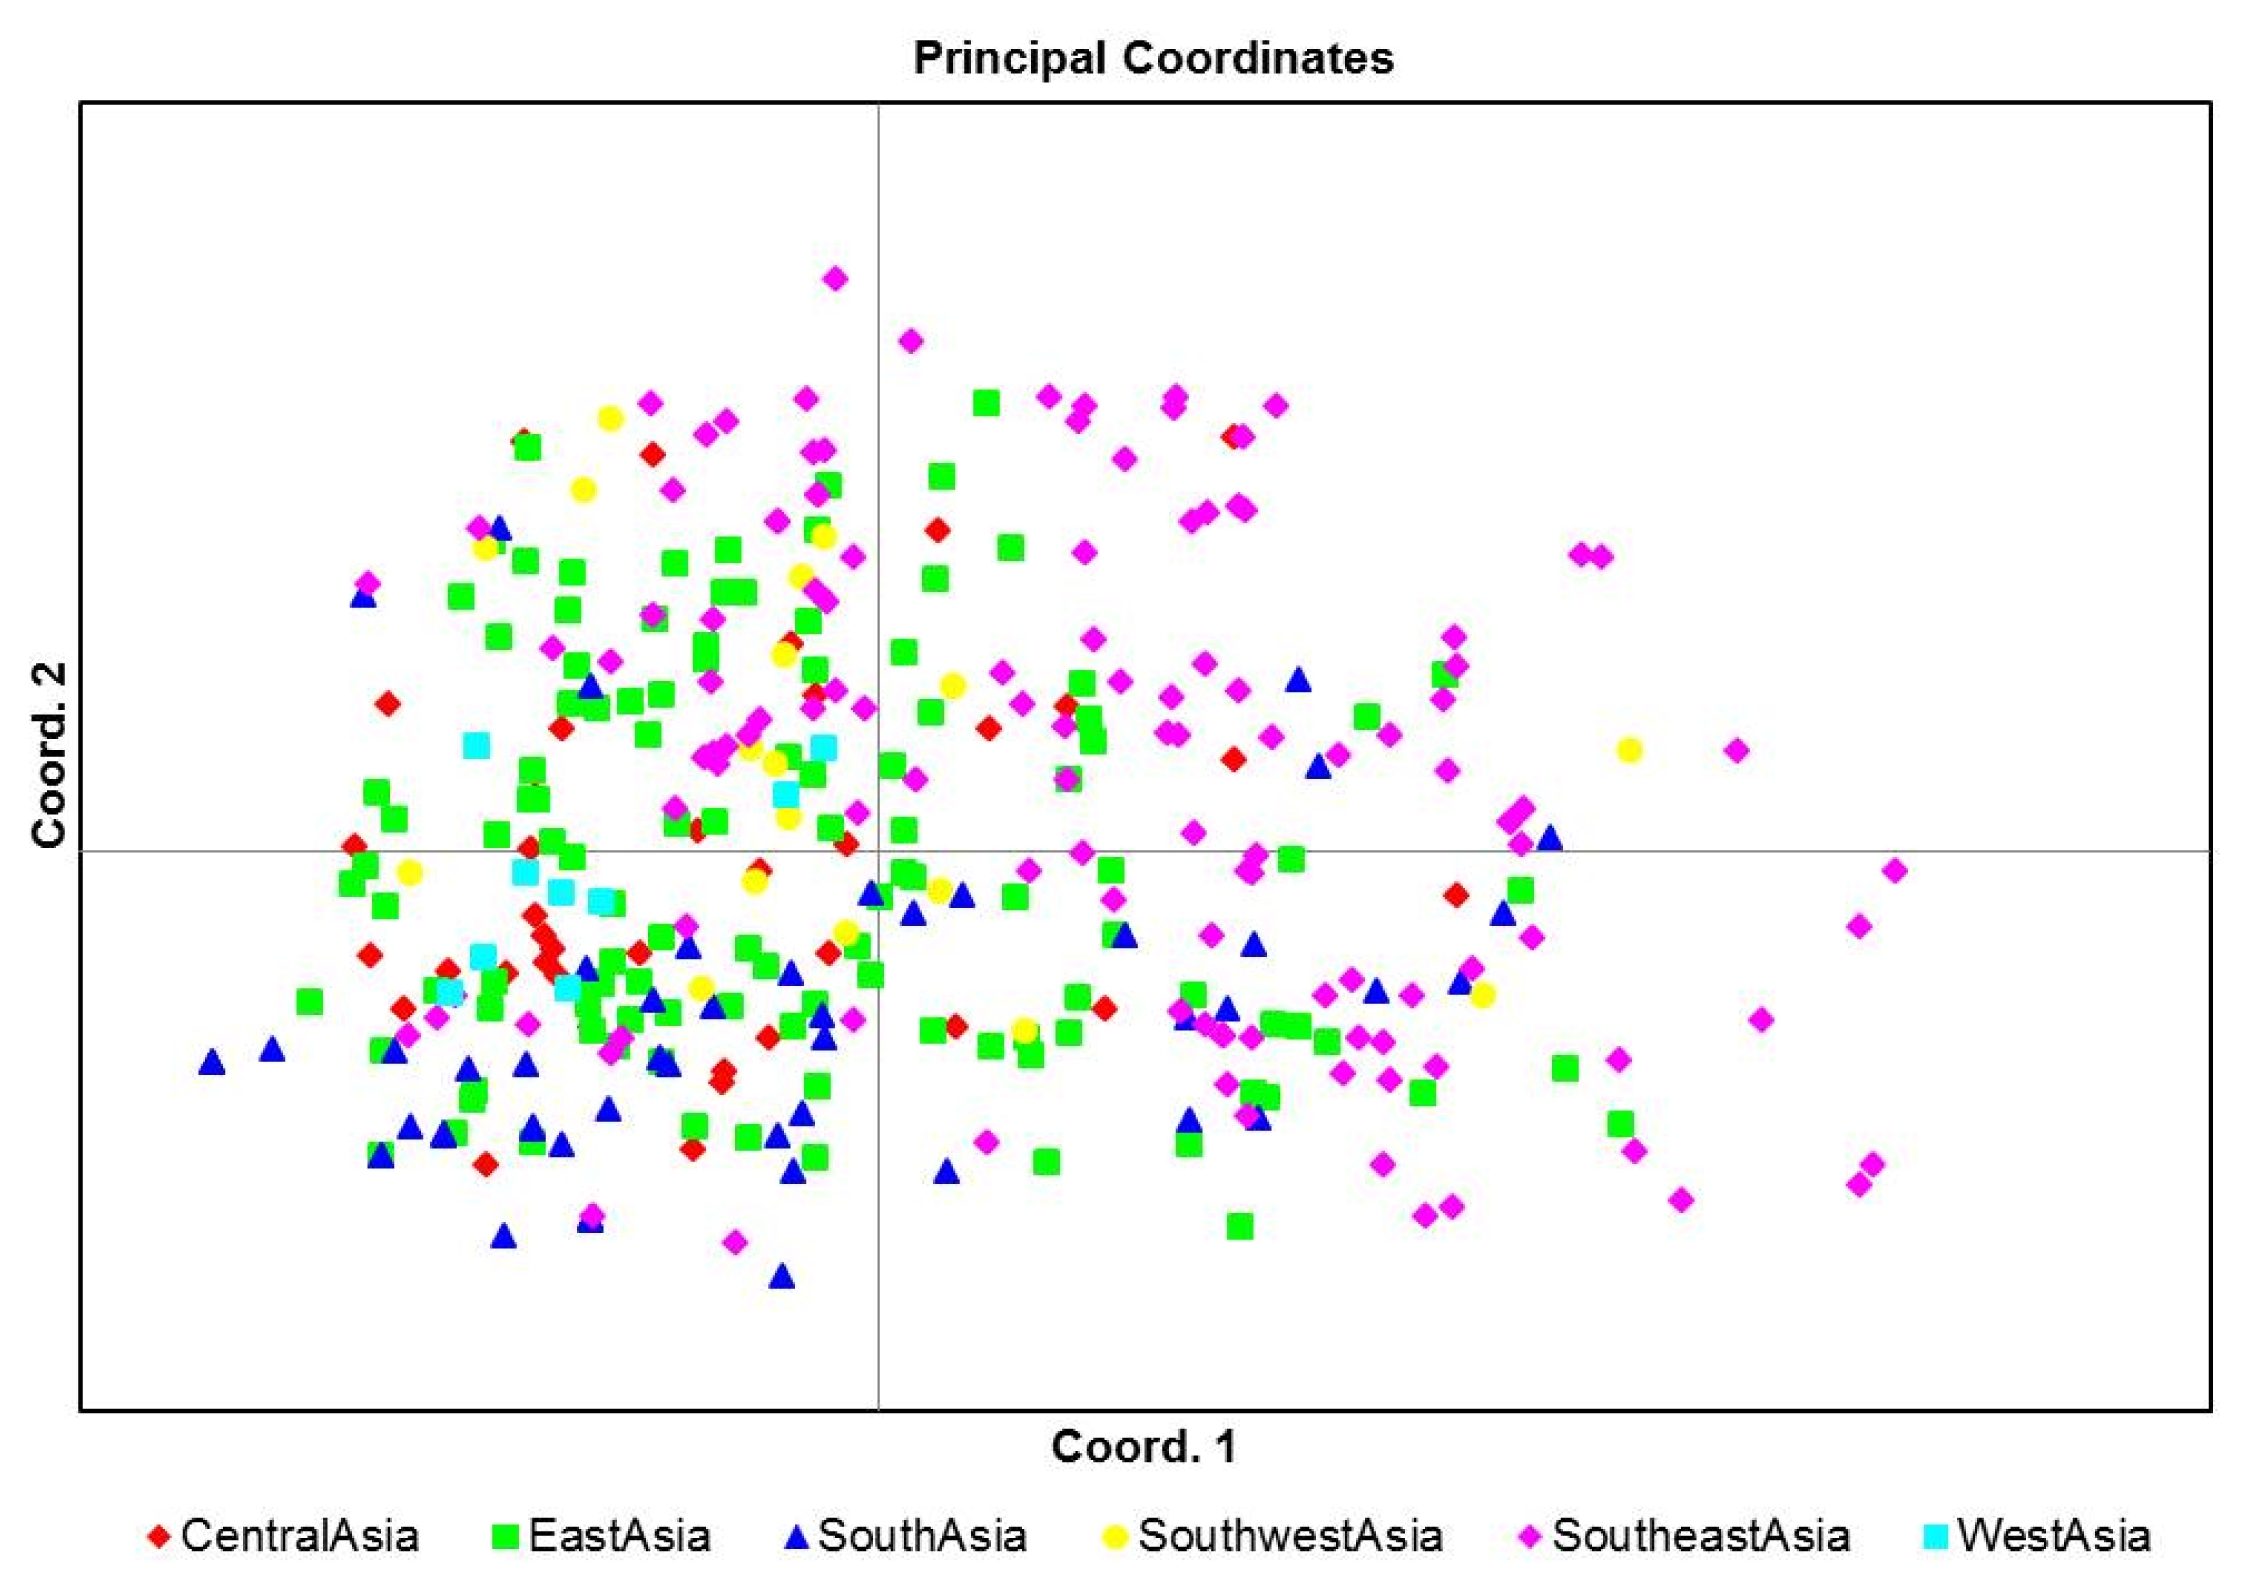
Fig. 3). East Asian geographical group was mainly appertained in pop1. PCoA was used to characterize subgroups of the populations. A two-dimensional scatter plot involving all 355 accessions showed that the first two PCA axes accounted for 23.9% and 18.55% of the genetic variations among geographical groups (
Fig. 4).
The distribution of molecular variance among and within clusters was estimated using AMOVA. The results revealed that 6% of the total variation was among geographical groups while 86% of the variations were among individuals within population clusters (
Table 4). Determination of
FST for the polymorphic loci across all six geographical groups showed a
FST of 0.064, indicating high genetic variations (data not included). The pairwise
FST estimate value was 0.135 between the inferred clusters 1 and 2, indicating significantly different clusters between the two (
Table 3).
DISCUSSION
Molecular markers have great potential to identify the structure and GD of accessions. GD analysis is important for collections, conservation, and sustainable utilization of Genbank accessions (
Suresh et al. 2014). Various types of DNA markers studies have been carried out to estimate the GD and phylogenetic relationship among tomato genotypes (
Klein-Lankhorst et al. 1991;
Kwon et al. 2009;
Geethanjali et al. 2011). Various methods have been used for surveying population structures. The model-based approach implemented in the Structure software might be the most frequently used method (
Falush et al. 2003).
In this study, 18 SSR markers produced 176 alleles and the number of detected alleles over all loci across population ranged from 2 to 25 (SLM6-5h), with an average of 9 alleles per locus (
Table 2). In the present study, the NA detected and the mean NA per locus were higher than those reported earlier. For example,
Bredemeijer et al. (2002) have reported a mean number of 4.7 (range, 2–8) alleles per locus in 521 tomato accessions.
Todorovska et al. (2014) have reported a mean number of 1.8 (range, 1–6) alleles per locus in eight Bulgarian tomato accessions.
Benor et al. (2008) have reported an average of 4.3 alleles per locus in 39 determinant and indeterminant tomato inbred lines.
Smulders et al. (1997) have detected 3 alleles per locus on average for 7 inbred lines of tomato.
He et al. (2003) have identified 2.7 alleles per locus on average among 17 varieties and 2 parental lines of tomatoes. We used diverse tomato genetic resources preserved in the National Agrobiodiversity Center (RDA, Republic of Korea) and applied the 18 SSR markers which revealed high alleles and polymorphism based on the previous studies (
Kwon et al. 2009;
Geethanjali et al. 2010;
Geethanjali et al. 2011). These factors might cause relatively high average NA per locus in this study.
To compare the genetic variabilities among population, we calculated PIC and GD values of SSR primers used. The average PIC and GD were 0.39 and 0.41, respectively.
Todorovska et al. (2014) have reported an average PIC and GD value of 0.196 and 0.22, respectively, for Bulgarian tomato accessions.
Bredemeijer et al. (2002) have reported that the GD values of the tomato sequence-tagged micro-satellite (STMS) markers are from 0.01 to 0.70, which are relatively low when compared to the results of the present study. Similarly,
Benor et al. (2008) have observed a separation of inbred lines at a genetic similarity value of 0.85, an evidence for the low level of GD in the tomato germplasm studied. Compared to these reports, our result revealed higher level of mean PIC (0.39) and GD value (0.41). Therefore, our results will be useful for further genetic studies on tomato species.
Pairwise comparisons of Nei’s genetic distance (D) between geographical groups were computed from combined data for the 18 primers (
Nei 1973). Nei’s standard genetic distances (D) between pairs of geographical groups with SSR markers varied from 0.028 to 0.153 (
Supplement Table 2). The smallest distance was found between Central Asia and East Asia while the largest distance was between Southeast Asia and West Asia. The genetic distance-based results observed in the unrooted neighbor-joining tree revealed a similar trend to the genetic similarity analysis, revealing two possible subpopulations using model-based Structure (
Fig. 3). PCoA analysis was also consistent with the clustering results of the structure analysis (
Fig. 2,
4).
In conclusion, 176 alleles were detected with an average of 9.8 alleles per SSR locus among the 355 Asian tomato accessions. Model-based structure analysis revealed the presence of two subpopulations, which was essentially consistent with clustering results based on GD. Our study showed a high level of GD in the tested 355 accessions. Therefore, the accessions of tomatoes with diverse geographical regions used in this study might be valuable gene pools for allele mining and association mapping for future improvement of tomato crop.
Supplementary Information
ACKNOWLEDGEMENTS
This study was carried out with the support of the “Research Program for Agricultural Science & Technology Development (Project No. PJ008623)”. It was also supported by the 2016 Postdoctoral Fellowship Program of the National Institute of Agricultural Science funded by the Rural Development Administration, Republic of Korea.
Fig. 1Estimated (A) LnP(D) and (B) Δk of the 355 Asian tomato accessions over five runs for each K-value.
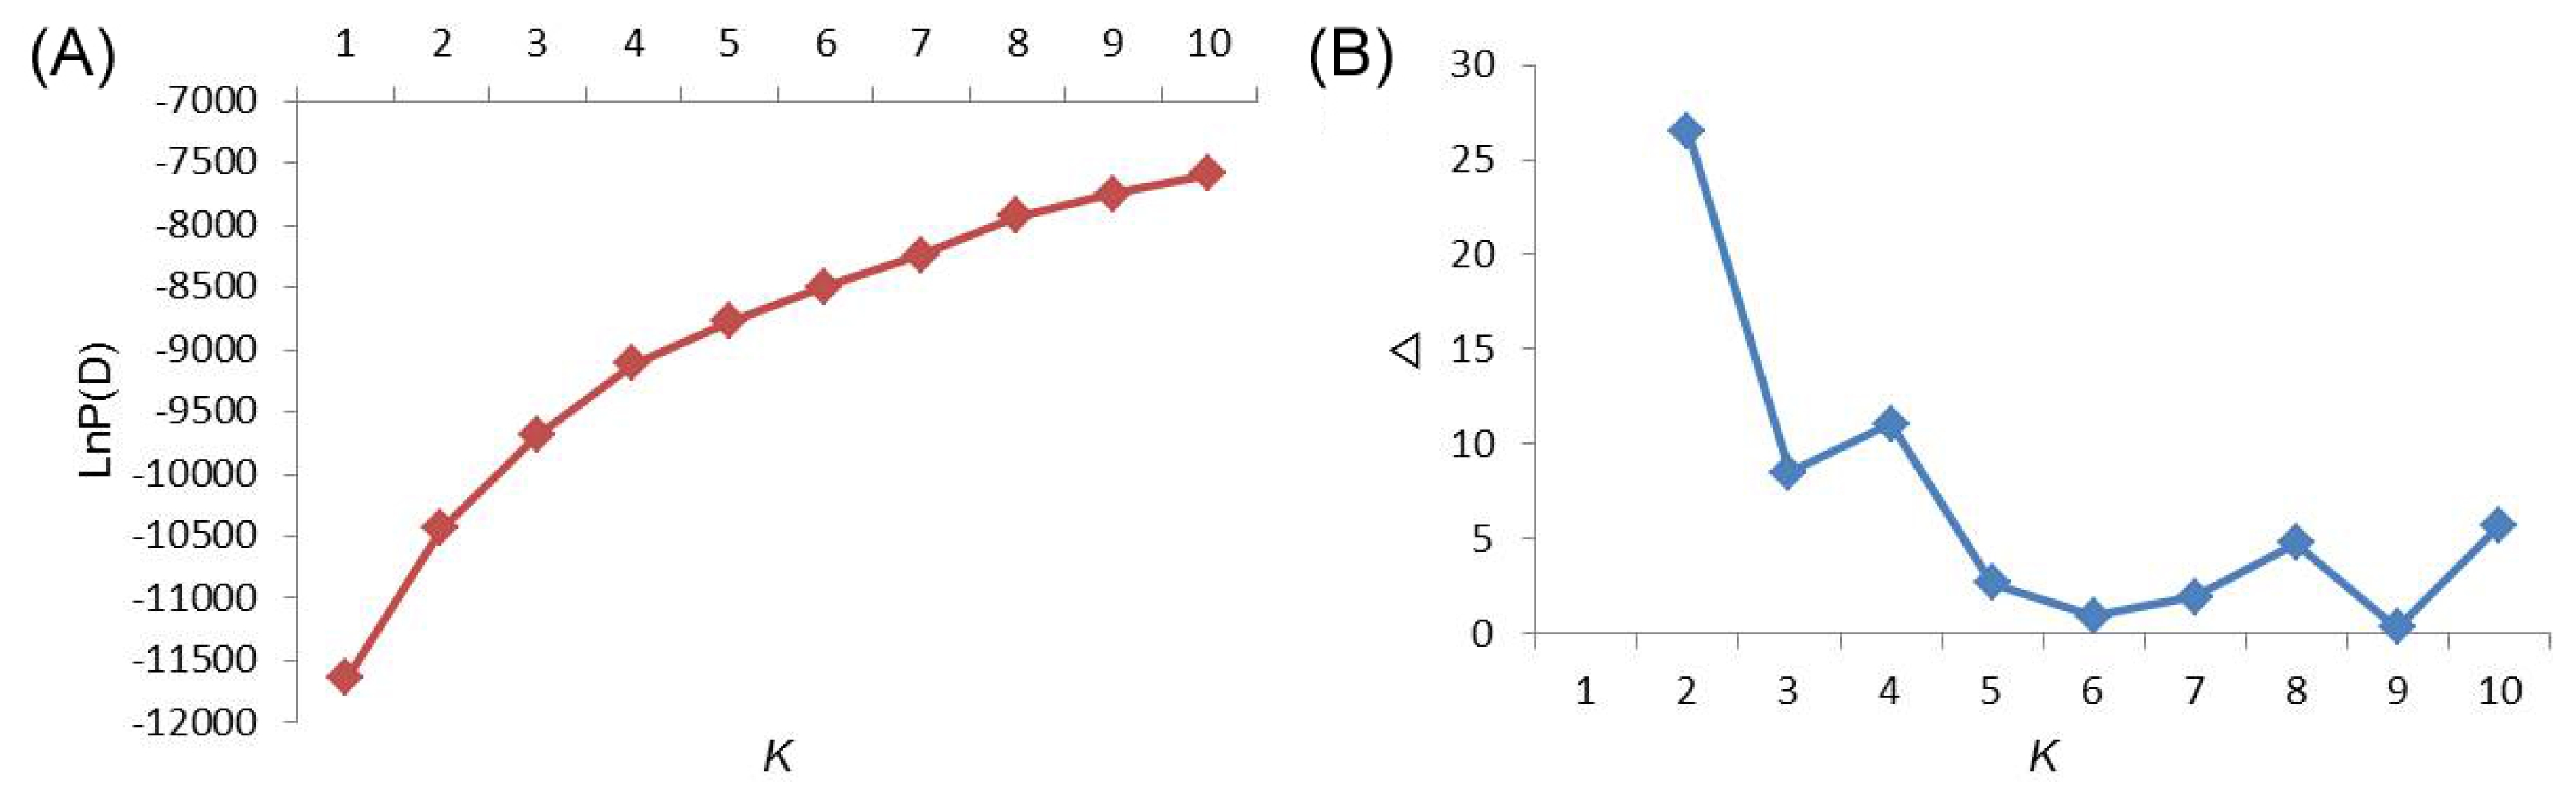
Fig. 2Estimated population structure of Asian tomato accessions assessed by STRUCTURE. Each individual is represented by a thin vertical bar, partitioned into up to k colored segments.
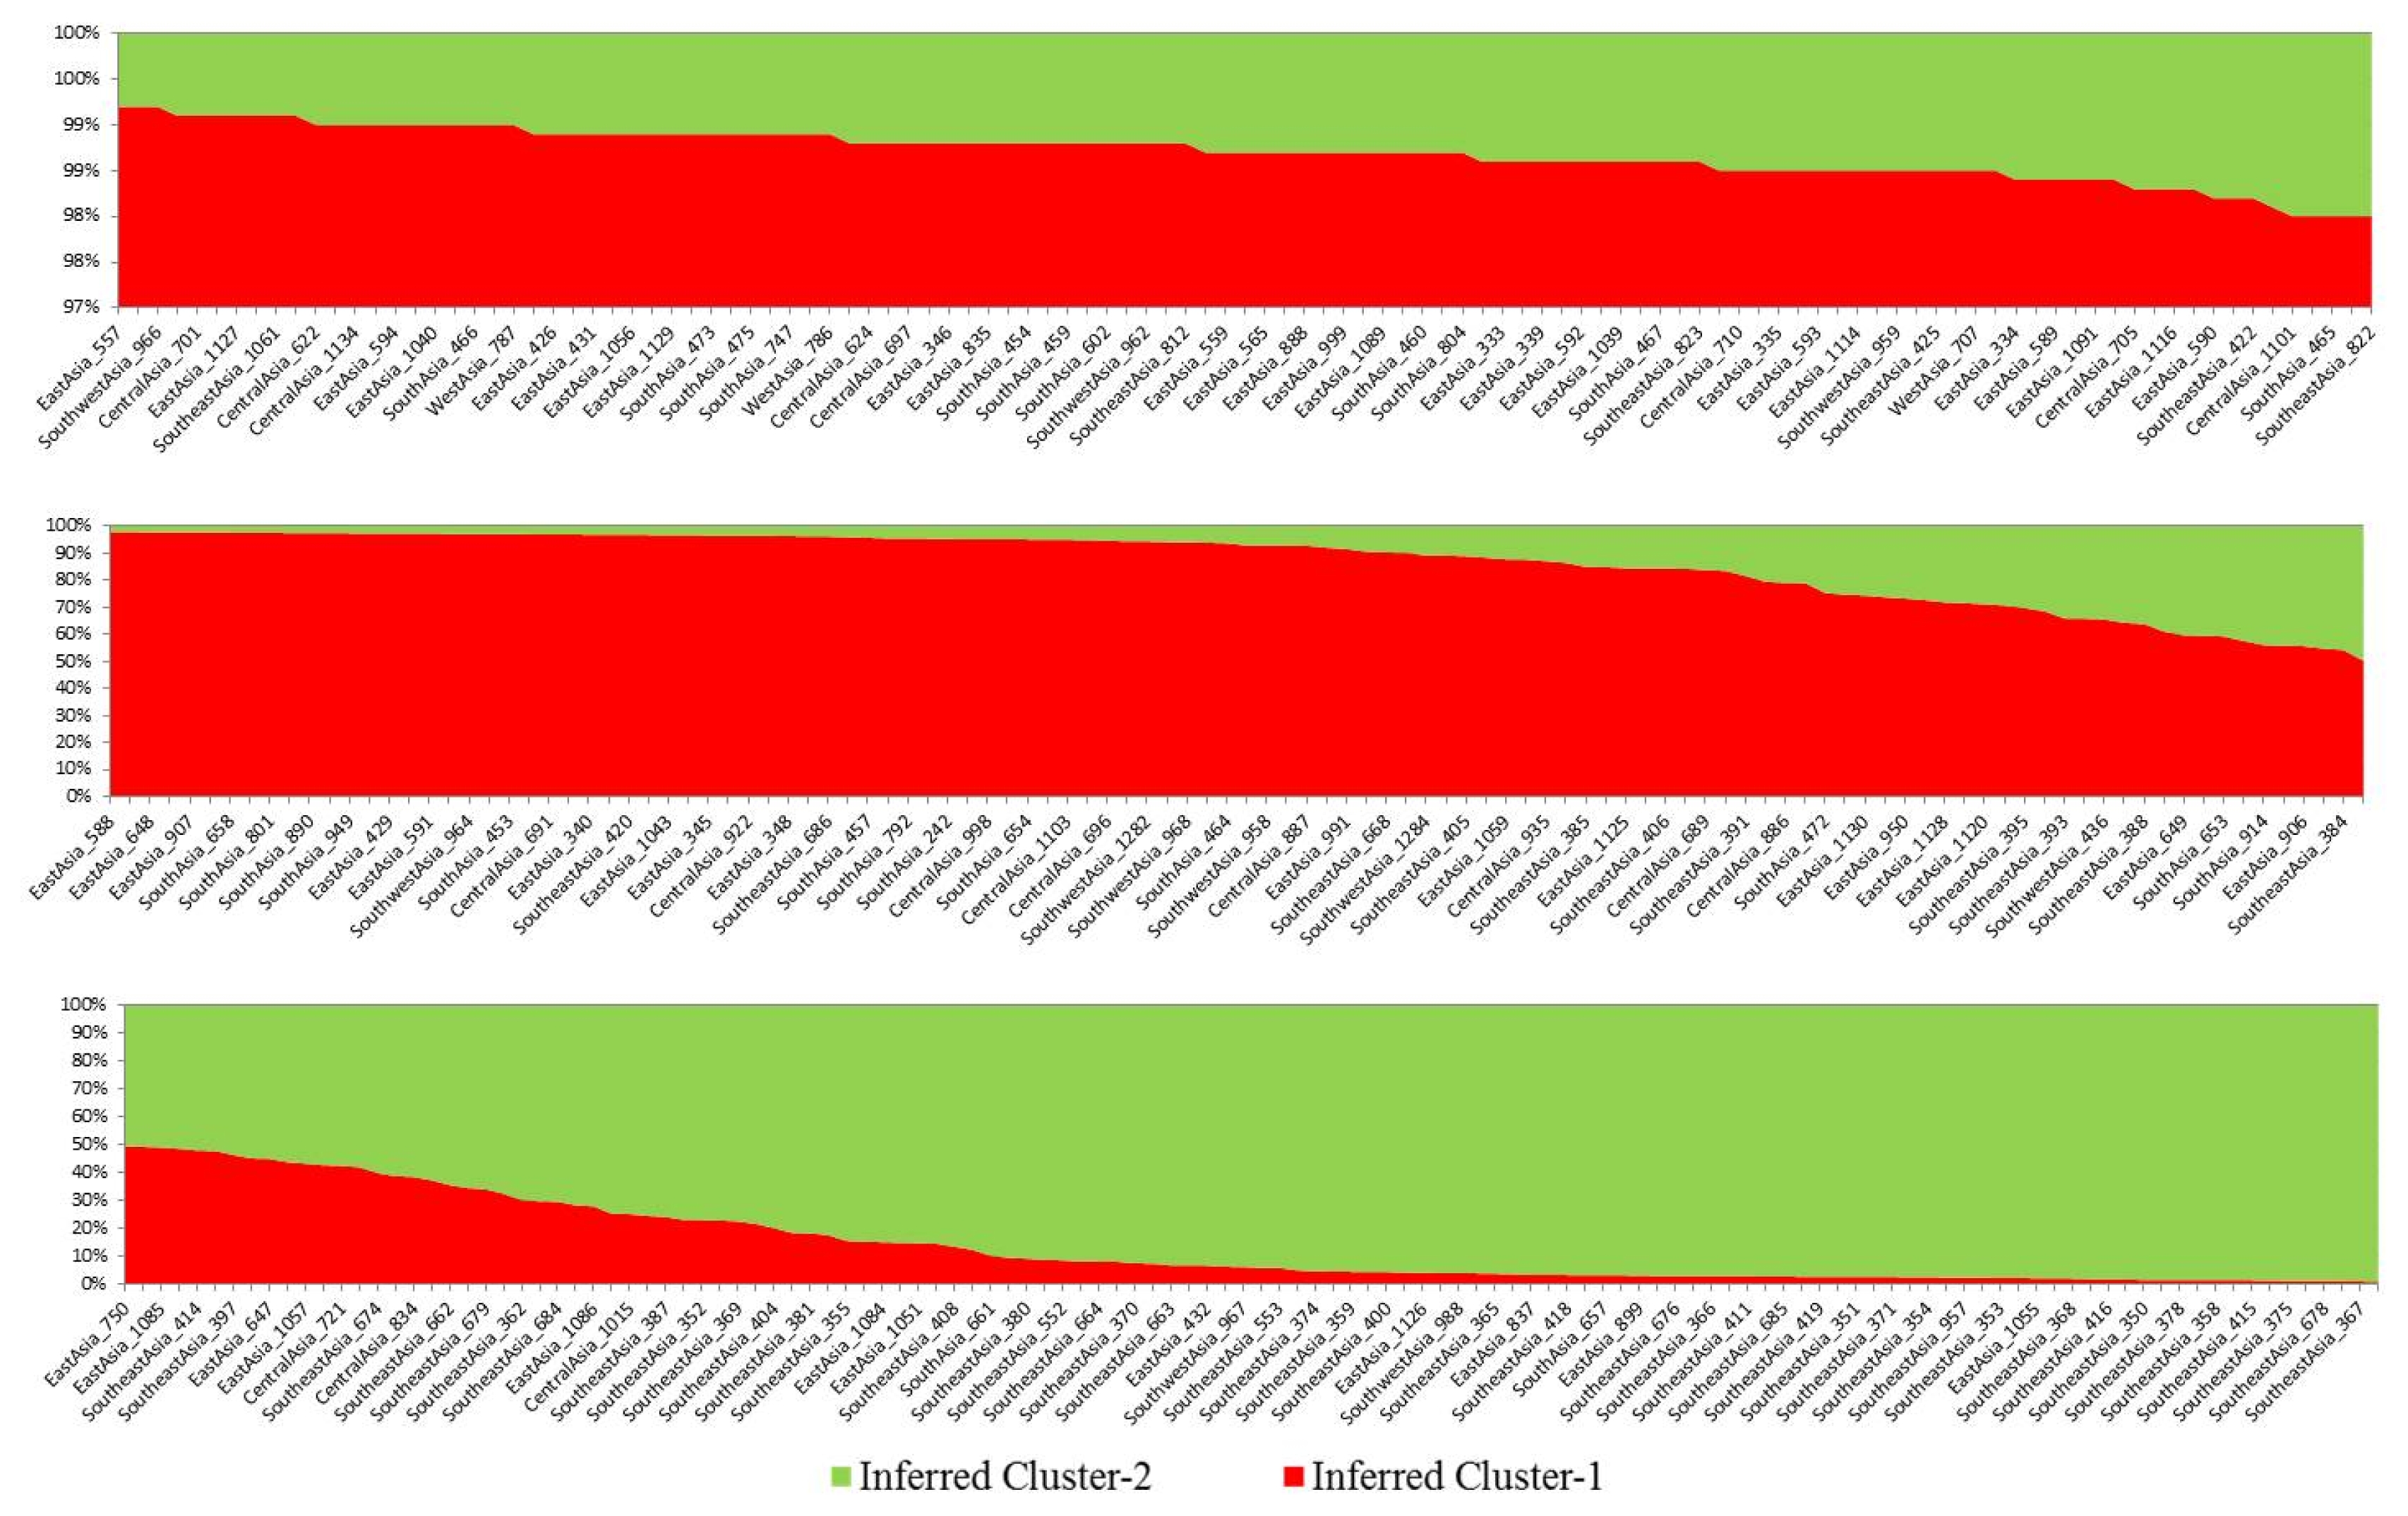
Fig. 3Unrooted neighbor-joining tree (UPGMA) based on Nei’s genetic distance matrix (shared allele frequency) among 355 Asian tomato accessions. Colors correspond to those of the model-based populations.

Fig. 4Principal component analysis of the 355 Asian tomato accessions collected from Asian geographical regions. Each symbol represents one variety from one of the six studied regions.

Table 1Summary of accessions used in the study.
Table 1
|
Geographical regions |
Number of countries |
Number of accessions |
|
Central Asia |
4 |
38 |
|
East Asia |
5 |
118 |
|
South Asia |
5 |
52 |
|
South West Asia |
2 |
18 |
|
South East Asia |
7 |
120 |
|
West Asia |
2 |
9 |
|
Total |
25 |
355 |
Table 2Total number of alleles and the genetic diversity index for 18 simple sequence repeat (SSR) loci in the 355 Asian Tomato accessions.
Table 2
|
SSR marker |
Reference |
Primers |
NAz)
|
MAF
|
NG |
Ho
|
GD |
PIC |
|
14F |
Tomato-EXPEN 2000 |
F: TCTGCATCTGGTGAAGCAAG
R: CTGGATTGCCTGGTTGATTT |
4.0 |
0.84 |
5.0 |
0.02 |
0.28 |
0.24 |
|
20N |
Tomato-EXPEN 2000 |
F: GAGGACGACAACAACAACGA
R: GACATGCCACTTAGATCCACAA |
3.0 |
0.69 |
5.0 |
0.05 |
0.43 |
0.34 |
|
565H |
Tomato-EXPEN 2000 |
F: GAGGATGATGAGAACTCGCC
R: TCAGAGGCTTCTGGGTCAGT |
3.0 |
0.86 |
4.0 |
0.00 |
0.24 |
0.22 |
|
37F |
Tomato-EXPEN 2000 |
F: ATTGAAGACCGAAACGGTTG
R: CTGATAAACCCGGCAAGACT |
3.0 |
0.91 |
4.0 |
0.02 |
0.16 |
0.15 |
|
214N |
Tomato-EXPEN 2000 |
F: AAATTCCCAACACTTGCCAC
R: CCCACCACTATCCAAACCC |
2.0 |
0.97 |
3.0 |
0.01 |
0.05 |
0.05 |
|
22F |
Tomato-EXPEN 2000 |
F: GATCGGCAGTAGGTGCTCTC
R: CAAGAAACACCCATATCCGC |
3.0 |
0.88 |
5.0 |
0.01 |
0.23 |
0.21 |
|
99H |
Tomato-EXPEN 2000 |
F: GCCTCGGATTCAATAGCATTA
R: CACAAAGAAGCAAACAACTCCA |
3.0 |
0.95 |
4.0 |
0.03 |
0.10 |
0.09 |
|
26F |
Tomato-EXPEN 2000 |
F: CGCCTATCGATACCACCACT
R: ATTGATCCGTTTGGTTCTGC |
2.0 |
0.96 |
3.0 |
0.01 |
0.08 |
0.08 |
|
593F |
Tomato-EXPEN 2000 |
F: TGGCATGAACAACAACCAAT
R: AGGAAGTTGCATTAGGCCAT |
4.0 |
0.73 |
7.0 |
0.05 |
0.4 |
0.32 |
|
SSR63f |
, Kwon et al. 2009
|
F: CCACAAACAATTCCATCTCA
R: GCTTCCGCCATACTGATACG |
20.0 |
0.51 |
31.0 |
0.10 |
0.68 |
0.64 |
|
SSR99f |
, Kwon et al. 2009
|
F: GCCTCGGATTCAATAGCATTA
R: CACAAAGAAGCAAACAACTCCA |
4.0 |
0.96 |
5.0 |
0.05 |
0.08 |
0.08 |
|
SLM12-12f |
, Geethanjali et al. 2011
|
F: AATTGCCACGTGGATTGACT
R: TGCAAGCTGTTCTTTTCAGA |
16.0 |
0.37 |
28.0 |
0.07 |
0.77 |
0.73 |
|
SLM12-31f |
, Geethanjali et al. 2011
|
F: TCGTAGCTTCTTTCACGTTGT
R: CCGAATGAAAAGGACAAGGA |
19.0 |
0.26 |
32.0 |
0.07 |
0.86 |
0.84 |
|
SLM12-33f |
, Geethanjali et al. 2011
|
F: GGACACATTTATGTCATAGCGTAG
R: CGATTGTCTGCATATCGGAAG |
22.0 |
0.42 |
30.0 |
0.04 |
0.76 |
0.74 |
|
SLM12-34h |
, Geethanjali et al. 2011
|
F: ATCCTCTGGTCTTTGCCAAC
R: TCATCCTGAACCACATGTCC |
4.0 |
0.92 |
7.0 |
0.03 |
0.15 |
0.15 |
|
SLM6-5h |
, Geethanjali et al. 2010
|
F: ATGCACGCAAAGGTTATTCC
R: AGTCGAAGTTGGCTTGACCA |
25.0 |
0.61 |
32.0 |
0.05 |
0.61 |
0.59 |
|
SLM6-14h |
, Geethanjali et al. 2010
|
F: TCCGTAATAAGTTGAGGAACCA
R: TCACAAGAATATTTGCCGTCAT |
21.0 |
0.30 |
23.0 |
0.01 |
0.81 |
0.79 |
|
SLM6-15h |
, Geethanjali et al. 2010
|
F: GGATTTCAGCTGCCTACTGAG
R: TTCGGAGAACATAATAGGGGTTT |
18.0 |
0.36 |
25.0 |
0.03 |
0.74 |
0.70 |
|
Total |
|
|
176 |
|
253 |
|
|
|
|
Mean |
|
|
9.8 |
0.69 |
14.1 |
0.04 |
0.41 |
0.39 |
Table 3Diversity information and FST values in the inferred subpopulations.
Table 3
|
Inferred group |
Diversityz)
|
FST*
|
|
|
|
n |
NA
|
GD |
H |
PIC |
1 |
2 |
Overall |
|
1 |
211 |
6.0 |
0.32 |
0.02 |
0.30 |
0.000 |
- |
- |
|
2 |
103 |
7.6 |
0.50 |
0.05 |
0.46 |
0.135 |
0.000 |
- |
|
Average |
|
6.8 |
0.41 |
0.03 |
0.38 |
- |
- |
0.135 |
Table 4Analysis of molecular variance of a number of populations.
Table 4
|
Source |
dfz)
|
SS |
MS |
Est. Var. |
%Tv |
P-value |
|
Among geographical groups |
5 |
183.9 |
36.8 |
0.3 |
6% |
0.001 |
|
Among individuals |
349 |
2713.8 |
7.8 |
3.7 |
86% |
0.001 |
|
Within individuals |
355 |
109.0 |
0.3 |
0.3 |
7% |
0.001 |
|
Total |
709 |
3006.7 |
|
4.3 |
100% |
|
References
- Aflitos S, Schijlen E, de Jong H, de Ridder D, Smit S, Finkers R, et al. 2014. Exploring genetic variation in the tomato (Solanum section Lycopersicon) clade by whole-genome sequencing. Plant J. 80: 136-148.
- Benor S, Zhang M, Wang Z, Zhang H. 2008. Assessment of genetic variation in tomato (Solanum lycopersicum L.) inbred lines using SSR molecular markers. J Genet Genomics. 35: 373-379.
- Bredemeijer M, Cooke J, Ganal W, Peeters R, Isaac P, Noordijk Y, et al. 2002. Construction and testing of a microsatellite database containing more than 500 tomato varieties. Theor Appl Genet. 105: 1019-1026.
- Evanno G, Regnaut S, Goudet J. 2005. Detecting the number of clusters of individuals using the software STRUCTURE: a simulation study. Mol Ecol. 14: 2611-2620.
- Falush D, Stephens M, Pritchard JK. 2003. Inference of population structure using multilocus genotype data: linked loci and correlated allele frequencies. Genetics. 164: 1567-1587.
- Food and Agriculture Organisation (FAO).2010. Plant genetic resources for food and agriculture. Food and Agriculture Organisation of the United Nations. Rome.
- Geethanjali S, Chen KY, Pastrana DV, Wang JF. 2010. Development and characterization of tomato SSR markers from genomic sequences of anchored BAC clones on chromosome 6. Euphytica. 173: 85-97.
- Geethanjali S, Kadirvel P, de la Pena R, Rao ES, Wang JF. 2011. Development of tomato SSR markers from anchored BAC clones of chromosome 12 and their application for genetic diversity analysis and linkage mapping. Euphytica. 178: 283-295.
- Gupta P, Idris A, Mantri S, Asif MH, Yadav HK, Roy JK, et al. 2012. Discovery and use of single nucleotide polymorphic (SNP) markers in Jatropha curcas L. Mol Breed. 30: 1325-1335.
- He C, Poysa V, Yu K. 2003. Development and characterization of simple sequence repeat (SSR) markers and their use in determining relationships among Lycopersicon esculentum cultivars. Theor Appl Genet. 106: 363-373.
- Klein-Lankhorst RM, Vermunt A, Weide R, Liharska T, Zabel P. 1991. Isolation of molecular markers for tomato (L. esculentum) using random amplified polymorphic DNA (RAPD). Theor Appl Genet. 83: 108-114.
- Kwon YS, Park SG, Yi SI. 2009. Assessment of genetic variation among commercial tomato (Solanum lycopersicum L) varieties using SSR markers and morphological characteristics. Genes Genom. 31: 1-10.
- Labate JA, Baldo AM. 2005. Tomato SNP discovery by EST mining and resequencing. Mol Breed. 16: 343-349.
- Lee KJ, Lee JR, Lee GA, Lee HS, Kwon SI, Cho YG, et al. 2015. Genetic diversity among Korean rice landraces (Oryza sativa L.) based on characters and SSR markers. Plant Breed Biotech. 3: 216-225.
- Liu K, Muse SV. 2005. PowerMarker: an integrated analysis environment for genetic marker analysis. Bioinformatics. 21: 2128-2129.
- Nei M. 1973. Analysis of gene diversity in subdivided populations. Proc Natl Acad Sci USA. 70: 3321-3323.
- Ohyama A, Asamizu E, Negoro S, Miyatake K, Yamaguchi H, Tabata S, et al. 2009. Characterization of tomato SSR markers developed using BAC-end and cDNA sequences from genome databases. Mol Breed. 23: 685-691.
- Peakall R, Smouse PE. 2012. GenAlEx 6.5: genetic analysis in Excel. Population genetic software for teaching and research: an update. Bioinformatics. 28: 2537-2539.
- Pritchard JK, Stephens M, Donnelly P. 2000. Inference of population structure using multilocus genotype data. Genetics. 155: 945-959.
- Rajput SG, Wable KJ, Sharma KM, Kubde PD, Mulay SA. 2006. Reproducibility testing of RAPD and SSR markers in tomato. Afr J Biotechnol. 5: 108-112.
- Saliba-Colombani V, Causse M, Gervais L, Philouze J. 2000. Efficiency of RFLP, RAPD, and AFLP markers for the construction of an intraspecific map of the tomato genome. Genome. 43: 29-40.
- Sharifova S, Mehdiyeva S, Theodorikas K, Roubos K. 2013. Assessment of genetic diversity in cultivated tomato (Solanum lycopersicum L.) genotypes using RAPD primers. J Hortic Res. 21: 83-89.
- Shirasawa K, Isobe S, Hirakawa H, Asamizu E, Fukuoka H, Just D, et al. 2010. SNP discovery and linkage map construction in cultivated tomato. DNA Res. 17: 381-391.
- Singh N, Jayaswal PK, Panda K, Mandal P, Kumar V, Singh B, et al. 2015. Single-copy gene based 50 K SNP chip for genetic studies and molecular breeding in rice. Sci Rep. 5: 11600
- Singh N, Singh M, Kumar S, Kumar R, Singh V, Prasanna HC, et al. 2007. RAPD markers for hybrid seed purity testing in tomato (Solanum lycopersicum L.). Curr Sci. 93: 462-463.
- Smulders MJM, Bredemeijer G, Rus-Kortekaas W, Arens P, Vosman B. 1997. Use of short microsatellites from database sequences to generate polymorphisms among Lycopersicon esculentum cultivars and accessions of other Lycopersicon species. Theor Appl Genet. 94: 264-272.
- Suliman-Pollatschek S, Kashkush K, Shats H, Hillel J, Lavi U. 2002. Generation and mapping of AFLP, SSRs and SNPs in Lycopersicon esculentum. Cell Mol Biol Lett. 7: 583-597.
- Suresh S, Chung JW, Cho GT, Sung JS, Park JH, Gwag JG, et al. 2014. Analysis of molecular genetic diversity and population structure in Amaranthus germplasm using SSR markers. Plant Biosyst. 148: 635-644.
- Tamura K, Dudley J, Nei M, Kumar S. 2007. MEGA4: molecular Evolutionary Genetics Analysis (MEGA) software version 4.0. Mol Biol Evol. 24: 1596-1599.
- Tautz D. 1989. Hypervariability of simple sequences as a general source for polymorphic DNA markers. Nucleic Acids Res. 17: 6463-6471.
- Todorovska E, Ivanova A, Ganeva D, Pevicharova G, Molle E, Bojinov B, et al. 2014. Assessment of genetic variation in Bulgarian tomato (Solanum lycopersicum L.) genotypes, using fluorescent SSR genotyping platform. Biotechnol Biotechnol Equip. 28: 68-76.
- Tomato Genome Consortium2012. The tomato genome sequence provides insights into fleshy fruit evolution. Nature. 485: 635-641.
- Wang J, Wang W, Li R, Li Y, Tian G, Goodman L, et al. 2008. The diploid genome sequence of an Asian individual. Nature. 456: 60-65.