Abstract
Low temperature stress at the seedling stage of rice is an important factor causing the leaf discoloration, wilting and consequently leads to non-uniform crop maturation. In order to screen the cold tolerance elite lines efficiently, the five cold treatment conditions with different water and air temperature were designed and treated at seedling stage. For the evaluation of seedling tolerance, the injury was scored by visual rate and measured by Soil and Plant Analyzer Development (SPAD) meter. In the reactions of varieties for each treatment, the treatment ‘B’ condition, 12ºC mean water with 24ºC mean air, shows clear discoloration, so it’s correlation coefficient was highest (r=−0.9, P<0.0001) among the treatments. In the treatment condition for screening the cold-tolerance elite line, the cultivar, treatment and their interaction significantly affect the SPAD value. The ‘A’ treatment, 12ºC mean water with 34ºC mean air, was the best way to observe the variation between the elite lines. On the basis of the Duncan’s test for SPAD value of cultivars, Keumo (moderate tolerant), Saetbyeol (sensitive) and Seolak (tolerant) were selected as check varieties. To study its impacts at the paddy field, the changes of crop characteristics such as height, panicle length, number of tiller and heading were investigated. In later growth period, the seedling treatment impact at the paddy field leads to heading delay. Due to the low temperature stress at the seedling stage induced by 12ºC mean cold water, Japonica and Tongil group shows the heading delay 4 to 7 and 8 to 11 days respectively.
-
Key words: Rice, Low temperature stress, Seedling stage, Cold tolerant, Soil and Plant Analyzer Development (SPAD) value, Heading delay
INTRODUCTION
Rice (
Oryza sativa L.) is the staple food of almost half the world’s population, including the majority of the Asian population (
Fairhurst and Dobermann 2002). Although its origin is in the tropics, rice is cultivated around the world, even in temperate region (
Nishiyama 1976). Low temperature stress causes the restriction in germination, growth, reproduction, and postharvest longevity and this physiological damage is commonly referred to as chilling injury (
Lyons et al. 1979). Throughout the world more than 15 million hectares of the rice cultivation is annually damaged due to the cold injury (
International Rice Research Institute 1979). About 10% of the rice locations under cultivation occasionally face to the temperatures that are too low for healthy plant development (
Wu and Grag 2003). In south west Asia, about 7 million hectares where rice is grown cannot be cultivated with recent developed cultivar due to the low temperature (
Sthapit and Witcombe 1998).
The traits related with cold tolerance (CT) differently respond to low temperature in each of growth stage and diverse rice varieties (
Choi and Lee 1976). Particularly, the low temperature leads to poor germination, discoloration and sallowed seedling, eventually makes unhealthy seedlings during the seedling stage (
Lee et al. 1989;
Yea et al. 2008). In this stage, the cold injury usually appears on the leaves as a symptom of wilting, discoloration and inhibition of growth at the 3th to 4th leaf stage. Among these symptoms, the discoloration is main indicator of seedling CT. Both chlorophyll and photosynthesis ratio have negative relationship with discoloration (
Kim et al. 1989). At the early growth stage in rice, the low temperature stress affects the newly emerging leaves to be lack of chlorophyll (
Yoshida et al. 1996).
Chlorophyll content has high correlation with nitrogen in leaf and thus Soil and Plant Analyzer Development (SPAD) value is used to determine the nitrogen requirement in rice (Chubachi
et al. 1986). Generally, the relationship between leaf color and chlorophyll is positive correlation (
Turner and Jund 1994). In accordance to the low temperature and duration, the SPAD value has a tendency of decrease and also related to the root vigor. The higher SPAD value, the more variety has tolerance to the discoloration (
Kim et al. 1989). For the quantitative trait locus (QTL) analysis about seedling CT, the SPAD value is utilized as indicator of discoloration (
Park et al. 2013).
During the entire rice growth stage under the cold water treatment of 17ºC, tillering stage mostly affect to the heading delay and the Indica varieties has more long heading delay than those of Japonica (
Oh 1981). As the water availability decreased with ascending field elevation, the heading date of rice was markedly delayed. The delay seemed to be related to the cumulative water stress before heading of rice (
Homma et al. 2004).
Recently, development of cropping system and extend of direct seedling in early spring have been increasing in rice cultivation due to the global warming. During seedling development period, the risk of exposure to the low temperature environment is higher than before. To prevent the damage of cold injury, it is the best way to develop the seedling cold tolerant cultivars (
Yea 1995). In breeding programs, the method to evaluate seedling CT commonly relies on visual observations (
Andaya and Mackill 2003). The condition of induced discoloration depends on the duration of low temperature and effect of air temperature (
Kim et al. 1989). The occurrence of leaf discoloration in rice mainly appears at lower than 15ºC and more severe condition is low water temperature keeping with high air temperature (
Lee et al. 1989).
In this study, we detailed discoloration condition by analyzing the relationship between water and air temperature to enhance screening efficiency and accuracy, and identified the seedling injury how much impact on the later growth at the paddy field.
MATERIALS AND METHODS
Plant materials and stress treatments
Rice cultivars for this research were decided through reviewing the data accumulated for ten years, as a result of the test for screening seedling CT lines. To minimize the trial error we focused on cultivar’s steady response to the low temperature stress. In other word the used cultivars have showed less annual variation than other lines. The selected cultivars including tolerant, moderate and sensitive to the seedling low temperature stress are composed of Japonica group and Tongil group having diverse heading days (
Table 1).
After refining the fifty seed, the seeds were placed in petri dish lined with filter paper. Pouring the distilled water with 50 ml volume, the seeds pre-germinated for three days were incubated in an incubator (JP/MIR-253; Sanyo, Osaka, Japan) with the condition of 32ºC temperature and no light. For sowing the germinated seeds, the seedling box (30×60×2.5 cm) was filled with the soil enough and the press the pushing plate to make the regular 24 drills (1×13×1.5 cm). In each of the treatment, uniformly germinated 30 seeds per cultivar were sowed at the seedling box and thinly covered by soil not to be exposure. The experiment was conducted in a randomized block design with the eight repeats.
After normally growing in the nursery house until the 3rd leaf stage, the low temperature stress was treated as following conditions. At the ‘A’ and ‘B’ trials, each of the cultivar’s seedlings was soaked with the 5 cm depth of cold water which was continuously flowing during the 10 days to maintain the constant water temperature, 12ºC. The difference between ‘A’ and ‘B’ treatment is the air temperature, the former is mean inner house temperature, 33ºC and later is naturally mean outside temperature, 24ºC. In the same way, 17ºC mean cold water was used at the ‘C’ and ‘D’ trials and the mean air temperature is natural temperature, 24ºC and high temperature, 33ºC respectively. The ‘E’ trial was control, the natural condition without any low temperature stress (
Table 2).
After treatment of each condition for 10 days at the 3rd leaf stage, the seedlings were investigated by the visual scoring criterion based on Investigative and Analytical Standards of Agricultural Science and Technology (
RDA 2012). For the objective phenotypic scoring, the SPAD values were acquired by a SPAD meter (SPAD-502; Konica Minolta, Tokyo, Japan). The SPAD values were obtained from the randomly selected 3 plants in each of the plot per cultivars and calculated into mean value of three position, top, middle and bottom of the blade per each plant.
The seedlings treated with each of the trial condition were transplanted with the space of 25×12 cm, one seedling per hill. The experiment of paddy field was conducted in a randomized block design with the four repeats. A fertilizer was applied at the rate of 11 kg of N, 4.5 kg of P2O5 and 5.7K2O per 1,000 m2 as a basal dressing. The management after transplanting was followed by the Rice Standard Cultural Practices. To analyze the effect of seedling cold injury at the late growth stage, the changes of agricultural traits were investigated such as height, panicle length, number of tiller and heading.
RESULTS
Reactions of varieties under different chilling treatments
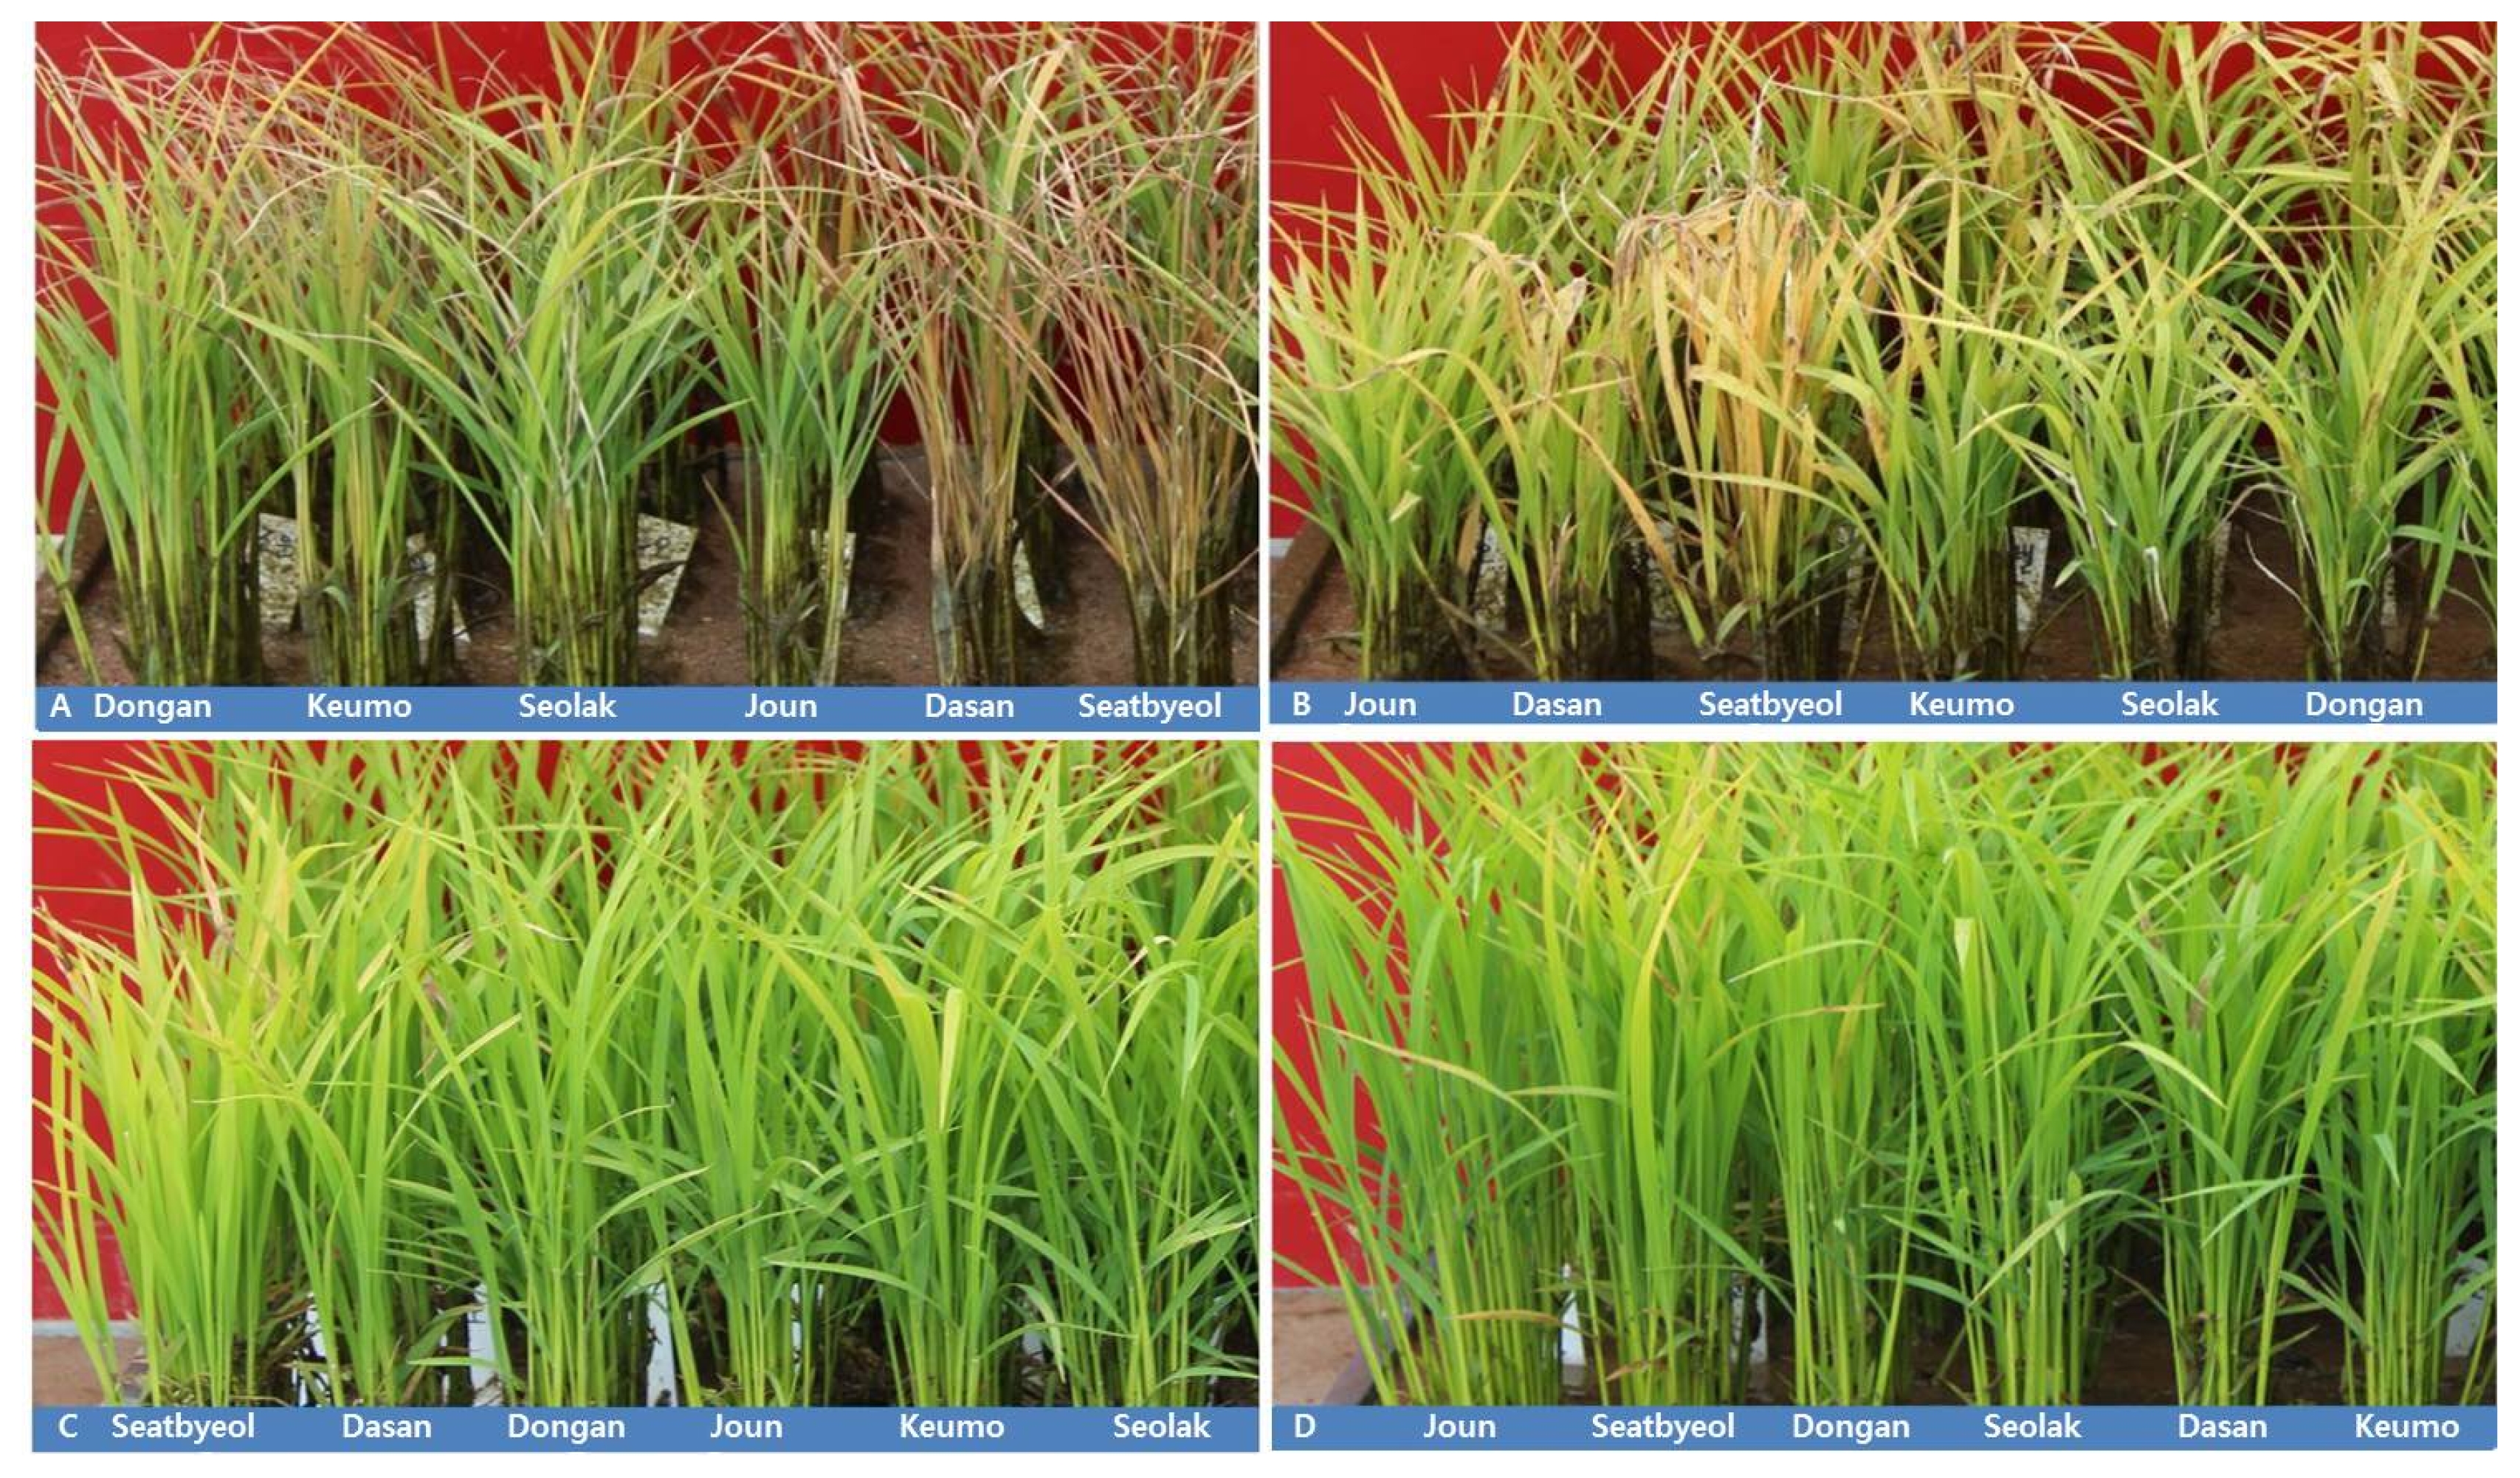
Responses to the low temperature stress at the seedling stage were diverse between varieties and treatments. Tongil was more sensitive to the cold treatment stress than Japonica type. Especially, Saetbyeol exhibited noticeably weak symptoms as compared to other cultivars. Considering the seedling shape after treatment, ‘A’ condition, 12ºC mean water with 33ºC mean air, was the most severe condition. This condition caused different stresses between roots and leave, i.e., the low temperature stress for roots and hot stress for leave. As a result of these stresses, the subterranean part might be limited to absorb water while aerial part cannot transpire normally. So ‘A’ treatment’s leaves including even some cultivars which have performed the tolerance reaction have a tendency to show wither symptom (
Fig. 1A). Consequently, through this condition’s test, the elite lines having tolerance against discoloration and wilting could be selected at the same time. In contrast, the treatment ‘B’ condition, 12ºC mean water with 24ºC mean air, showed clear discoloration rather than observed wilting symptom. For example, through the test of ‘A’, it was difficult to differentiate between Saetbyeol and Dasan because they were already withered by harsh conditions. However, using the treatment ‘B’ condition being able to exclude the wilting symptom, the wilting sensitive lines such like Tongil group could be exactly scored by their clear discoloration reactions. For QTL analysis, various indicators related seedling CT were separately used such as cold-induced wilting tolerance (CIWT), CT, cold-induced necrosis tolerance (CINT), cold-induced yellowing tolerance (CIYT) (
Andaya and Mackill 2003).
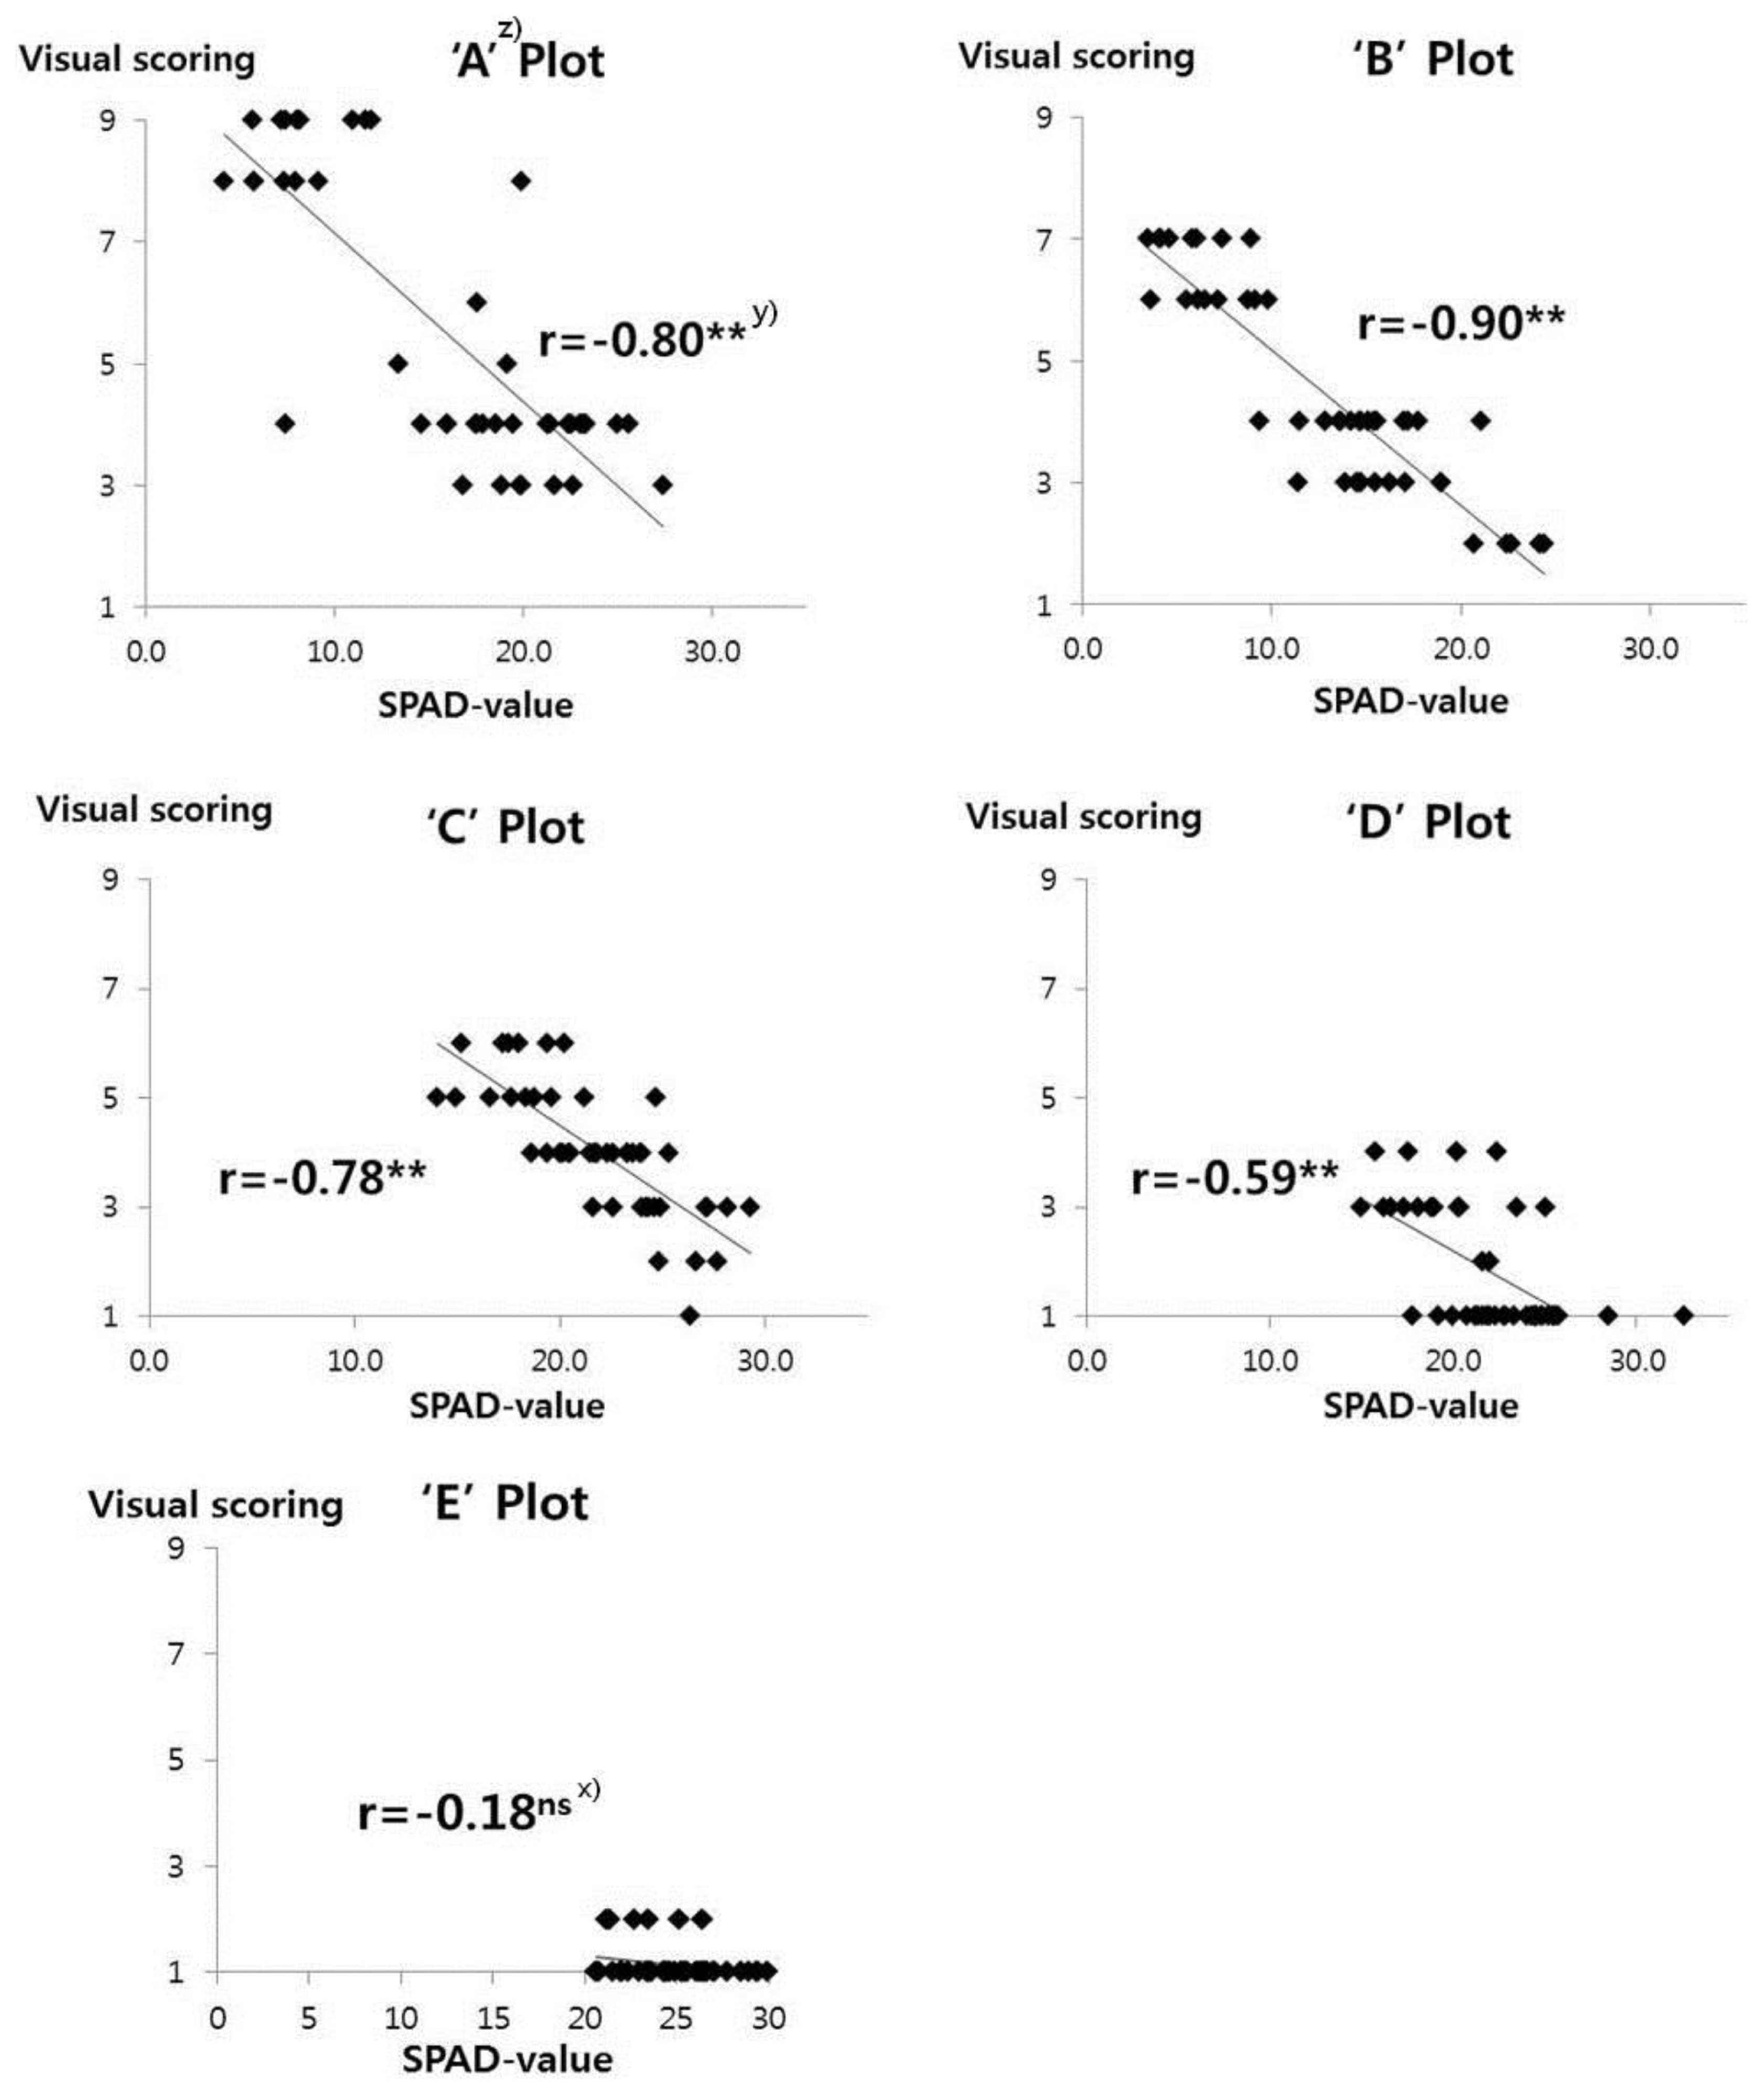
It was considered that how much the respective treatment could be presented the reliability as an objective method. So every treatment was analyzed by correlation with SPAD value and visual scoring. The result showed that every treatment except ‘E’ (control) condition had highly significant correlation. Under the low temperature seedling stress, leaf photosynthesis ratio decreased faster at the cold sensitive cultivar compared with cold tolerant one. The leaf chlorophyll A concentration was correlated with SPAD value significantly (
Kim et al. 1989). And photosynthesis ability was closely related with chlorophyll content during leaf senescence at the seedling stage (
Kura-Hotta et al. 1987). So utilize the SPAD value could be utilized as an index presenting the degree of seedling cold injury. Among the treatments, ‘B’ test had the most negative high correlation coefficient (r=−0.9,
P<0.0001) and ‘E’ test (control) showed low negative correlation with no significance. Also the ‘A’ treatment had high level of correlation but its correlation coefficient value was similar to that of ‘C’ treatment which had low treatment effect. In other words, the treatment effect of ‘A’ test was dynamic as shown (
Fig. 1), but reliability was ‘C’ treatment level. The reason might be that induced wilting by ‘A’ treatment decreased the reliability to the level of ‘C’ treatment. At the same condition of cold water temperature, natural air condition leaded to higher reliability than higher temperature (
Fig. 2).
As a result of ANOVA test, F-value of cultivar and treatment were 108.58, 228.88 respectively and their significant probability (Pr>F) was smaller than level of significance, α=0.01 and their interaction was also significant. So the cultivar, treatment and their interaction affected the SPAD value (
Table 3).
To analyze the effect of each treatment affecting SPAD value significantly, Duncan test was carried out. Among the treatments, ‘A’ treatment could classify into the most diverse groups (
Table 4). So compared with other treatments, ‘A’ treatment was the best way to observe the variation among the elite lines. Therefore, to evaluate the CT, present breeding program in Korea had utilized the condition of ‘A’ treatment for many years.
The conventional visual scoring had an advantage of evaluating the lines in a large and at a short time. In order to that, however, the various check varieties which had low fluctuation and annually steady response were necessary. At the Duncan’s test for SPAD value of cultivars, tested cultivars could be categorized by two classes, the one was check group consisting of Keumo (moderate), Saetbyeol (sensitive), and Seolak (tolerant) and the other was group of Joun, Dongan, and Dasan which were grouped small or unclearly (
Table 5). Presently when evaluating the lines about CT, Seolak and Saetbyeol were used as a tolerant, sensitive respectively. But due to the absence of moderate check cultivar, it was very difficult to evaluate with a conventional way. If using the ‘Keumo’ as a moderate check cultivar, it will be expected to elevate the accuracy and efficiency in developing CT cultivars.
The tested cultivars consist of two groups, Japonica and Tongil. Between two groups, there was difference in level of seedling CT. So it was needed to analyze with dividing into two groups. Within the Tongil group, F-value of treatment was 177.98 and significant probability (Pr>F) was highly significant. Therefore, in the Tongil group the main effect was treatment rather than cultivar and the effect between the treatments was not same. This experiment indicated that the variations of SPAD value could be explained by the treatment more than 91%. In the Japonica group, cultivars, treatment and their interactions affected the SPAD value significantly (
Table 6).
The result of Duncan’s multiple range test in the Tongil and Japonica group for SPAD value was remarked with a text a, b, c, d which were divided into 3 and 4 groups respectively. The cold seedling treatment effect was significantly different at the 5% level. By this result it was identified that the grouping was mainly depend on the cold water temperature rather than other treatment condition, especially at the Tongil group (
Table 7).
The result of ANOVA analysis, all agronomic traits such as heading, culm length, panicle length and tiller number were affected by cultivars. Considering the treatment effect, all the traits except for tiller number was significant at the level of α=0.01. And interaction with cultivar and treatment was significant at the level of α=0.01 about heading, culm length and panicle length (
Table 8).
As the result of t-test with control(‘E’ plot), heading was significant at the level of α=0.01 except for ‘D’ treatment Geumo which was significant at the level of of α=0.05. In particular, even the ‘C’ and ‘D’ treatment which induced relatively weak low temperature stress also leaded to the heading gaps in every cultivar. This means that somewhat weak low temperature stress at the seedling stage might affect the later growth, mainly heading delay. About culm length, ‘A’ and ‘B’ treatment presented the difference in some cultivars, specially ‘A’ treatment’s effect was strong. Mostly, the panicle length and tiller number had no difference significantly with control (
Table 9).
Among the investigated agronomic traits, the heading was highly affected by treatment. So it is need to calculate the heading delay induced by the seedling cold injury and analyze the data through the Duncan’s multiple range test. In the ‘A’ and ‘B’ treatment, most cultivar’s heading delay was longer than that of ‘C’ and ‘D’. It was identified heading delay was mainly depend on the temperature of water, and the relatively weak low temperature stress, which could not be distinguished by naked eye or SPAD meter within the Japonica group, also caused somewhat short heading delay (
Table 10).
As a result of Duncan’s multiple range test for heading delay, Tongil group such as ‘Saetbyeol’, and ‘Dasan’ had a tendency of long heading delay in comparison with Japonica group. When the low temperature stress damage seedlings, the Japonica group have 2 to 7 days of heading delay and Tongil group had 5 to 11 days of heading delay (
Table 11). Within the Japonica group, the reaction of heading delays could be classified into two groups. The first group including ‘Seolak’ and ‘Joun’ showed that their heading delays occurred resulting from the extent of seedling chilling injury, but did not increase in accordance with strength of the cold. The other group including ‘Keumo’ and ‘Dongan’ were diversely grouped in accordance with the strength of treatments. In other word, their heading delays additively increased by the extent of seedling stress.
DISCUSSION
In this experiment it could be identified that the water temperature was the main factor to induce the cold injury at the seedling stage. And between the Tongil and Japonica group, the Tongil cultivars were more sensitive. This was consistent of the report that the Tongil and Indica cultivars more occurred discoloration and there was large difference within cultivars at the range of 13ºC to 17ºC (
Choi et al. 1975;
Oh 1981). And water temperature was more influential than air temperature on the early growth stage because the growing points of rice seedling were under water (
Nishiyama 1976). The screening method in the breeding system could be differed according to the purpose, plant characteristic or their scale. Rice cultivars cultivated in Korea have been changed according to the breeding target reflecting consumer’s needs. For example in the 1970s, most cultivated cultivar was Tongil type having trait of high yield, but after 1980s it was changed to Japonica type with cultivation stability and high quality. Japonica type has a tendency to overall CT compared with Tongil type including seedling tolerance. So it is difficult to have wide variations to screen the tolerance line among Japonica group. In most previous studies, the constant low temperature condition in both water and air was used by means of growth chamber to induce the seedling cold injury. In such conditions wilting symptom occurred rather than leaf discoloration. For the leaf discoloration, changed temperature condition setting the 25ºC day/9ºC night was treated using growth chamber (
Andaya and Mackill 2003). But recently developed Japonica elite lines show narrow variation for the wilting and discoloration symptom responding to seedling low temperature stress. In this study, the modified condition, which has the constant and changing temperature simultaneously, makes the wide variations among Japonica groups. In the case of Korea, the scale of material to be screened was approximately 1,500 elite lines per year. There were many limitations to screen the large scale of lines at once, such as space, time, energy, experienced personnel and so on. ‘A’ condition, 12ºC mean water with 33ºC mean air, was the most severe condition which induced the discoloration and wilting simultaneously. Because of symptom of discoloration and wilting, this condition made diverse variation between the elite lines. As shown the result of Duncan’s multiple range test for SPAD value of treatments, this treatment could classify as most diverse groups. But induced wilting might hinder correct visual scoring. By correlation analysis, this treatment’s reliability was somewhat dropped compared with ‘B’ treatment, 12ºC mean water with 24ºC mean air. This problem could be solved by using the various check varieties which have low fluctuation and annually steady response. At the Duncan’s test for SPAD value of cultivars, we found the check group consisting Keumo (moderate tolerance), Saetbyeol (sensitive) and Seolak (tolerant). By using these check cultivars, we expect to elevate the accuracy and efficiency in developing CT cultivars. For the materials demanding accuracy evaluation, the evaluation was needed to be more detailed. For QTL analysis, various indicators related seedling CT was separately used such as CIWT, CT, CINT, CIYT (
Andaya and Mackill 2003). In this study, the treatment ‘B’ condition, 12ºC mean water with 24ºC mean air, showed clear discoloration without observing wilting symptom. The induced discoloration condition depended on the duration of low temperature and effect of air temperature (
Kim et al. 1989). More sever condition was below the 15ºC or water temperature was low and simultaneously air temperature was high (
Lee et al. 1989). Considering the air temperature, the 24ºC mean air temperature was consistent with previous studies, but above 24ºC mean air temperature it was found that wilting symptom more occurred rather than discoloration. Among the treatments, ‘B’ treatment had the most negative high correlation coefficient (r=−0.9,
P<0.0001). Therefore the ‘B’ treatment was the best way to assessed about the small scale of materials required accurate evaluation such as QTL analysis. Also with using additional check varieties, the visual scoring might have more reliability than before. It was identified that cold injury at the seedling stage affected the heading in the period of later growth at the paddy field and even relatively weak low temperature stress also leaded to the heading gaps in every cultivar, especially Tongil group. This result was consistent that the occurrence of low temperature stress at the seedling stage of rice inhibited seedling establishment and eventually leaded to poor growth and heading delay or bad grain filling (
Sthapit and Witcombe 1988;
Andaya and Tai 2006). It was reported that the heading delay by the cold injury was more sensitive to Tongil group (
Choi et al. 1991) and the delay of heading was more affected with these stage of order, tillering, meiosis, booting (
Oh 1981). In the ‘A’ and ‘B’ treatment, most cultivar’s heading delay was longer than that of ‘C’ and ‘D’. It was identified heading delay was mainly depend on the temperature of water, and the relatively weak seedling low temperature stress which could not be distinguished by naked eye or SPAD meter within the Japonica group also caused somewhat short heading delay. It was also reported that at the early growth stage the heading delay was affected by cold water (Kuno and Shimizu 1973). Therefore in spite of no observation of discoloration, it could be speculated the seedling injury with using the check cultivar’s heading delay calculated by annual average heading day. And with application of respective treatment’s features, we hope many varieties with seedling CT developed.
ACKNOWLEDGEMENTS
This work was supported by crop research program (No. PJ009325032016) of National Institute of Crop Science (NICS), Rural Development Administration (RDA), Republic of Korea.
Fig. 1The reaction extent of discoloration and wilting for each treatment (A: 12ºC mean water with 33ºC mean air, B: 12ºC mean water with 24ºC mean air, C: 17ºC mean water with 24ºC mean air, D: 17ºC mean water with 33ºC mean air) for 10 days at the 3rd-leaf stage.

Fig. 2
The analysis of correlation between Soil and Plant Analyzer Development (SPAD) value and visual scoring.
z)A: 12ºC mean water with 33ºC mean air, B: 12ºC mean water with 24ºC mean air, C: 17ºC mean water with 24ºC mean air, D: 17ºC mean water with 33ºC mean air, E: 23ºC mean water with 24ºC mean air.
y)**: Highly significant at 0.01 probability level.
x)ns: not significant.

Table 1Rice cultivars selected for this study and their visual scores of seedling cold tolerance for 10 years.
Table 1
|
Maturity |
Cultivar |
Visual scoring |
Tolerant level |
Group |
|
Early |
Joun |
3.8±0.92 |
Tolerant |
Japonica |
|
Seolak |
3.3±0.48 |
Tolerant |
Japonica |
|
Keumo |
5.4±0.84 |
Moderate |
Japonica |
|
Medium-Late |
Dongan |
4.3±0.95 |
Slightly tolerant |
Japonica |
|
Dasan |
7.8±0.79 |
Slightly sensitive |
Tongil |
|
Saetbyeol |
9.0±0.00 |
Sensitive |
Tongil |
Table 2The conditions of each low temperature stress treatment at the seedling stage of rice.
Table 2
|
Treatment |
Mean water temperature (ºC) |
Mean air temperature (ºC) |
Remark |
|
‘A’ |
12±1 |
33±14 |
Hot condition (practice) |
|
‘B’ |
12±1 |
24±7 |
Natural condition |
|
‘C’ |
17±1 |
24±7 |
Natural condition |
|
‘D’ |
17±1 |
33±14 |
Hot condition |
|
‘E’ |
24±5 |
24±7 |
Natural condition (control) |
Table 3The ANOVA table for Soil and Plant Analyzer Development (SPAD) value.
Table 3
|
Source |
DFz)
|
SS |
Mean square |
F-value |
Pr>F |
|
Cv |
5 |
2,781.786052 |
556.357810 |
108.58 |
<0.0001 |
|
Tr |
4 |
4,691.150458 |
1,172.787615 |
228.88 |
<0.0001 |
|
Cv x tr |
20 |
1,141.147542 |
57.057377 |
11.14 |
<0.0001 |
Table 4Duncan’s multiple range test for Soil and Plant Analyzer Development (SPAD) value of treatments.
Table 4
|
Treatment |
Joun |
Seolak |
Dongan |
Keumo |
Saetbyeol |
Dasan |
|
‘A’z)
|
23.8a±2.1 |
19.3b±1.7 |
20.1b±3.3 |
16.8c±1.6 |
8.9d±2.3 |
6.9d±1.6 |
|
‘B’ |
20.7a±3.5 |
15.6b±1.8 |
14.4b±3.5 |
14.6b±2.0 |
5.6c±1.9 |
7.1c±2.1 |
|
‘C’ |
26.5a±1.8 |
24.8a±1.7 |
21.9b±2.0 |
21.6b±1.0 |
17.5c±1.8 |
19.1c±3.1 |
|
‘D’ |
25.4a±3.0 |
24.4a±2.3 |
23.1ab±1.9 |
21.0bc±2.1 |
18.7c±1.5 |
19.6c±3.8 |
|
‘E’ |
24.2b±2.1 |
28.2a±1.8 |
23.9b±1.3 |
25.9b±2.6 |
24.1b±2.1 |
24.0b±1.7 |
Table 5Duncan’s multiple range test for Soil and Plant Analyzer Development (SPAD) value of cultivars.
Table 5
|
Cultivar |
Treatment |
|
|
‘A’z)
|
‘B’ |
‘C’ |
‘D’ |
‘E’ |
|
Keumo |
16.8c±1.6 |
14.6d±2.0 |
21.6b±1.0 |
21.0b±2.1 |
25.9a±2.6 |
|
Saetbyeol |
8.9c±2.3 |
5.6d±1.9 |
17.5b±1.8 |
18.7b±1.5 |
24.1a±2.1 |
|
Seolak |
19.3c±1.7 |
15.6d±1.8 |
24.8b±1.7 |
24.4b±2.3 |
28.2a±1.8 |
|
Joun |
23.8a±2.1 |
20.7b±3.5 |
26.5a±1.8 |
25.4a±3.0 |
24.2a±2.1 |
|
Dongan |
20.1b±3.3 |
14.4c±3.5 |
21.9ab±2.0 |
23.1a±1.9 |
23.9a±1.3 |
|
Dasan |
6.9c±1.6 |
7.1c±2.1 |
19.1b±3.1 |
19.6b±3.8 |
24.0a±1.7 |
Table 6The ANOVA table for Soil and Plant Analyzer Development (SPAD) value analyzed by dividing Tongil and Japonica group.
Table 6
|
Group |
Source |
DFz)
|
SSy)
|
Mean square |
F-value |
Pr>F |
R square |
|
Tongil |
Cv |
1 |
3.16 |
3.2 |
0.60 |
0.4419 |
0.911321 |
|
Tr |
4 |
3,761.3 |
940.3 |
177.98 |
<0.0001 |
|
|
Cv x tr |
4 |
36.1 |
9.0 |
1.71 |
0.1576 |
|
|
Japonica |
Cv |
3 |
414.55 |
138.18 |
27.39 |
<0.0001 |
0.776199 |
|
Tr |
4 |
1,720.99 |
430.25 |
85.29 |
<0.0001 |
|
|
Cv x tr |
4 |
313.86 |
26.15 |
5.18 |
<0.0001 |
|
Table 7Duncan’s multiple range test for Soil and Plant Analyzer Development (SPAD) value of Tongil and Japonica group.
Table 7
|
Groups |
Treatments |
|
|
‘A’c z)
|
‘B’c
|
‘C’b
|
‘D’b
|
‘E’a
|
|
Tongil |
7.9±2.2 |
6.3±2.0 |
18.3±2.6 |
19.2±2.8 |
24.0±1.9 |
|
Japonica |
20.0±3.4 |
16.3±3.7 |
23.7±2.6 |
23.5±2.8 |
25.5±2.6 |
Table 8ANOVA table for agronomic traits after 3rd leaf treatment at different water and air temperature.
Table 8
|
Trait |
Source |
DFz)
|
SSy)
|
Mean square |
F-value |
Pr>F |
|
Heading |
Cv |
5 |
12,015.8 |
2,403.2 |
2,338.2 |
<0.0001 |
|
Tr |
3 |
622.8 |
207.6 |
202.0 |
<0.0001 |
|
Cv x tr |
15 |
187.2 |
12.5 |
12.1 |
<0.0001 |
|
Culm length |
Cv |
5 |
9,022.6 |
1,804.5 |
401.6 |
<0.0001 |
|
Tr |
3 |
71.7 |
23.9 |
5.3 |
0.0023 |
|
Cv x tr |
15 |
342.2 |
22.8 |
5.1 |
<0.0001 |
|
Panicle length |
Cv |
5 |
215.1 |
43.0 |
22.7 |
<0.0001 |
|
Tr |
3 |
28.5 |
9.5 |
5.0 |
0.0032 |
|
Cv x tr |
15 |
68.2 |
4.5 |
2.4 |
0.0071 |
|
Tiller number |
Cv |
5 |
268.7 |
53.7 |
29.7 |
<0.0001 |
|
Tr |
3 |
17.9 |
6.0 |
3.3 |
0.0254 |
|
Cv x tr |
15 |
28.9 |
1.9 |
1.1 |
0.4017 |
Table 9T-test with control, and agronomic traits at the paddy field.
Table 9
|
Treatment |
Cultivar |
Heading (d) |
Culm length (cm) |
Panicle length (cm) |
Tiller number |
|
‘A’z)
|
Keumo |
87**±1.2 |
58**±1.9 |
25*±1.0 |
10±0.7 |
|
Dasan |
ND |
ND |
ND |
ND |
|
Dongan |
94**±0.0 |
59*±1.0 |
19±1.3 |
11±1.9 |
|
Saetbyeol |
ND |
ND |
ND |
ND |
|
Seolak |
86**±1.2 |
52±1.6 |
24±1.8 |
8±1.3 |
|
Joun |
80**±0.6 |
59*±2.8 |
24±2.0 |
9±0.7 |
|
‘B’ |
Keumo |
86**±0.0 |
63±2.9 |
23±2.2 |
10±1.2 |
|
Dasan |
117**±0.6 |
49±1.6 |
21±0.9 |
10±1.0 |
|
Dongan |
95**±0.6 |
63±0.4 |
19±0.7 |
12±1.7 |
|
Saetbyeol |
107**±4.0 |
33*±1.5 |
19±1.4 |
13±0.7 |
|
Seolak |
85**±0.0 |
59±0.6 |
21±0.6 |
10±1.1 |
|
Joun |
80**±0.6 |
57**±1.1 |
23±1.3 |
8±0.8 |
|
‘C’ |
Keumo |
84**±0.0 |
60*±2.0 |
24±0.7 |
10±0.9 |
|
Dasan |
111**±1.7 |
51±2.6 |
22±1.8 |
11±1.2 |
|
Dongan |
92**±0.0 |
65±2.1 |
20±0.7 |
12±2.0 |
|
Saetbyeol |
102**±0.6 |
38±2.0 |
19±1.0 |
15±1.4 |
|
Seolak |
85**±0.0 |
57±1.4 |
21±0.6 |
11±0.5 |
|
Joun |
81**±0.6 |
65±1.5 |
22±0.6 |
10±1.0 |
|
‘D’ |
Keumo |
83*±0.6 |
65±3.8 |
24±3.1 |
11±0.7 |
|
Dasan |
110**±1.2 |
51±2.0 |
23±0.3 |
11±1.2 |
|
Dongan |
92**±0.0 |
63±2.1 |
20±0.9 |
13±1.1 |
|
Saetbyeol |
102**±0.0 |
34*±1.8 |
20±0.4 |
13±0.6 |
|
Seolak |
85**±0.6 |
56±1.9 |
23±2.0 |
11±0.5 |
|
Joun |
79**±0.0 |
61±3.1 |
24±1.9 |
9±0.5 |
|
‘E’ |
Keumo |
81±0.0 |
63±1.0 |
23±1.8 |
9±2.1 |
|
Dasan |
106±0.6 |
49±0.2 |
21±2.2 |
10±1.0 |
|
Dongan |
90±0.0 |
64±2.7 |
20±0.3 |
11±2.1 |
|
Saetbyeol |
94±1.2 |
40±4.5 |
19±1.4 |
14±0.2 |
|
Seolak |
79±0.0 |
55±3.2 |
22±1.8 |
11±2.8 |
|
Joun |
76±0.0 |
63±1.2 |
21±0.3 |
8±1.9 |
Table 10Duncan’s multiple range test for heading delay of treatments.
Table 10
|
Treatment |
Joun |
Seolak |
Dongan |
Keumo |
Saetbyeol |
Dasan |
|
‘A’z)
|
3.5b±0.6 |
7.0a±1.2 |
4.0b±0.0 |
6.0a±1.2 |
ND |
ND |
|
‘B’ |
3.5e±0.6 |
6.0c±0.0 |
4.5d±0.6 |
5.0d±0.0 |
7.5b±0.6 |
11.0a±0.0 |
|
‘C’ |
4.5c±0.6 |
6.0b±0.0 |
2.0e±0.0 |
3.0d±0.0 |
7.5a±0.6 |
5.0c±1.2 |
|
‘D’ |
3.0d±0.0 |
5.5b±0.6 |
2.0e±0.0 |
1.5e±0.6 |
8.0a±1.2 |
4.5c±0.6 |
Table 11Duncan’s multiple range test for heading delay of treatments.
Table 11
|
Cultivar |
Treatment |
|
|
‘A’z)
|
‘B’ |
‘C’ |
‘D’ |
|
Keumo |
6.0a±1.2 |
5.0b±0.0 |
3.0c±0.0 |
1.5d±0.6 |
|
Dongan |
4.0b±0.0 |
4.5a±0.6 |
2.0c±0.0 |
2.0c±0.0 |
|
Seolak |
7.0a±1.2 |
6.0ab±0.0 |
6.0ab±0.0 |
5.5b±0.6 |
|
Joun |
3.5b±0.6 |
3.5b±0.6 |
4.5a±0.6 |
3.0b±0.0 |
|
Saetbyeol |
ND |
7.5a±0.6 |
7.5a±0.6 |
8.0a±1.2 |
|
Dasan |
ND |
11.0a±0.0 |
5.0b±1.2 |
4.5b±0.6 |
References
- Andaya VC, Mackill DJ. 2003. Mapping of QTLs associated with cold tolerance during the vegetative stage in rice. J Exp Bot. 54: 2579-2585.
- Andaya VC, Tai TH. 2006. Fine mapping of the qCTS12 locus, a major QTL for seedling cold tolerance in rice. Theor Appl Genet. 113: 467-475.
- Choi HC, Yea JD, Cho SY, Park RK. 1991. Evaluation of varietal difference in cold tolerance of rice by cold-water irrigation system. Res Rept RDA(R). 33: 10-24.
- Choi HO, Ahn SB, Heu H, Oh YJ, Han SI. 1975. Occurrence, diagnosis of leaf discoloration of Tongil rice variety. Res Rep RDA (Crop). 17: 99-108.
- Choi HO, Lee JH. 1976. Studies on low temperature injury at each growth stage in rice plant. Korea J Crop Sci. 21: 203-210.
- Fairhurst TH, Dobermann A. 2002. Rice in the global food supply. Better Crops Int. 16: 3-6.
- Homma K, Horie T, Shiraiwa T, Sripodok S, Supapoj N. 2004. Delay of heading date as an index of water stress in rainfed rice in mini-watersheds in Northeast Thailand. Field Crops Res. 88: 11-19.
- International Rice Research Institute (IRRI).1979. Report of a rice cold tolerance workshop. Proc of the Rice Cold Tolerance Workshop. IRRI. Suwon, Korea: pp. 139.
- Katsuji K, Masaharu S. 1973. Relationships between the appearance of morphogenetically abnormal spikelets and the stages of panicle development when plants were treats with low temperature in paddy rice. Jpn J Crop Sci. 42: 527-538.
- Kim GS, Sa JG, Huh BL. 1989. Response to low temperature of rice cultivars for mid-northern area at rooting stage after transplanting. J Korean Soc Crop Sci. 34: 170-176.
- Kura-Hotta M, Satoh K, Katoh S. 1987. Relationship between photosynthesis and chlorophyll content during leaf senescence of rice seedlings. Plant Cell Physiol. 28: 1321-1329.
- Lee MH, Park NK, Park SH. 1989. Mechanisms of cold injury and cultural practices for reducing damage of rice. Korea J Crop Sci. 34: 34-44.
- Lyons JM, Graham D, Raison JK. 1979. Low temperature stress in crop plants: the role of the membrane. Academic Press; Elsevier. San Diego, CA: pp. 2.
- Nishiyama I. 1976. Effects of temperature on the vegetaive growth of rice plants. pp. 159-185. The International Rice Research Institute (IRRI).Procedings of the Symposium on climate and rice IRRI. Los Baños, Philippines.
- Oh YJ. 1981. Physiological and ecological studies on the low temperature damages of rice (Oryza sativia L.) Korea J. Crop Sci. 26: 1-31.
- Park IK, Oh CS, Kim DM, Yeo SM, Ahn SN. 2013. QTL mapping of cold tolerance at the seedling stage using introgression lines derived from an intersubspecific cross in rice. Plant Breed Biotech. 1: 1-8.
- RDA.2012. The standard of research analysis and investigation for agricultural science technology. RDA. Suwon, Korea.
- Sthapit BR, Witcombe JR. 1998. Inheritance of tolerance to chilling stress in rice during germination and plumule greening. Crop Sci. 38: 660-665.
- Turner FT, Jund MF. 1994. Assessing the nitrogen requirements of rice crops with a chlorophyll meter. Aust J Exp Agr. 34: 1001-1005.
- Tyubachi T, Asano I, Oikawa T, Miyagi-ken . 2012. The diagnosis of nitrogen nutrition of rice plants (Sasanishiki) using chlorophyll-meter. Jpn J Soil Sci Plant Nutr. 57: 190-193.
- Wu R, Garg A. 2003. Mar;Engineering rice plants with trehalose-producing genes improves tolerance to drought, salt and low temperature. ISB News Report, Plant Research. pp. 5-7.
- Yea JD. 1995. Response of rice varieties to cold water irrigation. Korean J Crop Sci. 40: 203-211.
- Yea JD, Lee LI, Jeong OY, Kim YK. 2008. Status and prospect of rice cold tolerance in Northeast Asia. RDA. Suwon, Korea: pp. 61-98.
- Yoshida Yoshida R, Kanno A, Sato T, Kameya T. 1996. Cool temperature-induced chlorosis in rice plants. I. Relationship between the induction and a disturbance of etioplast development. Plant Physiol. 110: 997-1005.