Abstract
Glutathione S-transferase (GST) genes from transcripts of Vitis flexuosa leaves infected with Elsinoe ampelina were characterized and analyzed for their expression using primers based on specific regions. Comparison of deduced amino acid sequences from GST transcripts of V. flexuosa showed that the score of the deduced amino acid identity ranged from 43.38% (VfGST26625 and VfGST774) to 6.67% (Vf GST13892 and Vf GST774). Primary and secondary structure analysis was performed using the ProtParam and Self-Optimized Prediction Method with Alignment software. A phylogenetic tree was constructed from the GST proteins by the neighbor joining method using MEGA 6.0 to investigate the relationship among Vf GST, VvGST, and At GST proteins. To evaluate the differential expression pattern of GST genes by real-time polymerase chain reaction (PCR), primers specific to unique regions in each gene were obtained by alignment of the sequences. Real-time PCR revealed that GST genes were expressed differentially in the leaves of V. flexuosa infected with Botrytis cinerea, E. ampelina, and Rhizobium vitis. The expression of VfGST26625 was up-regulated, while that of others were down-regulated among five GSTs in all grapevine leaves inoculated with each pathogen. The results provided herein improve our understanding of defense responses to various pathogen attacks in grapevines.
-
Key words: Fungal pathogen, Grapevine, Oxidative stress, Real-time polymerase chain reaction, Rhizobium vitis
INTRODUCTION
Plants contain very efficient enzymatic and non-enzymatic antioxidant defense systems that work in concert to control the cascades of uncontrolled oxidation and protect plant cells from oxidative damage by scavenging reactive oxygen species (
Gill and Tuteja 2010). Plant cells respond to attacks of foreign pathogens by expressing a series of disease resistance-associated genes, which can result in the production of various toxic plant products, including active oxygen species and phytoalexins (
Marrs 1996;
Lamb and Dixon 1997). The increased expression of glutathione
S-transferase (GST) genes following infection by pathogens is an important defense response to pathogen attacks in plants (
Taylor et al. 1990;
Dudler et al. 1991;
Dean et al. 2005).
Plant GSTs are known to function in hydroperoxide detoxification, transporters of anthocyanin, herbicide detoxification, auxin homeostasis, tyrosine metabolism, regulation of apoptosis, and responses to biotic and abiotic stresses (
Dixon et al. 2010;
Gill and Tuteja 2010). GST genes are induced in plants in response to several different stress situations (
Marrs 1996;
Wagner et al. 2002).
GSTs form a large and diverse group of enzymes that catalyze the addition of the tripeptide glutathione to a variety of substrates with electrophilic and hydrophobic compounds (
Pickett and Lu 1989;
Marrs 1996).
McGonigle et al. (2000) identified a GST supergene family with 42 maize and 25 soybean clones. In Arabidopsis, the GST super-family was divided into four distinct isoforms, Tau, Phi, Zeta, and Theta, with lower than 25% amino acid sequence identity (
Wagner et al. 2002).
In a previous study (
Ahn et al. 2014), a group of five GST transcripts showing differential expression in the transcriptome data from
Vitis flexuosa inoculated with
Elsinoe ampelina was obtained. The present study was conducted to compare nucleotide and deduced amino acid sequences and predicted protein structures of GST genes and to analyze their differential expression during infections of
V. flexuosa with
Botrytis cinerea,
E. ampelina, and
Rhizobium vitis.
MATERIALS AND METHODS
Plant materials and pathogen inoculation
A Korean wild grape, healthy V. flexuosa VISKO001, was obtained from the grapevine germplasm collection field of Yeungnam University, Gyeongsan. Cuttings from V. flexuosa VISKO001 were then cultivated in an experimental glasshouse at 25°C under a 16 hours photoperiod. The upper fourth or fifth leaves from the shoot apex of V. flexuosa were used individually for pathogen inoculation, which was accomplished after lightly scratching the epidermis with a pencil tip.
B. cinerea was grown in Petri-dishes at 25°C on potato dextrose agar (0.4% potato starch, 2% dextrose, and 1.5% agar) under 12/12 hours light/dark conditions. Spores of
B. cinerea were collected from the plates, suspended in 0.24% potato dextrose broth at a concentration of 10
6 spores/ml and then centrifuged at 3,000
g for 5 minutes to remove mycelia debris. Leaves were subsequently inoculated by dropping 30 μl of spore suspension onto the wounded areas. Several colonies of
E. ampelina were incubated in a shaking incubator (140 rpm) at 28°C for 10 days, after which the cultures were harvested by centrifugation, ground in a homogenizer in sterile distilled water, poured onto V-8 juice agar medium (20% V-8 juice, 2% agar) and incubated at 28°C under a near ultraviolet lamp for 2 days to produce spores of the pathogen (
Yun et al. 2003). Spores of
E. ampelina were collected by scraping-off of plates with sterile distilled water. The concentration was then adjusted to 10
5 spores/ml and sprayed onto leaves, after which a single colony of bacteria was placed in YEP medium (0.1% yeast extract, 0.5% beef extract, 0.5% peptone, 0.5% sucrose, 0.05% MgSO
4, pH 7.2) and cultivated at 28°C in a shaking incubator, after which it was spun down by centrifugation and resuspended with sterile water.
R. vitis cell suspension (30 μl) was dropped onto the wounded portion of the leaves.
Leaves inoculated with the pathogens were placed on two layers of moist paper towel, then incubated in a closed box in a dark, moist chamber (100% relative humidity) at 25°C or 28°C for 2 days. Five leaves were used for each treatment, and the experiment was repeated twice. Controls were harvested from water-treated leaves under the same conditions. Leaves were harvested at the indicated time points (0, 1, 6, 12, 24, and 48 hours) after inoculation, immediately frozen in liquid nitrogen, and then stored at − 80°C for future use.
RNA isolation and sequence analysis
Total RNA was extracted from grapevine leaves using the pine tree method, with slight modification (
Chang et al. 1993). RNA was then measured based on the absorbance at 230, 260, and 280 nm using a Nano Drop spectrophotometer (ND-1000; Nano Drop Technologies Inc., Wilmington, DE, USA), after which first-strand cDNA was synthesized from the total RNA (500 ng) using a GoScript
TM Reverse Transcription System (Promega, Madison, WI, USA) and subsequently used as a template for polymerase chain reaction (PCR). Nucleotide sequences were then translated using the program hosted by the ExPASy Proteomics Server (
http://au.expasy.org). Pairwise comparisons and multiple alignments of nucleotide and deduced amino acid sequences were performed using ClustalX program (
Thompson et al. 1997). A phylogenetic tree was constructed by the neighbor-joining method using Mega 6.0 (
Tamura et al. 2013). Human GST amino acid sequence was used as the outgroup.
Real-time PCR was performed using a C1000
TM Thermal Cycler (CFX96
TM Real-Time System; BioRad, Hercules, CA, USA) with SYBR Premix Ex (SYBR Premix Ex Taq; TaKaRa Bio Inc., Osaka, Japan) as the fluorescent dye. Amplification was conducted by subjecting the samples to one cycle of 95°C for 30 seconds, followed by 40 cycles of 95°C for 5 seconds and 60°C for 30 seconds. Transcript levels were calculated using the standard-curve method and normalized against the grapevine beta-actin gene (AB372563) as an internal control, after which melting curves of the amplified products were recorded. Untreated leaves (at time zero) were tested as the reference sample. For each gene, the reference sample was defined as the 1× expression level, after which the results were expressed as the fold increase in mRNA over the reference sample. All reactions were performed in triplicate to ensure consistency of the results. Five of the GST differentially expressed genes identified upon transcriptome analysis of
V. flexuosa inoculated with
E. ampelina were selected (
Ahn et al. 2014), and specific primers for real-time PCR were designed by alignment of their nucleotide sequences (
Table 1). In order to validate the pathogen infection, the pathogenesis-related 1 (PR1) gene was used as a marker gene to test their expression in the grapevine leaves inoculated with three pathogens. The deduced amino acid sequences of GST genes between
V. flexuosa transcripts were compared using the CLC Main Workbench (ver. 4.0; CLC Bio, Aarhus, Denmark).
RESULTS
Five of the 17 GST transcripts showing more than 500 read counts identified upon transcriptome analysis of
V. flexuosa inoculated with
E. ampelina (
Ahn et al. 2014) were selected for characterization of their structures and evaluation of their differential expression against pathogen attacks. In this study, these genes were designated
VfGST26625 (
V. flexuosa GST, Locus 26625),
VfGST13892 (
V. flexuosa GST, Locus 13892),
VfGST29294 (
V. flexuosa GST, Locus 29294),
VfGST3450 (
V. flexuosa GST, Locus 3450), and
VfGST774 (
V. flexuosa GST, Locus 774), and deposited in the National Agricultural Biotechnology Information Center, Rural Development Administration, Korea under accession numbers NS-0804-000001, NS-0805-000001, NS-0806-000001, NS-0807-000001, and NS-0808-000001, respectively.
The deduced amino acid sequences of GST genes in
V. vinifera and
V. flexuosa transcripts are shown in
Fig. 1. The deduced amino acid sequences of GST genes showed homologies ranging from 43.38% (
VfGST26625 and
VfGST774) to 6.67% (
VfGST13892 and
VfGST774) (
Table 2). Among the six GST transcripts,
VfGST3450 and
VfGST26625 showed 22.68% and 19.81% similarity with those of
VfGST774 and
VfGST3450, respectively, in the deduced amino acid sequences.
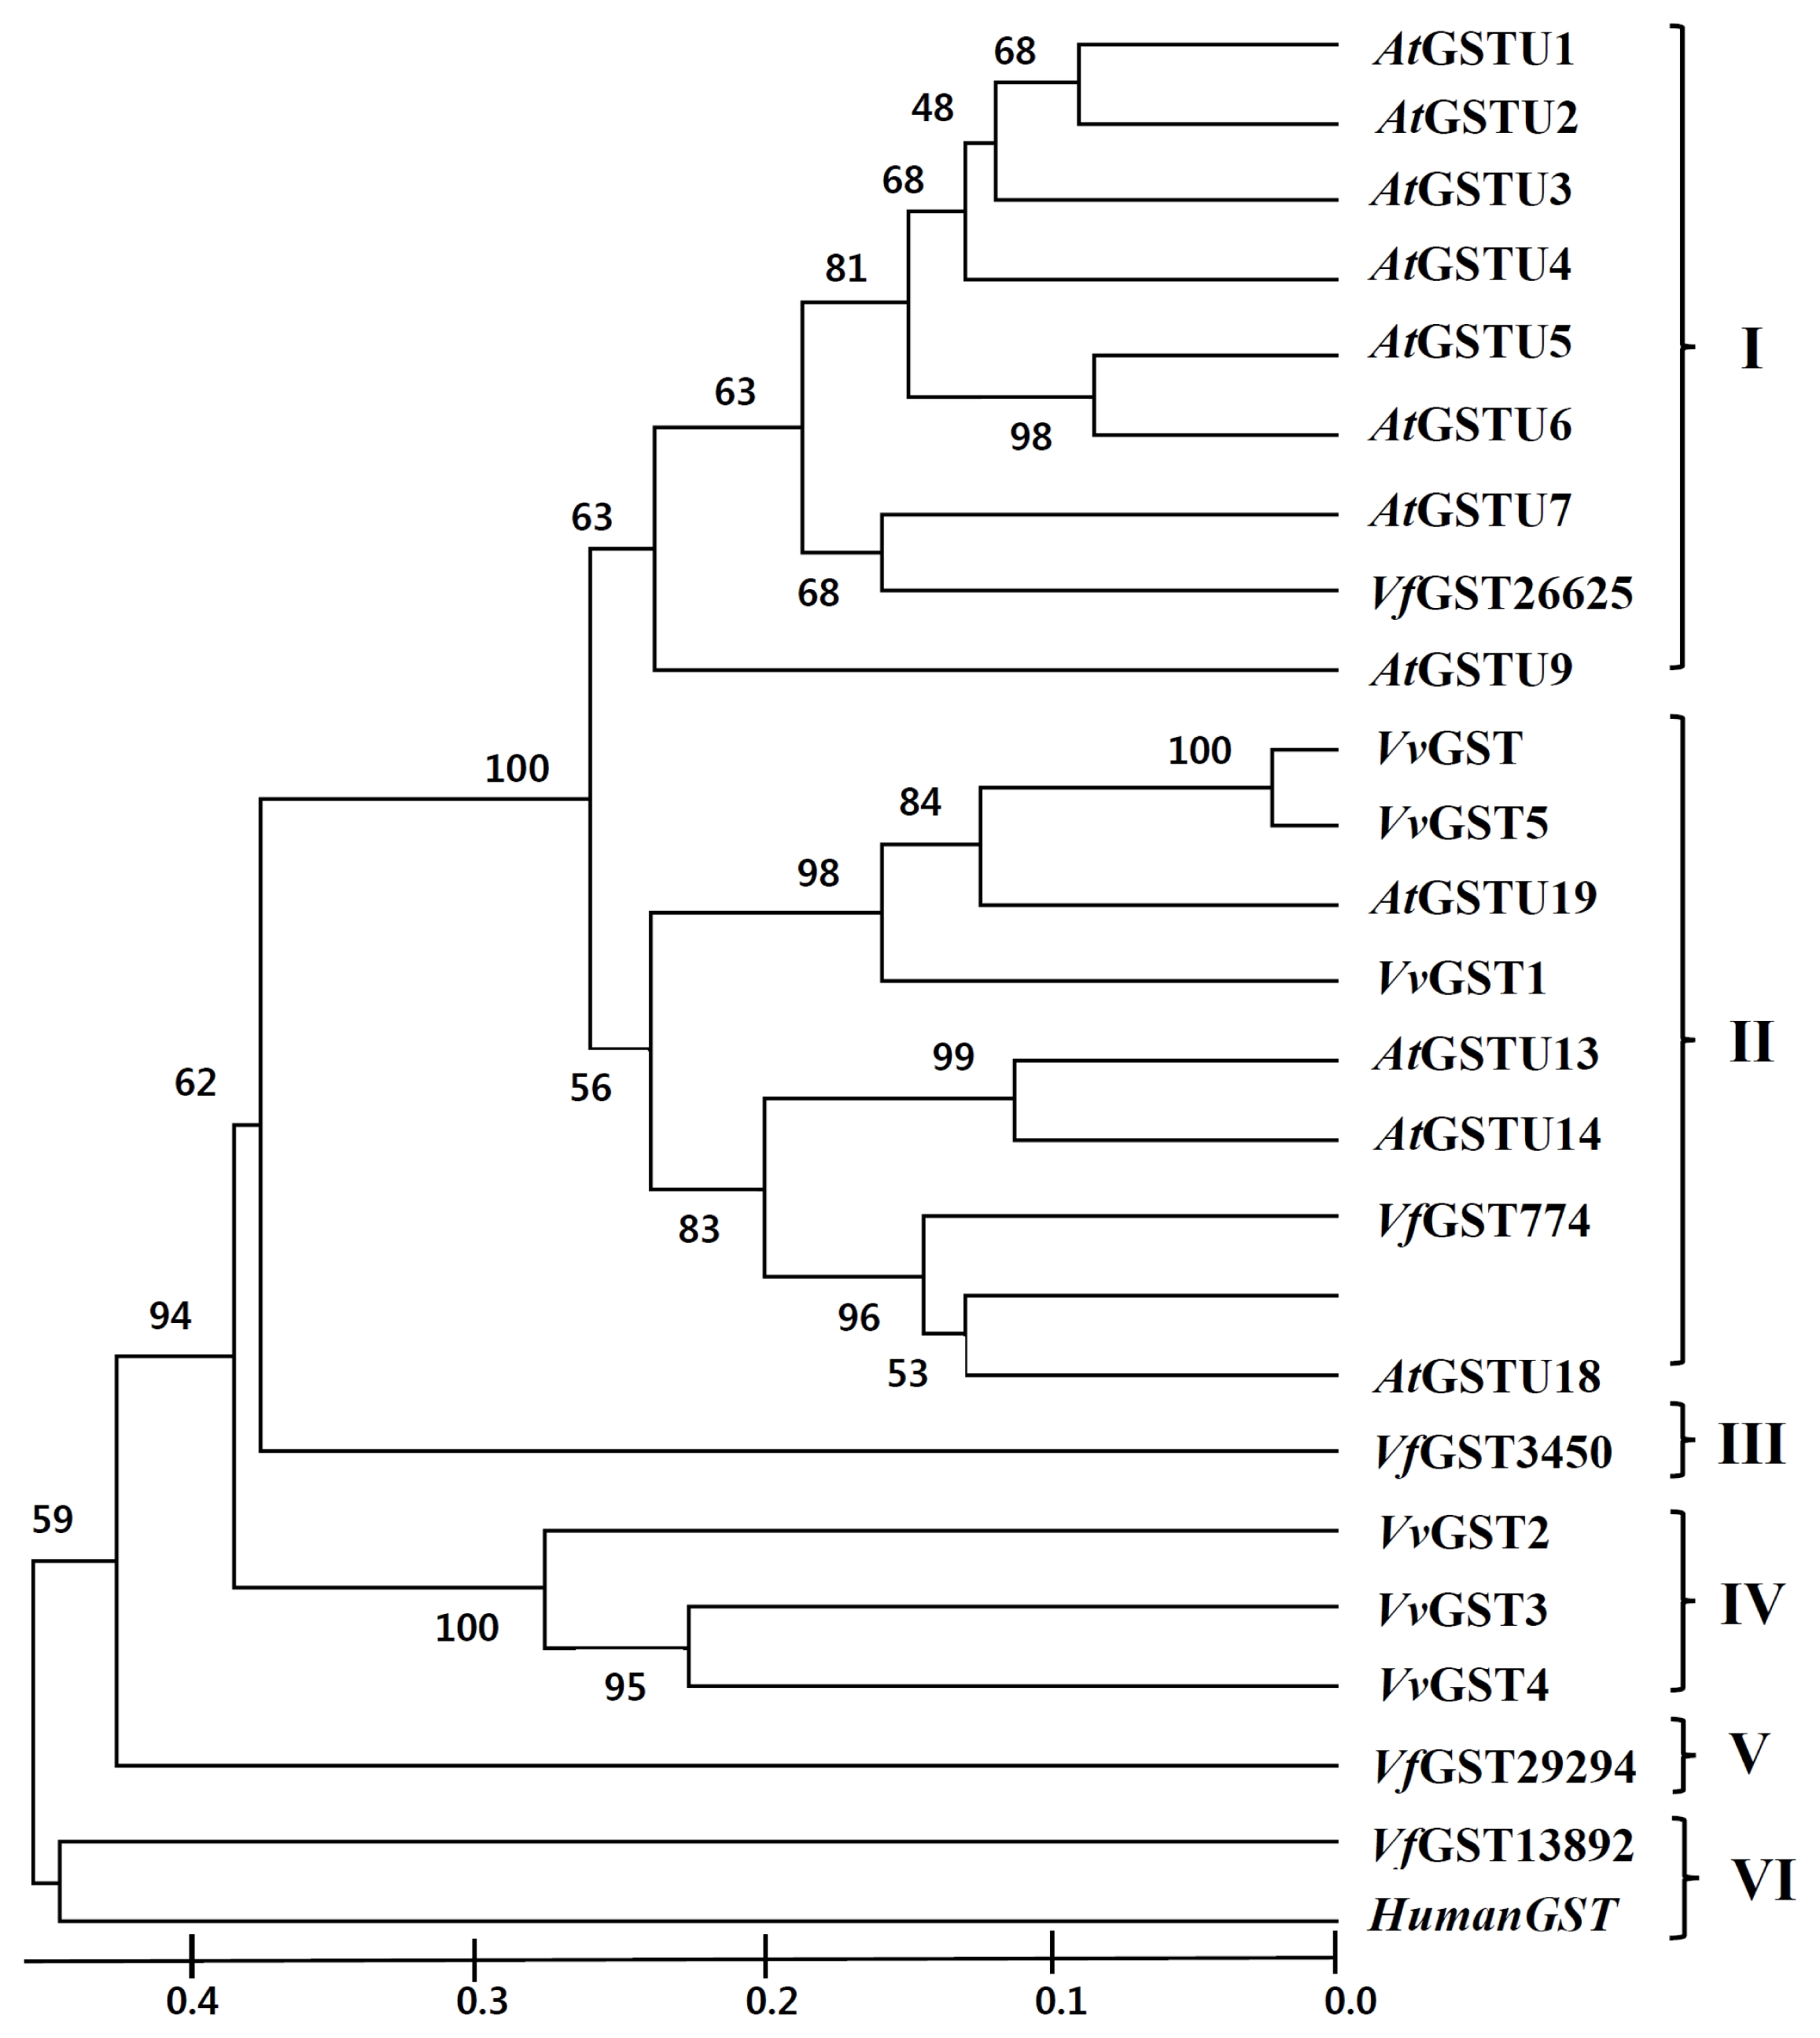
Based on pairwise comparisons and multiple alignments of nucleotide and deduced amino acid sequences, a phylogenetic tree of GST genes from
V. flexuosa,
V. vinifera, and
Arabidopsis was constructed by the Neighbor-joining method using Mega 6.0 (
Fig. 2). GST genes were clustered into six main sub-families designated as classes I, II, III, IV, V, and VI. Class I is primarily composed of
Arabidopsis GSTs except for
VfGST26625, while class II is composed of
Arabidopsis GST,
V. flexuosa GST, and
V. vinifera GST members.
VfGST3450 and
VfGST29294 were divided into class III and class V, respectively.
Information regarding all six GST genes based on the primary structure is presented in
Table 3. The results showed that the size of the six GSTs varied from 138 to 245 amino acids (88,669.9 to 162,499.1 Da). The predicted isoelectric points (pIs) ranged from 4.94 to 5.03 and the instability index (II) ranged from 34.82 to 64.19. Results of secondary structure prediction using SOPMA (
Table 4) revealed that random coils ranged from 26.48% to 37.96% and alpha helices ranged from 31.82% to 45.69%.
Specific primers of GST genes designed based on alignment of nucleotide sequences from
V. flexuosa transcripts were used to detect differential expression by real-time PCR of grapevine leaves inoculated with the three different pathogens. The expressions of GSTs were induced differentially and depended on three inoculated pathogens in
V. flexuosa (
Fig. 3). The expression of
VfGST26625 was up-regulated, while that of the other genes was down-regulated in all grapevine leaves inoculated with each pathogen. The expression kinetics from the real-time PCR results were similar to those of previous transcripts analyses (
Ahn et al. 2014)
In leaves inoculated with
B. cinerea, expression of the
VfGST13892,
VfGST29294,
VfGST3450, and
VfGST774 genes was down-regulated relative to the control, while
VfGST26625 exhibited delayed and sustained up-regulation of transcription (
Fig. 3A). Expression of the
VfGST13892 and
VfGST774 genes decreased 1 hour after inoculation with
B. cinerea, increased at 12 hours and then declined again at 48 hours.
The pattern of up-regulation for
VfGST26625 in leaves inoculated with
E. ampelina was similar to that of
B. cinerea-inoculated leaves in which the transcription showed peaks at 6 hours and 24 hours after inoculation of the pathogens. Expression of the
VfGST13892 and
VfGST3450 genes gradually decreased 6 hours after inoculation, increased at 12 hours and then declined again. Four GST genes,
VfGST13892,
VfGST29294,
VfGST3450, and
VfGST774, were down-regulated compared to the control leaves (
Fig. 3B).
The expression pattern of
VfGST26625 was up-regulated, peaking at 12 hours, in leaves inoculated with
R. vitis, while it peaked at 24 hours in leaves inoculated with
B. cinerea and
E. ampelina (
Fig. 3C). Transcripts of the
VfGST29294 and
VfGST3450 genes decreased 6 h after inoculation with
R. vitis, increased at 12 hours and then declined in the grapevine leaves. Expression of the
VfGST13892 gene was down-regulated at 1 hour, then increased until 6 hours after inoculation with pathogen, after which it declined again.
The expression of PR1 gene, which was used as a marker gene for pathogen infection, was tested in the grapevine leaves inoculated with pathogens (
Fig. 4). PR1 gene was induced as early as 1 hour and kept induced up to 24 to 48 hours after inoculation of three pathogens in grapevine leaves.
DISCUSSION
We characterized the structures of GSTs of V. flexuosa and investigated their expressions in response to infection with B. cinerea, E. ampelina, and R. vitis in grapevines. DNA sequences of all six genes from the V. flexuosa transcriptome data and the V. vinifera National Center for Biotechnology Information database were identified upon sequences analysis.
Studies on physicochemical characterization provide information about the properties such as molecular weight, pI, II, aliphatic index (AI), and grand average of hydropathicity (GRAVY) which are essential and vital in providing data about the proteins (
Pradeep et al. 2012).
Guruprasad et al. (1990) suggested that the stability and instability of proteins is determined by the order of certain amino acids in its sequence. In addition, the (II of a known protein could be used to predict whether a given protein is stable (II < 40) or unstable (II > 40). The AI is defined as the relative volume of a protein occupied by aliphatic residue side chain (alanine, valine, leucine, and isoleucine) and regarded as a positive factor for the increase of thermal stability (
Gasteiger et al. 2005). The GRAVY value for a protein is calculated as the sum of hydropathy values, divided by the number of residues in the amino acids sequence (
Kyte and Doolittle 1982). Random coils influence flexibility and stability of the protein structure and dehydration response against water stress (
Qu et al. 1998;
Buxbaum 2007). In this study, SOPMA predicted that all the GSTs contain large percentage (27%–38%) of random coils and the least conformation was of β-turns (less than 10%).
Plant GSTs are induced in response to pathogen attacks, heavy metals, and oxidative stress to protect cellular components from damage (
Levine et al. 1994;
Ulmasov et al. 1995;
Marrs 1996;
Moons 2003). It has been postulated that the antioxidative activity of GSTs plays a role in the production of various toxic plant products, such as generation of active oxygen species, or in limiting the extent of cell death during the HR (
Dudler et al. 1991;
Alvarez et al. 1998). We studied the expression of five GST gens and PR1 gene in
V. flexuosa grape leaves inoculated with
B. cinerea,
E. ampelina, and
R. vitis. The results of this study showed that the five GSTs were differentially expressed and their expression kinetics were similar to those observed in previous transcripts analyses.
GSTs have been proposed to play a variety of roles by altering their expression in the host responses to pathogen attacks.
Prp1-1 was induced 2 hours after inoculation with
Phytophthora infestans, reaching their peak values at 48 hours and 56 hours after inoculation in potato (
Hahn and Strittmatter 1994). In
Arabidopsis, GST genes exhibit a wide range of responses to pathogen infection, hormonal treatment of jasmonate, salicylic acid and ethylene, and oxidative stress (
Wagner et al. 2002).
Dean et al. (2005) first showed that plant GST plays a role in susceptibility to fungal infection. Specifically, they reported that four GST genes were amplified from
Nicotiana benthamiana leaves infected with
Colletotrichum destructivum via several responses to fungal infection, and at least one GST gene plays a key role in disease development. There is also evidence that GST acts as a negative regulator of defense response (
Hernández et al. 2009).
It was reported that the expression of defense-related genes was induced by inoculation with various pathogens in grapevines (
Bézier et al. 2002;
Robert et al. 2002;
Kortekamp 2006). Differential expression of chitinase genes after inoculation of grape leaves with
Botrytis cinerea and
Pseudomonas syringae pv.
pisi has been reported (
Robert et al. 2002).
Thomma et al. (2001) reported that the activation pattern of synthesis of defense-related compounds was different dependently on the type of pathogens in
Arabidopsis.
Chong et al. (2008) showed that defense and signaling genes are differentially regulated by different secondary messengers and types of microorganisms in
V. vinifera.
In this study, the molecular structure of all five VfGST genes was analyzed based on their predicted amino acid sequences in V. flexuosa. Five GST genes with different nucleotide sequences showed differential expression in response to three different pathogens in V. flexuosa. Although GSTs were reportedly induced in plants infected with pathogens, several of their transcripts were down-regulated in V. flexuosa infected with two fungal and one bacterial pathogen. These findings suggest that all tested VfGST genes might play controversial roles in defense response pathways against pathogen infection in grapevines. Overall, the results presented herein provide information that will be useful for further investigations of the mode of action at the molecular level and analysis of differential expression patterns of GST genes in defense-elated responses under various pathogen infections in grapevines.
ACKNOWLEDGEMENTS
This work was supported by the Agricultural R&D (Grant no. PJ011631), Rural Development Administration, Republic of Korea.
Fig. 1
Multiple amino acid sequence alignment of Vitis flexuosa glutathione S-transferase (GST) transcripts using ClustalX. Sequences were independently aligned using ClustalX program, with the following parameters: Pairwise alignment was set to Blosum 30 protein weight matrix (gap open penalty: 10, gap extension penalty: 0.10, and multiple alignment was set to Blosum series (gap open penalty: 10, gap extension penalty: 0.05). GST proteins and accession numbers: VvGST (AF501625.1), Vf GST26625 (NS-0804-000001), Vf GST13892 (NS-0805-000001), Vf GST29294 (NS-0806-000001), Vf GST3450 (NS-0807-000001), and Vf GST774 (NS-0808-000001).
Vv: Vitis vinifera, Vf: Vitis flexuosa.
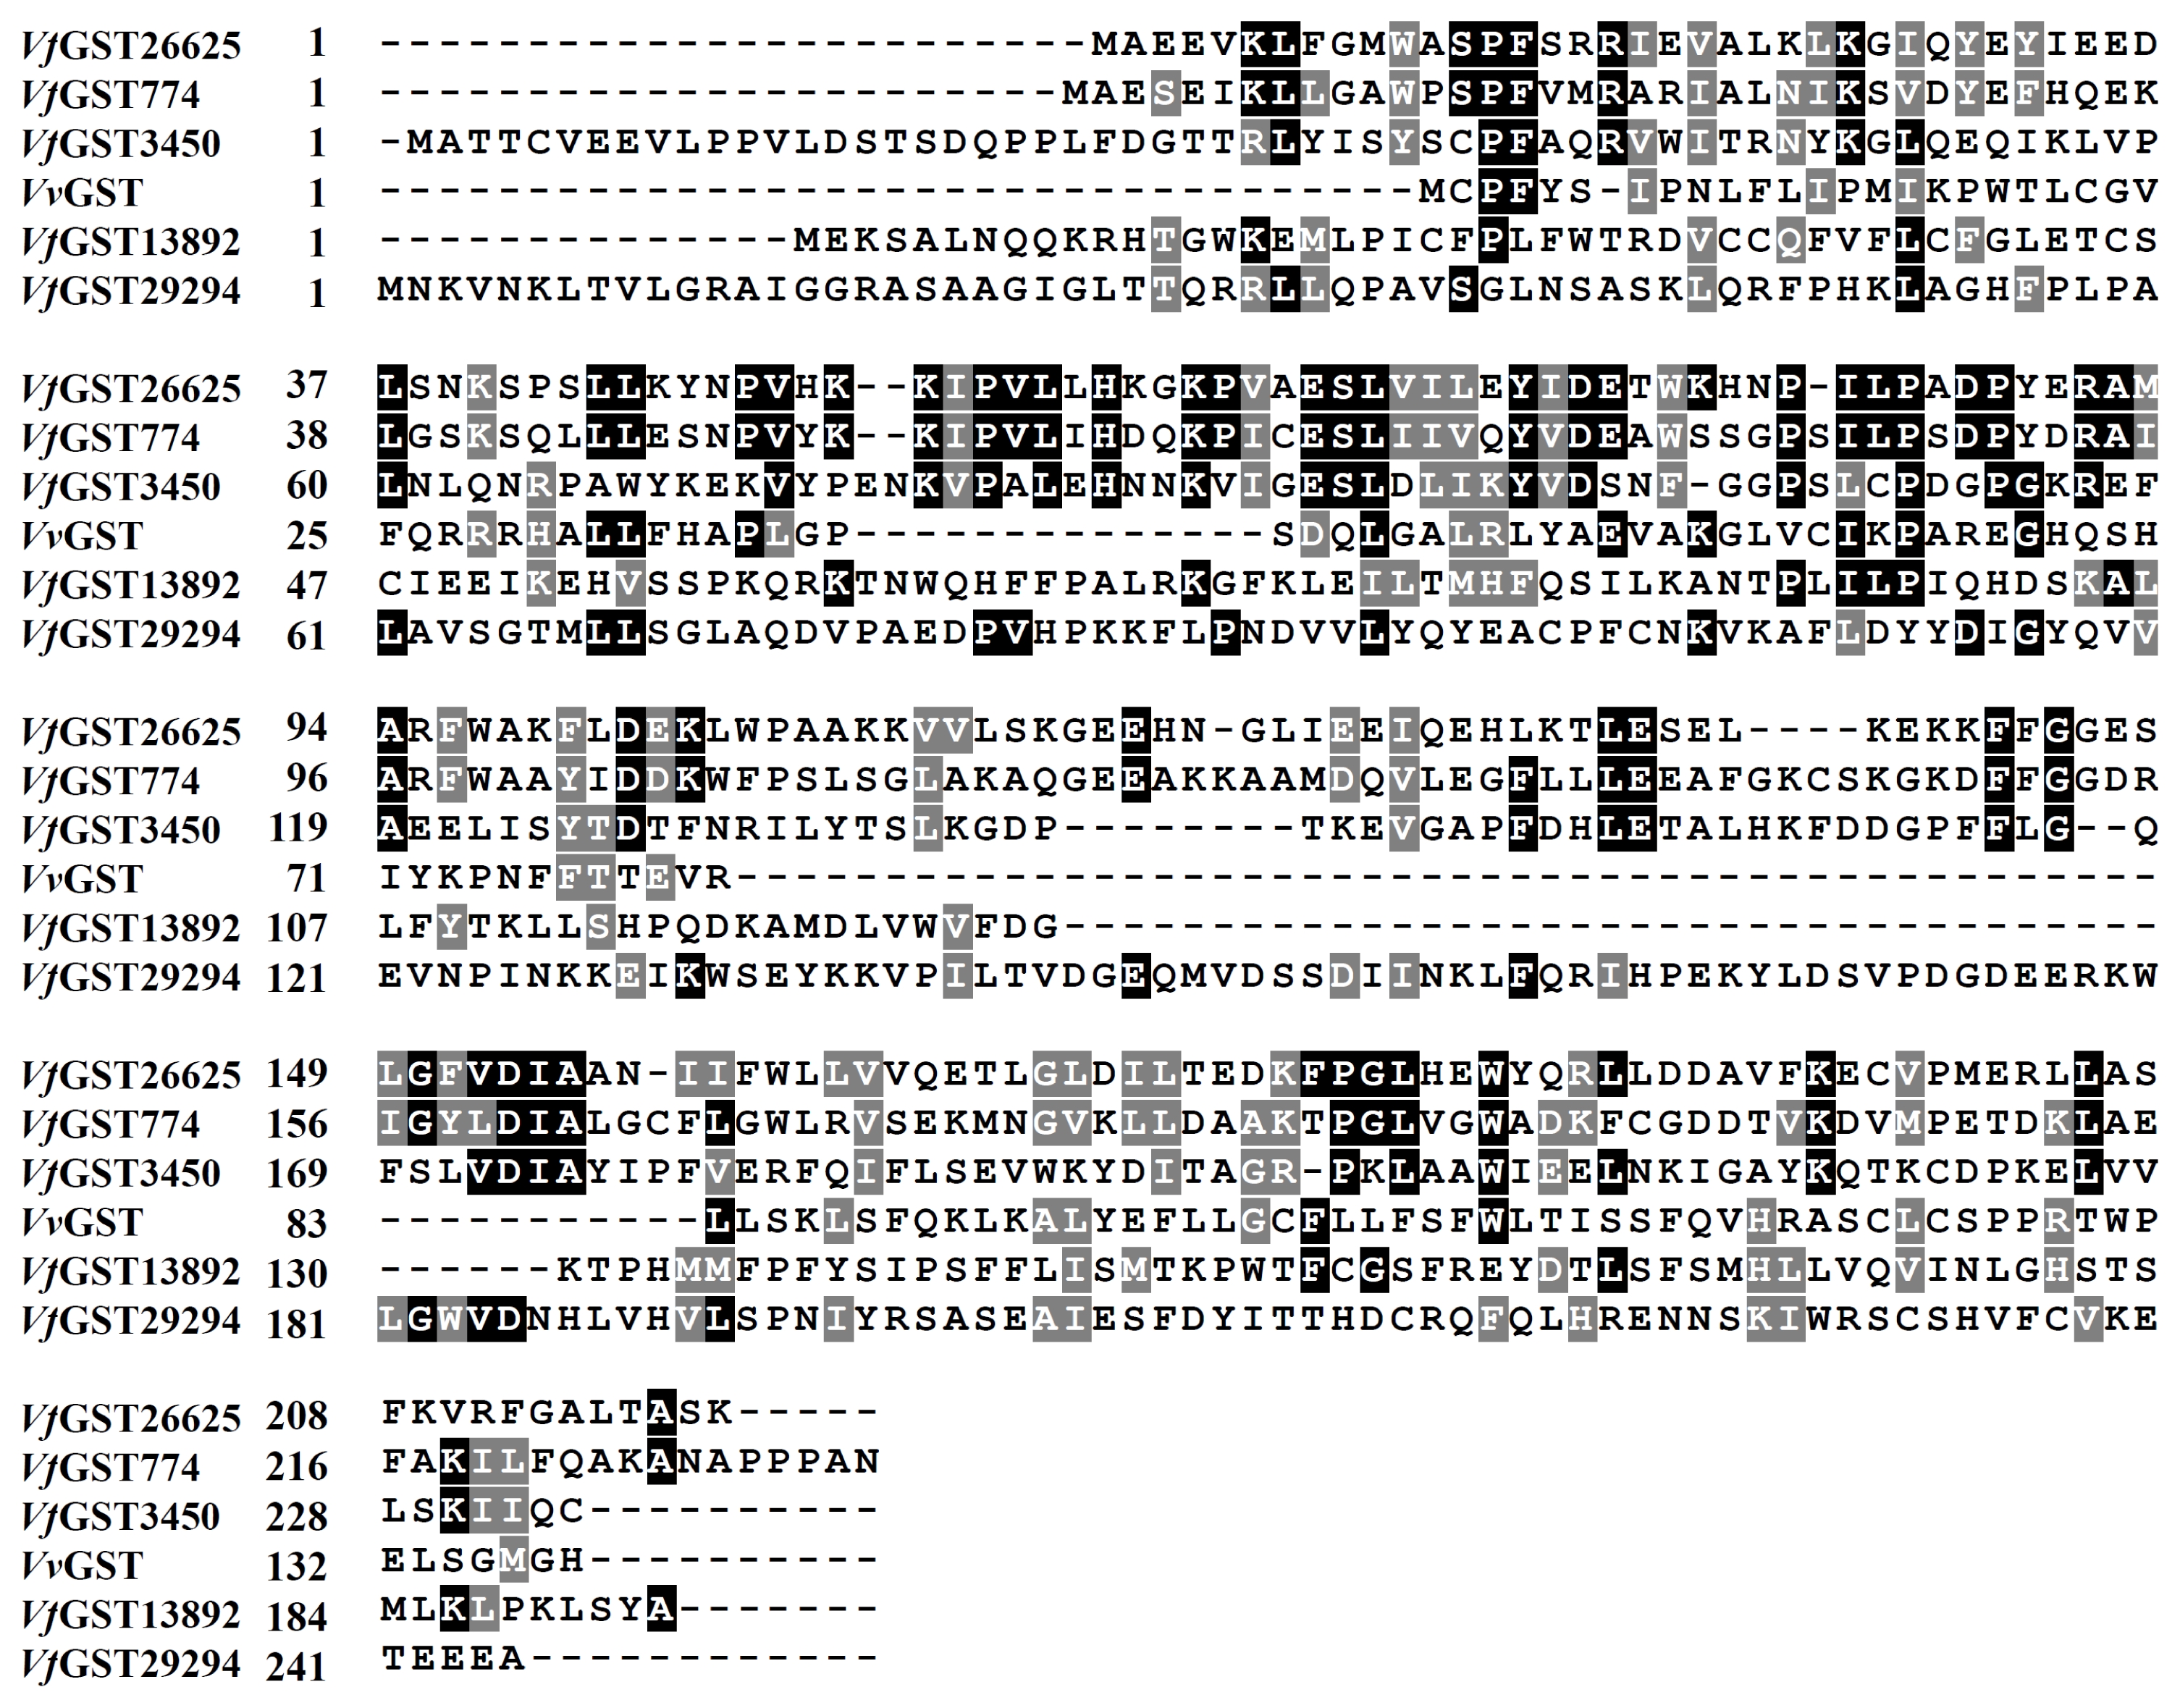
Fig. 2
Phylogenetic analysis of glutathione
S-transferases (GSTs) from
Arabidopsis thaliana,
Vitis vinifera, and
V. flexuosa. Phylogeny was inferred using MEGA 6 program (
Tamura et al. 2013) with the following parameters: Neighbor-Joining method; Bootstrap with 1,000 replicates. Human GST was used as the outgroup.
AtGSTU:
A. thaliana GST TAU (
Wagner et al. 2002),
VvGST:
V. vinifera GST,
VvGST (AF501625.1),
VvGST1 (AY156048.1),
VvGST2 (EF088687.1),
VvGST3 (EF469244.1),
VvGST4 (AY971515.1),
VvGST5 (EF140721.1),
Vf GST:
V. flexuosa GST,
Vf GST26625 (NS-0804-000001),
Vf GST13892 (NS-0805-000001),
Vf GST29294 (NS-0806-000001),
Vf GST3450 (NS-0807-000001), and
Vf GST774 (NS-0808-000001). HumanGST: Human GST (J03746.1).

Fig. 3Expression of glutathione S-transferase genes by quantitative real-time polymerase chain analysis analysis of Vitis flexuosa leaves inoculated with pathogens, Botrytis cinerea (A), Elsinoe ampelina (B), and Rhizobium vitis (C). Transcript levels were calculated using the standard curve method from triplicate data with the grapevine actin gene as an internal control and non-treated leaves (at time zero) as a reference. The results represent the mean fold increase in mRNA over non-treated leaves relative to the 1× expression level. The results are the means of triplicate data from three experiments. Bars indicate the standard deviation.
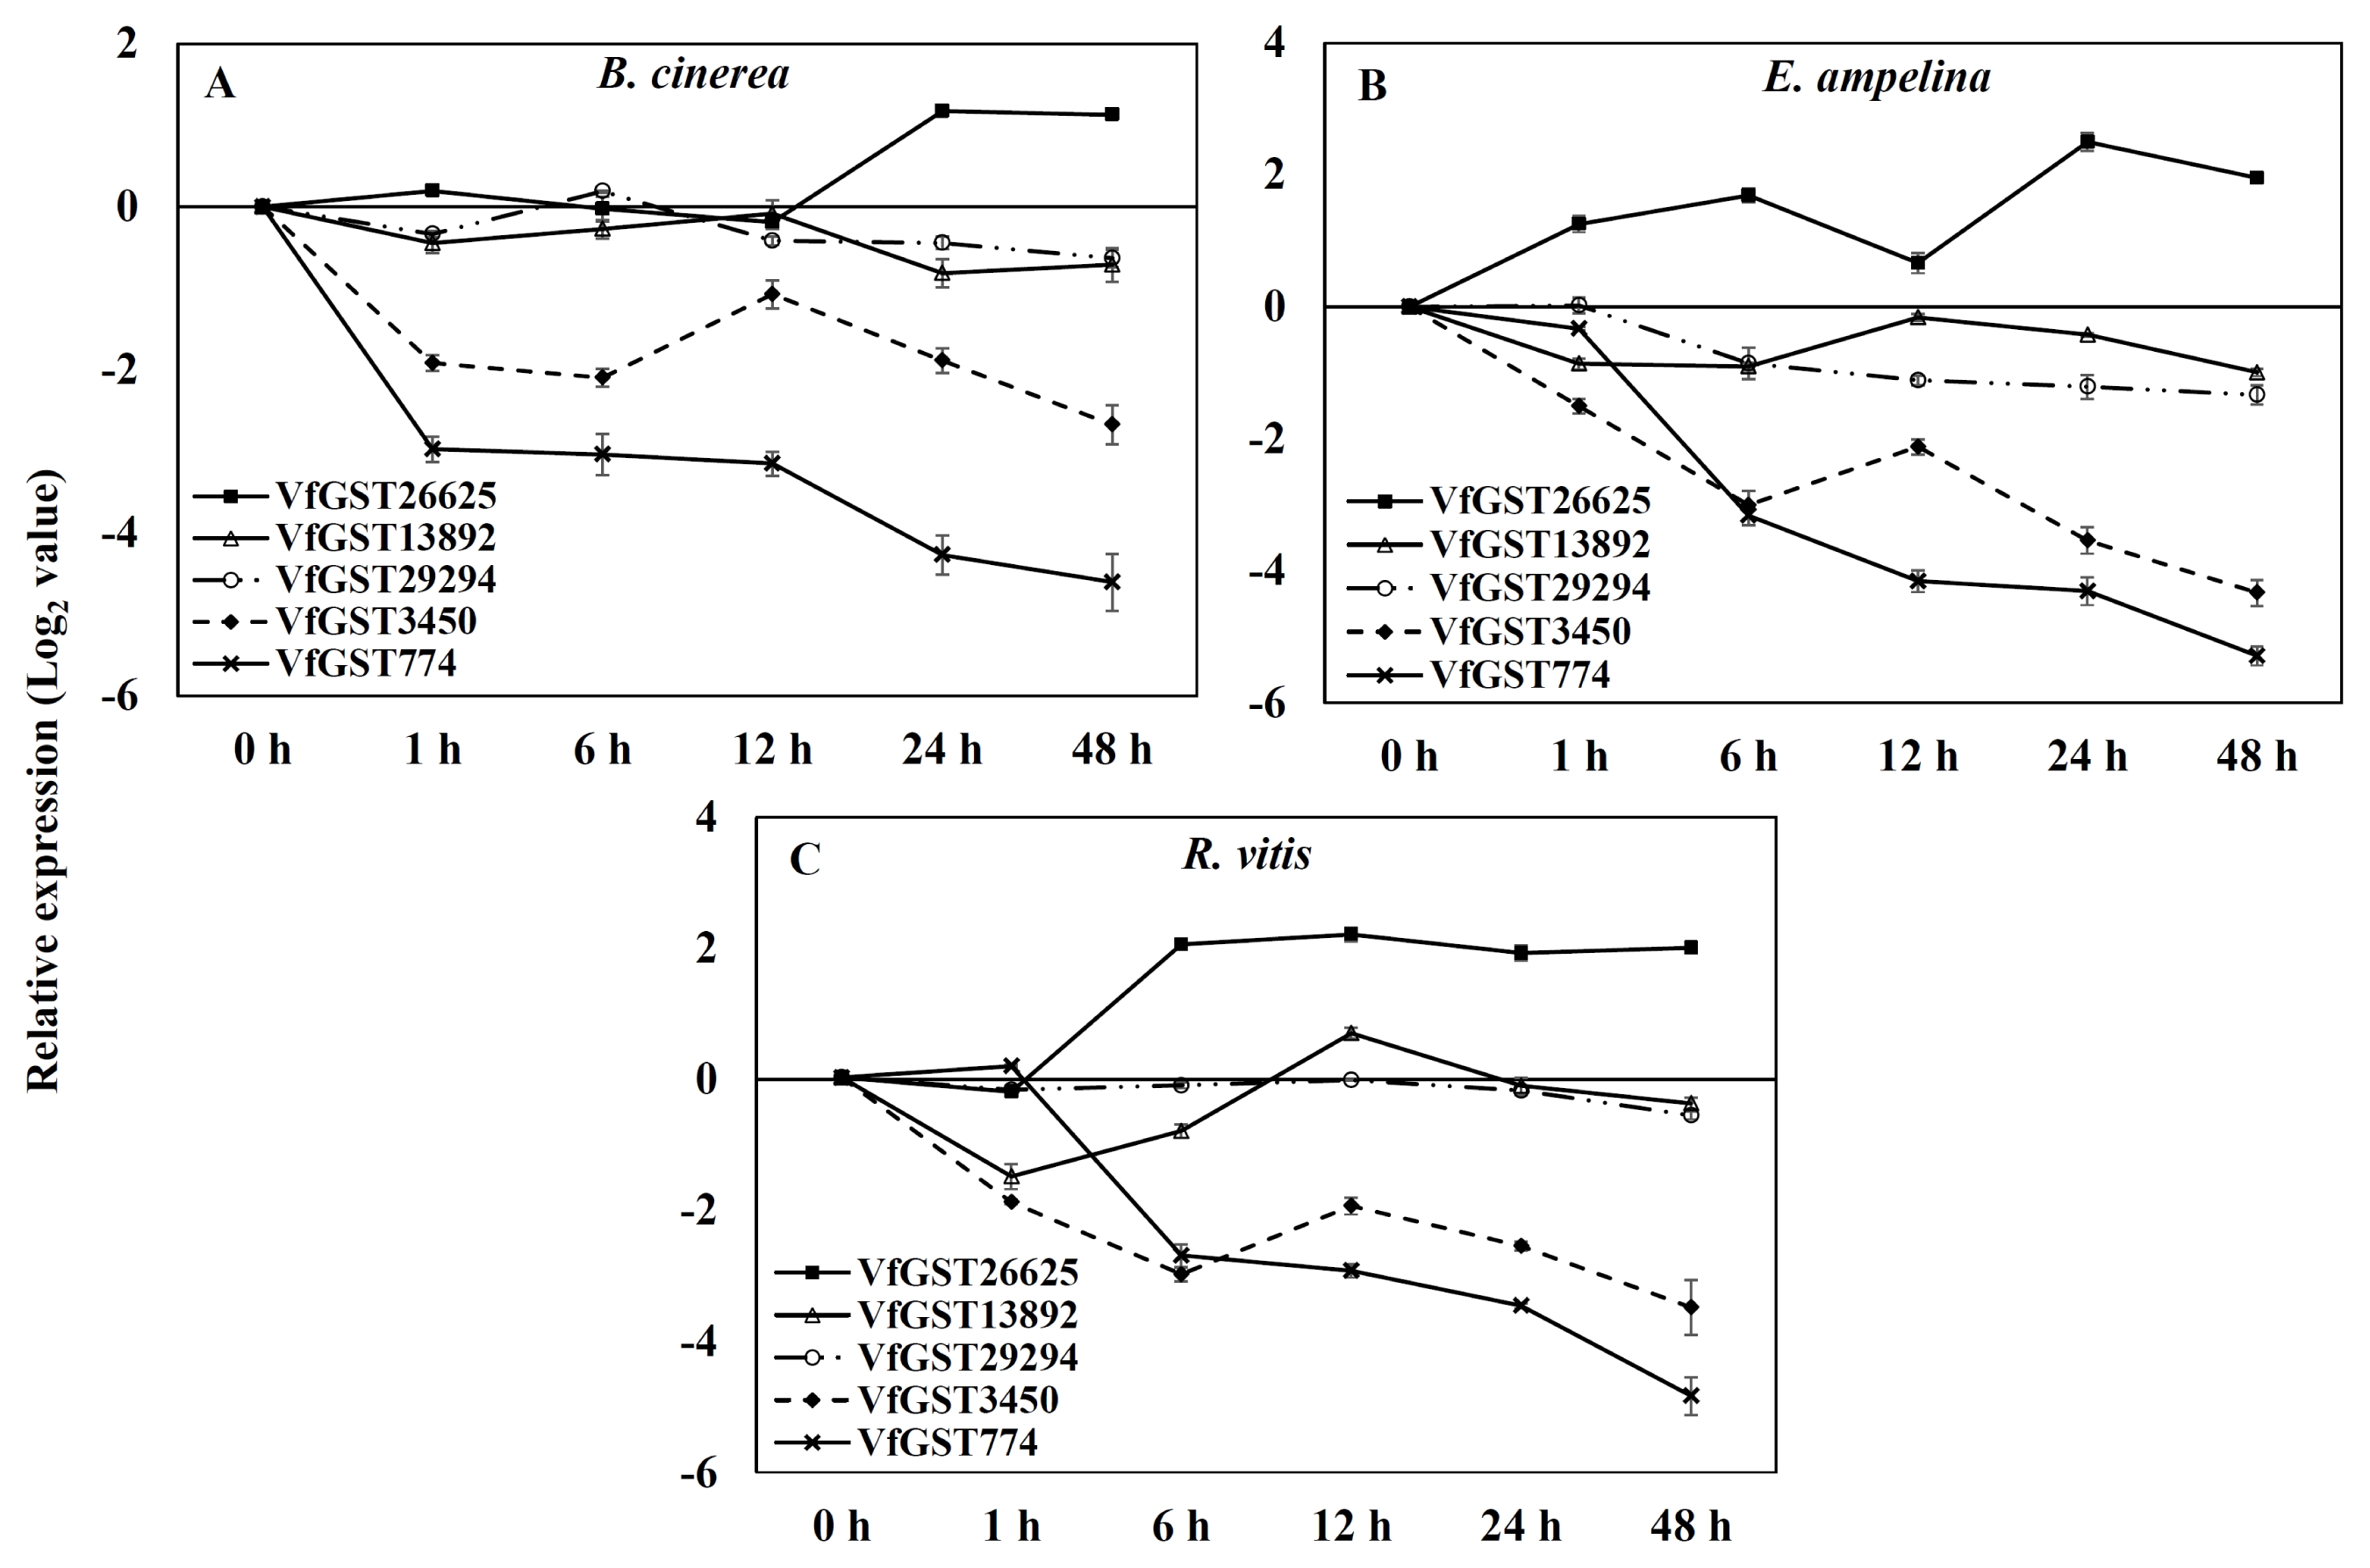
Fig. 4Expression of pathogenesis-related protein 1 gene by quantitative real-time polymerase chain reaction analysis of Vitis flexuosa leaves inoculated with three pathogens. Transcript levels were calculated using the standard curve method from triplicate data with the grapevine actin gene as an internal control and non-treated leaves (at time zero) as a reference. The results represent the mean fold increase in mRNA over non-treated leaves relative to the 1× expression level. The results are the means of triplicate data from three experiments. Bars indicate the standard deviation. B. cinerea: Botrytis cinerea, E. ampelina: Elsinoe ampelina, R. vitis: Rhizobium vitis.
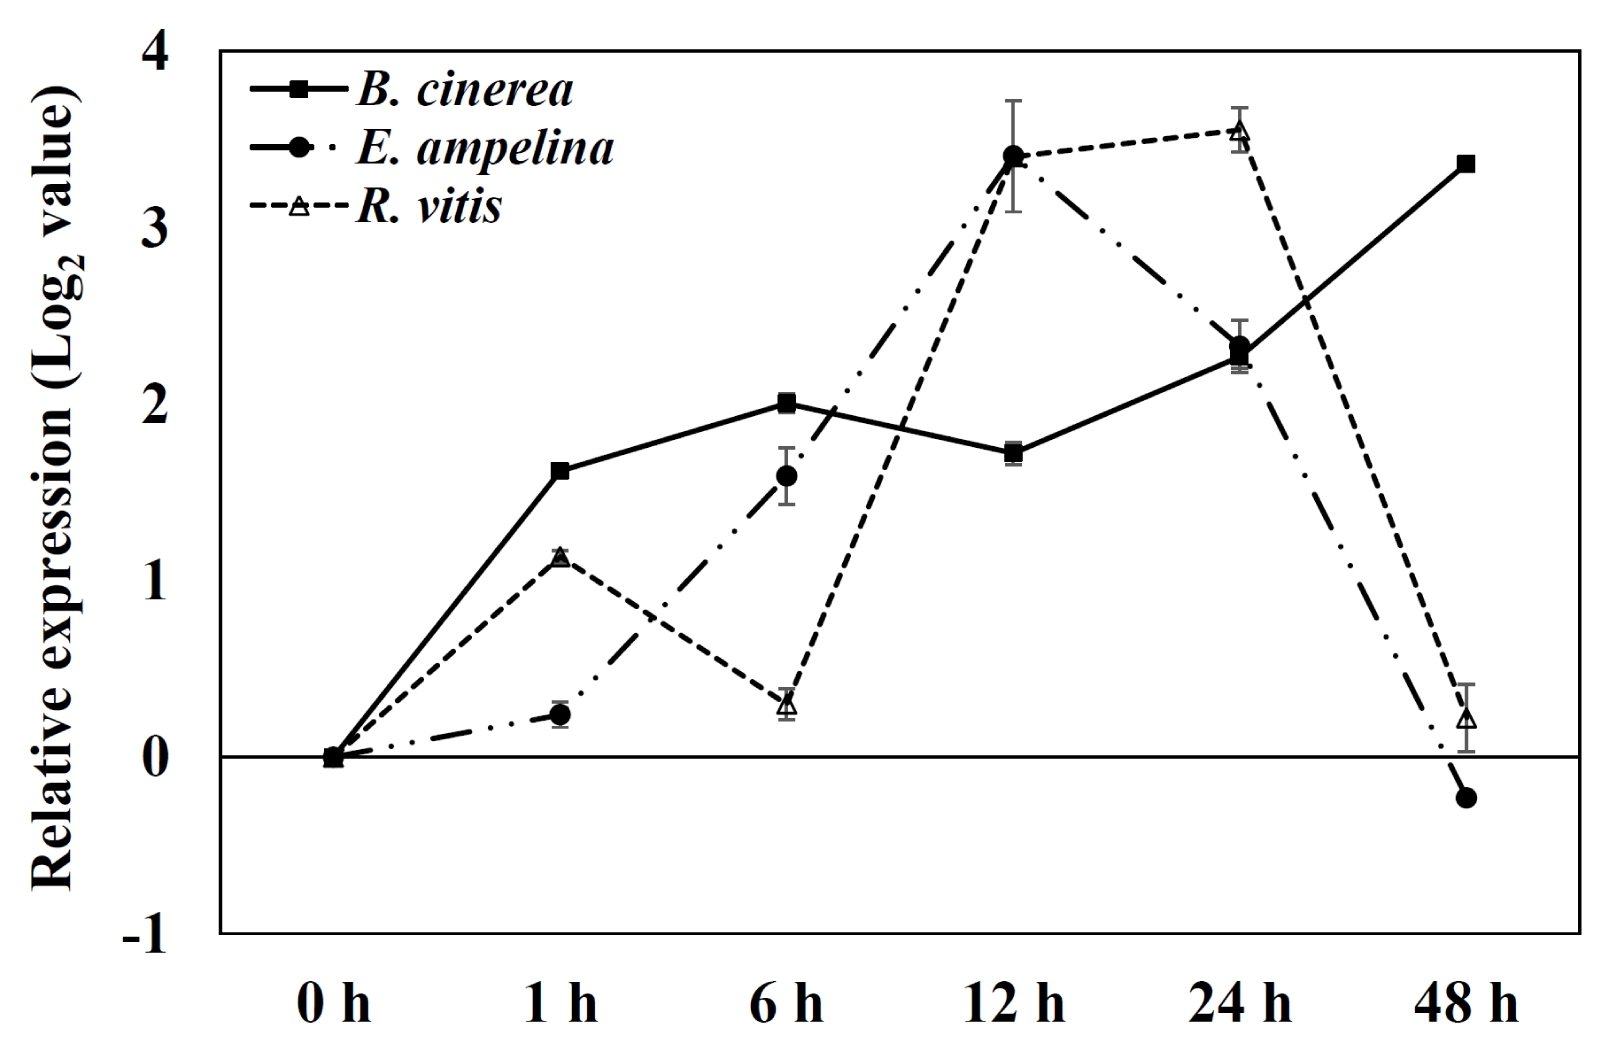
Table 1NCBI gene accession numbers or NABIC IDs and sequences of gene primers used for quantitative real-time PCR analysis
*.
Table 1
|
Name |
Accession no. or NABIC ID |
Primer sequences |
|
Glutathione-S-transferase tau 7 (Locus 26625-VfGST26625) |
NS-0804-000001 |
5′-CGGATTGCATGAATGGTATCAA-3′
5′-CCGAACTTTGAAAGAGGCAAGA-3′ |
|
Glutathione-S-transferase tau 19 (Locus 13892-VfGST13892) |
NS-0805-000001 |
5′-AAGTGATCAACTTGGGGCACTC-3′
5′-GTTTGTGAATGTGGCTCTGGTG-3′ |
|
Glutathione-S-transferase family protein (Locus 29294-VfGST29294) |
NS-0806-000001 |
5′-GAGACATGGTGGAACACACTGG-3′
5′-GACGACGGCTCTACACCTTGAT-3′ |
|
Glutathione-S-transferase family protein (Locus 3450-VfGST3450) |
NS-0807-000001 |
5′-AGACAGCAGACAGCAGACATGG-3′
5′-GCCATCAAAGAGAGGAGGTTGA-3′ |
|
Glutathione-S-transferase family protein (Locus 774-VfGST774) |
NS-0808-000001 |
5′-CTTGAAGGGTTCCTGTTGTTGG-3′
5′-GCAACCCAAAGCAATATCAAGG-3′ |
|
Beta-actin |
AB372563 |
5′-ACGAGAAATCGTGAGGGATG-3′
5′-ATTCTGCCTTTGCAATCCAC-3′ |
Table 2Identity of amino acids deduced from alignment of GST genes of
Vitis flexuosa transcripts. GST proteins and accession numbers
*.
Table 2
|
Gene |
VvGST |
Vf GST26625 |
Vf GST13892 |
Vf GST29294 |
Vf GST3450 |
Vf GST774 |
|
VvGST |
|
9.30 |
11.59 |
13.14 |
13.43 |
11.36 |
|
Vf GST26625 |
9.30 |
|
7.39 |
9.81 |
19.81 |
43.38 |
|
Vf GST13892 |
11.59 |
7.39 |
|
7.33 |
10.05 |
6.67 |
|
Vf GST29294 |
13.14 |
9.81 |
11.59 |
|
8.66 |
8.64 |
|
Vf GST3450 |
13.43 |
19.81 |
10.05 |
8.66 |
|
22.38 |
|
Vf GST774 |
11.36 |
43.38 |
6.67 |
8.64 |
22.68 |
|
Table 3Primary structure analysis of GST genes identified in
Vitis flexuosa transcripts and
V. vinifera collected from the NCBI database
*.
Table 3
|
Gene |
Amino acid length (bp) |
ORF (bp) |
M. Wt. (Da) |
pI |
Instability index (%) |
Aliphatic index |
GRAVY |
|
VvGST |
138 |
417 |
88,669.9 |
4.95 |
64.19 |
27.21 |
0.879 |
|
Vf GST26625 |
219 |
660 |
113,958.4 |
5.03 |
34.82 |
29.00 |
0.721 |
|
Vf GST13892 |
193 |
803 |
162,499.1 |
4.94 |
48.08 |
30.91 |
0.804 |
|
Vf GST29294 |
245 |
738 |
110,422.3 |
5.01 |
43.15 |
28.08 |
0.765 |
|
Vf GST3450 |
234 |
705 |
149,076.7 |
4.97 |
42.69 |
27.62 |
0.695 |
|
Vf GST774 |
232 |
699 |
122,311.7 |
5.01 |
36.43 |
26.13 |
0.662 |
Table 4Summary of predicted secondary structure analysis of GST genes based on the Self-Optimized Prediction Method with Alignment tool
*.
Table 4
|
Gene |
Alpha helix (%) |
Extended strand (%) |
Beta turn (%) |
Random coil (%) |
|
VvGST |
31.82 |
24.24 |
6.82 |
37.12 |
|
Vf GST26625 |
45.21 |
19.63 |
8.68 |
26.48 |
|
Vf GST13892 |
33.16 |
24.87 |
7.25 |
34.72 |
|
Vf GST29294 |
35.51 |
20.41 |
9.80 |
34.29 |
|
Vf GST3450 |
35.10 |
18.37 |
8.57 |
37.96 |
|
Vf GST774 |
45.69 |
17.67 |
4.74 |
31.90 |
References
- Adam A, Farkas T, Somlyai G, Hevesi M, Kiraly Z. 1989. Consequence of O2-generation during a bacterially induced hypersensitive reaction in tobacco: deterioration of membrane lipids. Physiol Mol Plant Pathol. 34: 13-26.
- Ahn SY, Kim SA, Jo SH, Yun HK. 2014. De novo trans-criptome assembly of Vitis flexuosa grapevines inoculated with Elsinoe ampelina. Plant Genet Resour. 12: S130-S133.
- Alvarez ME, Pennell RI, Meijer PJ, Ishikawa A, Dixon RA, Lamb C. 1998. Reactive oxygen intermediates mediate a systemic signal network in the establishment of plant immunity. Cell. 92: 773-784.
- Bézier A, Lambert B, Baillieul F. 2002. Study of defense-related gene expression in grapevine leaves and berries infected with Botrytis cinerea. Eur J Plant Pathol. 108: 111-120.
- Buxbaum E. 2007. Protein structure Fundamentals of protein structure and function. Springer Science Business Media, LLC. New York, NY.
- Chang S, Puryear J, Cairney J. 1993. A simple and efficient method for isolating RNA from pine trees. Plant Mol Biol Report. 11: 113-116.
- Chong J, Le Henanff G, Bertsch C, Walter B. 2008. Identification, expression analysis and characterization of defense and signaling genes in Vitis vinifera. Plant Physiol Biochem. 46: 469-481.
- Dean JD, Goodwin PH, Hsiang T. 2005. Induction of glutathione S-transferase genes of Nicotiana benthamiana following infection by Colletotrichum destructivum and C. orbiculare and involvement of one in resistance. J Exp Bot. 56: 1525-1533.
- Dixon DP, Lapthorn A, Edwards R. 2002. Plant glutathione transferases. Genome Biol. 3: 3004.1-3004.10.
- Dixon DP, Skipsey M, Edwards R. 2010. Roles for glutathione transferases in plant secondary metabolism. Phytochemistry. 71: 338-350.
- Dudler R, Hertig C, Rebmann G, Bull J, Mauch F. 1991. A pathogen-induced wheat gene encodes a protein homologous to glutathione-S-transferases. Mol Plant Microbe Interact. 4: 14-18.
- Edwards R, Dixon DP, Walbot V. 2000. Plant glutathione S-transferases: enzymes with multiple functions in sickness and in health. Trends Plant Sci. 5: 193-198.
- Gasteiger E, Hoogland C, Gattiker A, Duvaud S, Wilkins MR, Appel RD, et al. 2005. Protein identification and analysis tools on the ExPASy server. pp. 571-607. Walker JM, editor. The proteomics protocols handbook. Humana Press. Totowa, NJ:
- Gill SS, Tuteja N. 2010. Reactive oxygen species and antioxidant machinery in abiotic stress tolerance in crop plants. Plant Physiol Biochem. 48: 909-930.
- Gullner G, Komives T. 2001. The role of glutathione and glutathione-related enzymes in plant-pathogen interactions. pp. 207-239. Grill D, Tausz M, Kok L, editors. Significance of glutathione in plant adaptation to the environment. Kluwer Academic Publishers. Dordrecht:
- Guruprasad K, Reddy BV, Pandit MW. 1990. Correlation between stability of a protein and its dipeptide composition: a novel approach for predicting in vivo stability of a protein from its primary sequence. Protein Eng. 4: 155-161.
- Hahn K, Strittmatter G. 1994. Pathogen-defence gene prp 1-1 from potato encodes an auxin-responsive glutathione S-transferase. Eur J Biochem. 226: 619-626.
- Hernández I, Chacón O, Rodriguez R, Portieles R, López Y, Pujol M, et al. 2009. Black shank resistant tobacco by silencing of glutathione S-transferase. Biochem Biophys Res Commun. 387: 300-304.
- Kortekamp A. 2006. Expression analysis of defence-related genes in grapevine leaves after inoculation with a host and a non-host pathogen. Plant Physiol Biochem. 44: 58-67.
- Kyte J, Doolittle RF. 1982. A simple method for displaying the hydropathic character of a protein. J Mol Biol. 157: 105-132.
- Lamb C, Dixon RA. 1997. The oxidative burst in plant disease resistance. Annu Rev Plant Physiol Plant Mol Biol. 48: 251-275.
- Levine A, Tenhaken R, Dixon R, Lamb C. 1994. H2O2 from the oxidative burst orchestrates the plant hypersensitive disease resistance response. Cell. 79: 583-593.
- Marrs KA. 1996. The functions and regulation of glutathione S-transferases in plants. Annu Rev Plant Physiol Plant Mol Biol. 47: 127-158.
- Mauch F, Dudler R. 1993. Differential induction of distinct glutathione-S-transferases of wheat by xenobiotics and by pathogen attack. Plant Physiol. 102: 1193-1201.
- Mauch-Mani B, Slusarenko AJ. 1994. Systemic acquired resistance in Arabidopsis thaliana induced by a predisposing infection with a pathogenic isolate of Fusarium oxysporum. Mol Plant Microbe Interact. 7: 378-383.
- McGonigle B, Keeler SJ, Lau SM, Koeppe MK, O’Keefe DP. 2000. A genomics approach to the comprehensive analysis of the glutathione S-transferase gene family in soybean and maize. Plant Physiol. 124: 1105-1120.
- Moons A. 2003. Osgstu3 and osgtu4, encoding tau class glutathione S-transferases, are heavy metal- and hypoxic stress-induced and differentially salt stress-responsive in rice roots. FEBS Lett. 553: 427-432.
- Pradeep NV, Anupama , Vidyashree KG, Lakshmi P. 2012. In silico characterization of industrial important cellulases using computational tools. Adv Life Sci Technol. 4: 8-14.
- Pickett CB, Lu AY. 1989. Glutathione S-transferases: gene structure, regulation, and biological function. Annu Rev Biochem. 58: 743-764.
- Qu Y, Bolen CL, Bolen DW. 1998. Osmolyte-driven contraction of a random coil protein. Proc Natl Acad Sci USA. 95: 9268-9273.
- Robert N, Roche K, Lebeau Y, Breda C, Boulay M, Esnault R, et al. 2002. Expression of grapevine chitinase genes in berries and leaves infected by fungal or bacterial pathogens. Plant Sci. 162: 389-400.
- Tamura K, Stecher G, Peterson D, Filipski A, Kumar S. 2013. MEGA6: molecular evolutionary genetics analysis version 6.0. Mol Biol Evol. 30: 2725-2729.
- Taylor JL, Fritzemeier KH, Häuser I, Kombrink E, Rohwer F, Schröder M, et al. 1990. Structural analysis and activation by fungal infection of a gene encoding a pathogenesis-related protein in potato. Mol Plant Microbe Interact. 3: 72-77.
- Thomma BPHJ, Tierens KFM, Penninckx IAMA, Mauch-Mani B, Broekaert WF, Cammue BPA. 2001. Different micro-organisms differentially induce Arabidopsis disease response pathways. Plant Physiol Biochem. 39: 673-680.
- Thompson JD, Gibson TJ, Plewniak F, Jeanmougin F, Higgins DG. 1997. The CLUSTAL_X windows interface: flexible strategies for multiple sequence alignment aided by quality analysis tools. Nucleic Acids Res. 25: 4876-4882.
- Ulmasov T, Ohmiya A, Hagen G, Guilfoyle T. 1995. The soybean GH2/4 gene that encodes a glutathione S-transferase has a promoter that is activated by a wide range of chemical agents. Plant Physiol. 108: 919-927.
- Wagner U, Edwards R, Dixon DP, Mauch F. 2002. Probing the diversity of the Arabidopsis glutathione S-transferase gene family. Plant Mol Biol. 49: 515-532.
- Yun HK, Park KS, Rho JH, Kwon BO, Jeong SB. 2003. Development of an efficient screening system for anthracnose resistance in grapes. J Kor Soc Hort Sci. 44: 809-812.