Abstract
Sunflower is one of the most widely cultivated oil crops. It produces seeds which have abundant health benefits. The objective of this research was to determine the effects of two growing years and five planting dates on agronomic traits and chemical compositions in sunflower accessions. In this study, genotype by year interaction was significant for days to flowering, weight of seeds per plant, oil, palmitic acid, stearic acid, oleic acid, linoleic acid, all tocopherol and phytosterol components. The major source of variation in most agronomic traits and chemical compositions in sunflower was attributed by variation among genotypes. Days to flowering, head length, and weight of seeds per plant decreased when planting date was delayed. Oil content, stearic acid, oleic acid, α-tocopherol, total tocopherol, β-sitosterol, and total sterol contents decreased but linoleic acid increased when planting date was delayed. From this study, valuable information will be provided for sunflower breeders and growers in developing and producing functional food resources and products.
-
Key words: Sunflower, Growing year, Planting date, Agronomic traits, Chemical composition
INTRODUCTION
Sunflower (
Helianthus annuus L.) is one of the most widely cultivated oil crops in the world, which has also been considered as an important crop for biodiesel production (
Duane 2007). Sunflower seeds have abundant health benefits, which include reduction of blood cholesterol, anti-inflammatory properties, artery cleansing properties, etc (
Ologunde et al. 2008). The various health benefits of sunflower seeds can be attributed to the high levels of polyunsaturated and monounsaturated fats, phytosterols, tocopherols, protein, copper, folates, iron, zinc, and vitamin B (
Roche et al. 2010). Sunflower oil contains four commercially important fatty acids: palmitic (16:0, 3.1 ~ 7.6%), stearic (18:0, 1.3 ~ 4.1%), oleic (18:1, 18.1 ~ 75.5%), and linoleic (18:2, 18.1 ~ 74.1%) (
Lee et al. 2010;
Izquierdo et al. 2002;
Baydar and Erbas 2005). Although seed oil of standard cultivated sunflower is considered to be of good quality for edible purposes, the development of cultivars with high oleic acid has been an important breeding objective for this crop. One advantage of oils with high oleic acid is its higher degree of oxidative stability than oils low in oleic acid, which is desirable for seed storage (
Dehmer and Friedt 1998;
Delplanque 2000a;
Flagella et al. 2002). From the nutritional point of view, a diet rich in monounsaturated fatty acids has been suggested to reduce cholesterol in blood plasma, in that it lowers low density lipoprotein but not high density lipoprotein, thus lower the risk of coronary heart disease (b
Delpanque 2000b;
Izquierdo and Aguirrezabal 2008).
Agronomic and yield traits such as plant height (
Ahmad and Hassan 2000), number of seeds per head (
Kaleem et al. 2009), and 100-seed weight (
Hassan et al. 2003) in sunflower are significantly influenced by the temperature and growth durations which are particular traits of seasonal changes (
Qadir et al. 2007). Genotypes and environmental factors such as temperature during the period of seed development and maturation may have effects on oil content in sunflower seed (
Ahmad and Hassan 2000). The fatty acid composition of sunflower seed is known to be different among cultivars and environmental conditions (
Flagella et al. 2002).
Ahmad and Hassan (2000) depicted that lower temperature and lesser growing days favor the high stearic acid accumulation.
Flagella et al. (2002) reported that sunflower maturation under different environmental conditions would accumulate different concentration of oleic acid. Similarly, significant variations in linoleic acid content have also been observed among locations, planting dates and sunflower hybrids by
Ahmad et al. (2001). The tocopherol content of vegetable oils depends on seed’s genealogy, harvesting season, climatic conditions, and the refining procedures (
Bauernfeind 1977).
Fernandez-Cuesta et al. (2012) reported that variation of tocopherol content in sunflower kernel was mainly explained by the effect of genotypes and the interaction of genotype × environment while variation of phytosterol content in kernel was mainly attributable to the effect of the environment and the interaction of genotype × environment. Sunflower yield tends to decrease when sowing date was delay, and grain oil percentage showed a slight decrease associated with delayed sowing (
Gustavo et al. 2007).
Flagella et al. (2002) reported that the prolongation of the grain filling phase in a cooler period by adjusting sowing date resulted in lower oil content both in 1996 and 1997 seasons. Oil content of sunflower seed has been reported to decrease with lateness of planting date (
Robertson 1981).
Jones (1984),
Unger (1986), and
Cilardi et al. (1990) observed a decrease in oleic acid concentration and conversely an increase in linoleic acid in sunflower genotypes as seeding dates were delayed.
Valuable genetic resources and information of their interactions with environments are indispensable in breeding high quality sunflower cultivars. In order to obtain valuable genetic resources, this study was performed to determine the effects of growing years and planting dates on agronomic traits and chemical compositions in sunflower. From this study, valuable information will be provided for sunflower cultivations and help in developing functional food resources.
MATERIALS AND METHODS
Effects of growing years on agronomic traits and seed chemical composition
Field test
Sixteen accessions with superior agronomic traits and high phytochemical composition contents were collected from the National Agro-biodiversity Center in Suwon, Republic of Korea (
Table 1). All of 16 accessions were planted on 27 May 2010 and on 28 May 2011 on the same field at Chungbuk National University in Cheongju (latitude 37°45′ N, longitude 128°40′ E, altitude 297 m). Experiment was laid out in randomized complete block design with three replications. A plot was consisted of four rows, each in 4 m length. Plant spacing was 60 cm between rows and 30 cm between plants. N-P
20
5-K
2O fertilizers were applied at a ratio of 0.12-0.09-0.09 t ha
−1 as basal application. Seeds were harvested from August to October, and were dried with hot air-dryer at 35°C for 7 days.
Evaluation of agronomic traits
Days to flowering, days from flowering to maturity, days to maturity, stem length, head length, and seed weight per plant were measured as agronomic traits. Stem length was measured (in centimeters) at the completion of flowering. Five plants were selected at random from each plot and their heights were measured from the soil surface to top of flower. Five heads were taken randomly from each plot and diameter of each head was measured using measuring tape.
Sample preparation and chemicals
Sunflower seeds were ground in a cyclone sample mill fitted with a 30 mesh screen into particles of 0.5 mm diameter or less, and stored at −20°C prior to extraction. Three samples were taken from each germplasm. Fatty acid methyl esters (FAME), phytosterols (β-sitosterol, campesterol and stigmasterol) and tocopherols (α-, β-, γ-, δ-tocopherol) standards were purchased from Sigma-Aldrich (Sigma Chemical Co., St. Louis, MO, USA). The trimethyl silyl ether (TMS) derivatives of all sterols were prepared using N,O-bis-[Trimethylsiyl] trifluoroacetamide (BSTFA) reagent from Supelco (Supelco Co., Bellefonate, PA, USA).
Oil extraction
Sunflower oil was extracted from three gram of ground seed with ether for eight hours in a Soxhlet type extractor according to AOCS method (
AOCS 1993). The oil extract was evaporated by distillation at reduced pressure in a rotary evaporator at 50°C until the solvent was totally removed. Crude extract was then weighed.
Analysis of fatty acids
Seventy microliter of sunflower oil was transferred to a screw-cap vial with 2 ml mixture of methanol, heptane, benzene, 2,2-dimethoxypropane, and H2SO4 (37:36:20:5:2 V/V) and held at 80°C for 20 min for methylation of the oil fatty acid. The fatty acid composition of sunflower oil was determined using a gas chromatography system (Agilent 6850) equipped with a flame ionization detector. Samples were separated by Agilent Innowax column (30 m × 0.25 mm × 0.25 μm). Splitless (1:50) injection was used and the carrier gas was nitrogen at a flow-rate of 0.8 ml min−1. Nitrogen (30 ml min−1), hydrogen (30 ml min−1), and dry air (300 ml min−1) were used as auxiliary gases. Injector and detector temperature was 250°C and 280°C, respectively. The oven temperature was held at 150°C for 5 min and then increased by 5°C min−1 to 230°C.
Analysis of tocopherol and phytosterol
A half gram of ground sunflower seed was accurately weighted into a 50 ml screw-cap test tube, and then 1 ml 5α-cholestane (500 ppm in hexane) was added as an internal standard. The sample was saponified by adding 10 ml pyrogallol (3%) and 2 ml KOH (60%). The solution was vortexed for 1 min and heated at 80°C water bath for 20 min. Unsaponifiable fraction was recovered by extraction with hexane. The recovered fraction was pipetted into glass vials and dried under nitrogen at room temperature. TMS derivatives were prepared by dissolving the unsaponifiable material into 150 μl of BSTFA reagent. Silylation was achieved after heating the mixture for 1 h at 60°C. Samples were stored at 4°C prior to analysis.
Chromatographic analysis was carried out on a GC-FID (Agilent 6850). HP-5 column with 0.25 μm film thickness (30 m × 0.25 mm I.D., USA) was used for separation. Splitless (1:10) injection was used and the carrier gas was nitrogen at a flow-rate of 1 ml min−1. Nitrogen (30 ml min−1), hydrogen (30 ml min−1), and dry air (300 ml min−1) were used as auxiliary gases for the flame ionization detector. The injector and detector temperatures were 300°C. The oven temperature was held at 200°C for 1 min and then increased by 10°C min−1 to 245°C, the temperature was maintained for 10 min, finally increased by 8°C min−1 to 280°C and then held for 25 min. Individual sterols and tocopherols were mainly identified by the retention time of corresponding standards and their contents were determined from the ratio of each peak area compared to the internal standards.
Statistical analysis
ANOVA was carried out to test any significant differences among genotypes and growing years on agronomic traits and chemical compositions with SAS software version 9.2 using the following model:
where Yijk was observation of genotype k in year i in jth replication; μ was the grand mean; ei and gk were the effects of year i and genotype k, respectively; r(e)ij was jth replication nested within year i; geik was the genotype by year interaction of genotype k in year i and ɛijk was the residual of genotype k, year i in replication j. Replication and residual effect were considered as random variables.
Effects of planting dates on agronomic traits and chemical compositions
Field test
IT031831, a USA germplasm with high oil and oleic acid contents, was planted on five dates at 10 day intervals in Chungbuk National University, Cheongju (latitude 37°45′ N, longitude 128°40′E, altitude 297 m) in 2010: May 7, May 17, May 27, June 7, and June 17. Experimental design was a randomized block design with three replications.
Statistical analysis
Duncan’s multiple range test was used to test any significant difference among planting dates by the SAS program (Software version 9.1, SAS Institute Inc.).
RESULTS
Effects of growing years on agronomic traits and chemical compositions
Weather conditions during 2010 and 2011 growing seasons
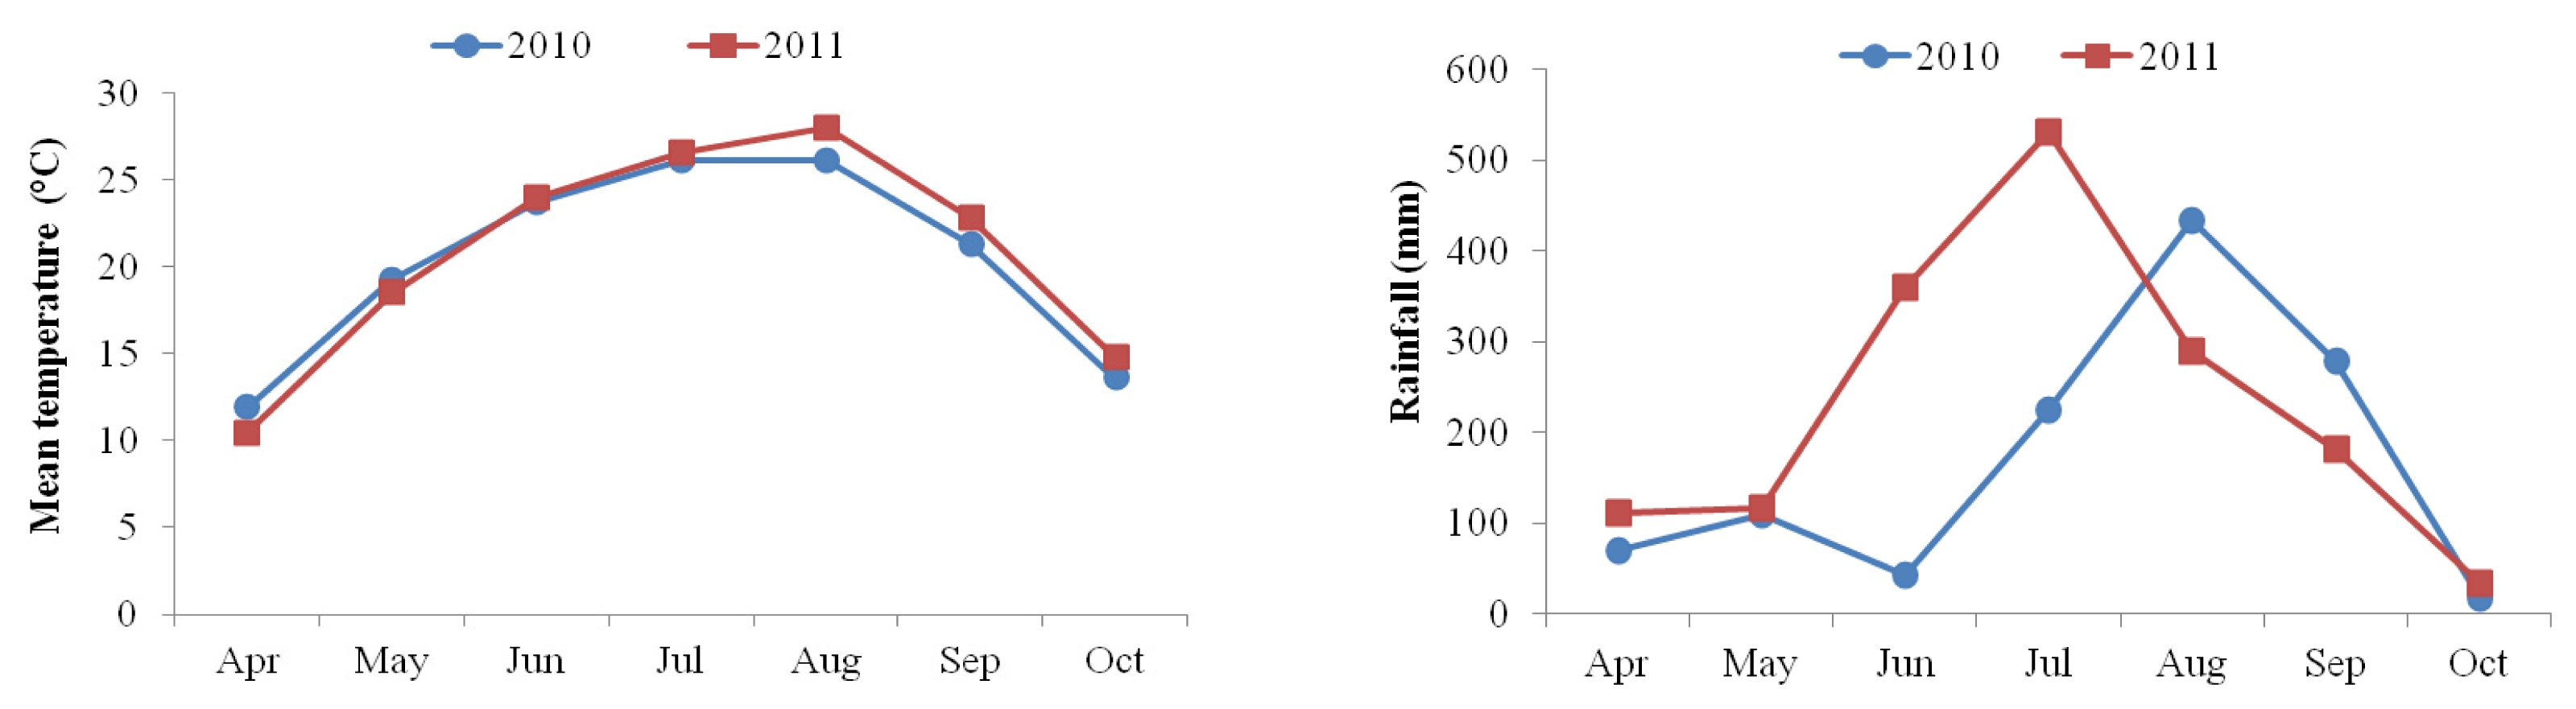
The mean temperature of the day from flowering to maturity was slightly higher in 2011 than in 2010 season (from July to October). More frequent rainfall was observed in 2010 from May to July, compared to the cropping season (August to October) in 2011 (
Fig. 1).
In this study, all agronomic traits except days from flowering to maturity between two years were found to be significantly different. Days to flowering, days from flowering to maturity, days to maturity, and seed weight per plant were found to be significantly different among sixteen genotypes. However, genotype × year interaction only significantly affected the days to flowering and seed weight per plant (
Table 2). The mean value of days to flowering was observed to be slightly longer in 2011 (79) than in 2010 (75) growing season. Days to flowering of most accessions were found to be longer in 2011 than in 2010. However, days to flowering of some accessions such as
IT032111 and
IT031678 were longer in 2010 than in 2011 (
Table 3). This could be due to the fact that the interaction between genotype and year significantly affected the days to flowering (
Table 2). Early maturity was found in
IT031967, while late maturity was observed in
IT032103 and
IT032111 both during 2010 and 2011 seasons. Stem length and weight of seeds per plant were found to be higher in 2010 than in 2011 in all sixteen genotypes
. IT032017 was observed to be the shortest genotype both in 2010 (184.7 cm) and in 2011 (157.1 cm), while
CSF352 was the tallest. Head length was found to be longest in
IT031753 (AVG. = 17.5 mm), while shortest in
IT032012 (AVG. = 12.8 mm) in both years. Seed weight per plant of
IT032014 was observed to be the highest both in 2010 (70.8 g) and in 2011 (58.9 g), while
IT032111 was the lowest in 2010 (20.4g) and 2011 (19.8g) (
Table 3).
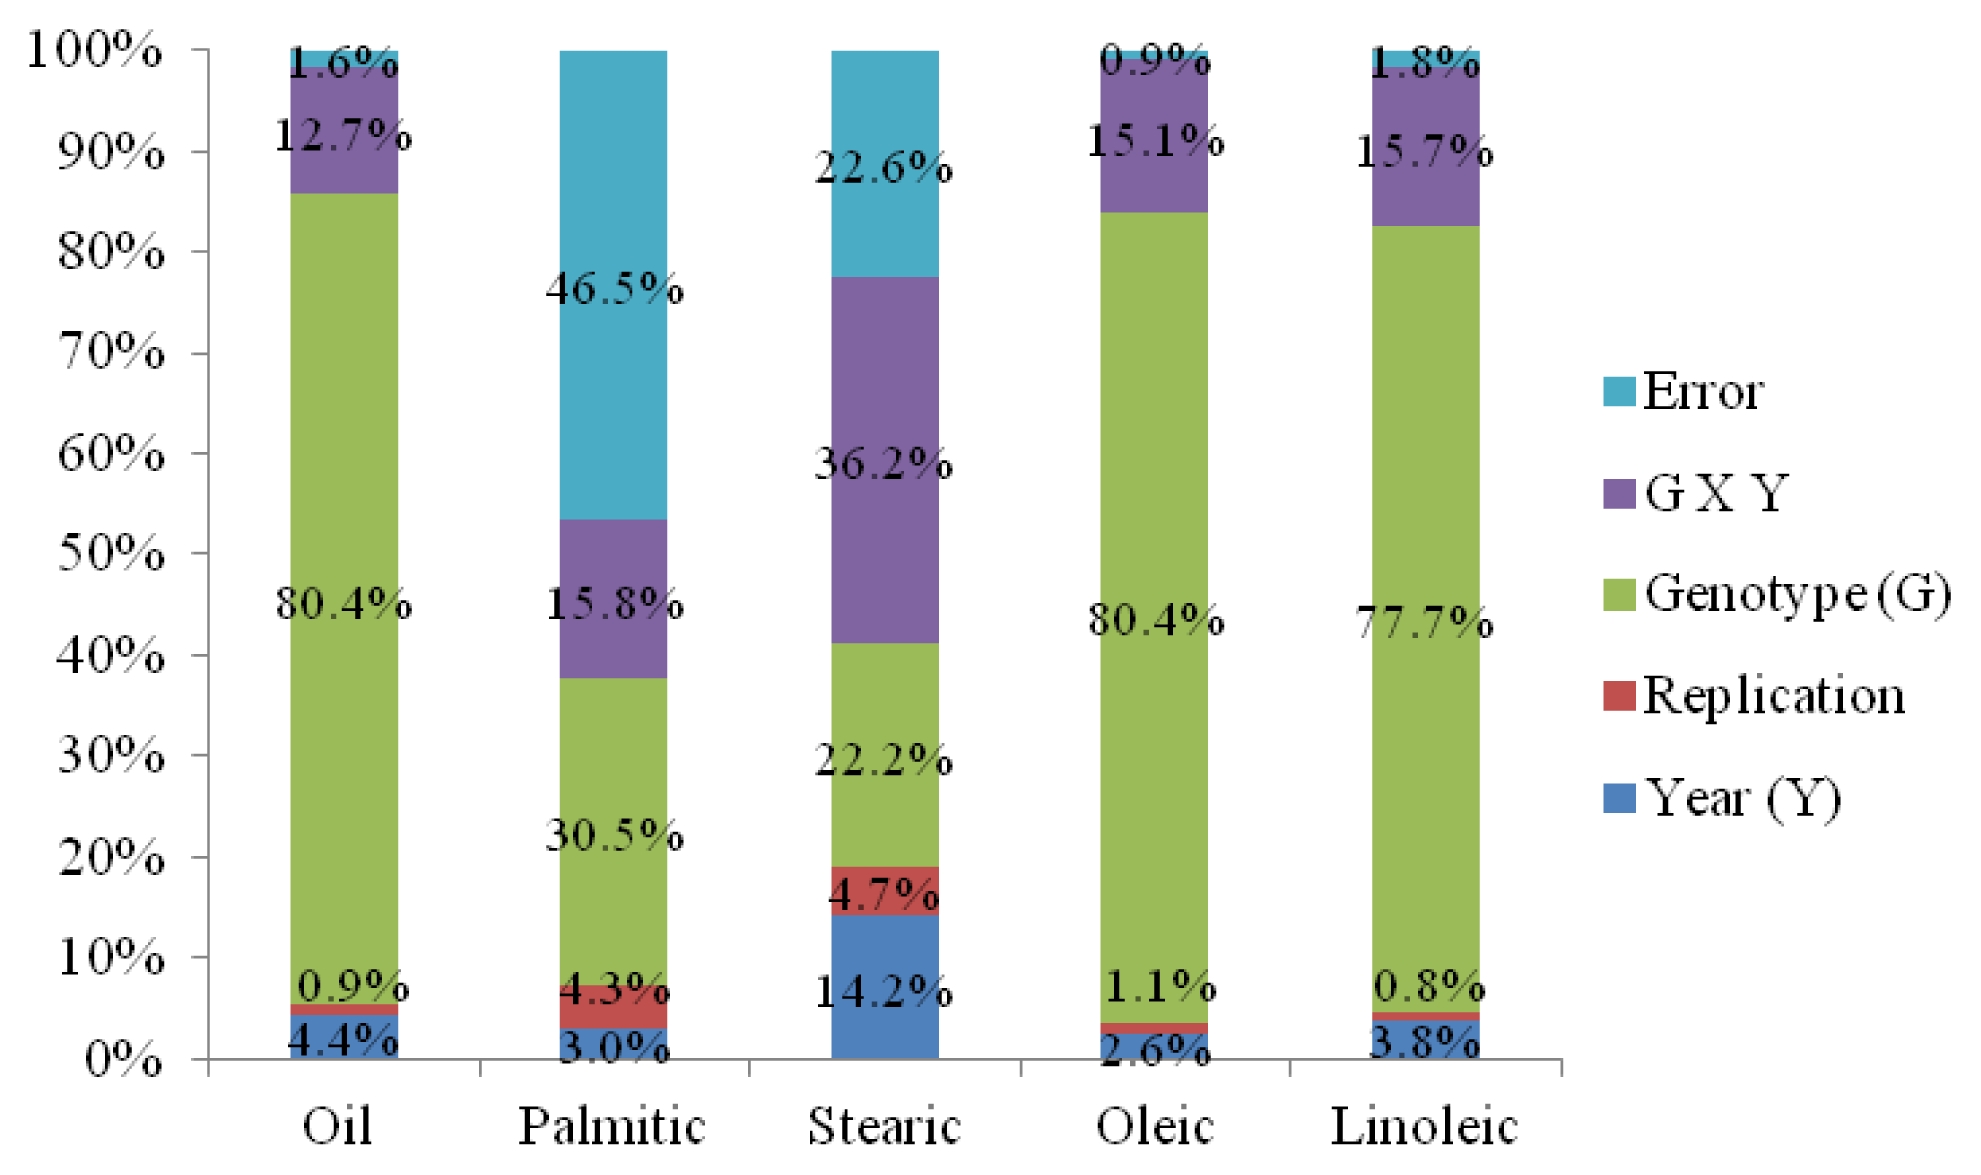
Genotype × year interactions significantly affected oil, stearic acid, oleic acid, and linoleic acid contents. Oil content, stearic acid, oleic acid, linoleic acid, and unsaturated fatty acid composition between two years were found to be significantly different. Oil, stearic acid, oleic acid, and linoleic acid contents were found to be significantly different among sixteen genotypes (
Table 4). In general, variety effect was a major factor for observed variation in oil and fatty acids except stearic which was predominantly influenced by the interaction of genotype × year (36.2%). In particular, genotype effect dominantly occupied very high proportion of total sums of squares in oil content (80.4%), oleic acid (80.4%), and linoleic acid (77.7%) (
Fig. 2).
Oil contents of most genotypes were higher in 2010 than in 2011. However, oil contents of some genotypes such as
IT032012 and
IT032014 were higher in 2011 than in 2010. These results could be due to the interaction effect of genotypes and years which significantly affected oil content in sunflower seed. Same pattern was also found in stearic, oleic and linoleic acid contents. The mean values of stearic and oleic acid contents were slightly higher in 2011 (4.1% and 51.0%) than in 2010 (3.4% and 46.4%). However, the average of linoleic acid content was slightly higher in 2010 (44.8%) than in 2011 (39.1%).
IT031967,
IT031965 and
IT032017 showed high oil level (over 40%) both during 2010 and 2011 seasons. It could be possible that genotypes had significant influence on the oil content synthesis. High oleic acid content was found in
IT031699 by the average of 69.8% between two years, while high linoleic acid level was found in
CSF352 (AVG. = 70.7%) (
Table 5).
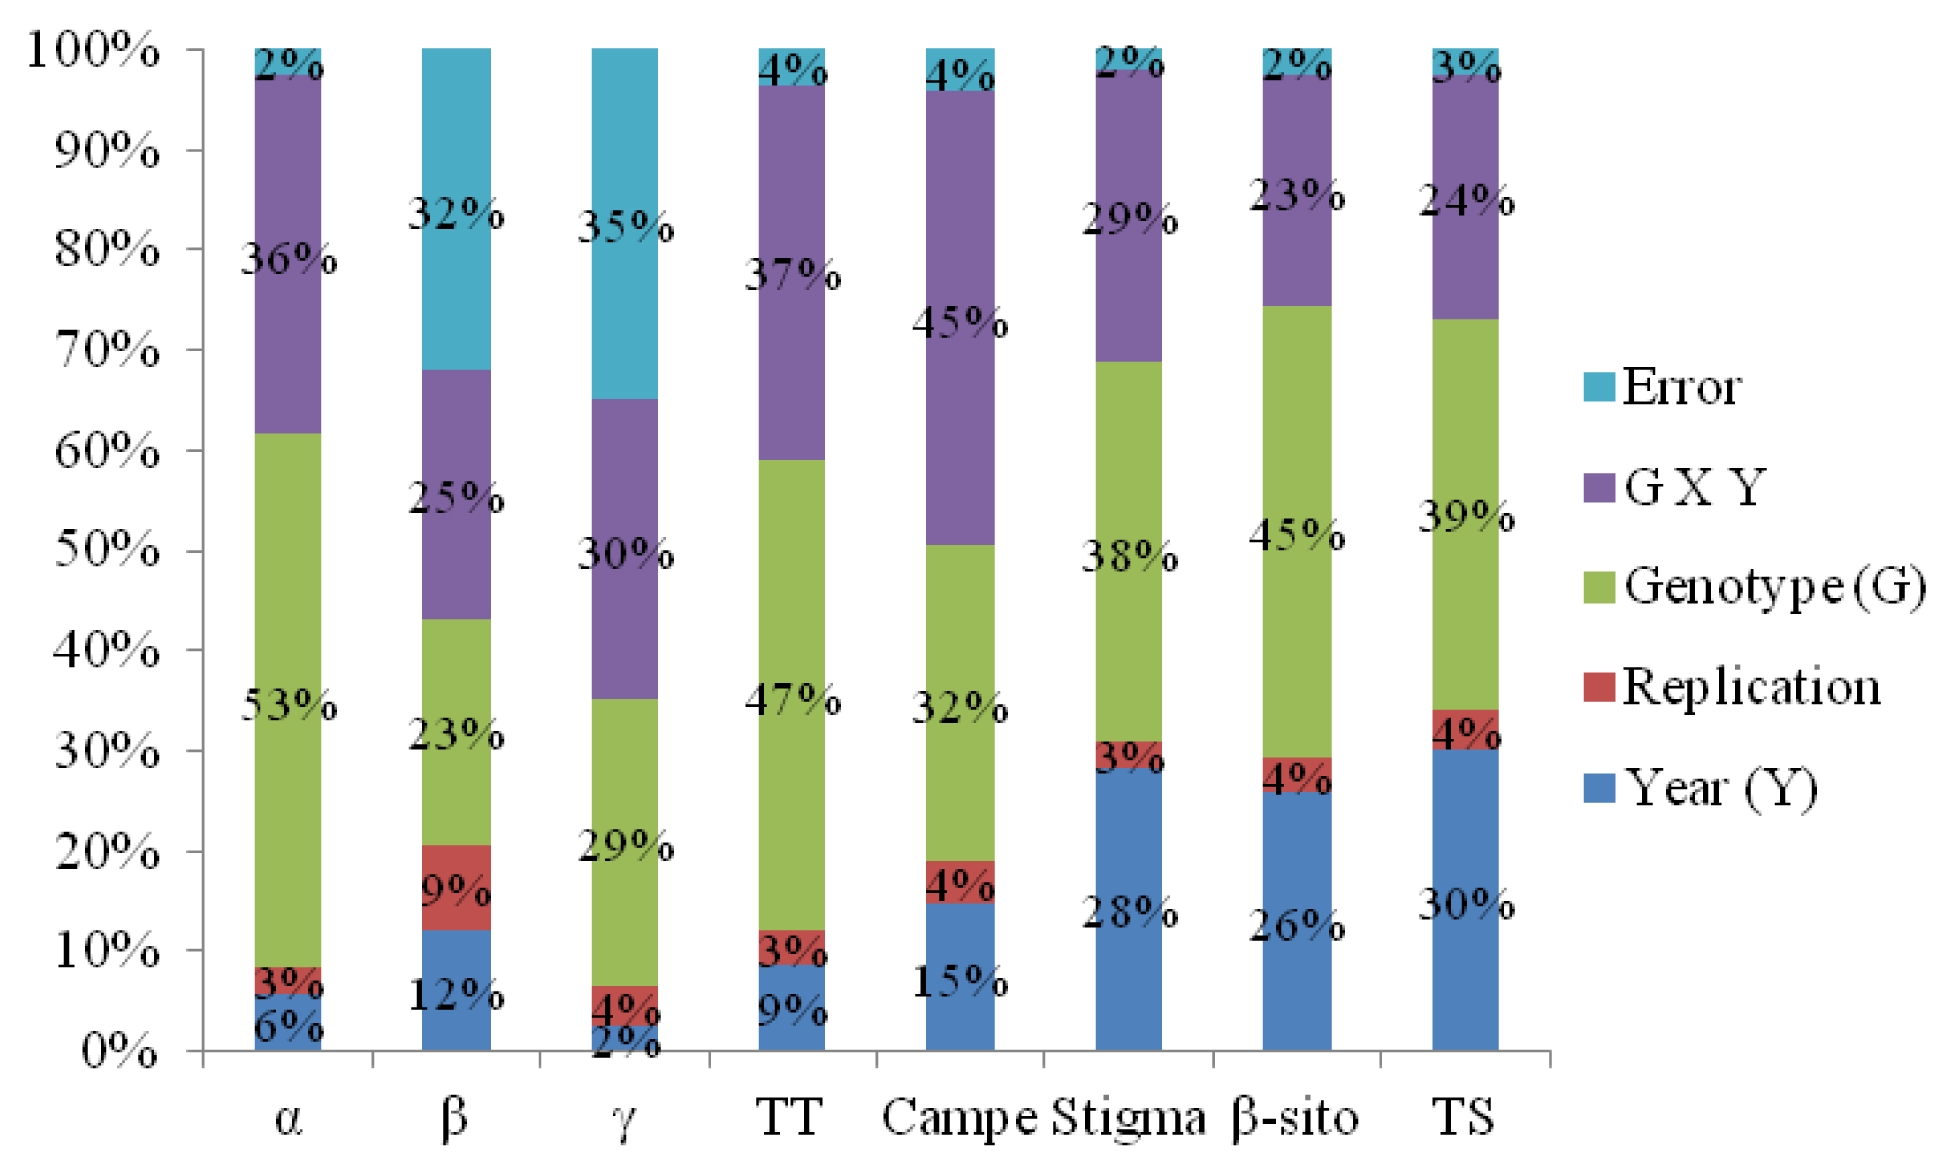
Genotype × year interaction significantly affected all tocopherol and phytosterol components. All tocopherol and phytosterol components except γ-tocopherol showed significant differences between two years. All tocopherol and phytosterol components showed significant differences among sixteen genotypes (
Table 6). Genotype effect had the highest percentage of sum of squares for α-tocopherol (53%), total tocopherol (47%), stigmasterol (38%), β-sitostrol (45%), and total sterol (39%) contents. For campesterol, variation was mainly explained by genotype × year interaction (45% of sum of squares). For β-tocopherol and γ-tocopherol, there were similar percentage of sum of squares for genotype (23% and 29%) and genotype × year interaction (25% and 30%) (
Fig. 3). The mean values of α-T, β-T, γ-T, total tocopherol, campesterol, stigmasterol, β-sitosterol, and total sterol contents were all observed to be higher in 2011 than in 2010 growing season (
Table 7). As mentioned earlier, the mean temperature was slightly higher but the precipitation was lower in 2011 than in 2010 during sunflower maturity period (from August to October) (
Fig. 1). Whether these two factors had an influence on the observed difference in tocopherol and phytosterol components in the two growing years brings an attention for further research in sunflower.
IT031965,
IT031913 and
IT032014 showed highest α-tocopherol and total tocopherol levels both in 2010 and 2011 seasons.
CSF352 showed highest β-sitosterol and total sterol contents by the mean of two years (2633.9 μg g
−1 and 2934.8 μg g
−1, respectively) (
Table 7).
Weather conditions in 2010 growing season
The mean temperature increased from sowing period (May) to flowering period (August), while it decreased during maturity period (from August to October). Similar pattern was also observed for rainfall in 2010 growing season (
Fig. 4).
Agronomic traits
Days to flowering of sunflower sown in May 7 (64) and May 17 (61) were found to be longest followed by May 27 (56), June 7 (52), and June 17 (51). Days from flowering to maturity of sunflower sown in May 7 (43), May 27 (40), and June 7 (41) were significantly longer (P<0.05) than in May 17 (31) and June 7 (34). There was no significant difference in days to maturity among May 7 (97), May 17 (92), May 27 (96), and June 7 (93) planting dates. However, June 17 (85) was significantly the shortest (P<0.05). Stem length in June 7 planting (297 cm) was the longest, followed by May 27 (286 cm), June 17 (265 cm), May 17 (246 cm), and May 7 (238 cm) planting. Head length in May 7 planting (21.2 cm) was longest, followed by June 7 (20.0 cm), May 27 (19.9 cm), and May 17 (19.7 cm), while June 17 (17.8 cm) planting was shortest. Seed weight per plant was found to be highest in May 7 (81.6 g) and May 17 (76.4 g) sowing, while June 17 planting was the lowest (36.1 g). In general, days to flowering became shorter when planting date was delayed. Similar patterns were also found in head length and weight of seeds per plant. When planting date was delayed head length and weight of seeds per plant decreased (
Table 8).
Oil and fatty acid contents
Oil content of the seeds sown in May 7 (35.6%) was the highest among five different planting dates, and there was no significant difference among May 17 (31.5%), May 27 (31.1%), and June 7 (30.5%) planting, while June 17 planting showed the lowest oil level (27.4%). Same patterns were also observed in stearic and oleic acid contents, where a decrease in content value was observed when planting date was delayed. On the contrary, linoleic acid content increased when planting date was delayed. Palmitic, saturated fatty acid and unsaturated fatty acid contents showed no significant differences among five different planting dates (
Table 9).
Tocopherol and phytosterol contents
The α-tocopherol content of sunflower seeds sown in May 7 (202.6 μg g
−1), May 17 (199.2 μg g
−1), May 27 (196.8 μg g
−1), and June 7 (165.8 μg g
−1) were significantly higher (P<0.05) than in June 17 (151.6 μg g
−1). The total tocopherol content of sunflower seeds sown in May 7 (209.7 μg g
−1), May 17 (206.7 μg g
−1), and May 27 (203.9 μg g
−1) were significantly higher (P<0.05) than in June 7 (171.9 μg g
−1) and June 17 (156.9 μg g
−1). β-tocopherol and γ-tocopherol contents showed no significant differences among five different planting dates. Campesterol content of sunflower seeds sown in May 7 (141.2 μg g
−1), May 17 (179.8 μg g
−1), May 27 (150.8 μg g
−1), and June 7 (142.9 μg g
−1) were significantly higher (P<0.05) than in June 17 (107.5 μg g
−1). Stigmasterol contents of sunflower seeds sown in May 7 (240.3 μg g
−1), May 17 (250.5 μg g
−1), and May 27 (237.5 μg g
−1) were significantly higher (P<0.05) than in June 7 (205.8 μg g
−1), while June 17 (152.3 μg g
−1) had the lowest stigmasterol level. The β-sitosterol content of sunflower seeds sown in May 7 (1995.8 μg g
−1), May 17 (1869.2 μg g
−1), May 27 (1863.5 μg g
−1), and June 7 (1847.2 μg g
−1) were significantly higher (P<0.05) than in June 17 (1488.3 μg g
−1). The total phytosterol content of sunflower seeds sown in May 7 (2377.3 μg g
−1), May 17 (2269.4 μg g
−1), May 27 (2251.8 μg g
−1), and June 7 (2195.8 μg g
−1) were significantly higher (P<0.05) than in June 17 (1748.0 μg g
−1) (
Table 10). In general, α-tocopherol, total tocopherol, β-sitosterol and total phytosterol contents decreased when planting date was delayed.
DISCUSSION
Agronomic traits such as plant height (
Ahmad and Hassan 2000), number of seeds per head (
Kaleem et al. 2009), and 100-seed weight (
Hassan et al. 2003) in sunflower are significantly influenced by the temperature and growth durations which are particular traits of seasonal changes (
Qadir et al. 2007). Similar results were found in our study. All agronomic traits except days from flowering to maturity between two years were found to be significantly different. Days to flowering, days from flowering to maturity, days to maturity, and seed weight per plant were found to be significantly different among sixteen genotypes. However, genotype × year interaction only significantly affected the days to flowering and seed weight per plant. This indicated that variations in the agronomic traits due to environment and genotype effects are higher than by the interaction of both factors.
In our study, variety effect was a major factor for observed variation in oil and fatty acids except stearic which was predominantly influenced by the interaction of genotype × year. This indicated that there could be significant changes in oil content and fatty acid composition in sunflower seed produced from different genotypes in different environment. These results were in conformity with other finding in which the genotypes and environmental factors such as temperature during the period of seed development and maturation might have affected oil content in sunflower seed (
Ahmad and Hassan 2000). The mean value of oil content was observed to be slightly higher in 2011 (35.1%) than in 2010 (32.0%). The mean temperature in 2011 growing season was generally higher than in 2010 during sunflower maturity period (from August to October) (
Fig. 1). It could be considered that high temperature during the period of seed maturation is attributable to higher oil content. Similar results were obtained in previous studies which found the oil content of sunflowers to be maximum when matured at high temperature but to be progressively decreased as it matured at low temperature (
Ahmad et al. 2001;
Vega et al. 2002). The mean values of stearic and oleic acid contents were slightly higher in 2011 than in 2010. However, the average of linoleic acid content was slightly higher in 2010 than in 2011. Similar results were also found in the previous research that environmental factors affected oil contents and fatty acid composition of sunflower seed and therefore, seeds varied in their oil content and fatty acid composition depending on their environment of growth (
Fick et al. 1974).
Baydar and Erbas (2005) reported that the most important health benefit of sunflower seeds is imparted by the polyunsaturated (linoleic acid) and monounsaturated (oleic acid) fatty acids that it contains. These components protect the heart against various heart diseases like blockage of arteries, by lowering cholesterol and eliminating bad cholesterol or low density lipoprotein. More than 90% of the fat in sunflower seeds is unsaturated fatty acids which help maintain high density lipoprotein (
Izquierdo and Aguirrezabal 2008). In this study, the highest unsaturated fatty acid content was found in
IT031753 with 91.9% among sixteen sunflower accessions (
Table 5).
Fernandez-Cuesta et al. (2012) reported that variation of tocopherol content in sunflower kernel was mainly explained by the effect of genotypes and the interaction of genotype × environment, and variation in kernel phytosterol content was mainly attributable to the effect of the location and the interaction of genotype × environment. In our study, genotype × year interaction significantly affected all tocopherol and phytosterol components. All tocopherol and phytosterol components except γ-tocopherol showed significant differences between two years. All tocopherol and phytosterol components showed significant differences among sixteen genotypes. These results indicate less effect of environment on tocopherol and phytosterol contents as compared to the effect of genotypes. It may require a greater effort for sunflower breeders that new breeding materials should be evaluated for their target environments prior to main breeding activities for agronomic traits and chemical compositions due to ubiquitous of genotype by environment interaction.
Effects of planting dates on agronomic traits and chemical compositions
Planting date is one of the most important cultivation practices to be considered in sunflower production, as it is in all crops. In this study, when planting date was delayed days to flowering, head length and weight of seeds per plant decreased. Previous study also reported that sunflower seed weights per plant tended to decrease when planting date was delayed (
Gustavo et al. 2007). Oil content of sunflower seed has been reported to decrease with delay of planting date (
Robertson 1981).
Ahmad and Hassan (2000) depicted that lower temperature and lesser growing days favor the high stearic acid accumulation.
Jones (1984),
Unger (1986), and
Cilardi et al. (1990) observed a decrease in oleic acid concentration and, conversely, an increase in linoleic acid in sunflower genotypes as seeding dates are delayed. Fatty acid composition of sunflower is influenced by temperature, mainly regulating the ratio of oleic and linoleic acid (
Garces et al. 1989). Similar results were observed in our study, when planting date was delayed, oil, stearic acid and oleic acid contents decreased but linoleic acid content increased. In our study, when planting date was delayed, days to flowering, head length, weight of seeds per plant, oil, stearic acid, oleic acid, α-tocopherol, total tocopherol, β-sitosterol and total sterol contents decreased but linoleic acid content increased. Similar results were also reported by other researchers (
Moore and Guy 1997;
Ozer 2003), who noted that late planting not only reduced seed yield, but also decreased oil levels in oilseed crop. The result of this study will provide valuable information for sunflower breeders and growers in developing and producing functional food resources and products.
ACKNOWLEDGMENTS
This work was supported by research grant of Chungbuk National University in 2012.
Fig. 1Mean temperature and rainfall during 2010 and 2011 growing seasons.

Fig. 2Sums of squares in percentage for oil and fatty acids detected.

Fig. 3Sums of squares in percentage for tocopherol and phytosterol contents detected.

Fig. 4Mean temperature and rainfall during 2010 growing season.
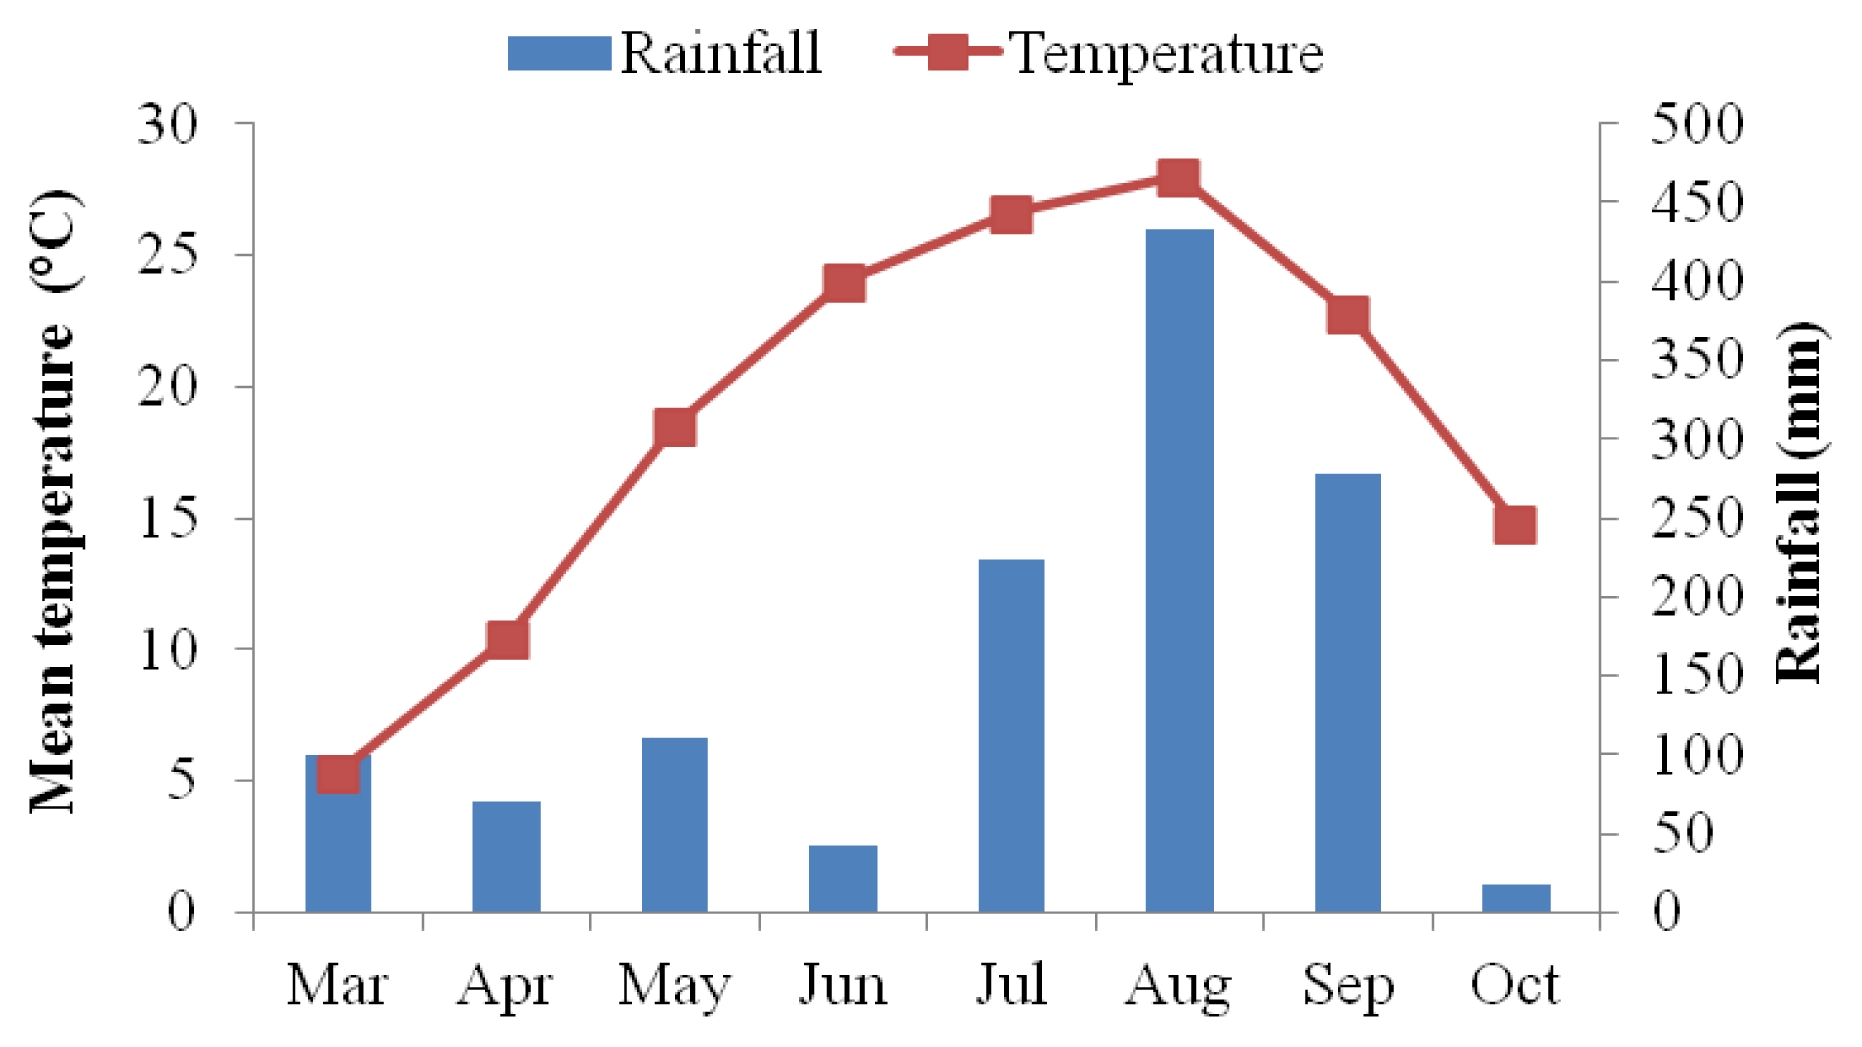
Table 1Origin of sixteen sunflower accessions investigated in this study.
Table 1
|
No. |
IT No. |
Origin |
|
1 |
IT031967 |
USA |
|
2 |
IT031965 |
USA |
|
3 |
IT032017 |
Canada |
|
4 |
IT031831 |
USA |
|
5 |
IT031699 |
USA |
|
6 |
IT031938 |
USA |
|
7 |
IT032111 |
Korea |
|
8 |
IT031725 |
USA |
|
9 |
IT032103 |
Korea |
|
10 |
IT031913 |
USA |
|
11 |
IT031687 |
Canada |
|
12 |
IT032012 |
USA |
|
13 |
CSF352 |
Korea |
|
14 |
IT031848 |
USA |
|
15 |
IT031753 |
USA |
|
16 |
IT032014 |
Canada |
Table 2Analysis of variance in agronomic traits of sixteen sunflower germplasm in two growing years. Data show sums of squares with F-test results.
Table 2
|
Source of variation |
df |
Days to flowering |
DFFTMz
|
Days to maturity |
Stem length (cm) |
Head length (cm) |
SWPPy (g) |
|
Year (Y) |
1 |
247.0**
|
0.58ns
|
270.0*
|
170329.7**
|
203.2**
|
12524.2**
|
|
Replication (year) |
4 |
113.9 |
93.2 |
99.3 |
3957.7 |
41.2 |
793.0 |
|
Genotype (G) |
15 |
23723.0**
|
7840.4**
|
23064.6**
|
28944.4ns
|
104.8ns
|
7262.2**
|
|
G X Y |
15 |
1008.6**
|
773.1ns
|
435.5ns
|
29663.5ns
|
162.5ns
|
4500.6*
|
|
Error |
60 |
1126.7 |
1732.0 |
2688.6 |
89126.3 |
421.4 |
7135.5 |
|
|
Total |
95 |
26219.3 |
10439.2 |
26588.2 |
322021.7 |
933.1 |
32215.6 |
Table 3Agronomic traits of sixteen sunflower germplasm in 2010 and 2011.
Table 3
|
No. |
Genotype |
Days to flowering |
DFFTM |
Days to maturity |
Stem length (cm) |
Head length (cm) |
SWPP (g) |
|
|
|
|
|
2010 |
2011 |
2010 |
2011 |
2010 |
2011 |
2010 |
2011 |
2010 |
2011 |
2010 |
2011 |
|
1 |
IT031967 |
60 |
66 |
31 |
28 |
91 |
94 |
208 |
189 |
17.2 |
15.0 |
60.8 |
44.0 |
|
2 |
IT031965 |
60 |
67 |
32 |
28 |
92 |
95 |
193 |
169 |
18.1 |
13.0 |
62.5 |
47.8 |
|
3 |
IT032017 |
66 |
68 |
26 |
21 |
92 |
89 |
184 |
157 |
17.0 |
15.5 |
61.2 |
54.1 |
|
4 |
IT031831 |
68 |
69 |
25 |
26 |
93 |
95 |
225 |
193 |
15.6 |
15.3 |
49.0 |
38.0 |
|
5 |
IT031699 |
74 |
91 |
18 |
12 |
92 |
103 |
243 |
192 |
21.5 |
12.4 |
56.3 |
36.7 |
|
6 |
IT031938 |
70 |
74 |
23 |
20 |
93 |
94 |
281 |
180 |
18.8 |
14.9 |
53.7 |
34.9 |
|
7 |
IT032111 |
104 |
91 |
25 |
44 |
129 |
135 |
269 |
197 |
15.2 |
15.3 |
20.4 |
19.8 |
|
8 |
IT031725 |
65 |
69 |
48 |
46 |
113 |
115 |
228 |
197 |
15.3 |
11.9 |
63.4 |
31.2 |
|
9 |
IT032103 |
104 |
110 |
26 |
23 |
130 |
133 |
277 |
227 |
16.0 |
11.2 |
47.8 |
45.4 |
|
10 |
IT031913 |
74 |
79 |
44 |
40 |
118 |
119 |
256 |
203 |
18.4 |
9.2 |
44.7 |
39.1 |
|
11 |
IT031687 |
85 |
83 |
37 |
40 |
122 |
123 |
255 |
210 |
17.4 |
12.5 |
54.7 |
47.2 |
|
12 |
IT032012 |
69 |
69 |
23 |
28 |
92 |
97 |
250 |
192 |
11.6 |
14.0 |
43.3 |
33.7 |
|
13 |
CSF352 |
108 |
121 |
11 |
12 |
119 |
133 |
262 |
226 |
15.9 |
14.9 |
23.5 |
26.9 |
|
14 |
IT031848 |
68 |
66 |
24 |
23 |
92 |
89 |
251 |
195 |
15.1 |
12.6 |
38.4 |
26.0 |
|
15 |
IT031753 |
65 |
66 |
27 |
29 |
92 |
95 |
234 |
199 |
18.7 |
16.1 |
59.3 |
53.4 |
|
16 |
IT032014 |
64 |
69 |
28 |
28 |
92 |
97 |
246 |
203 |
17.2 |
15.4 |
70.8 |
58.9 |
|
|
Mean |
75 |
79 |
28 |
28 |
103 |
107 |
241 |
195 |
16.9 |
14.0 |
50.6 |
39.8 |
|
|
SD |
16 |
17 |
9 |
10 |
15 |
17 |
28 |
17 |
2.2 |
1.9 |
14.0 |
11.0 |
|
|
LSD (0.05) |
10.1 |
2.6 |
11.7 |
8.8 |
14.8 |
9.1 |
21.8 |
35.6 |
2.5 |
1.7 |
9.8 |
6.9 |
Table 4Analysis of variance in oil and fatty acid contents of sixteen sunflower germplasm in two growing years. Data show sums of squares with F-test results.
Table 4
|
Source of variation |
df |
Oil |
Palmitic |
Stearic |
Oleic |
Linoleic |
SFAz
|
USFAy
|
|
Year (Y) |
1 |
144.8**
|
3.0**
|
7.8**
|
431.5**
|
635.9**
|
19.7**
|
5.2ns
|
|
Replication (year) |
4 |
31.1 |
4.3 |
2.6 |
175.9 |
140.6 |
8.6 |
17.95 |
|
Genotype (G) |
15 |
2672.4**
|
30.7**
|
12.2**
|
13424.5**
|
13067.2**
|
50.9ns
|
123.0ns
|
|
G X Y |
15 |
422.6**
|
15.9**
|
19.9**
|
2523.3**
|
2648.5**
|
56.7ns
|
172.1ns
|
|
Error |
60 |
53.6 |
46.8 |
12.4 |
149.5 |
298.7 |
74.2 |
258.2 |
|
|
Total |
95 |
3324.6 |
100.6 |
55.0 |
16704.7 |
16827.0 |
210.1 |
576.5 |
Table 5Oil and fatty acid contents of sixteen sunflower germplasm in 2010 and 2011. (%)
Table 5
|
No. |
Genotype |
Oil |
Palmitic |
Stearic |
Oleic |
Linoleic |
SFA |
USFA |
|
|
2010 |
2011 |
2010 |
2011 |
2010 |
2011 |
2010 |
2011 |
2010 |
2011 |
2010 |
2011 |
2010 |
2011 |
|
1 |
IT031967 |
44.1 |
45.1 |
5.3 |
5.5 |
3.8 |
5.3 |
49.8 |
62.2 |
41.1 |
27.0 |
9.0 |
10.8 |
91.0 |
89.2 |
|
2 |
IT031965 |
42.6 |
42.2 |
5.4 |
5.2 |
3.2 |
3.8 |
43.2 |
55.7 |
48.2 |
35.3 |
8.6 |
9.0 |
91.4 |
91.0 |
|
3 |
IT032017 |
42.1 |
42.2 |
4.8 |
5.2 |
3.3 |
3.5 |
57.0 |
51.3 |
34.9 |
40.0 |
8.1 |
8.7 |
91.9 |
91.3 |
|
4 |
IT031831 |
29.1 |
39.0 |
4.7 |
6.1 |
4.0 |
3.1 |
60.8 |
63.1 |
30.5 |
27.7 |
8.7 |
9.2 |
91.3 |
90.8 |
|
5 |
IT031699 |
23.2 |
29.9 |
4.7 |
6.2 |
3.2 |
4.5 |
69.2 |
70.3 |
22.9 |
19.0 |
7.9 |
10.7 |
92.1 |
89.3 |
|
6 |
IT031938 |
28.9 |
29.0 |
5.3 |
5.0 |
4.1 |
4.4 |
23.0 |
44.8 |
67.6 |
45.8 |
9.4 |
9.3 |
90.6 |
90.7 |
|
7 |
IT032111 |
33.1 |
38.1 |
6.9 |
6.9 |
2.6 |
4.2 |
22.2 |
25.4 |
68.3 |
63.5 |
9.5 |
11.1 |
90.5 |
88.9 |
|
8 |
IT031725 |
28.3 |
25.9 |
5.7 |
9.0 |
3.2 |
6.7 |
50.8 |
64.7 |
40.3 |
19.6 |
8.9 |
15.8 |
91.1 |
84.2 |
|
9 |
IT032103 |
33.5 |
37.1 |
5.7 |
6.0 |
3.0 |
4.2 |
24.1 |
25.1 |
67.2 |
64.7 |
8.6 |
10.2 |
91.4 |
89.8 |
|
10 |
IT031913 |
26.7 |
30.4 |
5.2 |
5.6 |
3.5 |
3.9 |
50.8 |
48.1 |
40.5 |
42.4 |
8.8 |
9.5 |
91.2 |
90.5 |
|
11 |
IT031687 |
25.0 |
25.9 |
4.8 |
5.3 |
4.1 |
3.5 |
51.4 |
62.6 |
39.7 |
28.6 |
8.9 |
8.8 |
81.1 |
91.2 |
|
12 |
IT032012 |
33.8 |
30.3 |
5.5 |
5.1 |
3.2 |
3.9 |
51.5 |
54.3 |
39.8 |
36.7 |
8.7 |
9.0 |
91.3 |
91.0 |
|
13 |
CSF352 |
29.1 |
38.4 |
6.7 |
6.7 |
3.0 |
3.1 |
23.2 |
16.0 |
67.1 |
74.2 |
9.7 |
9.8 |
90.3 |
90.2 |
|
14 |
IT031848 |
24.5 |
38.1 |
5.7 |
5.2 |
3.8 |
3.3 |
57.2 |
46.7 |
33.3 |
44.8 |
9.5 |
8.5 |
90.5 |
91.5 |
|
15 |
IT031753 |
26.0 |
32.0 |
5.1 |
4.6 |
3.2 |
3.3 |
54.9 |
65.5 |
36.8 |
26.6 |
8.3 |
7.9 |
91.7 |
92.1 |
|
16 |
IT032014 |
41.6 |
37.7 |
5.4 |
5.3 |
3.1 |
4.5 |
52.9 |
60.8 |
38.6 |
29.4 |
8.5 |
9.8 |
91.5 |
90.2 |
|
|
Mean |
32.0 |
35.1 |
5.4 |
5.8 |
3.4 |
4.1 |
46.4 |
51.0 |
44.8 |
39.1 |
8.8 |
9.9 |
90.5 |
90.1 |
|
|
SD |
7.1 |
6.0 |
0.6 |
1.1 |
0.4 |
0.9 |
14.9 |
16.2 |
14.6 |
16.4 |
0.5 |
1.8 |
2.6 |
1.8 |
|
|
LSD (0.05) |
0.9 |
1.4 |
0.6 |
1.3 |
0.4 |
0.9 |
1.5 |
1.7 |
2.7 |
2.1 |
0.5 |
1.6 |
2.1 |
1.6 |
Table 6Analysis of variance in tocopherol and phytosterol contents of sixteen sunflower germplasm in two growing years. Data show sums of squares with F-test results.
Table 6
|
Source of variation |
df |
Tocopherol |
Phytosterol |
|
|
|
α |
β |
γ |
Total |
Campez
|
Stigmay
|
β-sitox
|
Total |
|
Year (Y) |
1 |
7401.2**
|
45.2**
|
2.7ns
|
11897.0**
|
7760.5**
|
51200.2**
|
2585981.8**
|
3696188.4**
|
|
Replication (year) |
4 |
3356.9 |
32.2 |
4.7 |
4427.8 |
2131.7 |
4877.0 |
362177.5 |
508763.7 |
|
Genotype (G) |
15 |
67900.0**
|
84.9**
|
31.7**
|
64287.6**
|
16608.2**
|
68376.4**
|
4501284.9**
|
4811998.3**
|
|
G X Y |
15 |
45913.9**
|
93.0**
|
33.3**
|
50972.3**
|
23697.0**
|
52858.3**
|
2332641.8**
|
2985940.3**
|
|
Error |
60 |
3163.4 |
120.3 |
38.8 |
4775.0 |
2227.2 |
3635.7 |
247937.2 |
320860.7 |
|
|
|
Total |
95 |
127735.4 |
375.6 |
111.3 |
136359.8 |
52424.6 |
180947.5 |
10030023.0 |
12323752.0 |
Table 7The tocopherol and phytosterol contents of sixteen sunflower germplasm in 2010 and 2011. (μg g−1)
Table 7
|
No. |
Genotype |
α-tocopherol |
β-tocopherol |
γ-tocopherol |
Total Tocopherol |
Campesterol |
Stigmasterol |
β-sitosterol |
Total |
sterol |
|
|
2010 |
2011 |
2010 |
2011 |
2010 |
2011 |
2010 |
2011 |
2010 |
2011 |
2010 |
2011 |
2010 |
2011 |
2010 |
2011 |
|
1 |
IT031967 |
240.2 |
209.2 |
7.3 |
8.1 |
0.4 |
0.7 |
247.8 |
218.0 |
92.2 |
153.2 |
285.4 |
302.2 |
1801.2 |
2152.5 |
2178.8 |
2607.9 |
|
2 |
IT031965 |
259.2 |
295.9 |
7.1 |
7.7 |
0.4 |
0.0 |
266.7 |
303.6 |
133.7 |
107.8 |
250.4 |
330.4 |
1892.3 |
1917.4 |
2276.4 |
2355.5 |
|
3 |
IT032017 |
274.6 |
193.8 |
8.4 |
6.8 |
0.0 |
0.2 |
282.9 |
200.2 |
93.7 |
147.0 |
226.6 |
253.0 |
1787.1 |
2142.2 |
2107.3 |
2542.2 |
|
4 |
IT031831 |
177.0 |
219.6 |
8.9 |
8.5 |
2.1 |
1.3 |
188.0 |
228.4 |
108.8 |
110.6 |
191.1 |
237.5 |
1632.8 |
2174.7 |
1932.8 |
2522.8 |
|
5 |
IT031699 |
146.4 |
169.8 |
4.6 |
8.8 |
0.0 |
0.9 |
151.0 |
181.5 |
92.8 |
105.8 |
233.5 |
248.4 |
1414.3 |
1792.0 |
1740.7 |
2146.2 |
|
6 |
IT031938 |
170.9 |
212.4 |
4.8 |
7.9 |
1.0 |
0.3 |
176.7 |
220.6 |
126.9 |
113.2 |
215.9 |
242.0 |
1657.6 |
1719.7 |
2000.4 |
2074.9 |
|
7 |
IT032111 |
163.5 |
216.1 |
4.5 |
7.9 |
0.9 |
2.2 |
168.9 |
226.2 |
109.6 |
144.8 |
219.0 |
198.7 |
2205.7 |
2488.0 |
2534.3 |
2831.5 |
|
8 |
IT031725 |
218.7 |
202.3 |
8.6 |
6.4 |
0.3 |
0.2 |
227.7 |
208.8 |
121.4 |
139.9 |
193.1 |
270.9 |
1699.2 |
2095.6 |
2013.7 |
2506.4 |
|
9 |
IT032103 |
174.5 |
231.8 |
4.7 |
9.4 |
1.4 |
2.5 |
180.6 |
243.7 |
108.1 |
171.7 |
168.0 |
226.5 |
1780.3 |
2742.8 |
2156.5 |
3141.0 |
|
10 |
IT031913 |
219.2 |
262.6 |
5.0 |
8.2 |
0.0 |
0.4 |
224.2 |
271.2 |
118.2 |
128.0 |
227.2 |
342.8 |
2065.5 |
2177.8 |
2410.9 |
2648.6 |
|
11 |
IT031687 |
209.8 |
144.6 |
6.8 |
6.4 |
0.7 |
0.0 |
217.4 |
150.9 |
162.3 |
103.7 |
280.9 |
247.5 |
2429.1 |
2068.7 |
2872.3 |
2419.9 |
|
12 |
IT032012 |
186.0 |
197.9 |
4.5 |
7.7 |
0.0 |
1.2 |
190.5 |
207.8 |
134.8 |
139.4 |
225.1 |
267.6 |
2075.5 |
2365.1 |
2435.5 |
2772.2 |
|
13 |
CSF352 |
154.0 |
212.4 |
4.6 |
6.3 |
1.0 |
1.9 |
159.6 |
220.6 |
97.3 |
126.5 |
194.5 |
253.6 |
2379.8 |
2888.0 |
2571.6 |
3298.0 |
|
14 |
IT031848 |
158.8 |
238.5 |
6.7 |
8.3 |
1.7 |
1.3 |
167.2 |
247.1 |
125.3 |
176.4 |
209.3 |
232.4 |
1914.6 |
2271.8 |
2249.2 |
2680.5 |
|
15 |
IT031753 |
186.2 |
250.2 |
8.5 |
9.9 |
0.0 |
0.4 |
194.6 |
260.6 |
123.5 |
117.0 |
218.3 |
213.3 |
1883.8 |
1862.1 |
2225.6 |
2192.4 |
|
16 |
IT032014 |
239.9 |
230.1 |
7.8 |
8.7 |
0.2 |
0.0 |
247.8 |
238.8 |
99.7 |
107.6 |
206.3 |
260.7 |
1758.3 |
2209.0 |
2064.3 |
2677.3 |
|
|
Mean |
198.7 |
218.0 |
6.4 |
7.9 |
0.6 |
0.8 |
205.7 |
226.7 |
115.5 |
130.8 |
221.5 |
258.0 |
1898.6 |
2191.7 |
2235.6 |
2588.6 |
|
|
SD |
39.6 |
35.5 |
1.7 |
1.1 |
0.7 |
0.8 |
40.2 |
35.8 |
19.1 |
23.4 |
31.0 |
38.9 |
273.9 |
317.1 |
280.1 |
330.1 |
|
|
LSD (0.05) |
8.1 |
6.8 |
0.9 |
1.4 |
0.5 |
0.7 |
8.7 |
9.2 |
6.8 |
5.0 |
8.9 |
8.9 |
77.6 |
58.6 |
91.9 |
67.6 |
Table 8Agronomic traits of IT031831 at five different planting dates.
Table 8
|
Planting date |
Days to flowering |
DFFTMz
|
Days to maturity |
Stem length (cm) |
Head length (cm) |
WSPPy (g) |
|
May 7 |
64ax
|
43a |
97a |
238e |
21.2a |
81.6a |
|
May 17 |
61a |
31c |
92a |
246d |
19.7b |
76.4a |
|
May 27 |
56b |
40a |
96a |
286b |
19.9b |
59.1b |
|
June 7 |
52c |
41a |
93a |
297a |
20.0b |
64.5b |
|
June 17 |
51c |
34b |
85b |
265c |
17.8c |
36.1c |
Table 9Oil and fatty acid contents of IT031831 at five different planting dates. (%)
Table 9
|
Planting date |
Oil |
Palmitic |
Stearic |
Oleic |
Linoleic |
SFAz
|
USFAy
|
|
May 7 |
35.6±1.37ax
|
4.9±0.3a |
3.8±0.2a |
70.3±3.3a |
20.9±2.9d |
8.8±0.6a |
91.2±0.6a |
|
May 17 |
31.5±0.7ab |
4.6±0.2a |
3.8±0.6a |
69.7±3.1a |
21.9±3.5cd |
8.5±0.5a |
91.5±0.5a |
|
May 27 |
31.1±4.2ab |
4.5±0.2a |
3.5±0.2b |
66.0±1.4ab |
25.9±1.5c |
8.1±0.3a |
91.9±0.3a |
|
June 7 |
30.5±1.5ab |
4.6±0.3a |
3.2±0.7b |
61.4±1.6b |
30.9±0.9b |
7.8±0.8a |
92.2±0.8a |
|
June 17 |
27.4±4.4b |
4.8±0.4a |
2.9±0.3b |
55.7±3.2c |
36.6±3.0a |
7.8±0.6a |
92.2±0.6a |
Table 10Tocopherol and phytosterol contents of IT031831 at five different planting dates. (μg g−1)
Table 10
|
Planting date |
Tocopherol |
Phytosterol |
|
|
α |
β |
γ |
Total |
Campesterol |
Stigmasterol |
β-sitosterol |
Total |
|
May 7 |
202.6±8.5az
|
7.1±1.7a |
0.13±0.2 |
209.7±9.6a |
141.2±2.3a |
240.3±15.2a |
1995.8±115.7a |
2377.3±113.2a |
|
May 17 |
199.2±15.4a |
7.5±1.9a |
- |
206.7±16.8a |
179.8±1.4a |
250.5±10.9a |
1869.2±137.9a |
2269.4±156.3a |
|
May 27 |
196.8±8.3a |
7.0±0.7a |
- |
203.9±8.3a |
150.8±5.2a |
237.5±8.1a |
1863.5±73.2a |
2251.8±66.2a |
|
June 7 |
165.8±9.5a |
5.9±1.2a |
0.3±0.2 |
171.9±9.0ab |
142.9±9.0a |
205.8±1.9b |
1847.2±23.3a |
2195.8±25.6a |
|
June 17 |
151.6±43.3b |
5.1±0.8a |
0.3±0.3 |
156.9±43.6b |
107.5±4.6b |
152.3±15.2c |
1488.3±113.3b |
1748.0±110.8b |
References
- Ahmad R, Hassan FU. 2000. Oil and fatty acid composition of spring sunflower under rainfed conditions. Pak J Biol Sci. 3: 33-35.
- Ahmad G, Quresh Z, Iqbal A. 2001. Response of sunflower hybrid to different planting dates at Peshawar Valley. Sarhad J Agric. 17: 561-564.
- AOCS.1993. Official methods and recommended practices. The American oil chemists society. Champaign.
- Bauernfeind JC. 1977. The tocopherol content of food and influencing factors. Crit Rev Food Sci Nutr. 8: 337-382.
- Baydar H, Erbas S. 2005. Influence of seed development and seed position on oil, fatty acids and total tocopherol contents in sunflower (Helianthus annuus L.). Turk J Agric For. 29: 179-186.
- Cilardi AM, Ferri D, Lanza F, Savio Lo, Santamaria P. 1990. Effetti dell’epoca di semina e degli ibridi suresa quanti-qualitativa e contenuto in acidi oleico elin-oleico nell’olio del girasole (Helianthus annuus L.) in secondo raccolto. Riv Agron. 24: 250-256.
- Dehmer K, Friedt W. 1998. Development of molecular markers for high oleic acid content in sunflower (Helianthus annuus L.). Ind Crops Prod. 7: 311-315.
- Delplanque B. 2000a. The nutritional value of sunflower oils: linoleic sunflower seeds and seeds with high oleic content. Oleagineux Crops Gras Lipides. 7: 467-472.
- Delplanque B. 2000b. Intérêt nutritionnel des tournesols. In: Proceedings of XV international sunflower conference; Toulouse I. pp 15-16.
- Duane R. 2007. Sunflower production. pp. 6-8.
- Fernandez-Cuesta A, Aguirre-Gonzalez MR, Ruiz-Mendez MV, Velasco L. 2012. Validation of a method for the analysis of phytosterols in sunflower seeds. Eur J Lipid Sci Technol. 114: 325-331.
- Fick GN, Zimmer DC, Zimmerman DC. 1974. Correlation of seed oil content in sunflower with other plant and seed traits. Crop Sci. 14: 755-761.
- Flagella Z, Rotunno T, Tarantino E, Caterina Di, Caro-De A. 2002. Changes in seed yield and oil fatty acid composition of high oleic sunflower (Helianthus Annuus L.) hybrids in relation to the sowing date and the water relation to the sowing date and the water regime. Eur J Agron. 17: 221-230.
- Garces R, Garcia JM, Mancha M. 1989. Lipid characterization in seeds of a high oleic acid sunflower mutant. Phytochemistry. 28: 2597-2600.
- Gustavo A, Irujo P, Aguirrezabal AN. 2007. Sunflower yield and oil quality interactions and variability: Analysis through a simple simulation model. Agric For Meteorol. 143: 252-265.
- Hassan FU, Ahmad RA, Qadir G. 2003. Oil and fatty composition of sunflower in response to seasonal variation. HELIA. 35: 159-166.
- Izquierdo N, Aguirrezábal L, Andrade F, Pereyra V. 2002. Night temperature affects fatty acid composition in sunflower oil depending on the hybrid and the phenological stage. Field Crop Res. 77: 115-126.
- Izquierdo N, Aguirrezábal L. 2008. Genetic variability in the response of fatty acid composition to minimum night temperature during grain filling in sunflower. Field Crop Res. 106: 116-125.
- Jones OR. 1984. Yield, water-use efficiency and oil concentration and quality of dry land sunflower grown in the southern high plains. Agron J. 76: 229-235.
- Kaleem S, Hassan FU, Saleem A. 2009. Influence of environmental variations on physiological attributes of sunflower. African J Biotech. 8: 3531-3539.
- Lee YH, Song HL, Piao XM, Park KH, Nam SY, Kim IJ, Choi SY, Jang YS, Kim HS. 2010. Variations of seed traits, oil Content and fatty acid composition in sunflower accession. Korean J Crop Sci. 55: 245-252.
- Moore MK, Guy S. 1997. Agronomic response of winter rapeseed to rate and data of seeding. Agron J. 89: 521-529.
- Ologunde MO, Adelani A, Liasu MO. 2008. Chemical compositions of sunflower (Helianthus Annuus L.) hybrids planted in different natural locations in Northern Nigeria. Am-Eurasian J Sustain Agric. 2: 229-234.
- Ozer H. 2003. Sowing date and nitrogen rate effects on growth, yield and yield components of two summer rapeseed cultivars. Eur J Agron. 19: 453-463.
- Qadir G, Hassan FU, Malik MA. 2007. Growing degree days and yield relationship in sunflower. Int J Agri Biol. 9: 564-568.
- Robertson JA, Green VE. 1981. Effect of planting date on sunflower seed oil content, fatty acid composition and yield in Florida. J Am Oil Chem Soc. 58: 698-701.
- Roche J, Alignan M, Bouniols A, Cerny M, Mouloungui Z, Merah O. 2010. Sterol concentration and distribution in sunflower seeds (Helianthus annuus L.) during seed development. Food Chem. 119: 1451-1456.
- Unger PW. 1986. Growth and development of irrigated sunflower in the Texas high plains. Agron J. 78: 507-515.
- Vega AJ, Vega AJ. 2002. Effects of planting date, genotype and their interactions on sunflower yield: II. Components of oil yield. Crop Sci. 42: 1202-1210.