Abstract
Assessment of the genetic variation and biochemical traits among various germplasm collections are necessary for utilization of valuable genetic resource and effective strategies of germplasm conservation. The aims of this study were to analyze the genetic diversity using SSR markers and compare protein, oil content and fatty acid composition of about 185 soybean germplasm which is comprised of Korean landraces and collections from six different global regions. Seventy two SSR markers were selected based on their distribution on the 17 genetic linkage groups of soybean. A total of 784 alleles were detected from all accessions, with an average of 10.9 alleles per microsatellite locus. The genetic diversity observed was high wherein three distinct groups were formed containing several subgroups according to their geographic origins. Biochemical contents assay revealed significant differences in their protein and oil contents. Generally, the crude protein content was highest among India and Myanmar collections, while oil content was highest among accessions from USA and China. A negative correlation was observed between protein and oil contents, and between oleic and linolenic acids. The highest value observed for biochemical content among all germplam tested was 45.8% for crude protein, 26.7% for crude oil and 35.7% for oleic acid composition. Our study provided a better understanding of genetic relationships and geographical origin among various germplasm collections, and it could contribute to more efficient utilization of valuable genetic resources.
-
Key words: Soybean, Genetic diversity, Protein and oil, Fatty acid
INTRODUCTION
Soybean is broadly cultivated all over the world as a crucial source of protein and oil. Northeast region of China has been regarded as the primary center of origin where wild (
Glycine soja) soybeans spread out in other directions (
Dong et al. 2001), but there is no consensus about the location (
Carter et al. 2004). On the basis of geographical and historical evidence, soybeans (
G. max) may have been first cultivated in northeastern China and Korea, and then the cultivation of soybeans expanded to all over the world (
Simoons 1991). The introduced soybean had adapted to various environments and some landraces are being used as local cultivars in several countries, but this expectedly would present major genetic bottlenecks occurring from Asian landraces to European and North American accessions. It was demonstrated that the North American soybean cultivars have a lower level of diversity than the Asian soybean landraces (
Cui et al. 2000,
2001), and this was confirmed using sequence analyses showing successive genetic bottlenecks between Asian landraces and North American cultivars (
Hyten et al. 2006). Furthermore, various studies have demonstrated that current soybean cultivars are extremely uniform based on inbreeding coefficient analysis and studies assessing the genetic variability using molecular markers (
Brown-Guedira et al. 2000;
Priolli et al. 2002;
Bonato et al. 2006;
Mulato et al. 2010). These studies showed that a few accessions have contributed to the majority of the genes in current cultivars, and that the genetic diversity in soybean elite germplasm is limited in American cultivars. For these reason, Asian landraces have emerged as valuable germplasm for breeding modern soybean cultivars. To breed new varieties for facing the effects of global climate change, the gene pool of cultivars must be broadened by introducing wild species, landraces, and exotic germplasm into breeding programs. Generally, the incompatibility of wild species with cultivars limits the introgression of wild species genes. To avoid this limitation, introduction of exotic elite cultivars was resorted to improve the gene pool of domestic cultivars, including landraces. Landraces seeds are maintained by farmers and often contain useful genes due to environment adaptation within a certain region after domestication or introduction. Studies of genetic diversity analysis using molecular markers are necessary to understand the genetic backgrounds and relationships and to provide strategies to establish germplasm collection, conservation and utilization (
Brown-Guedira et al. 2000;
Roussel et al. 2004).
Soybean accessions from Korea were more closely grouped with those of Japanese than those from China (
Griffin and Palmer 1995) and South Korean and Japanese populations were genetically distinct from the Chinese population (
Li and Nelson 2001;
Lee et al. 2011). Previous studies have used microsatellite or simple sequence repeats (SSR) markers to aid in the identification of genetic divergent accessions due to SSR marker effectiveness in genealogy analysis and in the assessment of genetic diversity among organisms (
Lee et al. 2008;
Li et al. 2009;
Narvel et al. 2000; Kuroda
et al. 2009).
There has been an increasing concern about the protein and oil content of soybeans in addition to their yield. Protein and oil percentages in soybean, which are influenced by both genotype and environmental cues, are approximately 40% and 20% on the average, respectively, comprising 85% unsaturated fatty acids and is free from cholesterol (
Aslam et al. 1995;
Singh et al. 2007). According to these two valued reasons, their cultivated types and cultivars differ greatly from each other, and both protein and oil content are quantitatively inherited in soybean (
Burton 1985;
Wilcox 1985). Breeders have been successful in manipulating these traits, but underlying highly diverse germplasm is needed to improve these components. Given the history of
G. max cultivation, soybean accessions present in Korean landrace germplasm collections may be highly diverse, with genotypes adapted for temperate conditions, which may be useful for breeding. The objectives of this work were to analyze the genetic diversity between Korean landrace and exotic germplasm of distinct geographic regions of the world, and also compare the content of protein, oil and fatty acid composition to use these data to collection and optimize germplasm management.
MATERIALS AND METHODS
Plant materials
A total of 185 soybean germplasm (
Glycine max (L.) Merr.) collected from different geographical countries were acquired from Agrobiodiversity Center (NAAS, RDA, Korea), that consisted with Korean landraces (KOR, 108 accessions), China (CHN, 25), Japan (JPN, 10), Indonesia (IDN, 19), Myanmar (MMR, 8), Philippines (PHL, 6) and United States of America (USA, 9). Accessions from USA were obtained from USDA Germplasm Resources Information Network of USA. The accession numbers are presented in
Table 1.
Genomic DNA was extracted from bulked samples of ten seedlings per accession using plant genomic DNA isolation kit (Qiagen). The DNA concentration was determined using a NanoDrop (ND-1000; NanoDrop, Wilmington, DE, USA). The final concentration of each DNA sample was adjusted to 20 ng/ul in TE buffer before conducting PCR. The M13-tail at the 5′-end region PCR method was used to measure the sizes of the amplified products (
Schuelke 2000). Genotyping was carried out using 72 genome-wide SSR markers listed in
Table 2. Amplified fluorescent-labeled PCR products were analyzed on an ABI-Prism 3130x1 Genetic Analyzer (Applied Biosystems). Fragments were sized and scored into alleles using Gene-Mapper v4.0 (Applied Biosystems).
The total number of alleles, allele frequency, gene diversity and polymorphism information content (PIC) per individual SSR locus were calculated with the PowerMarker version 3.25 (Liu and Muse 2005). The unweighted pair group method with an arithmetic mean (UPGMA) dendrogram was constructed to visualize the phylogenetic distribution of accessions using the software MEGA version 5.03 (
Tamura et al. 2007) embedded in PowerMarker. Principal co-ordinate analysis (PCoA) in (GenAlEx 6.0,
Peakall and Smouse 2006) was used to examine further the genetic relationships among detected populations on the basis of the SSR data.
About five grams of seeds were frozen in liquid nitrogen and ground into a fine powder using a mortar and a pestle, and 3 g of sample was used for analysis. The crude protein content was analyzed using the Kjeldahl method by Kjeltec 8400 analyzer unit (Foss, Sweden) and crude oil extraction was carried out in Foss soxhlet apparatus (Foss, Sweden) using hexane as solvents and calculated the amount of recovered lipid according to the supplement user’s manual.
Fatty acids composition
The fatty acid methyl esters (FAMEs) of the total lipid extract were prepared by the BF3 method (
Morrison and Smith 1964). The boron trifluoride-methanol solution (Sigma, St. Louis, MO) was added to a final concentration of 14%, and the solution was heated on a water bath at 70°C, shaken every 30 min, and cooled to room temperature. The FAMEs were separated by capillary gas chromatography (GC) to the retention times of standard fatty acids. GC analysis was performed on a HP 5890 system (Hewlett Packard, USA) by a flame ionization detector (FID). GC separation was performed on a capillary column (0.25 mm × 30 m, film 0.5 mm) of HP-INNOWAX (Hewlett Packard, USA). Each extraction (1 ul) was injected using the splitless injection method. The column temperature was initially 150°C, then raised to 200°C at a rate of 4°C/min, and finally held at 250°C for 5 min. The injection port was set at 250°C and detector was 300°C. Nitrogen gas was used as the carrier at a flow rate of 0.6 ml/min. Fatty acids were identified by comparing the gas chromatograph retention time of each peak with standard mixtures that were prepared by methylation similar to the sample preparation and the results calculated using the response area under each peak. Standard chemicals were obtained from Sigma-Aldrich (St. Louis, Mo, USA).
RESULTS
Variation in soybean populations
We assessed the genetic variability of 185 soybean germplasms of Korean landraces, and collections from China, Japan, India, Myanmar, Philippines, and USA. To detect genetic diversity among soybean germplasm accessions, we used 72 SSR markers distributed on 17 out of 20 molecular linkage groups of soybean (
Cregan et al. 1999; soybase (
http://soybase.org). The average number of alleles, the frequency of the major allele and gene diversity were given in
Table 2. A total of 784 alleles were detected among the 185 soybean accessions, with an average of 10.9 alleles per microsatellite locus, ranging from three to eight markers (Sat_397, Sct_034, Sct_064, Satt227, Satt255, Satt328, Satt578 and Satt599) to 31 for Sat_210. Compared with the findings of the previous report declaring the number of alleles per locus which is 10.8 among Korean accessions and 13.0 among Chinese accessions (
Lee et al. 2011), our result implicates high level of diversity in the germplasm we used. In general, higher values both of H
E and H
O revealed a higher genetic variability among the germplasm accessions. In this study, the mean value of H
E and H
O was 0.648 (ranging from 0.164 in Satt144 to 0.922 in Satt458) and 0.045 (ranging from 0.000 in Satt460 to 0.187 in Satt467), respectively. To determine the PIC values of each primer pair, we analyzed the mean PIC values for all loci. Result revealed a relatively high average value of 0.607 that ranged from 0.159 for Satt144 to 0.917 for Satt458 in all accessions with a greater number of polymorphic alleles.
Genetic diversity of three clusters was assessed using these markers (
Table 3). As a result, it was found that Cluster I (31 accessions) and Cluster III (36 accessions) had lower total number of allele, compared to those of Cluster II (118 accessions), because genetic diversity is influenced by sample size (
Leberg 2002). Our analysis also revealed the mean PIC values for each SSR locus in Cluster I, Cluster II and Cluster III which were 0.522, 0.554, and 0.577, respectively. Such, indicated that these clusters are undergoing similar genetic variation within, relative to each other. These results suggest that there is a rich genetic diversity within each cluster due to various germplasm collected from different geographical regions.
An UPGMA dendrogram was constructed from allele sharing statistics of 185 individuals from Korean landraces and geographically different six populations to evaluate the genetic differentiation and the genetic relationship (
Fig. 1A). UPGMA cluster analysis indicated that 185 soybean accessions formed into three clusters. Group I (31 accessions) is comprised of 24 from CHN, 5 from USA, 1 from KOR and 1 from PHL. Group II (118 accessions) contained 102 from KOR, 10 from JPN, 3 from USA, 2 from PHL and 1 from MMR. Group III (36 accessions) is composed of 19 from IDN, 7 from MMR, 5 from KOR, 3 from PHL, 1 from CHN and 1 from USA. Thus, taking into account the origin of accessions with most number in each cluster, Cluster I is mainly comprised of China accessions, majority of the accessions in Cluster II are Korean and Japanese accessions, while Cluster III is mainly composed of Southeast Asian accessions. This shows that Korean landraces were classified closely with those of Japanese, while they were distinctly different from Chinese and other exotic accessions. This suggests that there is almost correlation between the genetic relationships and different geographical environments of germplasm except USA accessions.
Three major clusters can be clustered among entire accessions, and then PCoA was performed to better understand genetic relationships. A two-dimensional scatter plot of the 185 accessions obtained from PCoA analysis is shown in
Fig. 1D. The first principal coordinate (PC1) accounted for 27.05% of the total variation and the second principal coordinate (PC2) explained 19.86% of the total variation. Soybean accessions scattered over the four quadrants. Although Korean soybean accessions were entirely distributed, all accessions were almost separated by the center of vertical axis according to their clustered groups. Of the 108 Korean accessions, ten were positioned in the right quadrant with the Chinese and other countries accessions. All of the Japanese accessions overlapped with the Korean accessions in the left quadrant while few Korean genotypes positioned at the center of the axis. The PCoA analysis was almost consistent with results of clustering by UPGMA dendrogram. In the PCoA analysis, Cluster II showed more genetic variations (50.6%) than those from Cluster I (47.8%) and Cluster III (48.9%), although this study used many accessions from Korea (
Table 3 and
Fig. 1D). These indicate that the accessions in Cluster I, II, and III are genetically different.
Crude protein and oil are the two major constituents of the soybean seeds. Raw whole soybeans contain 40% crude protein and 20% fat on a dry matter basis. The biochemical traits about crude protein, oil contents and fatty acid compositions were analyzed to compare their contents among the seven country of origin. The crude protein and oil content are given in
Table 4. The mean total protein value of tested germplasm was 38.7%, while the average oil content value was 17.6%. The mean crude protein and crude oil content of seven countries were as follows: CHN (38.9% and 19.2%), IDN (40.6% and 15.2%), JPN (37.4% and 16.3%), KOR (39.7% and 17.0%), MMR (40.3% and 18.5%), PHL (37.9% and 15.8%), and USA (36.4% and 21.4%) respectively. Although there was no significant difference between the contents and the countries, there was a negative correlation between oil and protein contents.
Elevating the high oleic acid content is one of the most important goals in soybean breeding because this fatty acid improves the nutrition and oxidative stability of the oil (
Lee et al. 2007;
Pham et al. 2010). Conversion of oleic acid to linoleic acid is catalyzed by the
FAD2 enzyme in the lipid biosynthetic pathway (
Okuley et al. 1994). Thus, we confirmed two fatty acids contents in our tested accessions to determine the relationship of the content between oleic acid and linoleic acid. The constituents of fatty acid are presented in
Table 4. The levels of the two compositions of fatty acids, oleic and linoleic acid, were as follows: CHN (18.8% and 44.7%), IDN (13.9% and 49.5%), JPN (18.8% and 43.1%), KOR (17.4% and 48.5%), MMR (16.6% and 45.5%), PHL (14.5% and 48.2%), and USA (16.9% and 48.5%), respectively. The ratio of oleic acid and linoleic acid observed was highest among IDN samples (1:3.6), while JPN samples obtained the lowest with 1:2.3, but the ratio of O/L did not differ significantly between the accessions from the seven countries. Although the oil levels in USA accessions is highest, the ratio of oleic and linoleic acid is similar to those of the other countries (
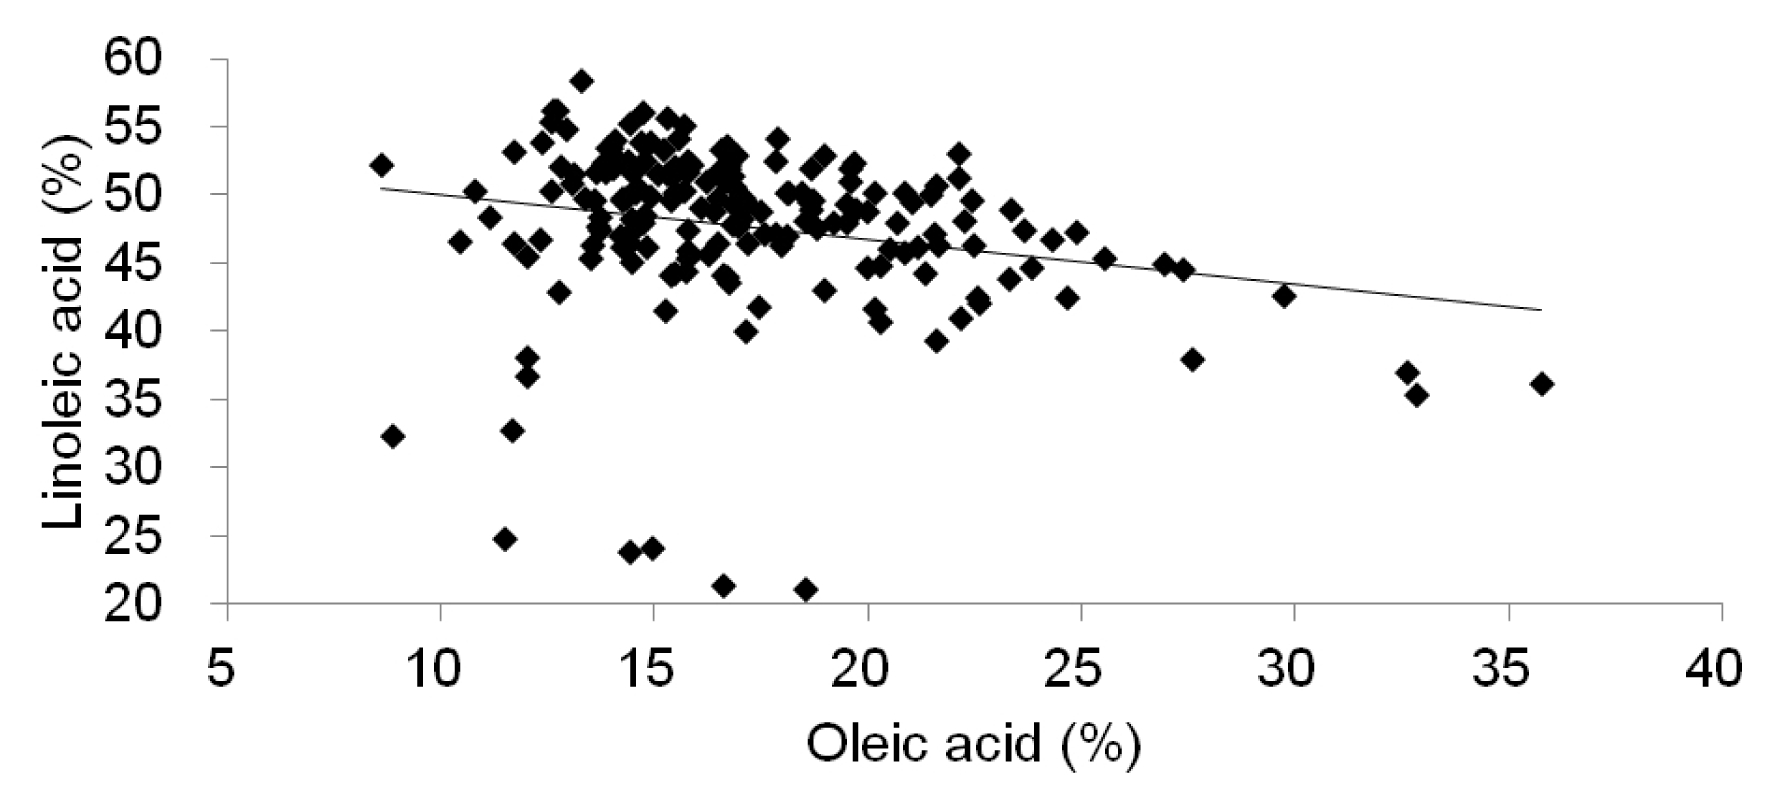
Table 4). This means that the oil content is not positively correlated with the contents of oleic acid and linoleic acid. We confirmed the changes of the linoleic acid content based on oleic acid content in 185 soybean accessions and the result showed that an increase in oleic acid levels corresponds to a decrease in linoeic acid levels (
Fig. 2). The relationships among these characters might be highly affected by their cultivar types according to the genetically different gene pool and environmental effects. Recently, it was reported that soybean lines had oleic acid content of approximately 70–80% of the oil (
Buhr et al. 2002;
Alt et al. 2005) and soybeans typically contain about 23% oleic acid. Among the tested germplasm, the crude protein content was highest in K154320 accession (IDN, 45.8%) followed by IT154239 accession (KOR, 45.6%). The K138303 (CHN) contained the highest (26.7%) crude oil level while IT173107 (JPN) had a highest (35.7%) oleic acid content. The ratio of the oleic and linoleic acid was 0.4:1 in K138303, while it was 0.9:1 in the IT173107 accessions (
Table 4).
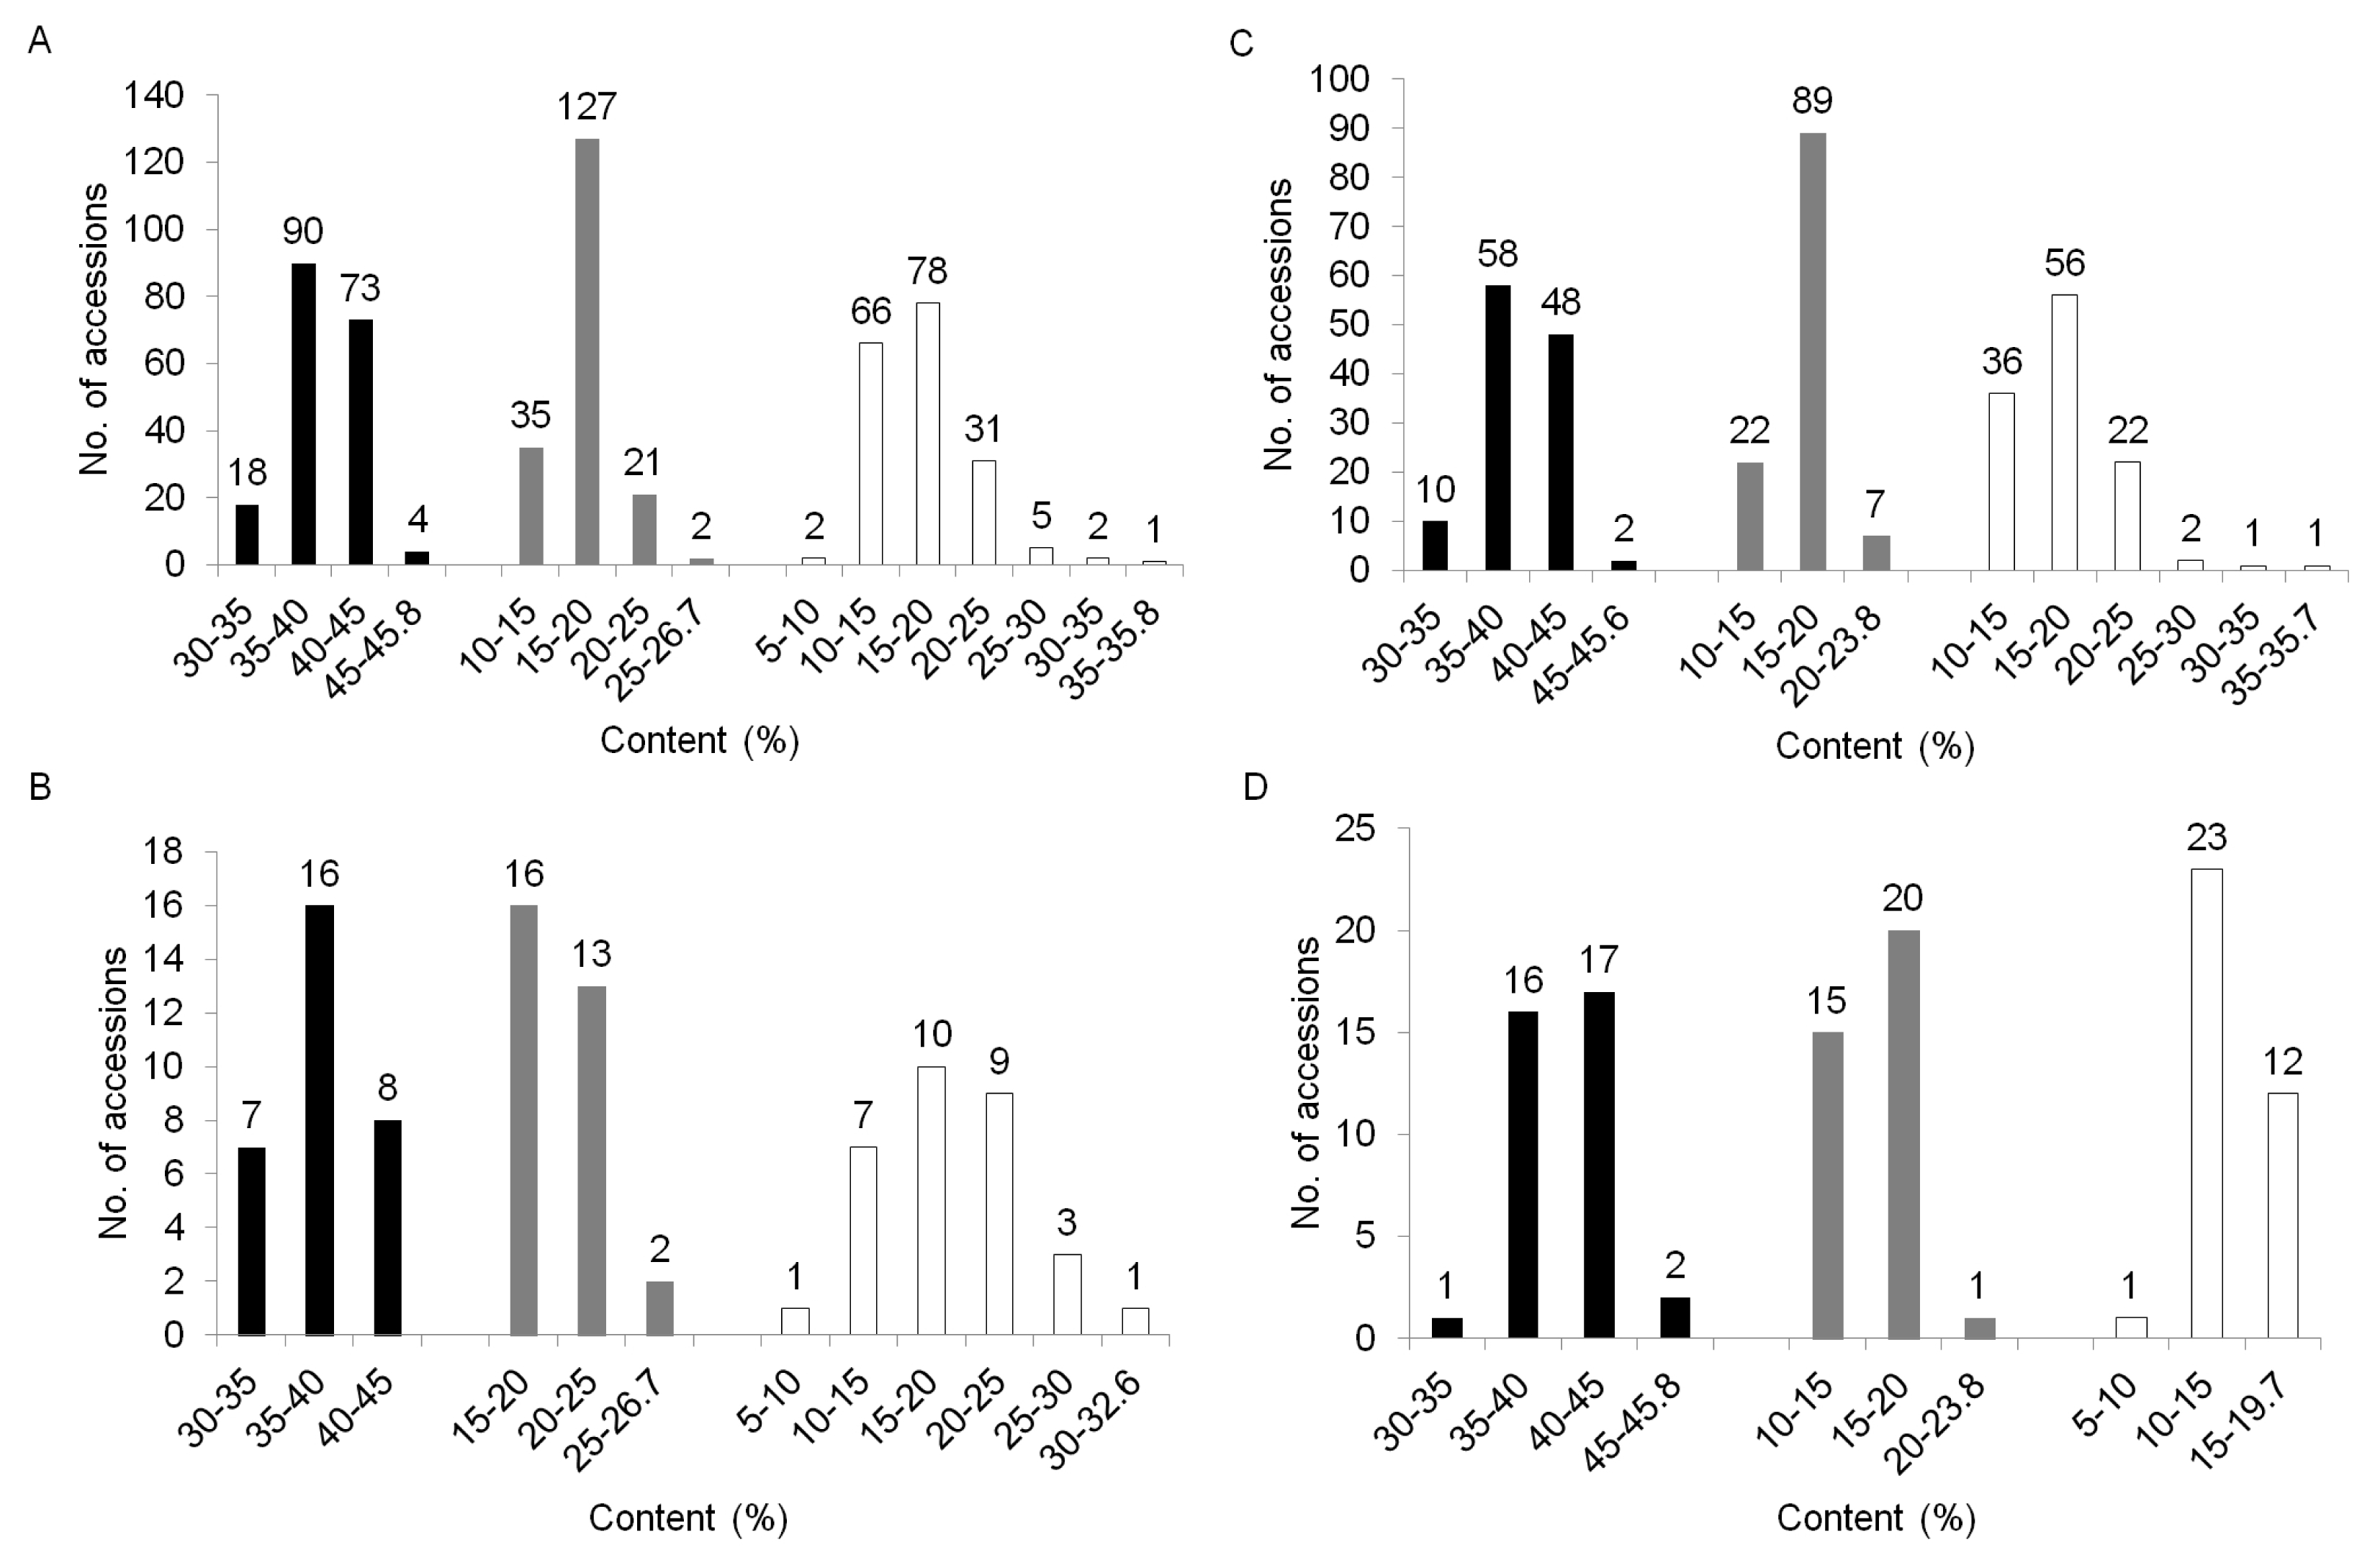
To compare the variation of biochemical contents among the three clusters, we performed the distribution of biochemical traits among these clusters. Cluster I showed an average content value which is 37.8% for crude protein, 20.3% for oil, and 18.9% for oleic acid. Cluster II had, on average, 39.4% crude protein, 17.0% oil and 17.5% oleic acid while Cluster III contained an average value of 40.6% for crude protein, 15.7% for oil, and 14.4% for oleic acid (data not shown). These germplasm confirmed no association between the patterns of accessions by SSR and their biochemical contents, such as crude protein, oil and oleic acid compositions. The variation of oil and oleic acid content were mixed and distributed throughout the three clusters (
Fig. 1B, C), but the crude protein content in Cluster II and III are higher on average than those of Cluster I, while Cluster I is higher in oil content than protein (
Fig. 3).
DISCUSSION
Soybean is widely known as a rich source of nutrients among other foods around the world because it contains higher levels of protein and oil. In addition, the high content of oleic acid, one of the fatty acid compositions, contributes to desirable odors and flavors to consumers (
Neff et al. 1999;
Lopez et al. 2000;
Pham et al. 2010). For this reason, continuously, breeders have tried to increase these contents. To do these, therefore, it is necessary to utilize the genetic resources with abundant genetic differentiation.
We analyzed the genetic diversity of 185 accessions from Korean landraces and various germplasm collections from different geographical regions using 72 SSR markers covering the 17 of 20 soybean linkage groups. Results revealed that the average number of alleles in every locus was 10.9. The PIC value, a reflection of allele diversity and frequency among germplasm, in the total population was 0.607 while the mean PIC value for each cluster was 0.522 for Cluster I, 0.554 for Cluster II, and 0.577 for Cluster III. The Cluster I (31 accessions) showed similar PIC to Cluster II (118 accessions) and Cluster III (36 accessions), which indicated that the three clusters have similar genetic variation within the cluster, relative to each other.
We also determine the genetic variation and patterns of phylogenetic relationship among Korean landraces and exotic germplasm using an UPGMA and PCoA analysis. Results indicated that the dendrogram representation of all analyzed loci, covering 17 of 20 soybean chromosomes, exhibits three groups, with a relative agreement according to geographic origin. Although some accessions indicated slightly mixing and overlapping regions on UPGMA and PCoA analysis, accessions from China, Korea and Southeast Asia clearly divided. Our study also showed that the major soybean gene pools from China and Korea have significant genetic differentiation similar with the previous reports (Lee
et al. 2003;
Lee et al. 2011;
Abe et al. 2003). We checked the association between classified clusters and biochemical traits of individual accession. Results revealed that the crude protein content in Cluster II and III are higher on average than those of Cluster I, while Cluster I is higher in oil content than protein. Likewise, UPGMA dendrogram did not indicate clear grouping of the accessions according to high or low oil content and oleic acid compositions. But it did reveal differences of the mean values of these contents among the clusters.
The high content of oleic acid contributes to the oxidative stability (
Neff et al. 1999;
Cahoon 2003;
Lopez et al. 2000) and increase the oil quality (
Wilson et al. 2001). In our study, in spite of high oil levels observed in some accessions, ratio of oleic and linoleic acid was found to be relatively low. This suggests that the high oleic acid content of soybeans was not affected by crude oil contents. The crude oil and fatty acid contents of soybeans could be affected by genotype as well as environment, farming practices, and other factors, such as seed colors. An inverse correlation between oleic (C18:1) and linoleic (C18:2) content was observed. Among the tested germplasms, K154320 was highest in crude protein (45.8%), K138303 in crude oil (26.7%) and IT173107 in oleic acid composition (35.7%). Since breeders have been successful in the development of soybean with an increased oleic acid and decreased linoleic acid in the oil, the traits verified in the genetic resources in this study will be useful for new functional plant breeding in soybean crop and can provide flexibility in a breeding program involving both high protein and high oil selections.
Fig. 1The profiles showing genetic relationships among 185 soybean (G. max) accessions collected from seven countries. (A) An UPGMA dendrogram based on 72 SSR markers; (B) Distribution of accessions with high and low oil content based on UPGMA dendrogram. Circle; black (●) - more than 23% and white (○) - less than 15%. (C) Distribution of accessions with high and low oleic acid content based on UPGMA dendrogram. Quadrangle; black (■) - more than 24% and white (□) - less than 15%; (D) A scatter of principal coordinate analysis (PCoA).
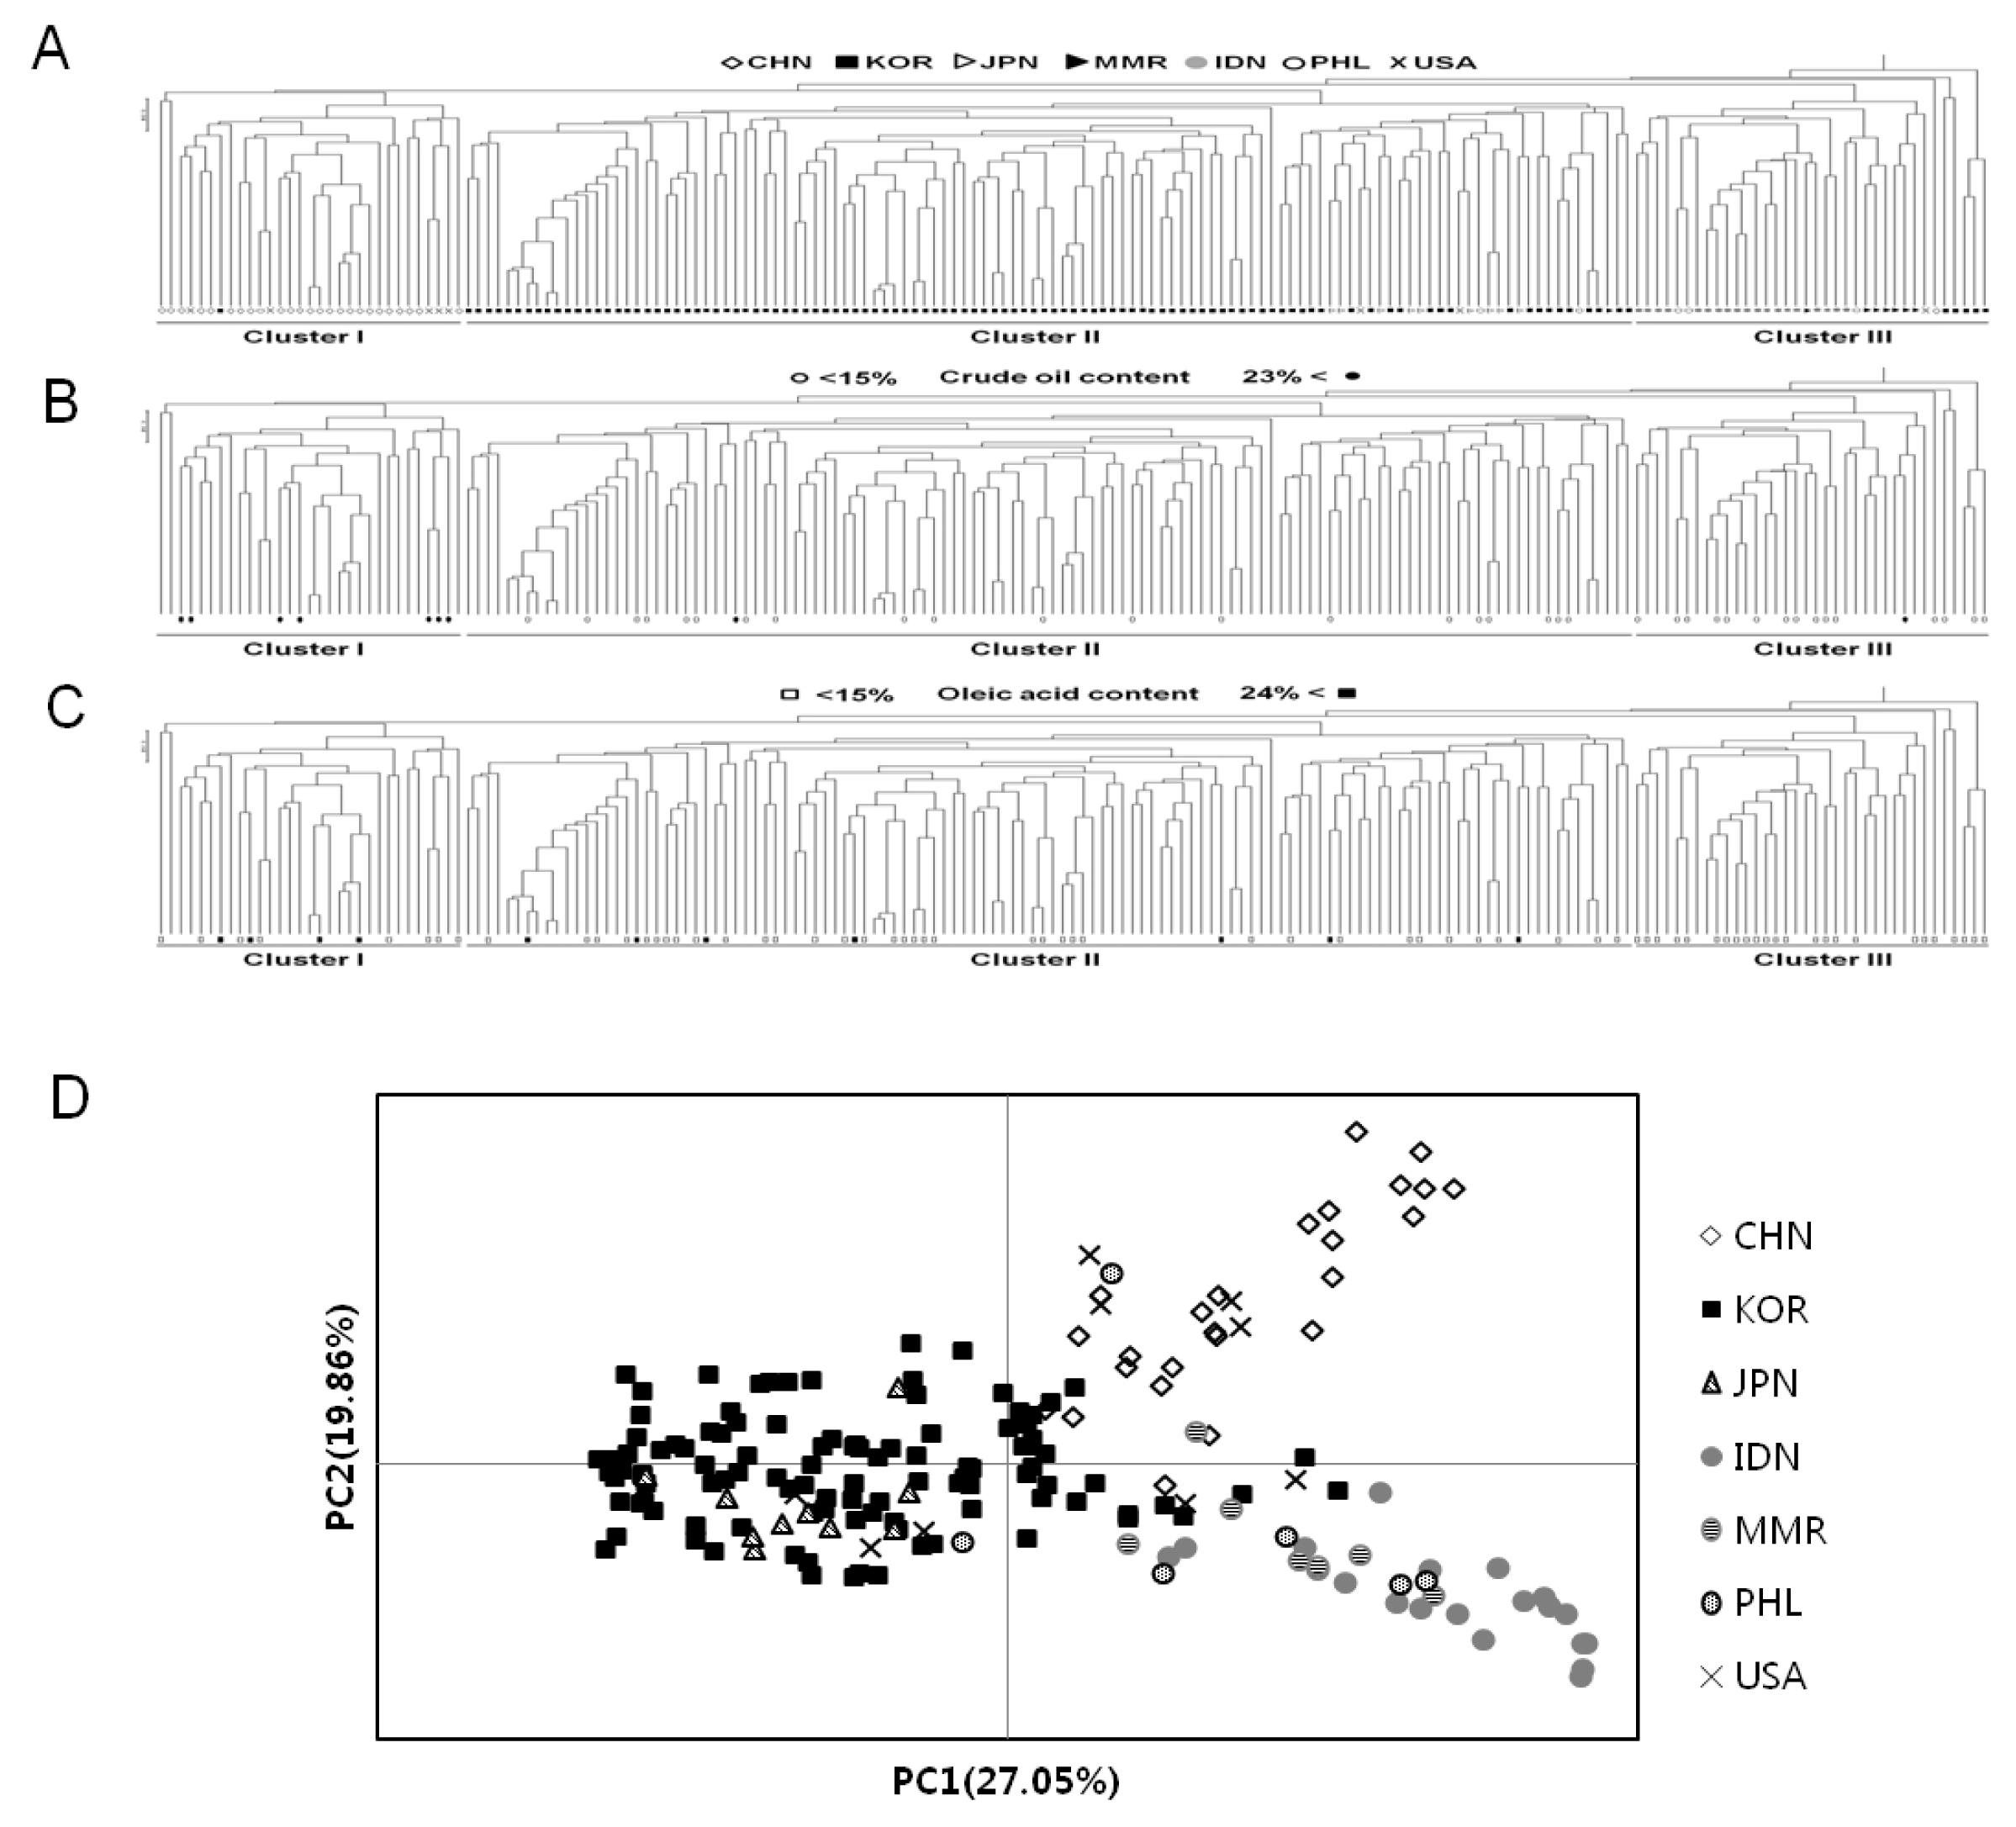
Fig. 2Distribution of 185 soybean accessions according to oleic and linoleic acid contents.

Fig. 3Distribution of crude protein, oil, and oleic acid contents within each cluster based UPGMA dendrogram. A; Total accessions, B; Cluster I (n=31), C; Cluster II (n=118), and D; Cluster III (n=36). Bar; black - crude protein, gray- oil, white - oleic acid.

Table 1Accession number of 185 soybean germplasm of Agrobiodiversity Center (NAAS, RDA, Korea) investigated in present study.
Table 1
|
China (CHN, n†=25) |
IT24325 |
IT161532 |
IT165316 |
IT171005 |
IT171033 |
IT171107 |
IT171195 |
IT213025 |
|
IT216056 |
K136395 |
K138286 |
K138303 |
K138304 |
K149848 |
K160329 |
IT22803 |
|
IT161491 |
IT161509 |
IT161610 |
IT161618 |
IT161623 |
IT162192 |
IT162269 |
IT162626 |
|
IT161437 |
|
|
|
|
|
|
|
|
|
Korea (KOR, n=108) |
IT142772 |
IT24612 |
IT104201 |
IT113179 |
IT142773 |
IT154209 |
IT154239 |
IT154333 |
|
IT154481 |
IT154609 |
IT154640 |
IT154703 |
IT177330 |
IT177508 |
IT177643 |
IT181727 |
|
K135196 |
K135547 |
K135558 |
K135630 |
K147292 |
K147387 |
K150200 |
K159334 |
|
K159361 |
K159399 |
IT226756 |
IT226763 |
IT226770 |
IT226803 |
IT226805 |
IT226811 |
|
IT226813 |
IT226847 |
IT226853 |
IT226863 |
IT226869 |
IT226871 |
IT226872 |
IT228234 |
|
IT228247 |
IT228256 |
IT228257 |
IT228260 |
IT228305 |
IT228322 |
IT228349 |
IT228362 |
|
IT228369 |
IT228375 |
IT228396 |
IT228397 |
IT228404 |
IT228430 |
IT228432 |
IT228438 |
|
IT228445 |
IT228463 |
IT228479 |
IT228494 |
IT228497 |
IT228498 |
IT228499 |
IT228514 |
|
IT228516 |
IT228528 |
IT228538 |
IT228546 |
IT228550 |
IT228554 |
IT228583 |
IT228589 |
|
IT228591 |
IT228601 |
IT228603 |
IT230156 |
IT230173 |
IT230205 |
IT230206 |
IT230208 |
|
K132278 |
K132332 |
K132474 |
K132493 |
K132547 |
K132559 |
K132571 |
K132592 |
|
K132609 |
K132626 |
K132657 |
K132726 |
K132737 |
K132764 |
K132768 |
K132771 |
|
K132830 |
K132862 |
K132982 |
K132998 |
K133048 |
K133078 |
K133109 |
IT228346 |
|
IT228347 |
IT228350 |
IT228358 |
IT228622 |
|
|
|
|
|
|
India (IDN, n=19) |
K154112 |
K154152 |
K154155 |
K154157 |
K154164 |
K154196 |
K154202 |
K154213 |
|
K154231 |
K154232 |
K154255 |
K154304 |
K154320 |
K154324 |
K154331 |
K154340 |
|
K154341 |
K154361 |
K154366 |
|
|
|
|
|
|
|
Japan (JPN, n=10) |
IT120612 |
IT135747 |
IT142879 |
IT143193 |
IT160955 |
IT173107 |
K149902 |
K149903 |
|
K152388 |
K158218 |
|
|
|
|
|
|
|
|
Myanmar (MMR, n=8) |
K154258 |
K158189 |
K158190 |
K158192 |
K158196 |
K158198 |
K158206 |
K159270 |
|
|
Philippines (PHL, n=6) |
K154032 |
K154054 |
K154067 |
K154044 |
K154051 |
K154057 |
|
|
|
|
USA (n=9) |
IT23746 |
IT23748 |
IT23751 |
IT23765 |
IT171235 |
IT142907 |
IT165085 |
K157072 |
|
IT161394 |
|
|
|
|
|
|
|
Table 2Genetic parameters obtained from the 72 SSR markers that were used to evaluate 185 soybean accessions.
Table 2
|
Chr. No.*
|
Linkage group |
Marker |
NA†
|
HE‡
|
HO§
|
PIC¶
|
|
1 |
D1a |
Satt077 |
10.0 |
0.536 |
0.027 |
0.497 |
|
Satt179 |
13.0 |
0.736 |
0.059 |
0.713 |
|
Satt184 |
10.0 |
0.733 |
0.094 |
0.695 |
|
Satt531 |
9.0 |
0.500 |
0.055 |
0.409 |
|
|
2 |
D1b |
Satt157 |
28.0 |
0.903 |
0.076 |
0.896 |
|
Satt558 |
9.0 |
0.732 |
0.033 |
0.690 |
|
Satt634 |
7.0 |
0.489 |
0.022 |
0.442 |
|
|
3 |
N |
Satt255 |
3.0 |
0.604 |
0.061 |
0.534 |
|
Satt339 |
12.0 |
0.811 |
0.049 |
0.788 |
|
|
4 |
C1 |
Satt164 |
10.0 |
0.671 |
0.049 |
0.631 |
|
Satt565 |
8.0 |
0.731 |
0.060 |
0.682 |
|
Satt578 |
3.0 |
0.541 |
0.027 |
0.435 |
|
|
5 |
A1 |
Sat_137 |
16.0 |
0.866 |
0.033 |
0.853 |
|
Sat_374 |
26.0 |
0.909 |
0.051 |
0.903 |
|
Satt599 |
3.0 |
0.372 |
0.055 |
0.317 |
|
Satt684 |
8.0 |
0.769 |
0.038 |
0.730 |
|
|
6 |
C2 |
Sat_336 |
17.0 |
0.826 |
0.072 |
0.812 |
|
Satt227 |
3.0 |
0.462 |
0.027 |
0.374 |
|
Satt277 |
25.0 |
0.868 |
0.081 |
0.859 |
|
Satt357 |
7.0 |
0.577 |
0.016 |
0.489 |
|
Satt363 |
13.0 |
0.735 |
0.071 |
0.700 |
|
Satt432 |
7.0 |
0.207 |
0.016 |
0.201 |
|
Satt460 |
11.0 |
0.648 |
0.000 |
0.622 |
|
Satt520 |
8.0 |
0.648 |
0.038 |
0.588 |
|
|
7 |
M |
Sat_003 |
19.0 |
0.912 |
0.022 |
0.905 |
|
Satt175 |
14.0 |
0.822 |
0.038 |
0.804 |
|
Satt245 |
9.0 |
0.681 |
0.038 |
0.627 |
|
Satt250 |
8.0 |
0.614 |
0.043 |
0.554 |
|
Satt323 |
8.0 |
0.626 |
0.038 |
0.589 |
|
Satt540 |
15.0 |
0.786 |
0.060 |
0.758 |
|
Satt567 |
4.0 |
0.504 |
0.028 |
0.430 |
|
Satt618 |
4.0 |
0.533 |
0.038 |
0.482 |
|
|
9 |
K |
Satt046 |
13.0 |
0.839 |
0.076 |
0.820 |
|
Satt518 |
11.0 |
0.705 |
0.092 |
0.657 |
|
Satt539 |
4.0 |
0.472 |
0.027 |
0.395 |
|
|
10 |
O |
Satt173 |
17.0 |
0.892 |
0.049 |
0.883 |
|
Satt478 |
19.0 |
0.893 |
0.120 |
0.883 |
|
|
12 |
H |
Satt142 |
7.0 |
0.662 |
0.043 |
0.595 |
|
Satt302 |
8.0 |
0.530 |
0.034 |
0.462 |
|
Satt317 |
8.0 |
0.527 |
0.056 |
0.421 |
|
Satt434 |
18.0 |
0.788 |
0.043 |
0.769 |
|
Satt629 |
5.0 |
0.588 |
0.049 |
0.525 |
|
|
13 |
F |
Satt144 |
4.0 |
0.164 |
0.011 |
0.159 |
|
|
14 |
B2 |
Satt020 |
9.0 |
0.458 |
0.049 |
0.439 |
|
Satt168 |
10.0 |
0.715 |
0.027 |
0.677 |
|
Satt467 |
8.0 |
0.456 |
0.187 |
0.403 |
|
Satt556 |
14.0 |
0.683 |
0.046 |
0.632 |
|
Sct_034 |
3.0 |
0.626 |
0.038 |
0.550 |
|
Sct_064 |
3.0 |
0.320 |
0.005 |
0.272 |
|
|
16 |
J |
Satt285 |
9.0 |
0.617 |
0.005 |
0.545 |
|
|
17 |
D2 |
Satt154 |
17.0 |
0.786 |
0.049 |
0.765 |
|
Satt301 |
22.0 |
0.798 |
0.077 |
0.787 |
|
Satt310 |
9.0 |
0.583 |
0.033 |
0.515 |
|
Satt328 |
3.0 |
0.232 |
0.038 |
0.220 |
|
Satt372 |
9.0 |
0.740 |
0.090 |
0.706 |
|
Satt413 |
8.0 |
0.569 |
0.005 |
0.510 |
|
Satt458 |
27.0 |
0.922 |
0.103 |
0.917 |
|
|
18 |
G |
Sat_163 |
21.0 |
0.894 |
0.033 |
0.885 |
|
Sat_210 |
31.0 |
0.921 |
0.057 |
0.916 |
|
Satt570 |
6.0 |
0.498 |
0.033 |
0.464 |
|
|
19 |
L |
Sat_150 |
20.0 |
0.739 |
0.006 |
0.710 |
|
Sat_397 |
3.0 |
0.319 |
0.016 |
0.271 |
|
Satt166 |
8.0 |
0.665 |
0.005 |
0.608 |
|
Satt229 |
12.0 |
0.815 |
0.038 |
0.791 |
|
Satt313 |
9.0 |
0.721 |
0.011 |
0.679 |
|
Satt398 |
14.0 |
0.839 |
0.060 |
0.821 |
|
Satt481 |
6.0 |
0.367 |
0.022 |
0.335 |
|
Satt561 |
4.0 |
0.524 |
0.005 |
0.413 |
|
|
20 |
I |
Satt127 |
9.0 |
0.456 |
0.044 |
0.439 |
|
Satt239 |
10.0 |
0.657 |
0.049 |
0.617 |
|
Satt292 |
8.0 |
0.569 |
0.032 |
0.544 |
|
Satt496 |
11.0 |
0.753 |
0.049 |
0.719 |
|
|
Mean |
|
|
10.9 |
0.648 |
0.045 |
0.607 |
Table 3Summary statistics for the total population and clusters of soybeans based on 72 loci data.
Table 3
|
Clusters |
No. of accessions |
NT†
|
NA‡
|
PIC§
|
PC1/PC2¶
|
|
Total |
185 |
784 |
10.9 |
0.607 |
27.1/19.9 |
|
Cluster I |
31 |
395 |
5.5 |
0.522 |
31.4/16.4 |
|
Cluster II |
118 |
609 |
8.5 |
0.554 |
28.8/21.8 |
|
Cluster III |
36 |
493 |
6.8 |
0.577 |
28.1/20.8 |
Table 4Difference in crude protein, oil and fatty acid composition in 185 soybean accessions collected from different countries.
Table 4
|
Country |
Crude protein (%) |
Oil content (%) |
Fatty acid composition |
|
|
Palmitic (%) |
Stearic (%) |
Oleic (%) |
Linoleic (%) |
Linolenic (%) |
|
|
|
|
|
|
|
|
Mean |
Max. |
Min. |
Mean |
Max. |
Min. |
Mean |
Max. |
Min. |
Mean |
Max. |
Min. |
Mean |
Max. |
Min. |
Mean |
Max. |
Min. |
Mean |
Max. |
Min. |
|
CHN |
38.9±3.3 |
45.0 |
32.2 |
19.2±3.1 |
26.7 |
12.5 |
11.2±1.5 |
14.3 |
7.8 |
3.9±0.8 |
5.6 |
2.9 |
18.8±5.3 |
32.6 |
8.9 |
44.7±6.7 |
53.4 |
24.2 |
7.2±1.9 |
11.3 |
4.0 |
|
IDN |
40.6±2.8 |
45.8 |
36.3 |
15.2±1.5 |
18.1 |
13.4 |
10.6±1.0 |
12.2 |
8.7 |
3.7±0.6 |
5.4 |
2.8 |
13.9±2.2 |
19.5 |
8.6 |
49.5±3.0 |
55.0 |
42.9 |
13.0±1.8 |
15.9 |
9.6 |
|
JPN |
37.4±3.9 |
43.9 |
32.4 |
16.3±2.2 |
21.0 |
13.7 |
11.4±2.0 |
14.1 |
7.3 |
4.2±0.8 |
5.5 |
2.6 |
18.8±8.7 |
35.7 |
11.5 |
43.1±9.1 |
53.0 |
24.9 |
7.8±2.1 |
11.3 |
4.0 |
|
KOR |
39.7±2.8 |
45.6 |
31.1 |
17.0±2.1 |
23.8 |
11.1 |
10.8±1.2 |
13.9 |
6.8 |
3.6±0.9 |
6.5 |
2.3 |
17.4±3.6 |
29.7 |
10.5 |
48.5±4.7 |
58.4 |
23.9 |
8.1±1.5 |
14.5 |
3.8 |
|
MMR |
40.3±2.8 |
43.9 |
34.4 |
18.5±2.3 |
23.8 |
15.7 |
11.7±0.5 |
12.2 |
10.4 |
3.3±0.5 |
4.1 |
2.6 |
16.6±1.7 |
19.7 |
14.7 |
45.5±14.6 |
56.1 |
21.1 |
8.9±1.9 |
11.7 |
6.0 |
|
PHL |
37.9±3.9 |
42.8 |
32.7 |
15.8±2.9 |
21.7 |
13.6 |
11.1±0.6 |
12.0 |
10.3 |
4.0±0.4 |
4.6 |
3.6 |
14.5±0.8 |
15.7 |
13.5 |
48.2±1.5 |
50.3 |
45.3 |
12.0±2.5 |
15.1 |
8.2 |
|
USA |
36.4±2.8 |
39.8 |
31.0 |
21.4±2.7 |
24.6 |
17.3 |
13.3±1.9 |
16.0 |
11.0 |
4.6±1.2 |
6.7 |
2.9 |
16.9±3.8 |
23.3 |
12.4 |
48.5±4.7 |
55.2 |
42.4 |
7.4±1.8 |
10.3 |
5.0 |
|
|
|
|
Mean |
38.7±1.5 |
17.6±2.1 |
11.4±0.9 |
3.9±0.4 |
16.6±1.8 |
46.9±2.3 |
9.3±2.2 |
References
- Abe J, Xu DH, Suzuki Y, Kanazawa A, Shimamoto Y. 2003. Soybean germplasm pools in Asia revealed by nuclear SSRs. Theor Appl Genet. 106: 445-453.
- Alt JL, Fehr WR, Welke GA, Shannon JG. 2005. Transgressive segregation for oleate content in three soybean populations. Crop Sci. 45: 2005-2007.
- Aslam M, Mirza MS, Shah SM, Shafeeq S, Ullah N. 1995. Crop production. Bulletin No. 6. Pak. Agric. Res. Council. Islamabad, Pakistan: pp. 1.
- Bonato ALV, Calvo ES, Geraldi IO, Arias CAA. 2006. Genetic similarity among soybean (Glycine max (L) Merrill) cultivars released in Brazil using AFLP markers. Genet Mol Biol. 29: 692-704.
- Brown-Guedira GL, Thompson JA, Nelson RL, Warburton ML. 2000. Evaluation of genetic diversity of soybean introductions and North American ancestors using RAPD and SSR markers. Crop Sci. 40: 815-823.
- Burton JW. 1985. Breeding soybeans for improved protein quantity and quality. Shibles R, editor. Proc 3rd World Soybean Res Conf. Westview Press. Boulder/CO: pp. 361-367.
- Buhr T, Sato S, Ebrahim F, Xing A, Zhou Y, Mathiesen M, Schweiger B, Kinney A, Staswick P, Clemente T. 2002. Ribozyme termination of RNA transcripts down-regulate seed fatty acid genes in transgenic soybean. Plant J. 30: 155-163.
- Cahoon EB. 2003. Genetic enhancement of soybean oil for industrial uses: prospects and challenges. AgBioForum. 6: 11-13.
- Carter TE, Nelson RL, Sneller CH, Cui Z. 2004. Soybeans: Improvement, production, and uses. pp. 303-416. Boerma HR, Specht JE, editors. Agron Mongr 16. ASA, CSSA, and SSSA. Madison, WI.
- Cregan PB, Jarvik T, Bush AL, Shoemaker RC, Lark KG, Kahler AL, Kaya N, vanToai TT, Lohnes DG, Chung J, Specht JE. 1999. An integrated genetic linkage map of the soybean genome. Crop Sci. 39: 14641490
- Cui Z, Carter TE, Burton JW. 2000. Genetic diversity patterns in Chinese soybean cultivars based on coefficient of parentage. Crop Sci. 40: 1780-1793.
- Cui Z, Carter TE, Burton JW, Wells R. 2001. Phenotypic diversity of modern Chinese and North American soybean cultivars. Crop Sci. 41: 1954-1967.
- Dong YS, Zhuang BC, Zhao LM, Sun H, He MY. 2001. The genetic diversity of annual wild soybeans grown in China. Theor Appl Genet. 103: 98-103.
- Griffin JD, Palmer RG. 1995. Variability of thirteen isozyme loci in the USDA soybean germplasm collections. Crop Sci. 35: 897-904.
- Hyten DL, Song Q, Zhu Y, Choi IY, Nelson RL, Costa JM, Specht JE, Shoemaker RC, Cregan PB. 2006. Impacts of genetic bottlenecks on soybean genome diversity. Proc Natl Acad Sci USA. 103: 16666-16671.
- Lee JD, Bilyeu KD, Shannon JG. 2007. Genetics and breeding for modified fatty acid profile in soybean seed oil. Crop Sci Biotech. 10: 201-210.
- Lee JD, Yu JK, Hwang YH, Blake S, So YS, Lee GJ, Nguyen HT, Shannon JG. 2008. Genetic diversity of wild soybean (Glycine soja Sieb. & Zucc.) accessions from South Korea and other countries. Crop Sci. 48: 606-616.
- Lee JD, Vuong TD, Moon H, Yu J-K, Nelson RL, Nguyen HT, Shannon JG. 2011. Genetic Diversity and Population Structure of Korean and Chinese Soybean [Glycine max (L.) Merr.] Accessions. Crop Sci. 51: 1080-1088.
- Leberg PL. 2002. Estimating allelic richness: Effects of sample size and bottlenecks. Mol Ecol. 11: 2445-2449.
- Li Z, Nelson RL. 2001. Genetic diversity among soybean accessions from three countries measured by RAPDs. Crop Sci. 41: 1337-1347.
- Li XH, Wang KJ, Jia JZ. 2009. Genetic diversity and differentiation of Chinese wild soybean germplasm (G. soja Sieb. & Zucc.) in geographical scale revealed by SSR markers. Plant Breed. 128: 658-664.
- Lopez Y, Nadaf HL, Smith OD, Connell JP, Reddy AS, Fritz AK. 2000. Isolation and characterization of the delta 12-fatty acid desaturase in peanut (Arachis hypogaea L.) and search for polymorphisms for the high-oleate trait in Spanish market-type lines. Theor Appl Genet. 101: 1131-1138.
- Morrison WR, Smith LM. 1964. Preparation of fatty acid methyl esters and dimethylacetals from lipids with boron fluoride-methanol. J Lipid Res. 5: 600-608.
- Mulato BM, Moller M, Zucchi MI, Quecini V, Pinheiro JB. 2010. Genetic diversity in soybean germplasm identified by SSR and EST-SSR markers. Pesq agropec bras Brasília. 45: 276-283.
- Narvel JM, Fehr WR, Chu WS, Grant D, Shoemaker RC. 2000. Simple sequence repeat diversity among soybean plant introductions and elite genotypes. Crop Sci. 40: 1452-1458.
- Neff WE, List GR. 1999. Oxidative stability of natural and randomized high-palmitic- and high-stearic-acid oils from genetically modified soybean varieties. J Am Oil Chem Soc. 76: 825-831.
- Okuley J, Lightner J, Feldmann K, Yadav N, Lark E, Browse J. 1994. Arabidopsis FAD2 gene encodes the enzyme that is essential for polyunsaturated lipid synthesis. Plant Cell. 6: 147-158.
- Peakall R, Smouse PE. 2006. GENEALEX 6; Genetic analysis in Excel. Population genetic software for teaching and research. Mol Ecol Notes. 6: 288-295.
- Pham AT, Lee JD, Shannon JG, Bilyeu KD. 2010. Mutant alleles of FAD2-1A and FAD2-1B combine to produce soybeans with the high oleic acid seed oil trait. BMC Plant Biol. 10: 195
- Priolli RHG, Mendes-Junior CT, Arantes NE, Contel EPB. 2002. Characterization of Brazilian soybean cultivars using microsatellite markers. Genet Mol Biol. 25: 185-193.
- Roussel V, Koenig J, Bechert M, Balfouriter F. 2004. Molecular diversity in French bread wheat accessions related to temporal trends and breeding programmes. Theor Appl Genet. 108: 920-930.
- Schuelke M. 2000. An economic method for the fluorescent labeling of PCR fragments. Nat Biotechnol. 18: 233-234.
- Simoons F. 1991. Food in China: a cultural and historical inquiry. Boca Raton, FL: CRC Press.
- Singh RJ, Nelson RL, Chung GH. 2007. Soybean (Glycine max (L.) Merr.). Singh RJ, editor. Genetic resources, chromosome engineering, and crop improvement. Vol. 4 Oilseed crops. Boca Raton Florida: CRC Press. pp. 13-50.
- Tamura K, Dudley J, Nei M, Kumar S. 2007. MEGA4: molecular evolutionary genetics analysis (MEGA) software version 4.0. Mol Biol Evol. 24: 1596-1599.
- Wilcox JR. 1985. Breeding soybeans for improved oil quantity and quality. Shibles R, editor. Proc 3rd World Soybean Res Con. Westview Press. Boulder/CO: pp. 380-386.
- Wilson RF, Marquardt TC, Novitzky WP, Burton JW, Wilcox JR, Dewey RE. 2001. Effect of alleles governing 16:0 concentration on glycerolipid composition in developing soybeans. J Am Oil Che Soc. 78: 329-334.