Abstract
Eating and cooking qualities are the most important trait in japonica rice breeding program. In this study, we performed genetic analysis to identify quantitative trait loci (QTLs) related to eating quality using 182 recombinant inbred lines (RILs) derived from a cross between two japonica cultivars, ‘Ilpumbyeo’ and ‘Moroberekan’. Parameters for eating quality being investigated include alkali digestive value (ADV) and amylose content (AC) for physico-chemical properties, glossiness of cooked rice (GCR), and six paste viscosity properties, peak viscosity (PV), hot-paste viscosity (HPV), cool-paste viscosity (CPV), breakdown (BD), setback (SB), and consistency viscosity (CSV) in RILs. This study revealed 28 QTLs on chromosomes 1, 3, 4, 5, 6, 7, 8, 9, and 10. Two QTL regions on chromosomes 3 and 6 were clustered with QTLs for physico-chemical property, GCR, and paste viscosity. The QTL loci for ADV, AC, GCR, PV, HPV, CPV, BD, SB, and CSV of paste viscosity properties in wx locus on chromosome 6 are the most important region for improving the texture of cooked rice. Three QTLs for PV, BD, and SB were detected on chromosome 9. PV and BD were highly positively correlated while SB showed high negative correlation with PV and BD. The QTLs for PV, BD, and SB are important to develop high eating quality rice lines of delayed retrogradation of cooked rice. Seven QTL-NILs substituted with Ilpumbyeo genetic background in most loci except for qLB4.2 for leaf blast resistance from Moroberekan allele, are expected to improve cooking and eating quality in japonica rice.
-
Key words: Rice, Japonica, Eating quality, QTL, Paste viscosity property
INTRODUCTION
Rice (
Oryza sativa L.) is the most important crop utilized as staple food. In Korea, the two priority traits in rice production are high yield and good eating quality. Grain yield has been dramatically improved over the past several decades. However, far more improvements in grain quality are needed to meet the demand of consumers. Eating quality has usually been evaluated using sensory tests but this is difficult to perform in early generations of F
3 to F
5 populations due to the requirement for several hundred grams of milled rice and well-trained specialists. It has been suggested that amylose content is related to specific aspects of eating quality, such as glossiness and stickiness (
Juliano et al. 1965;
Tanaka et al. 2006) and that the amylose content was mainly controlled by the waxy (
Wx) gene located on chromosome 6 (
Ishima et al. 1974). The eating quality of rice is therefore under complex genetic control (
Yamamoto and Ogawa 1992), but is also influenced by environmental factors, such as the air temperature during the ripening period (
Nishimura et al. 1985) and the nitrogen levels in the soil (
Ishima et al. 1974). Physicochemical characteristics such as the alkali digestion value (ADV), amylose content (AC), protein content (PC), and amylographic characteristics of polished rice are alternative indirect methods for determining rice eating quality, particularly when selecting for this trait in early generations. Cooking and eating quality is widely considered as a major criterion for the grain quality, mainly determined by three physical and chemical indices, amylose content (AC) (
Juliano 1985), gel consistency (GC) (
Cagampang et al. 1973), and gelatinization temperature (GT) (
Little et al. 1958). In the past decades, many scientists focused on the genetic natures of these physiochemical indices to identify the genes controlling grain quality (
Bao et al. 2002;
Fan et al. 2005;
He et al. 1999;
Septiningshi et al. 2003;
Tan et al. 1999;
Tian et al. 2005;
Wang et al. 2007). AC and GC were largely determined by
Wx gene, located on chromosome 6 encoding the granule-bound starch synthase quality (
Fan et al. 2005;
He et al. 1999;
Septiningshi et al. 2003;
Tan et al. 1999;
Tian et al. 2005;
Wang et al. 2007). Similarly, GT was mainly controlled by
ALK (or
SSII-3) gene (
He et al. 1999), encoding soluble starch synthase IIa (
Umemoto et al. 2002).
Recently, the rice starch viscosity profile, also termed the RVA profile (because it is tested on the Rapid Visco Analyser, RVA), was employed to evaluate rice eating and cooking quality (
Juliano 1996). The RVA profile is a pasting curve generated from rice flour when the latter is subjected to a standard temperature-programmed heat-hold-cool-hold protocol. The RVA profile has proved useful in the estimation of rice eating and cooking quality in rice breeding programs (
Juliano 1996;
Shu et al. 1998;
Bao and Xia 1999). By analyzing the relationship between RVA profiles and other eating quality parameters,
Shu et al. (1998) found that both setback viscosity (SB) and consistency viscosity (Con) had a significantly positive correlation with the apparent amylose content but a negative correlation with the adhesiveness of cooked rice.
In the study presented here, a recombinant inbred lines (RILs) population derived from a temperate japonica-tropical japonica combination and its genetic linkage map were employed to locate the locus underlying six parameters of RVA profiles. Additionally, the genes controlling grain RVA profile parameters without the effect of Wx were identified and verified with QTL-NILs.
MATERIALS AND METHODS
Plant materials
A RIL population consisting of 182 recombinant inbred lines was used in this study. This population was developed through single-seed descent (SSD) method from F
1 between Ilpumbyeo and Moroberekan. Ilpumbyeo is temperate
japonica rice cultivar of high eating quality and is susceptible to blast which was developed from Suweon295-sv3 crossed with Inabawase (
RDA 1990). Moroberekan is a tropical
japonica from West Africa known for its high eating quality and resistance to blast (
Wang et al. 1994). The F
1 plants were self-pollinated to produce F
2 seeds, and 182 F
10 lines were developed from the resultant F
2 plants via SSD method. This RIL population was continuously advanced to F
11, and 182 RILs were selected to construct a saturated genetic linkage map using simple sequence repeat (SSR) markers. Two parents and the RIL population were planted in two rows in Suwon, Korea on May 27, 2010. Twenty rice plants of each line were harvested in the middle of October and were used to evaluate the chemical properties and RVA profile related to eating quality, and to detect QTLs for RVA profiles.
A total of 54 lines of BC3F4–6 developed by backcross method with Ilpumbyeo as a recurrent parent was transplanted in the field in 2012, and evaluated for paste viscosity properties. Elite lines of low setback and high breakdown properties were selected.
Evaluation of physicochemical properties for grain quality
Alkali digestion values (ADV) were determined visually using the scale (1–7) of spreading method described in
Little et al. (1958) and by the clearing of milled rice kernel soaked in 1.4% KOH solution for 23 hours at a constant temperature of 30°C. The amylose content (AC) was determined by the relative absorbency of a starch-iodine blue color in a digested solution of 100-mesh rice flour. For these measurements, Rapid Flow Autoanalyzer was used following the method in
Juliano (1971). The protein content (PC) was measured using the Micro-Kjeldahl method (FOSS: 2300 Kjeltec Analyzer, Sweden). A nitrogen conversion factor of 5.95 was used to estimate the PC in rice flour samples. The glossiness of cooked rice (GCR) was determined with two replications using the Toyo-taste meter (model: MA-90A and 90B) in accordance with the operation manual (TRCM Co., Japan).
The RVA paste viscosity was determined on a Rapid Visco Analyzer according to the American Association of Cereal Chemists Standard Method AACC 61-02 (1995) described in
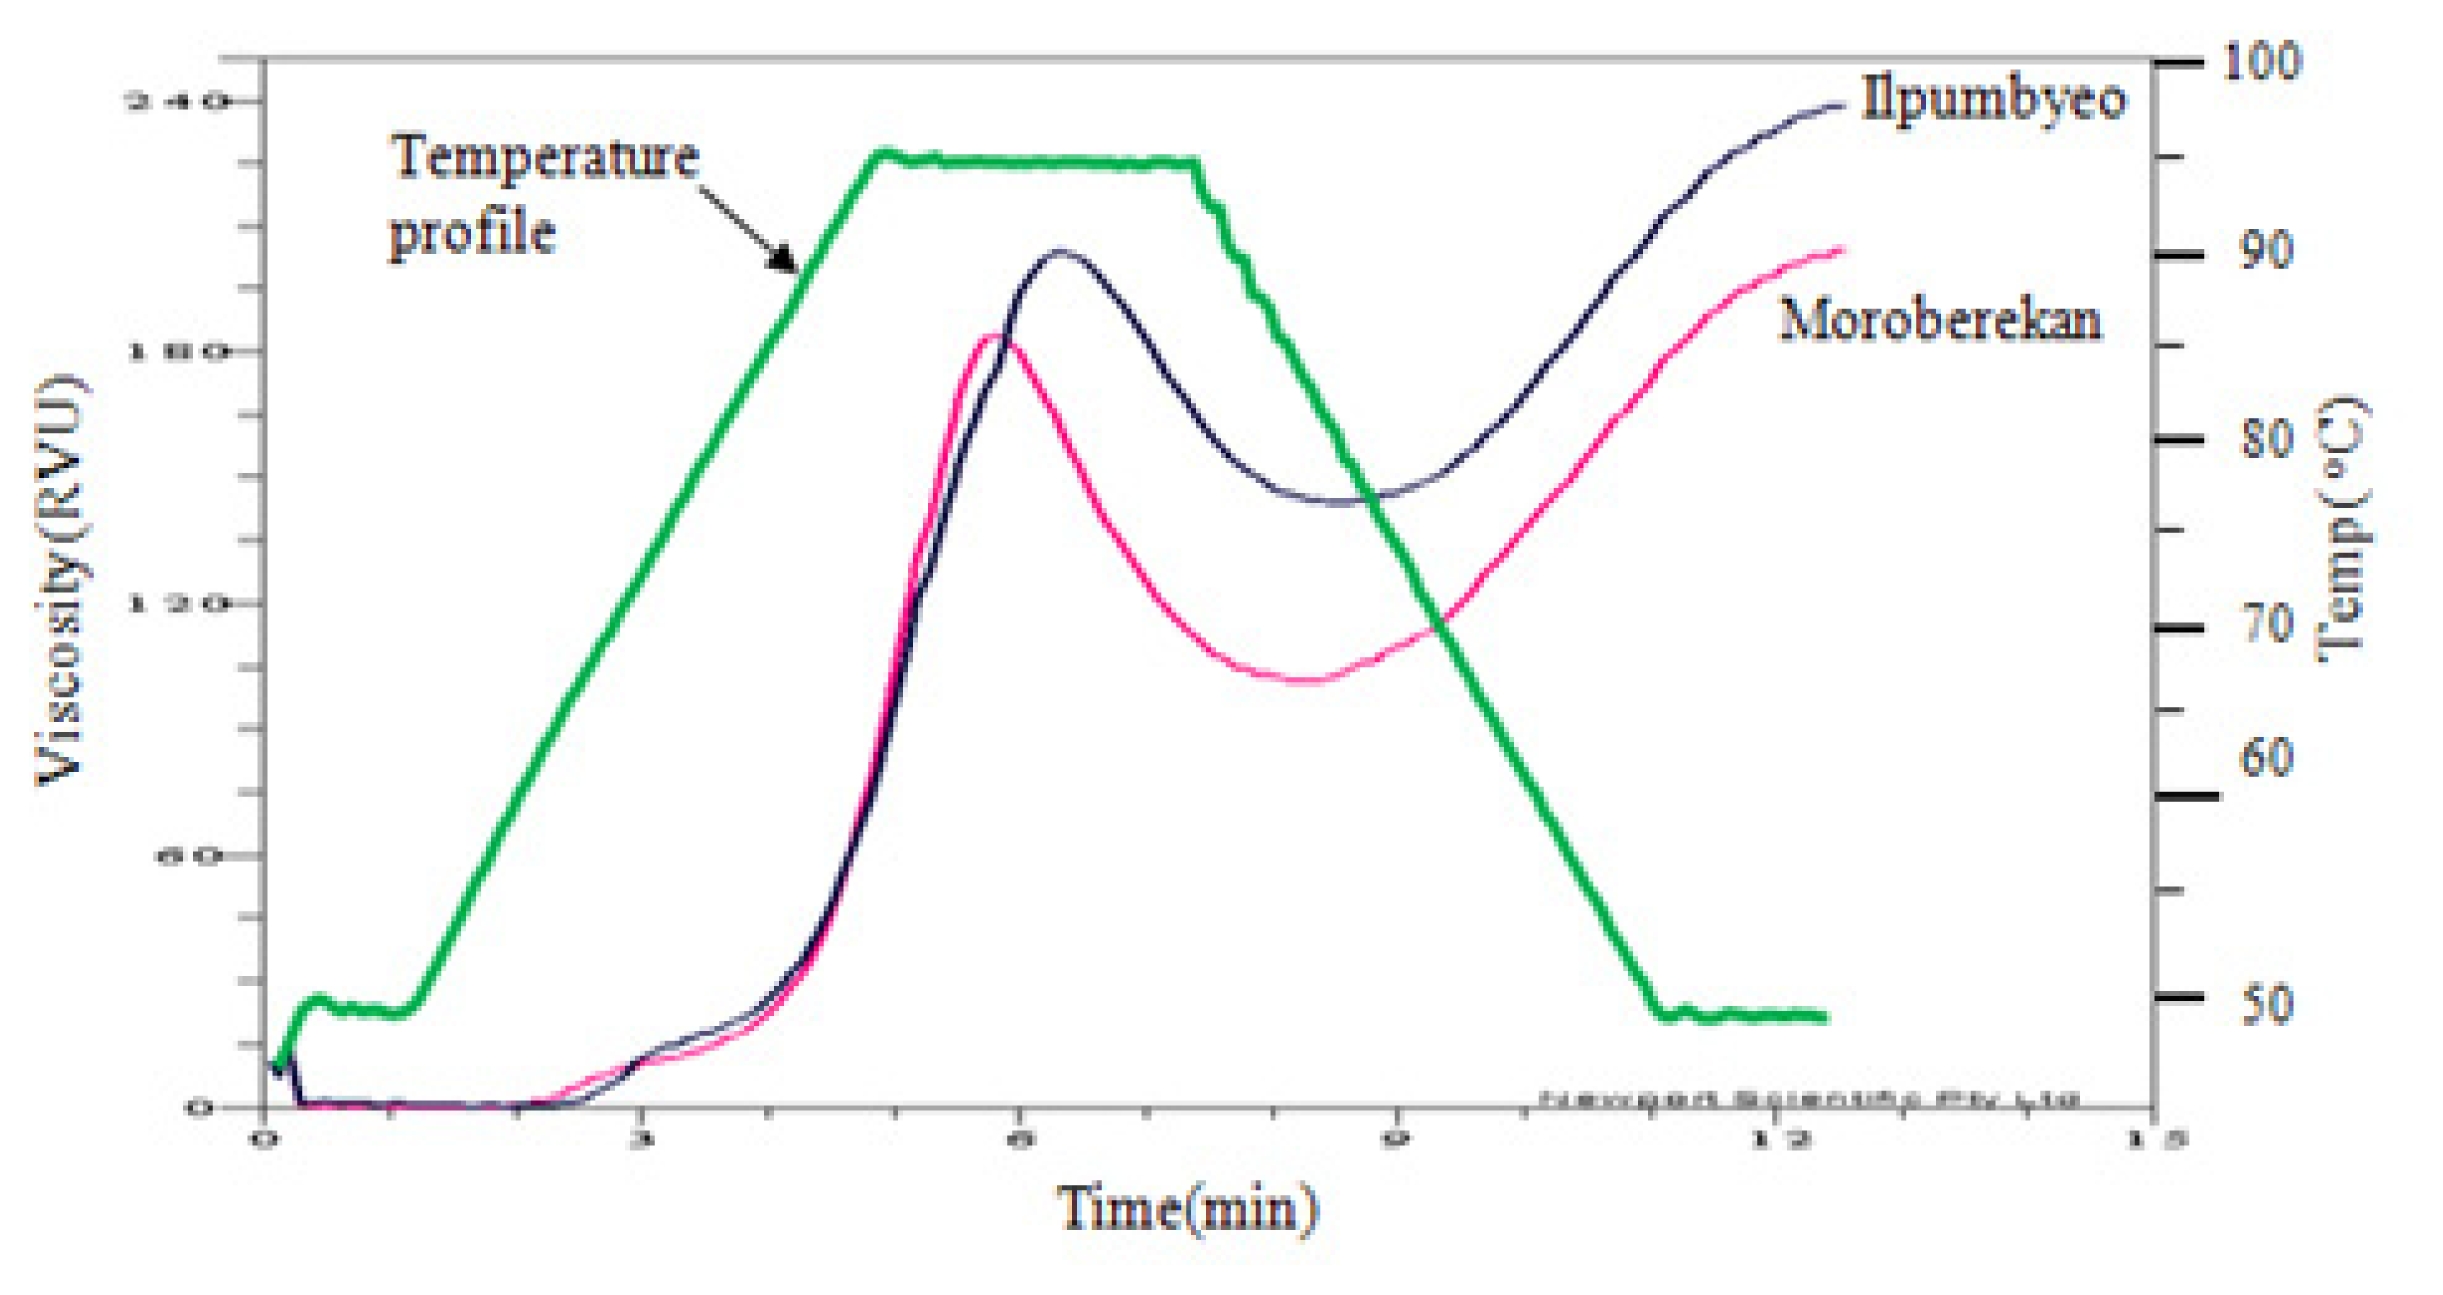
Bao and Xia (1999). The method specifies 3 g of rice flour in 25 ml of water. A paddle was placed in the canister and rotated at 960 rpm for 10 s to disperse the rice sample. The viscosity was evaluated using a constant paddle rotation of 160 rpm. The sequential temperature curve for a 12.5 min test were as follows: (1) incubate at 50°C for 1.0 min; (2) increase to 95°C; (3) keep at 95°C for 1.4 min; (4) cool down to 50°C; and (5) hold at 50°C for 1.4 min. Viscosity values were recorded in centipose (cp). The analyzer was a model RVA-3D (Newport Scientific Pty, Warriewood, Austalia), which runs with Thermocline Windows control and analysis software, Version 1.2. Rice paste viscosity characteristics were described by three important measurements of the pasting curve: peak viscosity (PV), hot-paste viscosity (HPV), and cool-paste viscosity (CPV). In addition, breakdown (BD), setback (SB), and consistency viscosity (CSV) were derived from PV minus HPV, CPV minus PV, and CPV minus HPV, respectively. Pasting temperature (temperature of the initial viscosity increase, PaT) and pasting time (time of the initial viscosity increase, PeT) were also recorded. All the viscosity parameters were measured in Rapid Visco Units (RVU) according to the American Association of Cereal Chemists Standard Method AACC 61-02 (1995).
Mapmaker program was used to establish a molecular map on Power Macintosh 700/132. All pairs of linked markers were identified using the “group” command with a LOD value of 2.0. The “orders” and the “compare” commands in Mapmaker were used to identify the most probable marker order within a linkage group. The “ripple” command was used to verify the order. Additional markers were assigned to intervals using the “try” and “ripple” command. Map distance (cM) was expressed in Kosambi function (
Kosambi 1944). Assignment of linkage groups to the respective chromosomes was based on rice maps developed by
McCouch et al. (2002) and
Temnykh et al. (2000). Chi-square tests were performed to examine the segregation ratios at the marker loci for deviation from the expected ratio 1:1, and the skewness was determined.
The map was used to analyze QTLs for the physicochemical properties and RVA profile related to eating quality in
japonica rice. The chromosomal locations of the QTLs were determined by single-point analysis (SPA) and composite interval mapping (CIM). Primary analysis using SPA was performed using the QGene program (
Nelson 1997). In SPA, a QTL was identified if the phenotype was associated with a marker locus at
P<0.001 or with two adjacent marker loci at
P<0.05. To identify additional QTLs and to increase the resolution of QTL locations, CIM was performed using QTL Cartographer 2.0 (
Basten et al. 1997). Significance thresholds for CIM were determined using 1,000 permutations for each trait. For CIM, the experiment-wise significance level of
P<0.01 corresponded to an average LOD>3.80, whereas the level
P<0.05 corresponded to a LOD>2.52. The QTLs reported in this study were detected using both methods. The proportions of observed phenotypic variations attributable to a particular QTL were estimated using the coefficient of determination (
R2). The total phenotypic variance explained was estimated by simultaneously fitting to a model including all putative QTLs for the respective trait.
RESULTS
Phenotypic variations in parental japonica cultivars and RILs
Phenotypic variations for ADV, AC, GCR, PV, HPV, CPV, BD, SB and CSV in RILs and two
japonica parental cultivars are shown in
Table 1. Two traits, ADV and GCR related to eating quality were significantly different between the two parents. ADVs of Ilpumbyeo and Moroberekan were 6.7 and 2.0, respectively, while the GCRs were 70.1 and 41.9, respectively. The ACs of Ilpumbyeo was 17.6% whereas Moroberekan contained 19%. Of the three traits mentioned, Moroberekan has low cooking quality based on ADV and GCR. In RIL population values for these three parameters greatly varied, ADV ranged from 1 to 7 with an average of 4.4, AC was from 14.1% to 26.2% with an average of 21.1, and GCR was from 34.5 to 86.6 with a mean of 58.7. Two traits, AC and GCR, in the RILs showed continuous variation with transgressive segregations and ADV showed similar bi-nominal distribution (data not shown).
For paste viscosity properties, Ilpumbyeo was found to obtain higher values in PV, HPV, CPV and SB, while it has lower values in BD and CSV compared to Moroberekan. The RILs showed continuous variation with transgressive segregations in six characteristics for RVA profiles.
Correlation analysis
Correlation coefficients among the ADV, AC, GCR, PV, HPV, CPV, BD, SB and CSV are indicated in
Table 2. ADV showed high positive correlation with GCR and SB, and high negative correlation with PV and BD. AC was negatively correlated with GCR, PV, HPV and BD, but highly positively correlated with CSV. The GCR had high positive correlation with ADV, PV and HPV, but had high negative correlation with AC and CSV. The PV was found to be highly positively correlated with GCR, HPV, CPV and BD, but negatively correlated with ADV, AC and SB. HPV showed high positive correlation with GCR, PV, CPV and BD, and negative correlation with AC and SB. The CPV was highly positively correlated with PV, HPV, BD and CSV, but negatively correlated with AC. The BD revealed high positive correlation with PV, HPV and CPV, but was found to have high negative correlation with ADV, AC, SB and CSV. The SB showed high positive correlation with ADV, but also showed high negative correlation with PV, and BD. The CSV was highly positively correlated with AC and CPV, but negatively correlated with GCR and BD.
In total, 183 SSR markers showing polymorphism between Ilpumbyeo and Moroberekan were employed in genotyping the RIL population to construct linkage map. The linkage map was 2,182.6 cM in size with an average interval of 11.93 cM (
Fig. 2). All markers were evenly distributed on 12 chromosomes except for few regions. This map was used to analyze QTLs for physicochemical and paste viscosity properties related to eating quality in cooked rice.
In total, nine QTLs for two physicochemical characters, ADV and PC, and glossiness of cooked rice (GCR) were identified and their map positions and biometrical parameters are shown in
Table 3 and
Fig. 2.
For alkali digestive value (ADV), three QTLs were identified on chromosomes 6 and 10. A QTL qADV6.1 was identified in the region of wx gene. This locus from Ilpumbyeo increased the ADV by 2.43 which explained 32.1% of the total phenotypic variation. Another QTL, qADV6.2 on chromosome 6, was identified in the region flanked by RM1161 and RM3498. This locus caused an increase in ADV by 1.59 from Ilpumbyeo allele and explain 11.7% of the total phenotypic variation. A QTL, qADV10 on chromosome 10 was identified at RM467-RM1375, causing the ADV to increase by 1.55 from Moroberekan allele and explained 10.6% of the total phenotypic variation.
Amylose content (AC)
Three QTLs for amylose content (AC) were identified on chromosomes 3, 6, and 10. Two QTLs, qAC3 and qAC6 on chromosomes 3 and 6, respectively, caused a drop in AC content by 2.8% and 5.1% from Ilpumbyeo allele, respectively. A QTL, qAC6 on chromosome 6 was located at wx gene explaining 47.3% of the total phenotypic variation as a major QTL. A QTL, qAC10 on chromosome 10 was identified at RM484-RM333 that decreased the AC level by 2.6% from Moroberekan allele and explained 9.9% of the total phenotypic variation.
Glossiness of cooked rice (GCR)
For GCR, three QTLs were identified on chromosomes 3 and 6. A QTL qGCR3 on chromosomes 3 from Ilpumbyeo allele increased GCR by 3.9 and explained 7.5% of total phenotypic variation. Of the two QTLs on chromosomes 6, qGCR6.1 was identified at wx gene explaining 18.0% of the total phenotypic variation. Another QTL, qGCR6.2 on chromosome 6 identified in the region of RM1161-RM3498 in Ilpumbyeo had small genetic effect causing an increase in GCR by only 3.4 explaining a phenotypic variation which was 6.9% of the total.
QTL analysis for paste viscosity parameters
A total of 19 QTLs for six paste viscosity parameters was identified and their map positions and biometrical parameters are shown in
Table 3 and
Fig. 2.
Three QTLs for peak viscosity (PV) were identified on chromosomes 4, 6, and 9 by the Ilpumbyeo allele. qPV6 in RM540-RM587 of wx gene locus explained 27.8% of the total phenotypic variation. qPV4 and qPV9 on chromosomes 4 and 9 explained 6.5% and 9.0% of the total phenotypic variation, respectively.
Hot-paste viscosity (HPV)
For hot-paste viscosity (HPV), four QTLs, qHPV4, qHPV6, qHPV7, and qHPV8 were identified to increase the HPV. The Ilpumbyeo allele was found to harbor all these QTLs. qHPV6, located in the wx gene region on the chromosome 6 explained 26.8% of the total phenotypic variation. The other QTLs, qHPV4, qHPV7, and qHPV8 explained minor phenotypic variation that ranged from 6.1~8.3% of the total.
Cool-paste viscosity (CPV)
Four QTLs were identified for cool-paste viscosity (CPV) on chromosomes 1, 6, 7, and 8 in Ilpumbyeo allele. These QTLs, although acting as the minor QTLs increased CPV by 10.7~12.6 RVU and explained 6.2~8.8% of the total phenotypic variation.
Breakdown viscosity (BD)
Two QTLs, qBD6 and qBD9 for BD were detected on chromosomes 6 and 9 in Ilpumbyeo allele. These QTLs increased BD by 26.2 and 16.4%. A major QTL qBD6 in the interval RM540-RM587 on chromosome 6 explained a large phenotypic variation which was 17.7% of the total. A minor QTL, qBD9 in the interval RM5688-RM444 explained 7% of the total phenotypic variation.
Setback viscosity (SB)
Two QTLs, qSB6 and qSB9 for SB were also identified at the same region with QTLs for BD on chromosomes 6 and 9. These QTLs, from Ilpumbyeo allele, decreased the SB by −34.4 and −23.3, respectively. qSB6 explained 24.4% of the total phenotypic variation while qSB-9 explained 8.2% of the total phenotypic variation.
Consistency viscosity (CSV)
Four QTLs were identified for CSV on chromosomes 1, 3, 5 and 6. A QTL, qCSV1 in the interval RM259-RM35 from Ilpumbyeo allele caused an increase in CSV by 7.5 explaining 7.3% of the total phenotypic variation. The other three QTLs also detected from Ilpumbyeo allele, qCSV3, qCSV5 and qCSV6 decreased the CSV by 8.2, 5.8 and 9.9, respectively. These QTLs explained 11.4, 7.0 and 20.7% of the total phenotypic variation, respectively.
Development of QTL-NIL of good eating quality
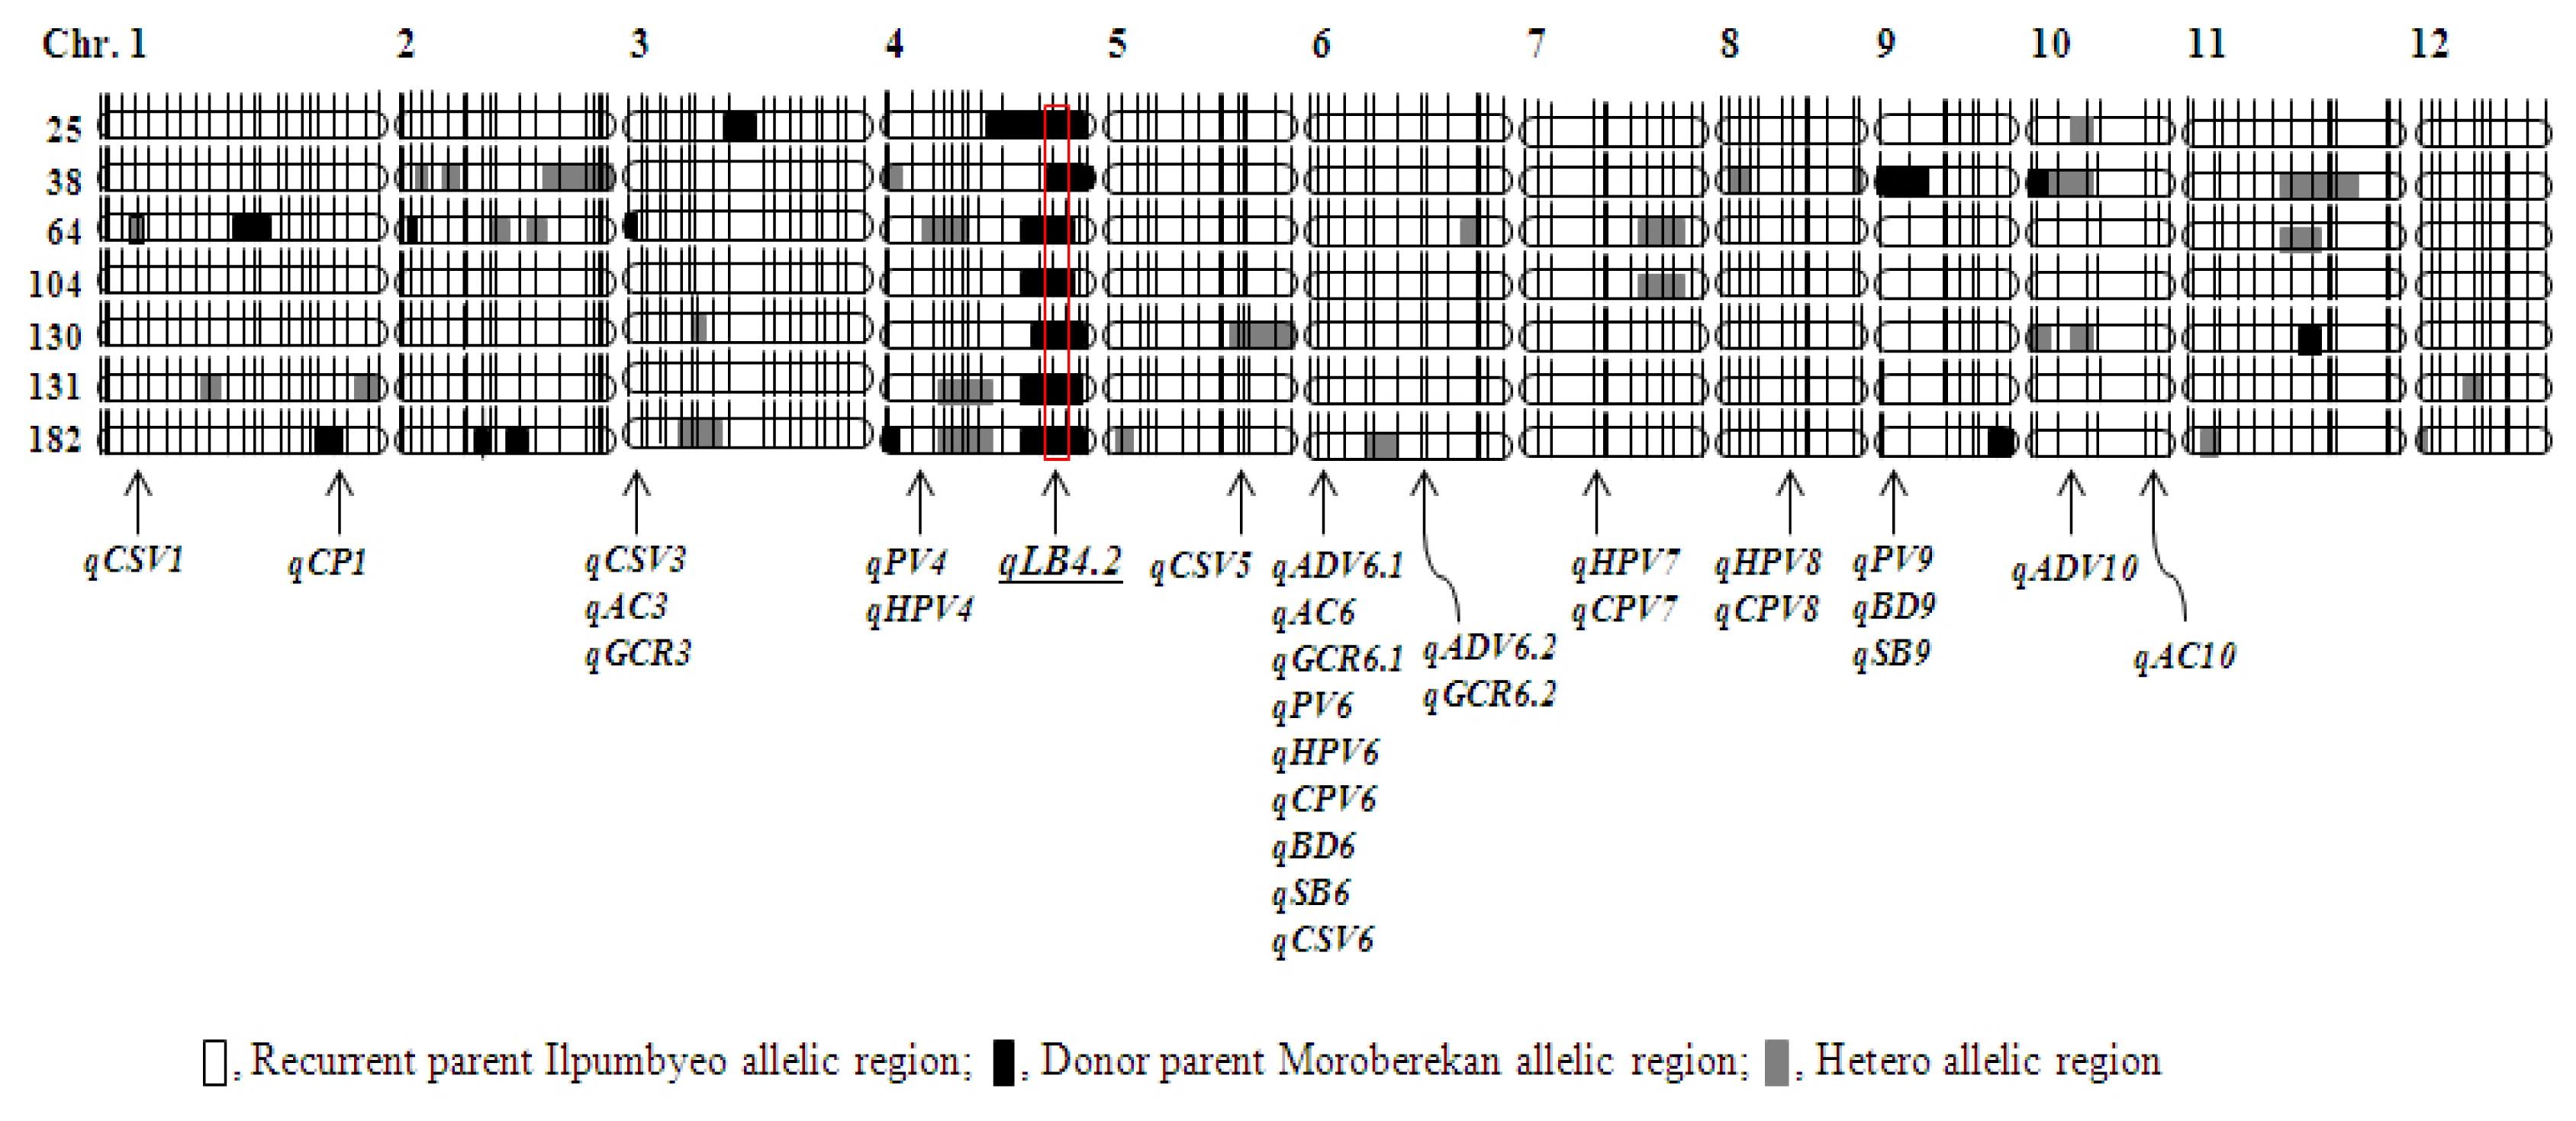
A total of 54 QTL-NILs was developed based on backcross method with the recurrent parent Ilpumbyeo. These lines were evaluated for agronomic traits, heading date, culm length, and phenotypes, of which 20 lines showing agronomic traits and phenotype similar with those of Ilpumbyeo were selected. We carried out a genome-wide scan to determine the regions containing Moroberekan alleles in 20 lines using 183 SSR markers that were used for genotyping of RIL population (
Fig. 3). The percentage of chromosome segment substituted from donor parent Moroberekan was 3.3% to 15.8% in 20 lines. These lines were transplanted and harvested at the experimental field of NICS in Suwon in 2012. The flours of milled rice were used to evaluate the paste viscosity properties and glossiness of cooked rice (
Table 4). We selected seven elite lines with higher peak viscosity (PV), and lower hot-paste and cool-paste viscosity. These lines showed higher breakdown value (BD, 100.8~123.2) and lower setback value (SB, −31.6~−47.3) for paste viscosity properties than the other lines. The GCR of these lines were 73.6 to 83.2, similar with the recurrent parent, Ilpumbyeo. The seven selected lines showed that the QTL regions were substituted by Ilpumbyeo chromosome segment except only for a few loci that include
qLB4.2 which is related to leaf blast resistance from Moroberekan allele (
Fig. 3,
Park 2010). All lines exhibited blast resistance in the nursery test located in 14 regions of Korea for three years.
DISCUSSION
Eating quality is the most important trait in
japonica rice breeding in Korea. However, the traits related to eating quality are being evaluated for physico-chemical properties such as the ADV, AC, PC and glossiness of cooked rice and sensory test by the trained panels only in advanced breeding generations. These methods are both time-consuming, labor intensive and require much rice sample. In the previous studies, many used DH, RIL, BIL and CSSL populations from the crosses among
indica and
japonica for identifying QTLs related to eating quality from
japonica background because it is easy to detect polymorphism between
indica and
japonica for construction of linkage map using DNA markers (
Bao et al. 2000,
2002;
He et al. 2006;
Li et al. 2003;
Li et al. 2011;
Takeuchi et al. 2007;
Tian et al. 2005;
Umemoto et al. 2002;
Wan et al. 2004). In the present study, we identified QTLs related to eating quality using two physico-chemical properties ADV and AC, and glossiness of cooked rice, and six traits for paste viscosity properties in RIL population from a cross between temperate
japonica cultivar Ilpumbyeo and tropical
japonica Moroberekan of West Africa upland rice.
A QTL cluster including
qAC3 for physico-chemical properties,
qGCR3 for glossiness of cooked rice, and
qCSV3 for consistency viscosity was identified on the short arm end of chromosome 3. There has been no QTL identified for paste viscosity properties using DH and RIL populations from the crosses of
indica/
indica and
indica/
japonica in this QTL region (
Bao et al. 2000,
2002;
Li et al. 2011;
Tian et al. 2005;
Wang et al. 2007). However, a QTL block on the same location on chromosome 3 was also identified to be populated with several QTLs for eating quality of cooked rice, namely glossiness, taste, stickiness, hardness, and overall evaluation, based on sensory tests by a trained panel, and physico-chemical properties in the
japonica/
japonica population (
Kobayashi and Tomita 2008;
Takeuchi et al. 2007,
2008;
Tanaka et al. 2006;
Wada et al. 2008). A clustered QTL region identified constantly across years was identified by Koshihikari allele in the same region on chromosome 3 in BIL population from the cross between two
japonica cultivars, Moritawase and Koshihikari (
Wada et al. 2008). A QTL,
qST-3 for stickiness by Sakihikari allele in RIL population from the cross between two
japonica varieties, Sakihikari and Nipponbare was also identified throughout the three-year experiments (
Kobayashi and Tomita 2008). Also, three QTLs for stickiness, glossiness and taste on chromosome 3 was identified using backcross inbred lines derived from crosses of Koshihikari and Kasalath (
indica) (
Takeuchi et al. 2007). These QTLs related to eating quality were inherited by Koshihikari allele. Any QTL for physico-chemical properties and glossiness of cooked rice related to eating quality were not detected in the RIL population from the cross of two
japonica rice, Suweon365 and Chucheongbyeo (
Kwon et al. 2011). Based on these studies, the QTL region on the short arm end of chromosome 3 harbors unique QTLs for eating quality especially in Ilpumbyeo and Koshihikari alleles.
Another major QTL block was identified in the location of
wx gene on chromosome 6. A total of nine QTLs including three QTLs for physico-chemical characteristics and glossiness of cooked rice, and six QTLs related to paste viscosity properties were detected in the region of RM540-RM3370 (
Fig. 2). This region on the short arm end of chromosome 6 was identified to contain QTLs for paste viscosity properties by sensory test using DH, RIL, BIL and CSSL populations from the crosses of
indica/
indica (
Fan et al. 2005;
Wang et al. 2007),
indica/
japonica (
Bao et al. 2000,
2002;
He et al. 2006;
Takeuchi et al. 2007;
Tian et al. 2005;
Wan et al. 2004) and
japonica/
japonica (
Kobayashi and Tomita 2008;
Kwon et al. 2011;
Tanaka et al. 2006;
Wada et al. 2006,
2008). Many QTLs for DTH (days to heading) were identified at the end of the short arm of chromosome 6 (
Monna et al. 2002;
Ebitani et al. 2005;
Tanaka et al. 2006;
Wada et al. 2006). Therefore, we suggest that the QTLs for eating quality on chromosome 6 might be influenced by heading date. On the other hand, there are several starch synthase-related genes on the short arm of chromosome 6, including
waxy (
Juliano 1985),
starch synthase I (
Baba et al. 1993;
Tanaka et al. 1995), and
starch synthase IIa (
Umemoto et al. 2002). Especially,
Umemoto et al. (2002) suggested that
alk(t),
gel(t),
acl(t) and
SSIIa genes are located at the same locus. These genes affect the amylose content or amylopectin chain length in rice endosperm. In the future, further studies are needed to characterize the complicated function of the QTLs on chromosome 6. In the centromere region of RM1161-RM3498 on choromosome 6, two QTLs,
qADV6.2 and
qGCR6.2 were identified. Two QTLs,
qGT6-1 and
qGT6-2 for gelatinization temperature were reported in the similar region on chromosome 6 using DH population from the cross of
indica ×
japonica (
Wang et al. 2007).
Two QTL for PV and HPV related to paste viscosity properties on chromosome 4 were detected in RM1155-RM3866 (58.9–70.6 cM) region which explained 6.5% of total phenotypic variation (
Table 3,
Fig. 2). In the previous studies, several QTLs related to gel consistency and viscosity for RVA properties, and glossiness, stickiness and overall evaluation in sensory test (
Wada et al. 2008;
Wan et al. 2004) were identified in the end of short arm on chromosome 4. The loci reported in this study were reported to harbor
pi21 (
Fukuoka et al. 2009) and
qLB4.1 (
Cho et al. 2013) for blast resistance. Two QTLs for HPV and CPV were identified in RM418-OSR22 on chromosome 7 (
Fig. 2). Some QTLs were identified for amylose content, peak and hot-paste viscosities, and gel consistency in DH population from
indica ×
japonica (
Bao et al. 2002), peak viscosity in RIL population from
indica ×
indica (
Wang et al. 2007), and glossiness by sensory test in CSSLs from Koshihikari × Kasalath (
Takeuchi et al. 2007) in the similar region on chromosome 7. Apart from these, a major QTL for ADV, AC and GCR (
Kwon et al. 2011) and glossiness, taste and hardness (
Wada et al. 2008) was identified in two
japonica RIL populations, at the distal region of long arm on chromosome 7. The other QTL cluster for HPV and CPV was located in RM3214-RM44 on chromosome 8. Previous studies have reported QTLs related to stickiness and paste viscosity properties (
Kobayashi and Tomita 2008), stickiness and hardness by sensory test (
Wada et al. 2008), physico-chemical properties and sensory test (
Kwon et al. 2011), and palatability for cooked rice and gel consistency (
Wan et al. 2004) in the same region on chromosome 8. The QTLs identified in this study and in previous reports were located on 49–55 cM and 15–45 cM in physical map, respectively (
Fig. 2). Further studies are needed to localize accurately the QTLs based on fine mapping of chromosome 8.
QTLs at the distal region, RM5688-RM444 (0.8–4.4 cM) of short arm on chromosome 9 were related to three paste viscosity properties, peak viscosity, breakdown and setback (
Fig. 2). In previous studies, two QTL
qST9 and
qAC9 were reported in the same region (
Wada et al. 2006,
2008). The BD, which means paste degradation, is the difference from HV to HPV, and has negative correlation with amylose content. In this study, the breakdown had high negative correlation of −0.498 with amylose content (
Table 2). Also, the breakdown showed positive correlation with short amylopectin chain-length in rice cultivars of similar amylose content. The SB is the difference from cool-paste viscosity to peak viscosity, and reflects the retrogradation by the reconfiguration of starch granular in the cooling of paste. We expect that the lower setback would further slowdown the retrogradation in cooked rice. A high negative correlation (−0.846) between breakdown and setback was observed (
Table 2). As a result, elite lines with higher breakdown and lower setback selected by MAS based on QTL on chromosome 9, are expected to have good eating quality that can be kept longer even when stored in the rice cooker for long time.
A single QTL was detected to five regions on chromosome 1, 5 and 10 (
Table 3,
Fig 2). A QTL
qCSV1 was detected in RM259-RM35 on the short arm of chromosome 1. This region was reported previously to contain four QTLs
qGL1.1,
qST1,
qTA1 and
qHA1 by sensory test in
japonica background (
Wada et al. 2008), and two QTLs for consistency and setback viscosities in
indica background (
Wang et al. 2007). Another QTL,
qCPV1 at the end of long arm of chromosome 1 was detected. There were reports on two QTLs for GC and BD (
Bao et al. 2002), four QTLs,
qBD1,
qPV1,
qCO1 and
qAC1 (
Kobayashi and Tomita 2008), and GT (
Wan et al. 2004) related to paste viscosity properties and a QTL
qPC1 for protein content (
Kwon et al. 2011).
Wada et al. (2008) reported a QTL
qDTH1 for heading time in this locus. These QTLs were from
japonica genetic background. A QTL
qCSV5 was identified at the region of RM5558-RM5642 on chromosome 5 (
Fig. 2). Two QTLs
qBDV-5 and
qSBV-5 in DH population from ZYQ 8 × JX 17 and a QTL for consistency in DH population from IR64 × Azucena were reported (
Bao et al. 2000,
2002). In DH population from ZYQ 8 × JX 17, when the allele of
japonica JX 17 is introduced into the
indica background, SBV decreases and BDV increases. However, in DH population from the cross between
indica and
japonica, a QTL
qGT5-1 was identified showing positive effect from
indica allele (
He et al. 2006). In this study, a QTL from
japonica Ilpumbyeo allele was detected to cause a decrease in CSV. In two loci on chromosome 10,
qADV10 in RM467-RM1375 and
qAC10 in RM484-RM333 were detected (
Fig. 2). The same position with
qADV10, two QTLs,
qCO10 for consistency viscosity and
qPC10 for protein content were reported to also populate this region (
Kobayashi and Tomita 2008;
Takeuchi et al. 2007). A QTL
qPC10 decreased protein content by Koshihikari allele. Interestingly, two QTLs from Moroberekan (West Africa upland rice) alleles identified in this study increased alkali digestive value and decreased amylose content.
Finally, we selected seven chromosome segment substitution lines (CSSLs) derived from the backcross of recurrent parent Ilpumbyeo. These lines contain 3.8% to 14.3% of Moroberekan chromosome segments. All lines were substituted with Ilpumbyeo genetic background in most loci except for a QTL locus,
qLB4.2 which is related to leaf blast resistance from Moroberekan allele (
Fig. 3,
Park 2010). The selected lines showed 100.8~123.2 higher breakdown and −31.6~−47.3 lower setback than the other lines (
Table 4). The GCR of these lines were 73.6 to 83.2 similar to that of the recurrent parent, Ilpumbyeo. The breakdown means paste degradation and has negative correlation with amylose content. The setback (SB) reflects the retrogradation by the reconfiguration of starch granular in the cooling of paste. We expect that the lower setback would further slowdown the retrogradation in cooked rice. Breakdown is highly negatively correlated (−0.846) with setback (
Table 2). We expect that the seven lines selected would produce grains of better eating quality that could be kept for long time in a rice cooker. These lines are also expected to show resistance to leaf blast through the introduction of
qLB4.2 from Moroberekan allele. Thus, our next study would involve evaluation of the eating and cooking quality of the seven CSSL lines and the relationship among QTLs for eating quality and QTLs for heading time. DNA markers for MAS in stable QTL regions would be useful to
japonica breeding program for high eating quality, and would facilitate in combining the gene/QTLs related to other major traits like resistance to biotic/abiotic stresses. Findings of this study suggest that higher value of peak viscosity, breakdown and lower value of setback are important parameters to be considered for better eating quality trait in
japonica rice breeding program.
ACKNOWLEDGMENT
This research was supported by grants from the Fund for Collaborative Research Project of RDA (Code no. PJ008529), Republic of Korea. We thank Kshirod K. Jena, International Rice Research Institute, Philippines for helpful comments on the manuscript.
Fig. 1The paste viscosity curves of the two parents, Ilpumbyeo and Moroberekan.

Fig. 2Some of the rice chromosomes associated with traits related to eating quality of cooked rice and paste viscosity characteristics in 182 japonica RILs from the cross between Ilpumbyeo and Moroberekan. The QTL positions for traits related to eating quality of cooked rice and paste viscosity parameters are shown on the right of each chromosome. A QTL qLB4.2 on chromosome 4 is a QTL related to leaf blast resistance from Moroberekan allele.
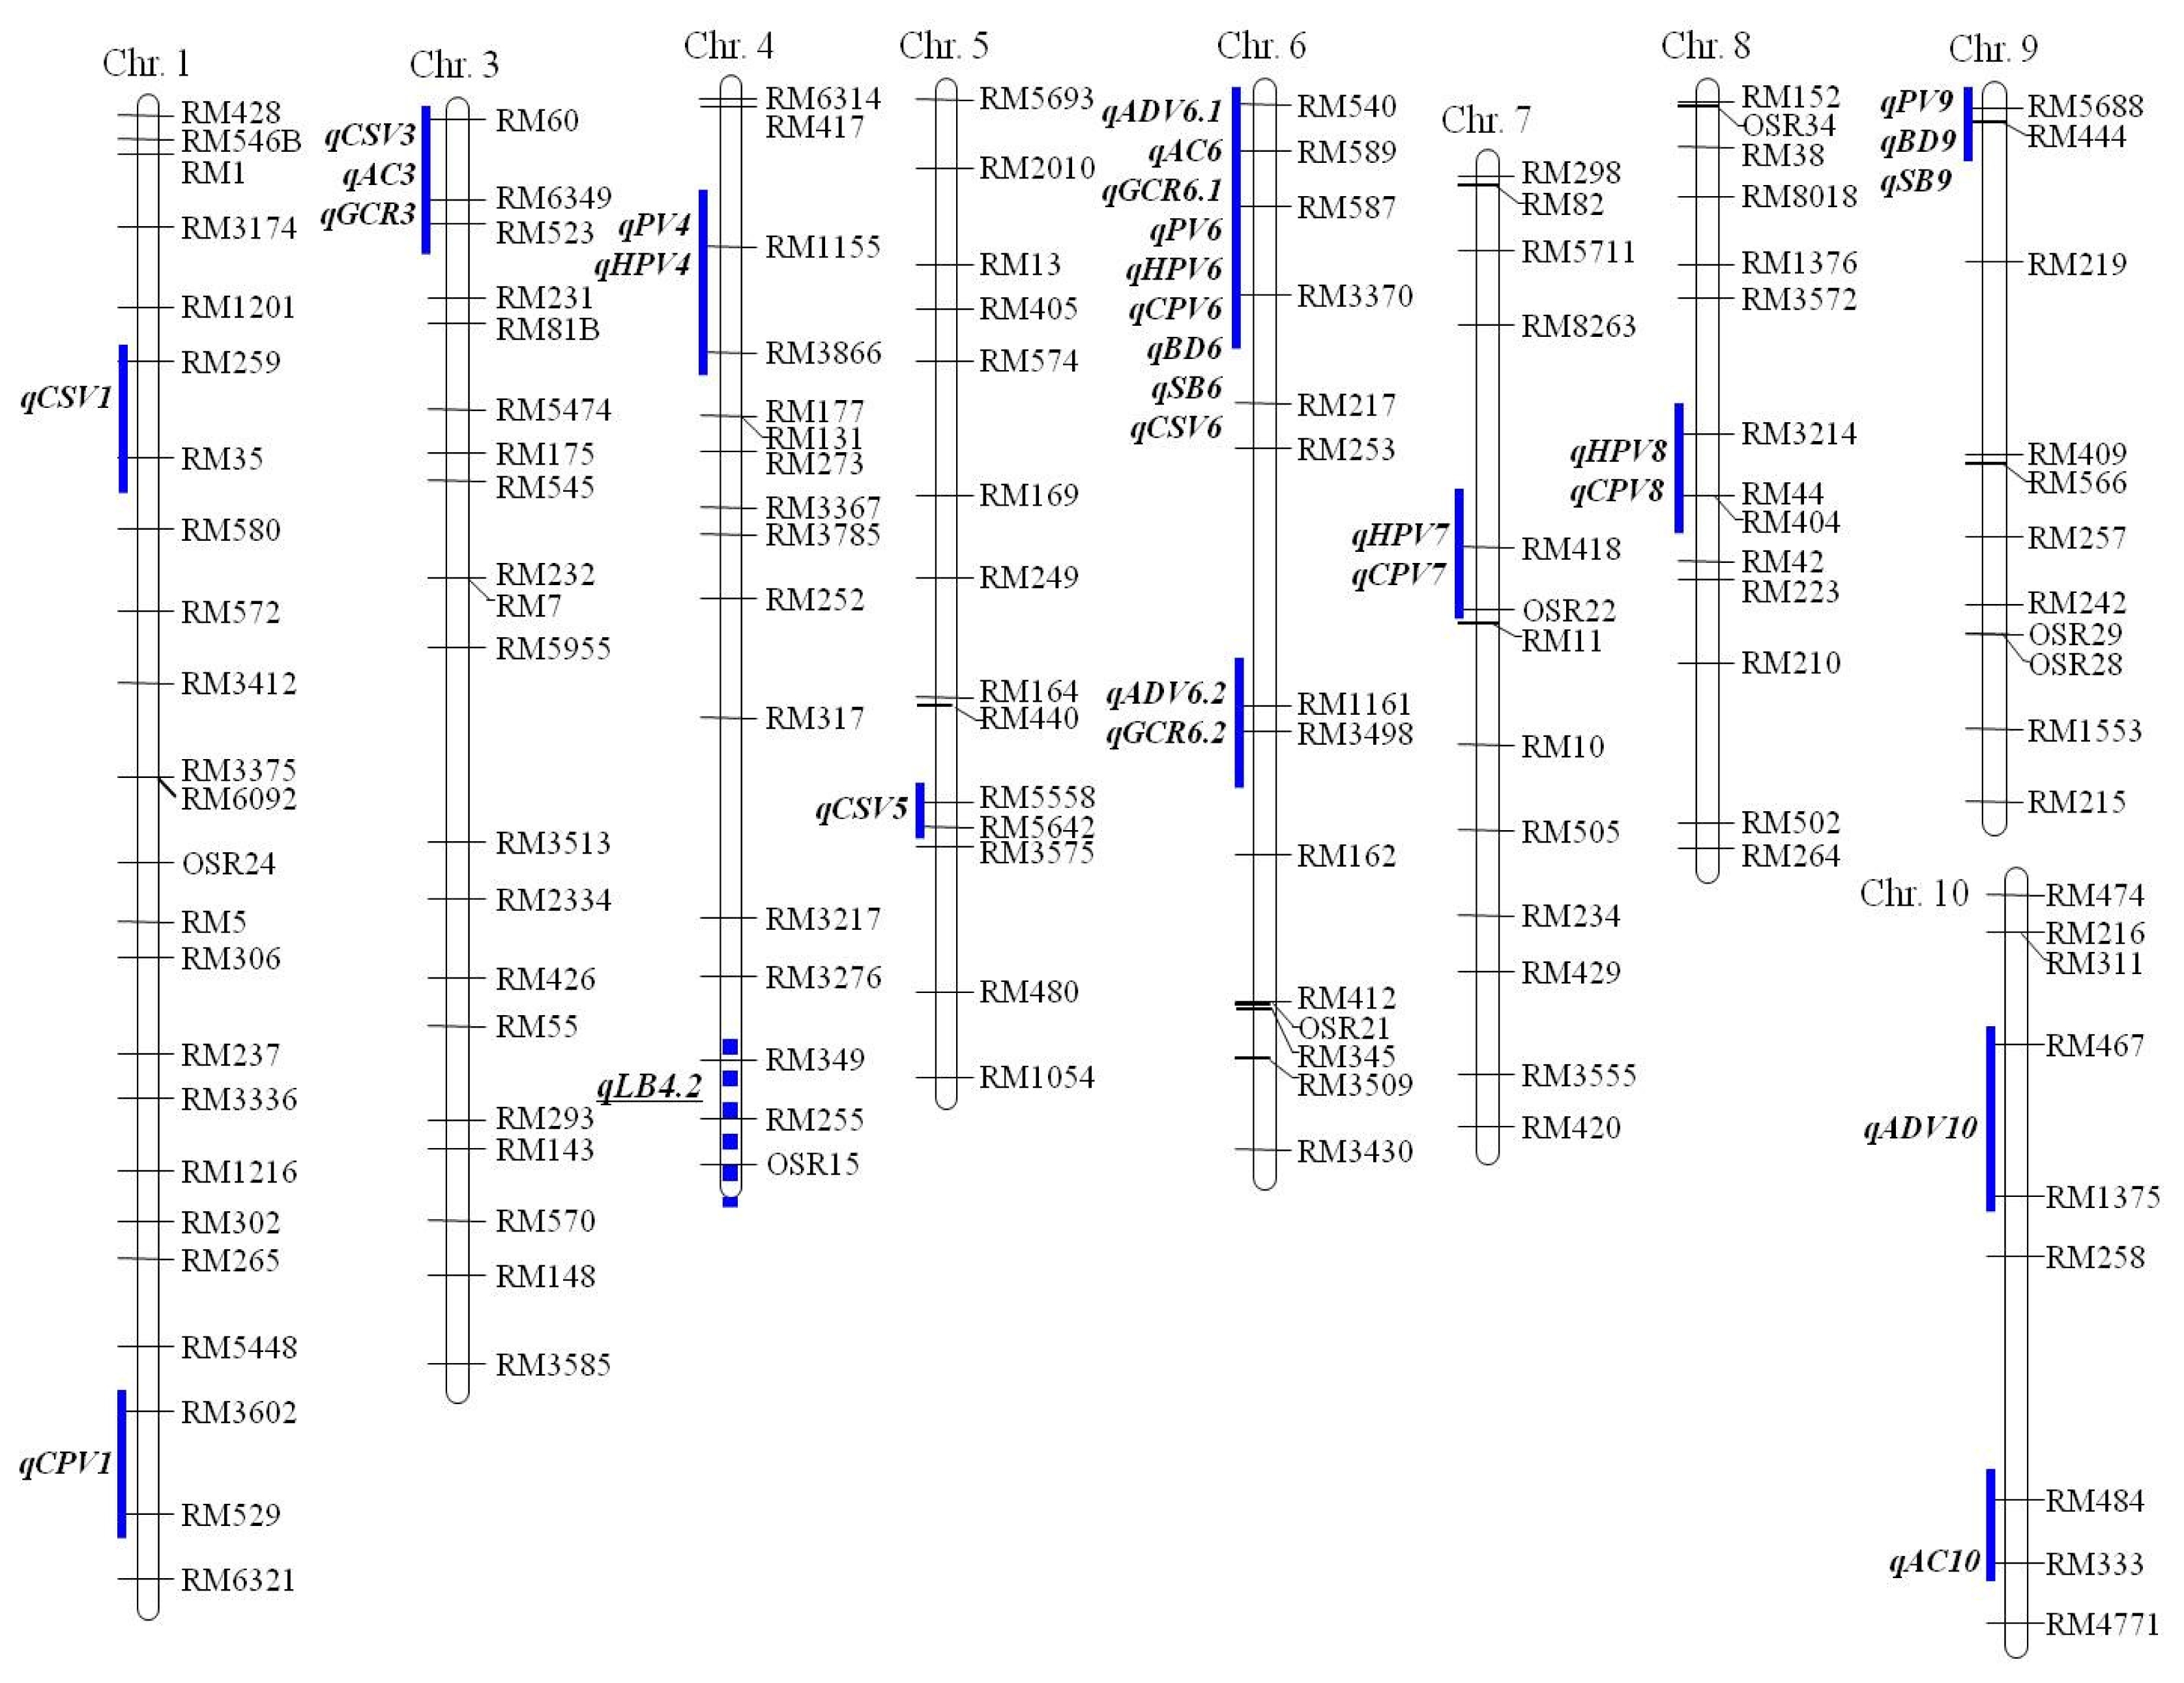
Fig. 3Graphical genotypes of QTL-NILs and chromosome segment substitution regions. □, recurrent parent Ilpumbyeo allelic region; ■, donor parent Moroberekan allelic region;

, hetero allelic region. The
qLB4.2 is a QTL region related to leaf blast resistance by the allele of Moroberekan.

Table 1Characteristics of three traits related to eating quality, and RVA profiles of the parents, Ilpumbyeo and Moroberekan, and RIL lines.
Table 1
|
Traits |
Ilpumbyeo |
Moroberekan |
RIL population |
|
|
Ave. |
Low |
High |
|
Alkali digestive value (ADV) |
6.7 |
2.0 |
4.4 |
1 |
7 |
|
Amylose content (AC) |
17.6 |
19.0 |
21.1 |
14.1 |
26.2 |
|
Glossiness of cooked rice (GCR) |
70.1 |
41.9 |
58.7 |
34.5 |
86.6 |
|
Peak viscosity (PV) |
204.94 |
183.97 |
229.63 |
99.33 |
333.75 |
|
Hot-paste viscosity (HPV) |
142.7 |
96.86 |
126.64 |
71.25 |
173 |
|
Cool-paste viscosity (CPV) |
238.24 |
204.53 |
231.37 |
148.83 |
280.75 |
|
Breakdown (BD) |
62.24 |
87.11 |
102.99 |
24.33 |
180.58 |
|
Setback (SB) |
33.31 |
20.56 |
1.74 |
−90.42 |
66.5 |
|
Consistency (CSV) |
95.54 |
107.67 |
104.73 |
73.83 |
129.08 |
|
Peak time |
6.26 |
5.58 |
5.8 |
5.33 |
6.4 |
|
Pasting temperature |
68.42 |
68.08 |
69.34 |
67.95 |
74.25 |
Table 2Correlation coefficients among three traits related to eating quality of cooked rice and six RVA profile characteristics.
Table 2
|
ADVz
|
AC |
GCR |
PV |
HPV |
CPV |
BD |
SB |
|
AC |
0.168 |
|
|
|
|
|
|
|
|
GCR |
0.308** |
−0.224** |
|
|
|
|
|
|
|
PV |
−0.330** |
−0.453** |
0.209** |
|
|
|
|
|
|
HPV |
−0.043 |
−0.476** |
0.242** |
0.779** |
|
|
|
|
|
CPV |
−0.071 |
−0.176* |
0.067 |
0.593** |
0.856** |
|
|
|
|
BD |
−0.435** |
−0.498** |
0.144 |
0.924** |
0.481** |
0.307** |
|
|
|
SB |
0.284** |
0.139 |
−0.039 |
−0.677** |
−0.222* |
−0.153 |
−0.846** |
|
|
CSV |
−0.065 |
0.483** |
−0.278** |
−0.178* |
−0.044 |
0.477** |
−0.223** |
0.054 |
Table 3QTL analysis for three traits related to eating quality of cooked rice and six RVA profile characteristics in 190 japonica RILs.
Table 3
|
Trait |
QTLz
|
Chr. |
Linked markers |
LOD |
R2(%) |
Allele effect |
|
ADV (Alkali digestive value) |
qADV6.1
|
6 |
RM587-RM3370 |
10.77 |
32.1 |
2.43 |
|
qADV6.2
|
6 |
RM1161-RM3498 |
4.12 |
11.7 |
1.59 |
|
qADV10
|
10 |
RM467-RM1375 |
−4.08 |
−10.6 |
−1.55 |
|
|
AC (Amylose content, %) |
qAC3
|
3 |
RM6349-RM523 |
−5.02 |
−11.8 |
−2.8 |
|
qAC6
|
6 |
RM589-RM3370 |
−22.47 |
−47.3 |
−5.1 |
|
qAC10
|
10 |
RM484-RM333 |
3.76 |
9.9 |
2.6 |
|
|
GCR (Glossiness of cooked rice) |
qGCR3
|
3 |
RM60-RM523 |
2.77 |
7.5 |
3.9 |
|
qGCR6.1
|
6 |
RM589-RM217 |
7.55 |
18.0 |
5.9 |
|
qGCR6.2
|
6 |
RM1161-RM3498 |
2.67 |
6.9 |
3.8 |
|
|
PV (Peak viscosity) |
qPV4
|
4 |
RM1155-RM3866 |
2.45 |
6.5 |
22.3 |
|
qPV6
|
6 |
RM540-RM587 |
11.04 |
27.8 |
45.7 |
|
qPV9
|
9 |
RM5688-RM444 |
2.67 |
9.0 |
25.6 |
|
|
HPV (Hot-paste viscosity) |
qHPV4
|
4 |
RM1155-RM3866 |
2.45 |
6.5 |
9.7 |
|
qHPV6
|
6 |
RM540-RM3370 |
10.54 |
26.8 |
19.5 |
|
qHPV7
|
7 |
RM418-OSR22 |
2.18 |
6.1 |
9.2 |
|
qHVP8
|
8 |
RM3214-RM44 |
3.16 |
8.3 |
10.7 |
|
|
CPV (Cool-paste viscosity) |
qCPV1
|
1 |
RM3602-RM529 |
2.32 |
6.2 |
10.7 |
|
qCPV6
|
6 |
RM589-RM587 |
2.40 |
6.9 |
11.4 |
|
qCPV7
|
7 |
RM418-OSR22 |
2.31 |
6.5 |
11.0 |
|
qCPV8
|
8 |
RM3214-RM44 |
3.38 |
8.8 |
12.6 |
|
|
BD (Breakdown) |
qBD6
|
6 |
RM540-RM587 |
6.60 |
17.7 |
26.2 |
|
qBD9
|
9 |
RM5688-RM444 |
2.06 |
7.0 |
16.4 |
|
|
SB (Setback) |
qSB6
|
6 |
RM540-RM587 |
−9.47 |
−24.4 |
−34.3 |
|
qSB9
|
9 |
RM5688-RM444 |
−2.89 |
−8.2 |
−22.3 |
|
|
CSV (Consistency viscosity) |
qCSV1
|
1 |
RM259-RM35 |
2.74 |
7.3 |
7.5 |
|
qCSV3
|
3 |
RM60-RM523 |
−4.22 |
−11.4 |
−8.2 |
|
qCSV5
|
5 |
RM5558-RM5642 |
−2.67 |
−7.0 |
−5.8 |
|
qCSV6
|
6 |
RM540-RM587 |
−8.55 |
−20.7 |
−9.9 |
Table 4Paste viscosity properties, glossiness of cooked rice, and blast resistance of QTL-NILs developed by the backcross method.
Table 4
|
Lines |
Paste viscosity profile |
GCR |
Blast resistancez
|
|
|
PV |
HPV |
CPV |
BD |
SB |
CSV |
|
Ilpumbyeo |
193.1 |
119.9 |
209.7 |
73.1 |
16.7 |
89.8 |
74.3 |
6.7 |
|
Moroberekan |
161.2 |
83.9 |
183.4 |
77.3 |
22.2 |
99.5 |
57.7 |
0.8 |
|
SR30056(25)-1-1-4-1-1 |
187.1 |
77.7 |
155.5 |
109.4 |
−31.6 |
77.8 |
75.6 |
1.3 |
|
SR30056(38)-1-1-2-1-1 |
200.7 |
82.3 |
166.2 |
118.3 |
−34.5 |
83.8 |
83.2 |
2.4 |
|
SR30056(68)-1-1-1-1-1 |
193.3 |
75.3 |
145.9 |
118.0 |
−47.3 |
70.7 |
73.6 |
0.7 |
|
SR30056(104)-1-1-2-1-1 |
205.8 |
82.6 |
159.0 |
123.2 |
−46.8 |
76.4 |
75.1 |
1.2 |
|
SR30056(130)-1-1-2-1-1 |
191.8 |
76.8 |
149.8 |
114.9 |
−42.0 |
72.9 |
75.1 |
2.3 |
|
SR30056(131)-1-1-4-1-1 |
194.3 |
78.1 |
155.9 |
116.2 |
−38.3 |
77.8 |
75.9 |
3.2 |
|
SR30056(182)-1-1-2-1-1 |
195.5 |
82.0 |
161.3 |
113.5 |
−34.3 |
79.3 |
76.0 |
1.6 |
References
- Baba T, Nishihara M, Mizuno K, Kawasaki T, Shimada H, Kobayashi E, Ohnishi S, Tanaka K, Arai Y. 1993. Identification, cDNA cloning, and gene expression of soluble starch synthase in rice (Oryza sativa L.) immature seeds. Plant Physiol. 103: 565-573.
- Bao JS, Xia YW. 1999. Genetic control of paste viscosity characteristics in indica rice (Oryza sativa L.). Theor Appl Genet. 98: 1120-1124.
- Bao JS, Zheng XW, Xia YW, He P, Shu QY, Lu X, Chen Y, Zhu LH. 2000. QTL mapping for the paste viscosity characteristics in rice (Oryza sativa L.). Theor Appl Genet. 100: 280-284.
- Bao JS, Wu YR, Hu B, Wu P, Cui HR, Shu QY. 2002. QTL for rice grain quality based on a DH population derived from parents with similar apparent amylose content. Euphytica. 128: 317-324.
- Basten CJ, Weir BS, Zeng ZB. 1997. QTL Cartographer: A reference manual and tutorial for QTL mapping. Department of Statistics, North Carolina State University. Raleigh, NC, USA.
- Cagampang GB, Perez CM, Juliano BO. 1973. A gel consistency test for eating quality in rice. J Sci Food Agric. 24: 1589-1594.
- Cho YC, Suh JP, Won YJ, Yang CI, Park HS, Kim JJ, Han SS, Roh JH, Kim BK, Lee JH. 2013. Enhancing for broad-spectrum resistance to blast using Korean weedy rice. In: Proceeding of Translation from Genomics to Disease Management, Intl. Rice Blast Confer; pp 56.
- Ebitani T, Takeuchi Y, Nonoue N, Yamamoto T, Takeuchi K, Yano M. 2005. Construction and evaluation of chromosome segment substitution lines carrying overlapping chromosome segments of indica rice cultivar ‘Kasalath’ in a genetic background of japonica elite cultivar ‘Koshihikari’. Breed Sci. 55: 65-73.
- Fan CC, Yu XQ, Xing YZ, Xu CG, Luo LJ, Zhang QF. 2005. The main effects, epistatic effects and environmental interactions of QTLs on the cooking and eating quality of rice in a doubled-haploid line population. Theor Appl Genet. 110: 1445-1452.
- Fukuoka S, Saka N, Koga H, Ono K, Shimizu T, Ebana K, Hayashi N, Takahashi A, Hirochika H, Okuno K, Yano M. 2009. Loss of function of a proline-containing protein confers durable resistance in rice. Science. 325: 998-1001.
- He Y, Han YP, Jiang L, Xu CW, Lu JF, Xu ML. 2006. Functional analysis of starch-synthesis genes in determining rice eating and cooking qualities. Mol Breed. 18: 277-290.
- He P, Li SG, Qian Q, Ma YQ, Li JZ, Wang WM, Chen Y, Zhu LH. 1999. Genetic analysis of grain quality. Theor Appl Genet. 98: 502-508.
- Ishima T, Taira H, Mikoshiba K. 1974. Effect of nitrogenous fertilizer application and protein content in milled rice on organotropic quality of cooked rice. Rep Natl Food Res Inst. 29: 9-15.
- Juliano BO, Onate LU, Mundo AM. 1965. Relation of starch composition, protein content, and gelatinization temperature to cooking and eating qualities of milled rice. Food Technol. 19: 1006-1011.
- Juliano BO. 1971. A simplified assay for milled rice amylose. Cereal Sci Today. 16: 334-336.
- Juliano BO. 1985. Criteria and test for rice grain quality. Juliano BO, editor. Rice chemistry and technology. American Association of Cereal Chemists Inc. St Paul: pp. 443-513.
- Juliano BO. 1996. Rice quality screening with the Rapid Visco Analyzer. Walker CE, Hazelton JL, editors. Applications of the Rapid Visco Analyzer. Newport Scientific. Sydney: pp. 19-24.
- Kobayashi A, Tomita K. 2008. QTL detection for stickness of cooked rice using recombinant inbred lines derived from crosses between japonica rice cultivars. Breeding Sci. 58: 419-426.
- Kosambi DD. 1944. The estimation of map distance from recombinant values. Ann Eugen. 12: 172-175.
- Kwon S, Cho YC, Lee JH, Suh JP, Kim JJ, Kim MK, Choi IS, Hwang HG, Koh HJ, Kim YG. 2011. Identification of quantitative trait loci associated with rice eating quality traits using a population of recombinant inbred lines derived from a cross between two temperate japonica cultivars. Mol Cell. 31: 437-445.
- Li J, Zhang W, Wu H, Gou T, Liu X, Wan X, Jin J, Hanh T, Thao N, Chen M, Liu S, Chen L, Liu X, Wang J, Zhai H, Wan J. 2011. Fine mapping of stable QTLs related to eating quality in rice (Oryza sativa L.) by CSSLs harboring small target chromosome segments. Breed Sci. 61: 338-346.
- Li Z, Wan J, Xia J, Yano M. 2003. Mapping of quantitative trait loci controlling physico-chemical properties of rice grains (Oryza sativa L.). Breed Sci. 53: 209-215.
- Little RR, Hilder GB, Dawson EH. 1958. Differential effect of dilute alkali on 25 varieties of milled white rice. Cereal Chem. 35: 111-126.
- McCouch SR, Teytelman L, Xu Y, Lobos KB, Clare K, Walton M, Fu B, Maghirang R, Li Z, Xing Y, Zhang Q, Kono I, Yano M, Fjellstrom R, DeClerck G, Schneider D, Cartinhour S, Ware D, Stein L. 2002. Development and mapping of 2240 new SSR markers for rice (Oryza sativa L.). DAN Res. 9: 199-207.
- Monna L, Lin X, Kojima S, Sasaki T, Yano M. 2002. Genetic dissection of a genomic region for a quantitative trait locus, Hd3, into two loci, Hd3a and Hd3b, controlling heading date in rice. Theor Appl Genet. 104: 772-778.
- Nelson JC. 1997. Qgene: software for marker-based genomic analysis and breeding. Mol Breed. 3: 239-245.
- Nishimura M, Yamauchi F, Ohuchi K, Hamamura K. 1985. Evaluation of the eating quality of recent rice varieties and lines in Hokkaido - The relation between organoleptic and physicochemical qualities of milled rice harvested in an extremely cool year and a very hot year during the summer. Res Bull Hokkaido Natl Agric Exp Stn. 144: 77-89.
- Park HJ. 2010. QTL analysis for broad spectrum-isolates resistance to blast using advanced backcross population between Ilpumbyeo and Moroberekan in Rice. MS Thesis Chungbuk National Univ. 68. (in Korean with English abstract).
- Rural Development Administration.1990. Report of new rice variety deliberate council for local adaptability test in agricultural crops. pp. 467. (in Korean).
- Septiningshi EM, Trijatmiko KR, Moeljopawiro S, McCouch SR. 2003. Identification of quantitative trait loci for grain quality in an advanced backcross population derived from the Oryza sativa variety IR64 and the wild relative O. rufipogon. Theor Appl Genet. 107: 1433-1441.
- Shu QY, Wu DX, Xia YW, Gao MW, McClung A. 1998. Relationship between RVA profile character and eating quality in Oryza sativa L. Sci Agric Sinica. 31: 25-29.
- Takeuchi Y, Nonoue Y, Ebitani T, Suzuki K, Aoki N, Sato H, Ideta O, Hirabayashi H, Hirayama M, Ohta H. 2007. QTL detection for eating quality including glossiness, stickness, taste and hardness of cooked rice. Breed Sci. 57: 231-242.
- Takeuchi Y, Hori K, Suzuki K, Nonoue Y, Takemoto-Kuno Y, Maeda H, Sato H, Hirabayashi H, Ohta H, Ishii T. 2008. Major QTLs for eating quality of an elite Japanese rice cultivar, Koshihikari, on the short arm of chromosome 3. Breed Sci. 58: 437-445.
- Tan YF, Li JX, Yu SB, Xing YZ, Xu CG, Zhang QF. 1999. The three important traits for cooking and eating quality of rice grains are controlled by a single locus in an elite rice hybrids, Shanyou 63. Theor Appl Genet. 99: 642-648.
- Tanaka I, Kobayashi A, Tomita K, Takeuchi Y, Yamagishi M, Yano M, Sasaki T, Horiuchi H. 2006. Detection of quantitative trait loci for stickiness and appearance based on eating quality test in japonica rice cultivar. Breed Res. 8: 39-47. (in Japanese with English abstract).
- Tanaka K, Ohnishi S, Kishimoto N, Kawasaki T, Baba T. 1995. Structure, organization, and chromosomal location of the gene encoding a form of rice soluble starch synthase. Plant Physiol. 108: 677-683.
- Temnykh S, Park WD, Ayer N, Cartinhour S, Hauck N, Lipovich L, Cho YG, Ishii T, McCouch SR. 2000. Mapping and genome organization of microsatellite sequences in rice (Oryza sativa L.): Frequency, length variation, transposon association, and genetic marker potential. Theor Appl Genet. 100: 697-712.
- Tian R, Jiang GH, Shen LH, Wang LQ, He YQ. 2005. Mapping quantitative trait loci underlying the cooking and eating quality of rice using a DH population. Mol Breed. 15: 117-124.
- Umemoto T, Yano M, Satoh H, Shomura A, Nakamura Y. 2002. Mapping of a gene responsible for the difference in amylopectin structure between japonica-type and indica-type rice varieties. Theor Appl Genet. 104: 1-8.
- Wada T, Uchimura Y, Ogata T, Tsubone M, Matsue Y. 2006. Mapping of QTLs for physicochemical properties in japonica rice. Breed Sci. 56: 253-260.
- Wada T, Ogata T, Tsubone M, Uchimura Y, Matsue Y. 2008. Mapping of QTLs for eating quality and physicochemical properties of the japonica rice ‘Koshihikari’. Breed Sci. 58: 427-435.
- Wan XY, Wan JM, Su CC, Wang CM, Shen WB, Li JM, Wang HL, Jiang L, Liu SJ, Chen LM, Yasui H, Yoshimura A. 2004. QTL detection for eating quality of cooked rice in a population of chromosome segment substitution lines. Theor Appl Genet. 110: 71-79.
- Wang GL, Mackill DJ, Bonman JM, McCouch SR, Champoux CM, Nelson RJ. 1994. RFLP mapping of genes conferring complete and partial resistance to blast in a durably resistant rice cultivar. Genetics. 136: 421-434.
- Wang LQ, Liu WJ, Xu Y, He YQ, Luo LJ, Xing YZ, Xu CG, Zhang QF. 2007. Genetic basis of 17 traits and viscosity parameters characterizing the eating and cooking quality of rice grain. Theor Appl Genet. 115: 463-476.
- Yamamoto Y, Ogawa T. 1992. Eating quality in japanese rice cultivars. Jpn J Breed. 42: 177-183.