Abstract
Salt stress is by far the leading environmental stress limiting crop yields worldwide. Genetic engineering techniques hold great promise for developing crop cultivars with high tolerance to salt stress. In this study, the Brassica rapa var. SUN-3061 BrOAT1 gene was transferred into tomato through Agrobacterium-mediated leaf disc transformation. The transgenic status and transgene expression of the transgenic plants was confirmed by polymerase chain reaction (PCR) analysis and semi-quantitative one step RT-PCR analysis respectively. Subsequently, the growth status under salt stress, and physiological responses to salt stress of transgenic tomato were studied. The results showed that the transgenic plants exhibited better growth status under salt stress condition compared to the wild type plants. In physiological assessment of salt stress tolerance, transgenic plants showed more dry matter accumulation and maintained significantly higher levels of leaf chlorophyll content along with increasing levels of salt stress than the wild type plants. This study shows that BrOAT1 is a candidate gene in the engineering of crops for enhanced salt stress tolerance.
-
Key words: BrOAT1 gene, Dry matter accumulation, Leaf chlorophyll content, Salt stress, Tomato
INTRODUCTION
The rapidly growing world population has made it necessary to limit the losses of crop productivity due to plant responses to environmental stress conditions, such as elevated or low temperatures, drought, salinity, poor soil nutrition, radiation, oxidative stress, and heavy metals. These abiotic factors activate an array of signaling pathways that ultimately lead to plant adaptation to stress, either through post-transcriptional or post-translational regulation (
Mazzucotelli et al. 2008). Alternative splicing, degradation or accumulation of stress-related transcripts define the plant response to stresses at the mRNA level, whereas protein phosphorylation and dephosphorylation, ubiquitination, and sumoylation are some of the adaptive responses at the protein level (
Mazzucotelli et al. 2008). To develop plant cultivars inherently resistant to abiotic stress would help to protect crop production. However, progress in genetic improvement of crops for abiotic-limiting environments is slow and more limited (
Evenson and Gollin 2003), due to the lack of knowledge about the physiological processes limiting growth under abiotic stress conditions, poor understanding of abiotic stress tolerance mechanism, and lack of efficient techniques for screening breeding materials for abiotic stress tolerance (
Khush 2001). The physiological role of δ-OAT is still not well understood in plants. Although some evidences has associated this enzyme with proline accumulation observed during salt or hydric stress, contradictory data exist about its contribution to this route. Increased δ-OAT activity in NaCl-treated radish (
Raphanus sativus) cotyledons (
Hervieu et al. 1995) and gene expression in young
Arabidopsis plantlets exposed to 200 mM NaCl (
Roosens et al. 1998) support a contribution of δ-OAT activity to proline synthesis under salt stress. However, although free proline level increased under salt-stress conditions in 4-week-old
Arabidopsis plants, the δ-OAT activity was unchanged and δ-OAT mRNA was not detectable (
Roosens et al. 1998). Furthermore,
Delauney et al. (1993) reported that levels of mRNA corresponding to δ-OAT decreased in response to salt stress in
V. aconitifolia plants, whereas the transcript levels were elevated in plants supplied with excess of nitrogen. In this paper, we report the isolation and molecular characterization of
BrOAT1 gene encoding δ-OAT from Chinese cabbage and introduced the
BrOAT1 into tomato through
Agrobacterium tumefaciens-mediated transformation. The growth and physiological responses of transgenic plants under salt stress were also investigated.
MATERIALS AND METHODS
Plant material and growth conditions
Brassica rapa seeds (‘SUN-3061’ ecotype) were sown in vitro on solid MS medium and grown in a culture room (24 ± 1°C, 16-h light/8-h dark cycle). Young (12-d-old) or older (4-week-old) plants were transferred to liquid MS medium 24 h before the induction of salt stress. Salt-stress treatment is consisted of replacing the MS solution with the same solution containing 200 mM NaCl for 6, 24 and 72 h.
Isolation of full-length cDNA of BrOAT1
The BrOAT1 fragment was identified from the dbEST division of GenBank using the blast program with the specific by comparing the δ-OAT amino acid sequences. The full-length cDNA was isolated using RACE technology with the SMART RACE-PCR kit (Clontech, Palo Alto, CA, USA).
Epifluorescence analysis
GFP fusion was constructed as described (
Yap et al. 2005). The entire coding region of
BrOAT1 was amplified by PCR. The attB-PCR products were cloned into pGWB6 (35S::sGFP::NOS) vector to fuse to green fluorescence (GFP) using the GATEWAY cloning system (Invitrogen, Carlsbad, CA, USA). As the control, a plasmid expressing only GFP was used. The plasmid (
35S::BrOAT1::sGFP ::NOS) was introduced into onion epidermis cell by biolistic bombardment, and observed for localization of GFP with a confocal microscope.
Total RNA from leaf tissue was extracted using Trizol reagent (Invitrogen, San Diego, CA, USA) according to the manufacturer’s protocol. The specific primers for expression analysis of
BrOAT1 were: BrOATF1 5′-ATGGCAGCA-GCCACGAGACGA-3′ and BrOATR1 5′-CGTGAAC-TTAGAGAGTGAGCTTCTGCAC-3′. Real-time PCR was performed using a Bio-Rad I Cycler IQ5 (Bio-Rad, Seoul, Korea) as previously described (
Ali-Benali et al. 2005), using RT pre-mix (TOYOBO Co., Osaka, Japan). The threshold cycle (Ct) values of PCR reactions from three independent biological replicates were averaged, and the relative quantification of expression levels was performed using the comparative Ct method for all experiments (
Livak & Schmittgen 2001). First-strand cDNA was generated using Superscript III Reverse Transcriptase according to manufacturer’s instructions (Invitrogen). The cDNA (50 ng) was used as template for amplification of
BrOAT1 using primer pairs 5′-ATGGCAGCAGCCACG-AGACGA-3′ and 5′-ACTCGCTAACCGCAAAGTACT-TCAT-3′. The PCR amplification program consisted of an initial step at 94°C for 5 min followed by 30 cycles of 94°C for 1 min, 58°C for 1 min, 72°C for 2 min, and a final step at 72°C for 10 min.
The 1,431 bp open reading frame (ORF) of the
BrOAT1 cDNA was amplified by polymerase chain reaction (PCR) using the forward primer BrOATF2 carrying
BglII restriction site (5′-GAAGATCTAAATGGCAGCAGCCACGAGACGA-3′) and the reverse primer BrOATR2 carrying
SacI restriction site (5′-CGAGCTCCCCTCAAGCATAGAG-GCTTCTTC-3′). The amplified product was purified and cloned into the pMD-18T vector (Takara, Korea), and digested with
BamHI and
SacI. Subsequently the resulting fragment was inserted into the
BamHI and
SacI-pre-digested modified expression vector pCAMBIA2300. The resulting vector, pCAMBIA::
BrOAT1 (
Fig. 5-I), contained the
BrOAT1 gene driven by the CaMV35S promoter and terminated by nopaline synthase terminator (Nos). The pCAMBIA::
BrOAT1 was introduced into
A. tumefaciens strain EHA105 by the freeze-thaw transformation method. Single transformed colony was transferred into liquid bacterial culture medium (LB medium with 50 mg/L rifampicin, 25 mg/L streptomycin and 50 mg/L kanamycin) and shaken at 240 rpm at 28 °C for 2 days. The suspension was then mixed with sterile glycerol (1 : 1 v/v) and stored at −70°C until use.
Cotyledons from the 2-week-old tomato seedlings grown in the growth chamber were used for cocultivation with
A. tumefaciens to generate transgenic plants, according to the method of
Van Roekel et al. (1993).
PCR analysis of kanamycin-resistant plants
Total genomic DNA was isolated from leaves of the kanamycin-resistant tobacco plants as well as untransformed control plants using SDS method (
Doyle and Doyle 1990). The presence of transgene in putative transgenic plants was detected by PCR method with primers BrOATF2 and BrOATR2. The expected amplified product size was about 1,431 bp. The PCR was performed in a total volume of 25 ml containing 2 ml DNA, 10 pmol each of primers, 10 mM dNTPs, 1 × PCR buffer, 1 × MgCl
2 and 0.5 U
Taq polymerase (Takara, Dalian, China). The PCR reaction was carried out by denaturing the template at 94°C for 5 min followed by 35 cycles of amplification (1 min at 94°C, 1 min at 58°C and 2 min at 72°C) and by extension at 72°C for 8 min.
Semi-quantitative one-step RT-PCR analysis
For semi-quantitative one-step RT-PCR analysis, one mg of total RNA extracted from young leaves of transgenic plants was used as the template in RT-PCR with the forward primers BrOATF1 and reverse primers BrOATR2 by using one-step RT-PCR kit (Takara, Korea). The template was reversely transcribed at 50°C for 30 min and denatured at 95°C for 2 min, followed by 25 cycles of amplification (95°C for 30 s, 59°C for 30 s, 72°C for 2 min) and by extension at 72°C for 10 min. The RT-PCR reaction for the house-keeping gene (actin gene) using specific primers actF (5′-GTGACAATGG AACTG GAATG-3′) and actR (5′-AGACGGAGGATAGCGTGAGG-3′) was performed as described above as the control. Band intensity was quantified by Quantity One analysis software (Bio-Rad Laboratories), and the fold change was calculated by the signal intensity of transgenic plants-specific product divided by the signal intensity of WT-specific product.
Salt stress tolerance analysis of T0 transgenic plants
Several independent transgenic tomato plants (T0 generations) expressing BrOAT1 gene and the untransformed control plants were micropropagated into four copies and grown under 14 h photoperiod. Each of the controls and transgenic plants was subjected to four different salt stress treatments. The concentrations of NaCl supplementation were increased stepwise by 50 mM every 2 days for each group to the indicated maximum: (i): 50 mM, (ii): 100 mM, (iii): 150 mM, (iv): 200 mM.
Genetic analysis of the BrOAT1 gene in T1 progenies
Four independent T0 primary transgenic plants expressing BrOAT1 gene, AT14, AT37, AT77 and AT95, were grown to maturity in greenhouse. T1 seeds of these plants were harvested and then sown in soil in the greenhouse. The germinated T1 plants were analysed for the presence of the BrOAT1 gene by PCR analysis using the method mentioned before.
Salt stress tolerance assays of T1 transgenic plants
Four independent transgenic tobacco T1 lines expressing BrOAT1 gene, AT14, AT37, AT77 and AT95, were germinated on MS media supplemented with 100 mg/L kanamycin. Meanwhile the wild type plant was germinated on MS media. The seedlings were used for salt stress tolerance assays.
Bioassay of whole plant
Two-week-old tomato plants were placed on MS medium under three levels of salt stress treatments by supplement with different concentration of NaCl: 100 mM, 200 mM and 400 mM. A parallel experiment in MS without any NaCl was set-up as the control. Tolerance was assessed on the basis of the accumulation of dry matter and leaf relative water content (RWC) after 1 month under water stress challenge compared to the controls. Dry matter weights were determined after oven drying the tissues at 100°C for 72 h. RWC = (leaf fresh wt.–leaf dry wt.)/leaf fresh wt. Ten replicates per line after treatment were sampled for this test.
Leaf total chlorophyll content assay
Six-week-old tomato plants were used in this experiment. The plants were transferred to MS medium under three levels of salt stress by supplement with different concentration of NaCl: 100 mM, 200 mM and 300 mM. A parallel experiment in MS without any NaCl was set up as the control. The leaf total chlorophyll content was monitored after 15 days subjecting the plants to salt stress. The chlorophyll content was determined by extraction from leaf tissue in 95% alcohol. Leaf slices weighing about 0.2 g were placed in 25 ml of alcohol in 50 ml tubes protected from light overnight. Absorbance (OD) of the extract was obtained at 665 nm and 649 nm respectively.
Total chlorophyll content (mg/g fresh wt.) = [(13.95 × OD665 − 6.88 × OD649) + (24.96 × OD649 − 7.32 × OD665) × V]/(1000 × W), with V being the volume of the extract and W being the fresh weight of leaf tissue in g. Three replicates per line after treatment were sampled for this test.
Assay of seed germination under salt stress
Surface-sterilized seeds from four independent transgenic tomato T1 lines and untransformed control plants were plated on MS media under three levels of salt stress by supplement with different concentration of NaCl: 100 mM, 200 mM and 300 mM. A parallel experiment in MS without any NaCl was set-up as the control. The tested seeds were kept at 25 °C under dark condition. Germinated seeds were scored every day. After 25 days, the germination rates were counted, and three replicates per line after treatment were sampled for this test.
RESULTS
Cloning and sequence analysis of BrOAT1
A partial cDNA of
BrOAT1 was identified through a database search of the dbEST division of GenBank with a δ-OAT protein motif as the probe sequence. The full-length cDNA of
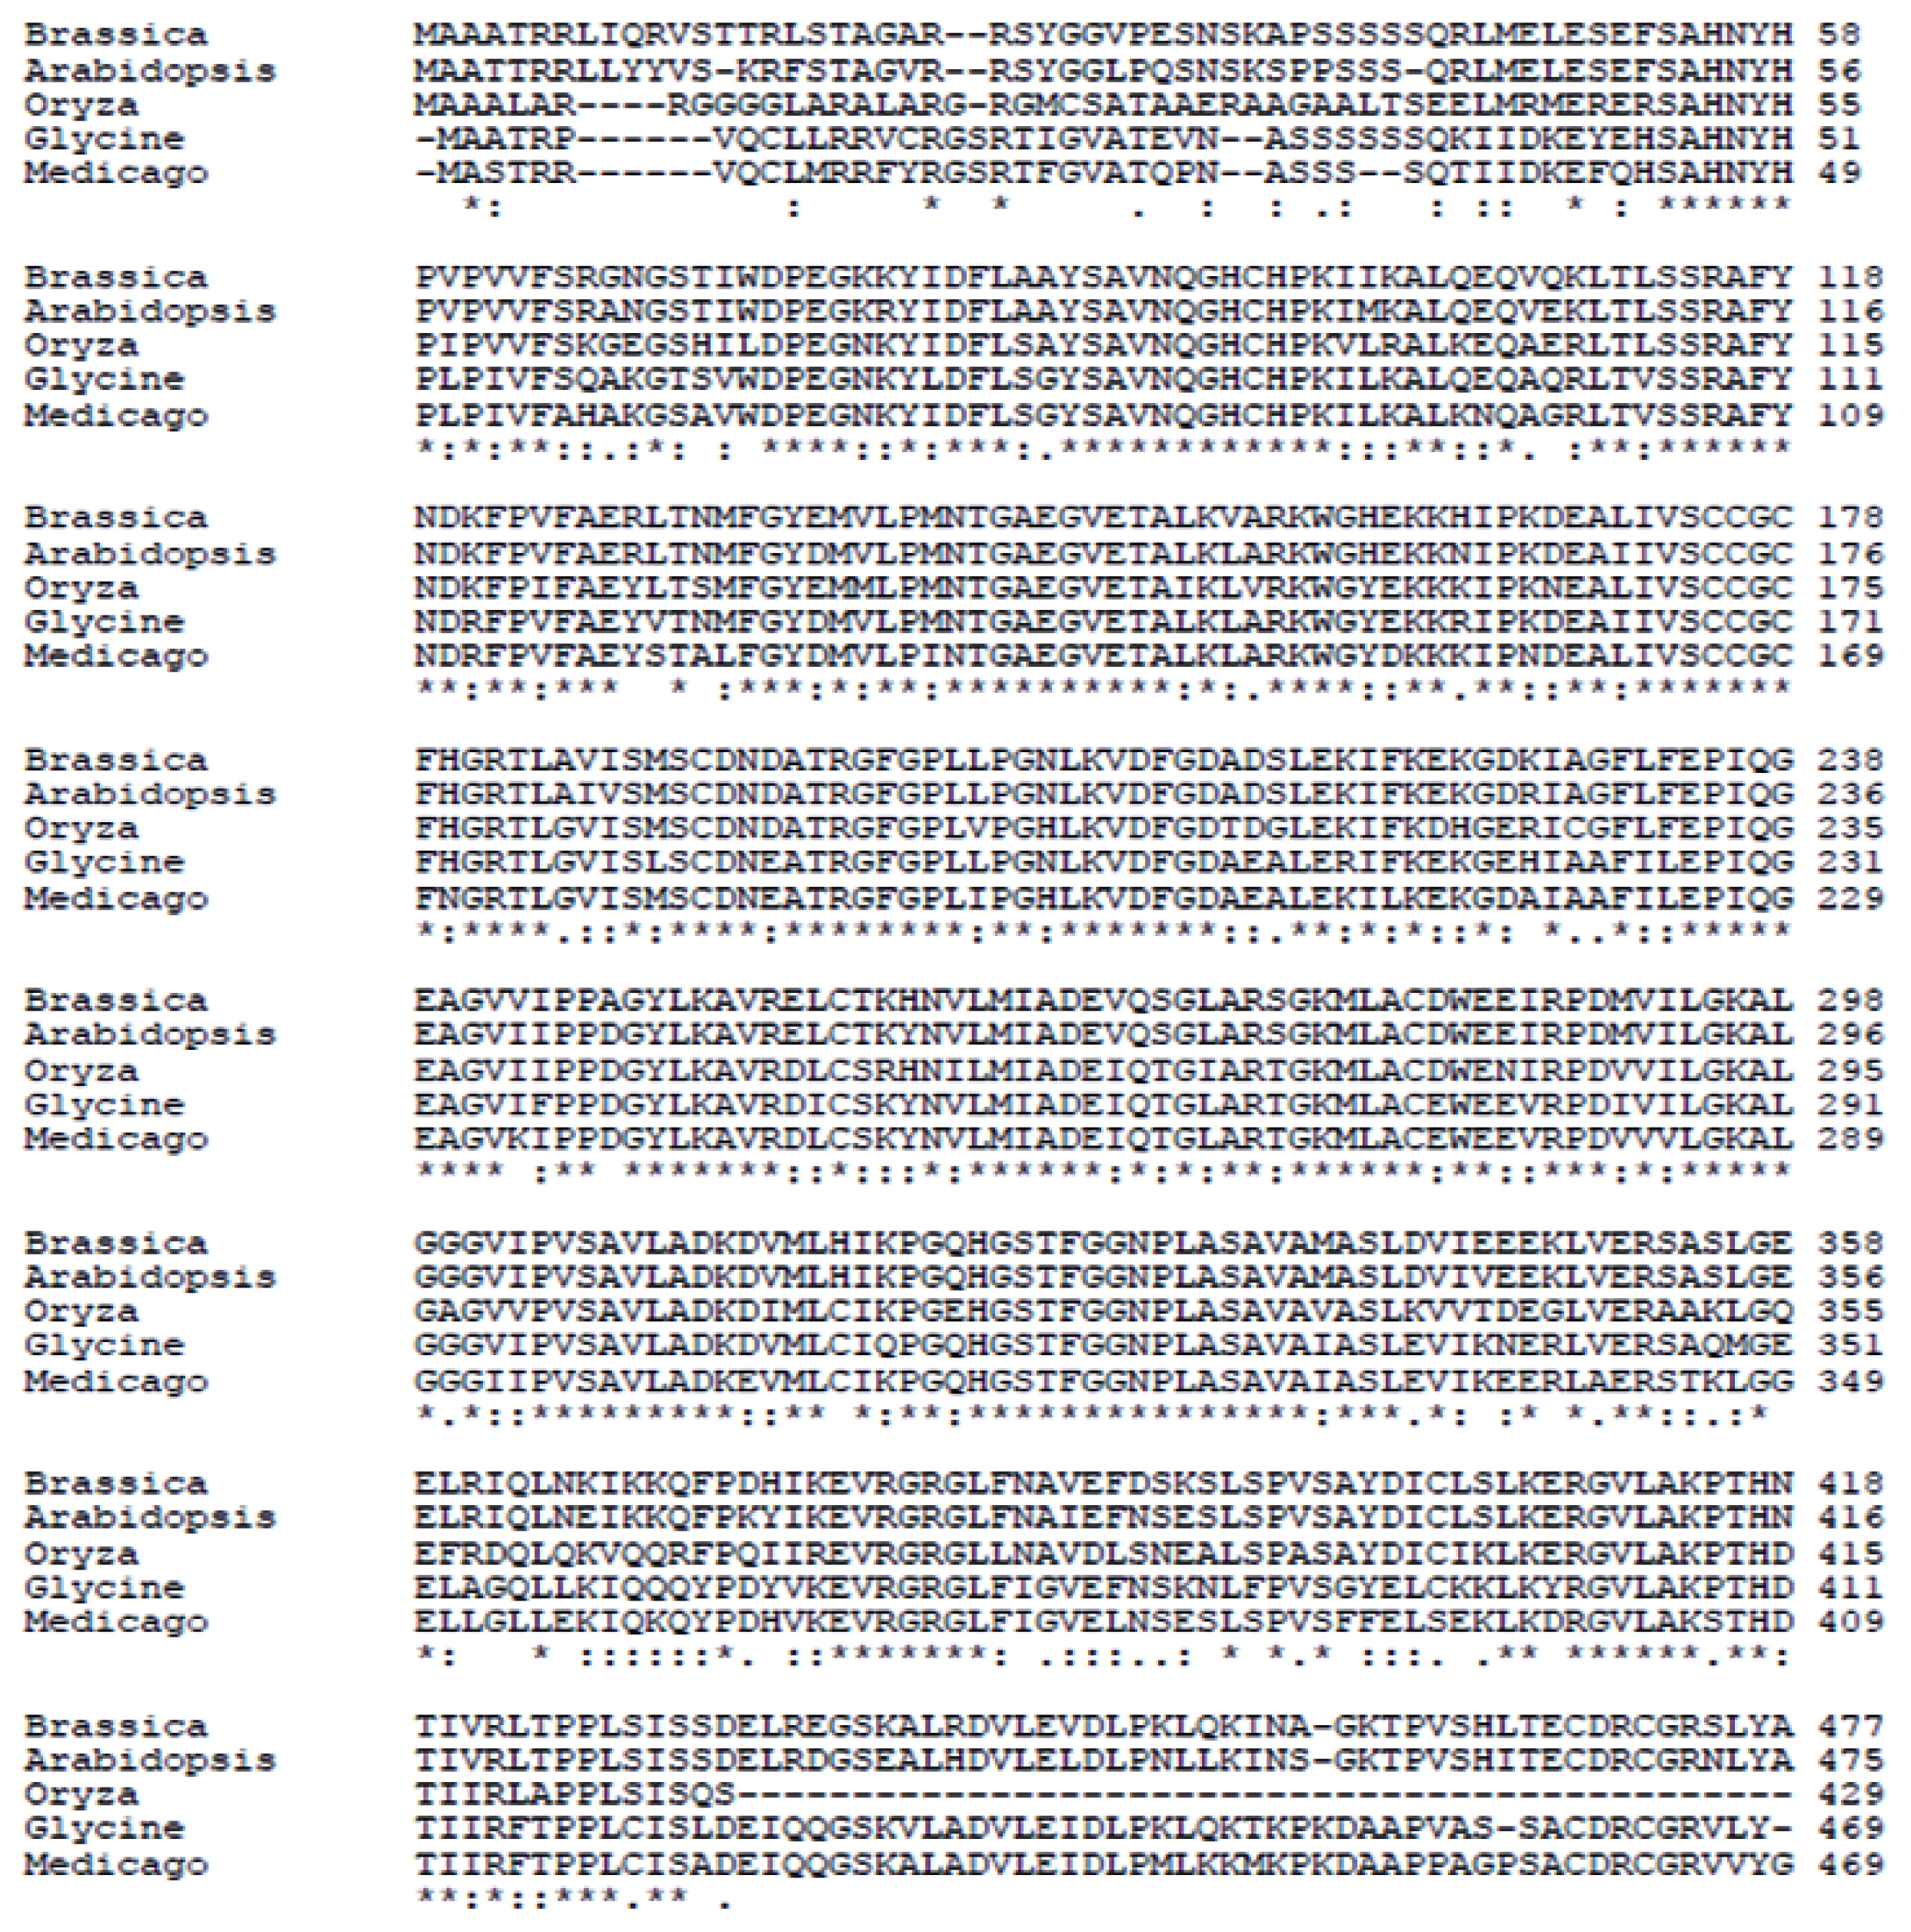
BrOAT1 was isolated using RACE-PCR, revealing the gene is 1,735 bp in length and consists of a 76 bp 5′-untranslated region (UTR), a complete ORF of 1,431bp encoding a polypeptide of 477 amino acids and a 3′-UTR of 228 bp (GenBank accession number AB300311). A BLAST protein sequence analysis showed that
BrOAT1 exhibited high identity over the entire protein length with NP_199430 (95%), ABA86965 (97%), AAU90265 (97%) and CAC82185 (97%) (
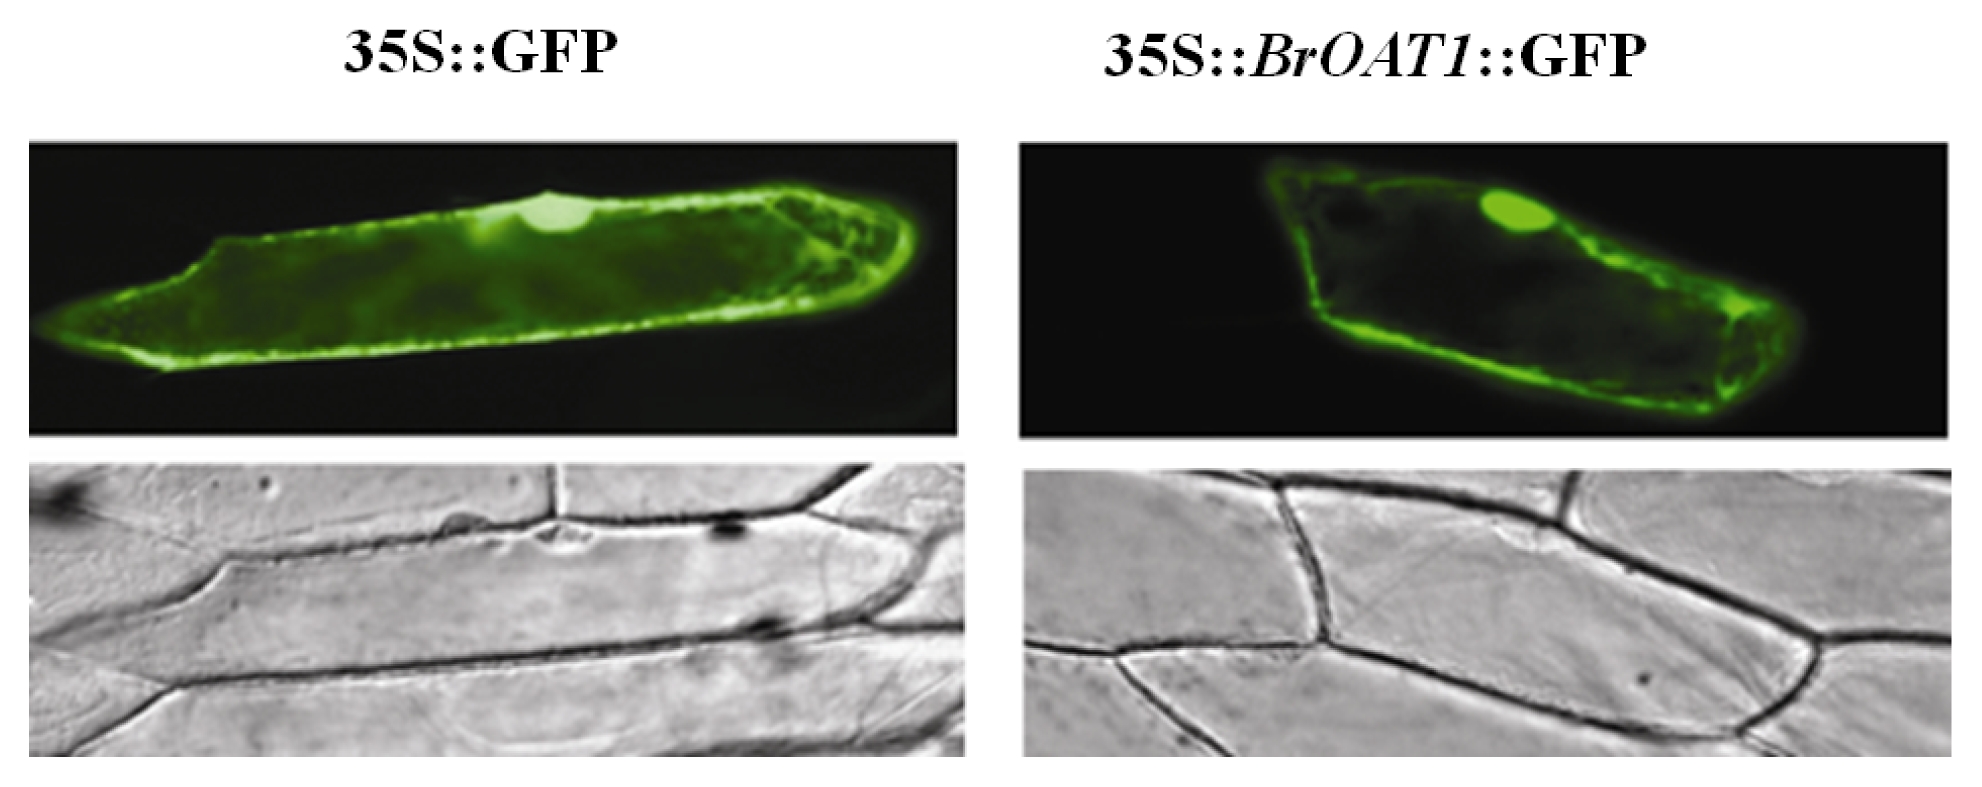
Fig. 1). Cellular localization of a
BrOAT1::GFP fusion transiently transformed into onion cell and visualized with confocal microscopy was expressed in the cell membrane and cytoplasm (
Fig. 2).
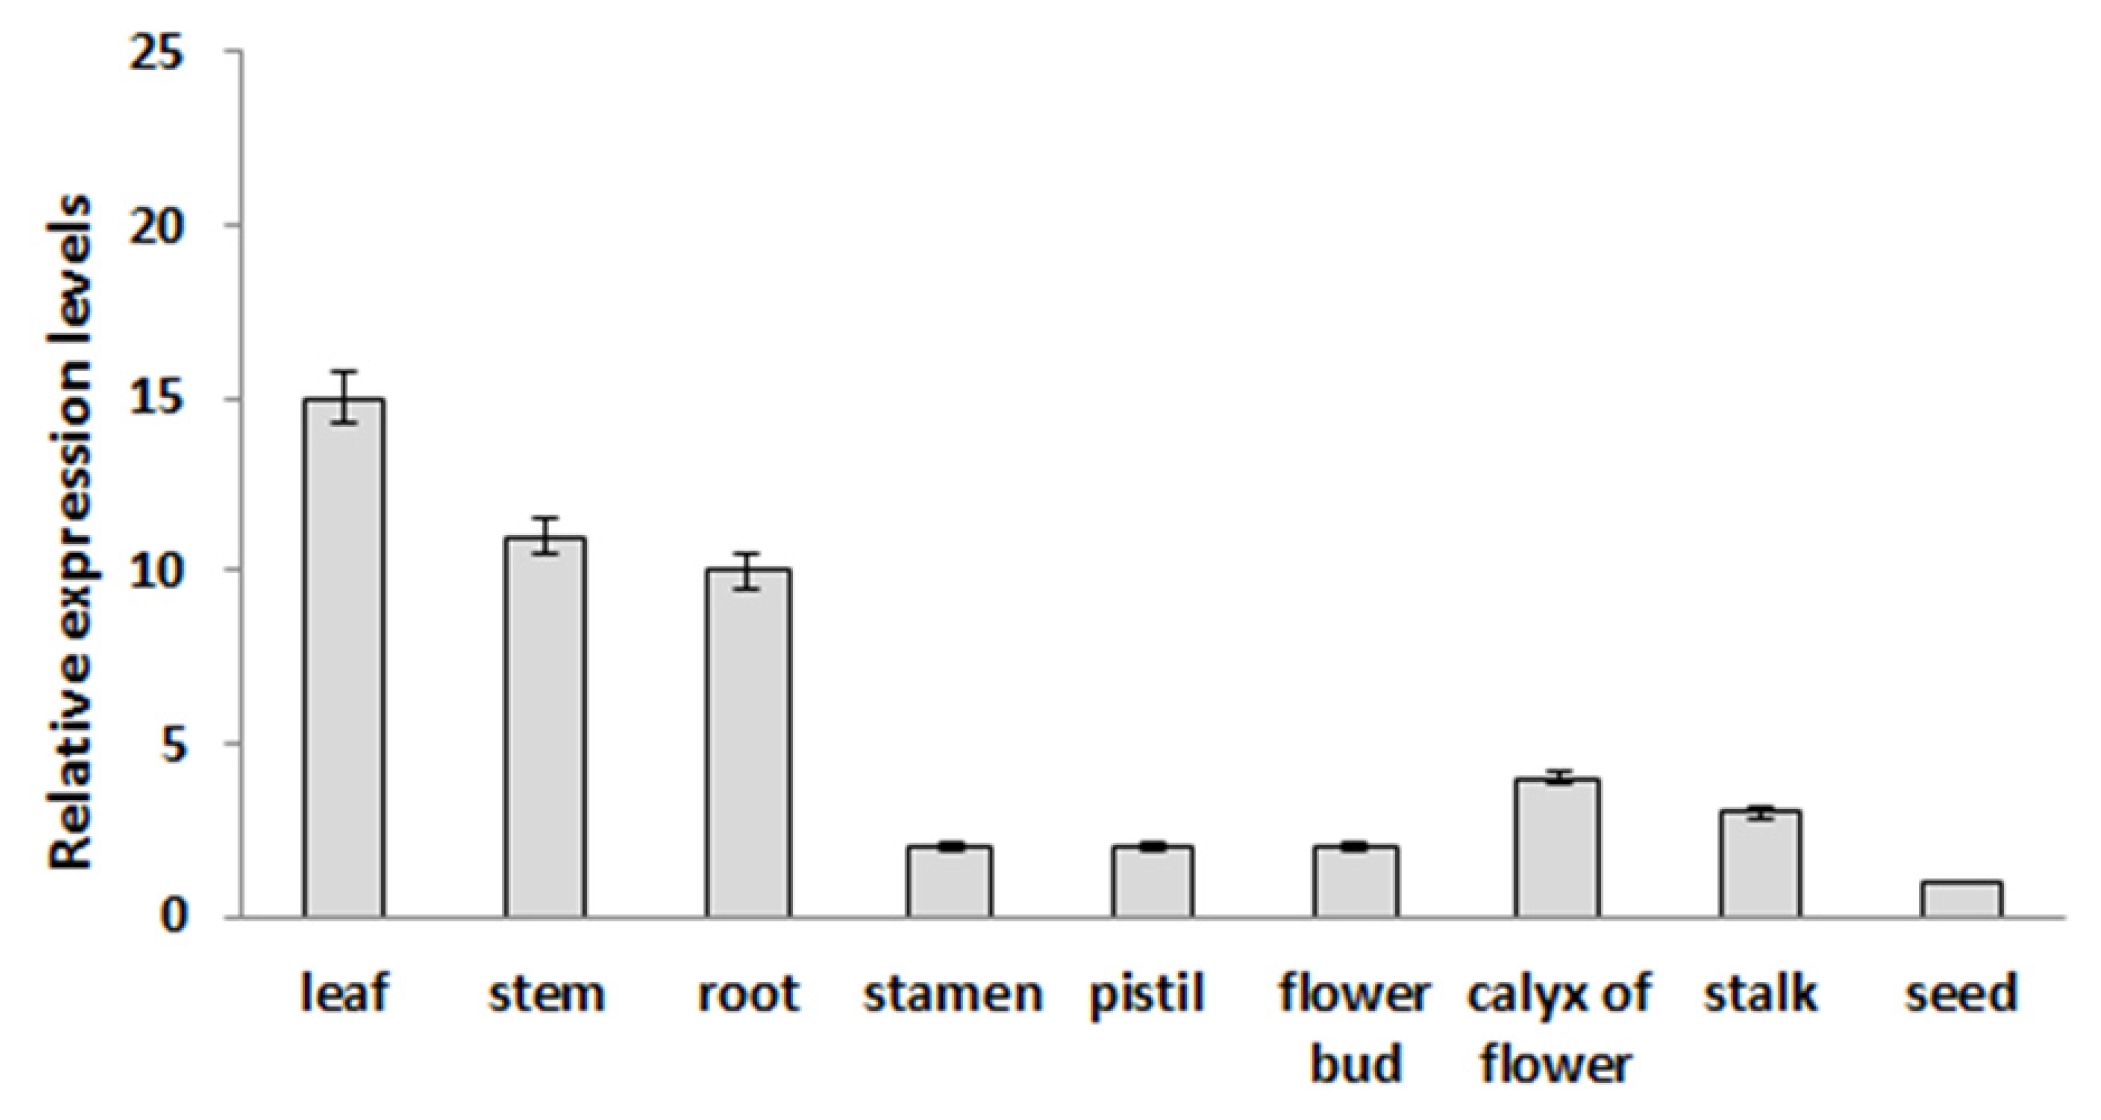
Expression analysis of the
BrOAT1 gene was examined in vegetative tissues (leaf, stem and root), reproductive tissues (stamen, pistil, petal, flower bud, calyx of flower and flower stalk) and during seed germination. Semi-quantitative RT-PCR analysis showed broad expression of the
BrOAT1 transcript across tissues which are highest in the leaf among vegetative tissues and in flower buds among reproductive tissues, but absent in seeds (
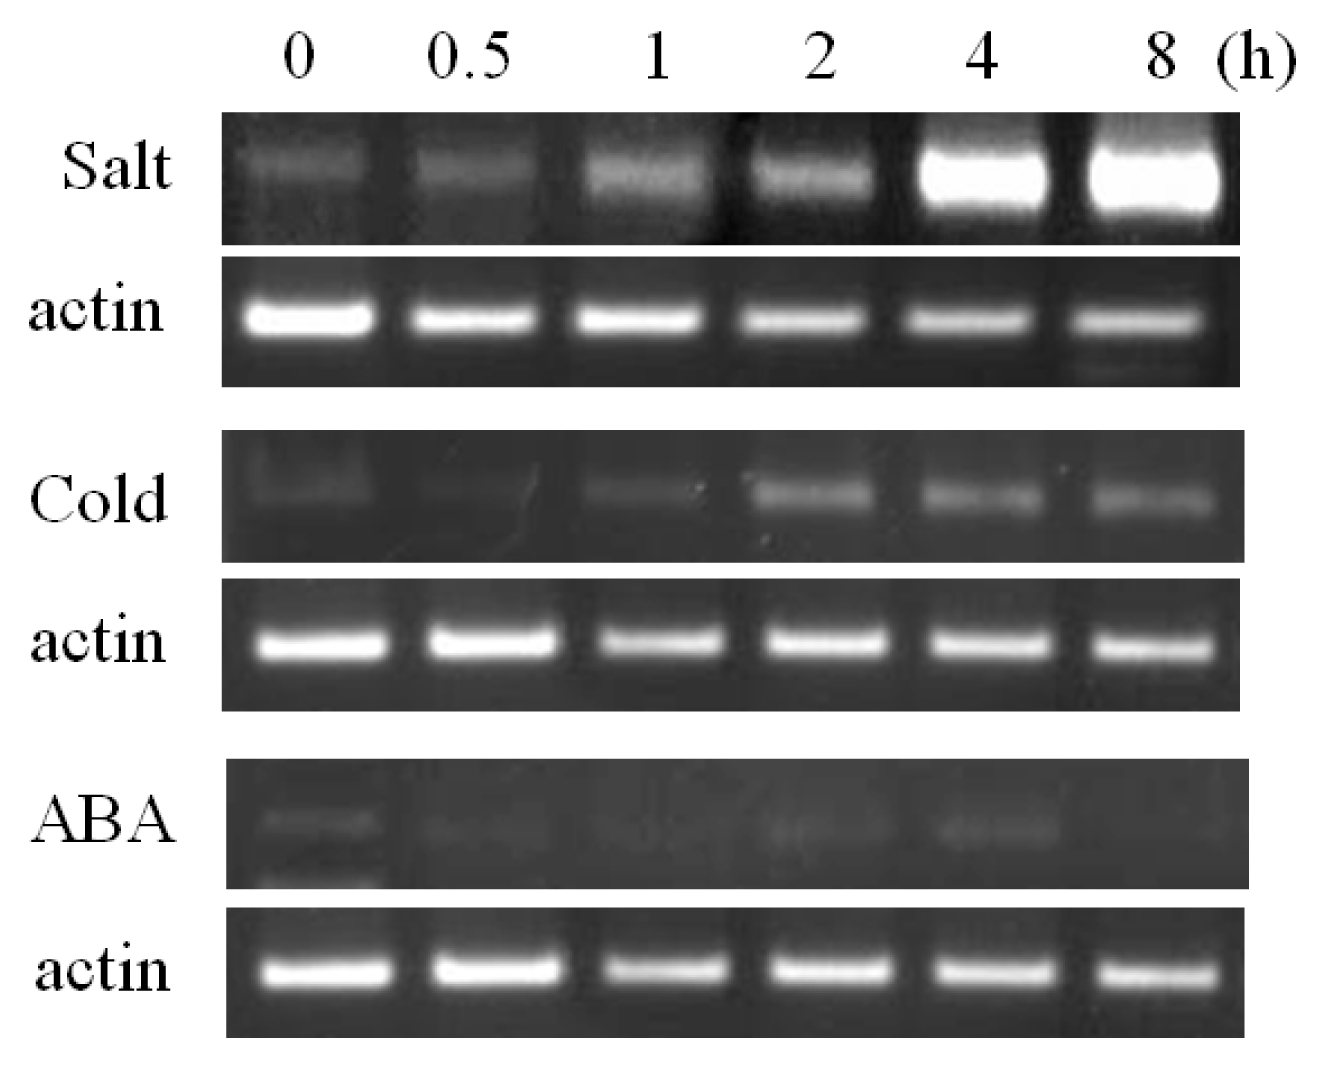
Fig. 3). The RT-PCR analysis showed that
BrOAT1 was induced under various abiotic stresses in seedlings. In the presence of salt (150 mM NaCl), transcript levels of
BrOAT1 gene were rapidly induced several fold by 30 min, reaching a peak after 4 h, then returning to pre-treatment levels (
Fig. 4). Also
BrOAT1 transcripts showed rapid induction, peaking at nine fold after 1 h of exposure to cold (4°C), followed by a gradual increase in expression to pre-treatment levels during the next several hours of exposure (
Fig. 4). We also examined
BrOAT1 after treatment with ABA to determine if this stress hormone might be involved in regulating its transcript levels. Exogenous ABA treatment (100 mM) resulted in strong
BrOAT1 induction within 30 min, gradually decreasing to pre-treatment levels by 8 h (
Fig. 4).
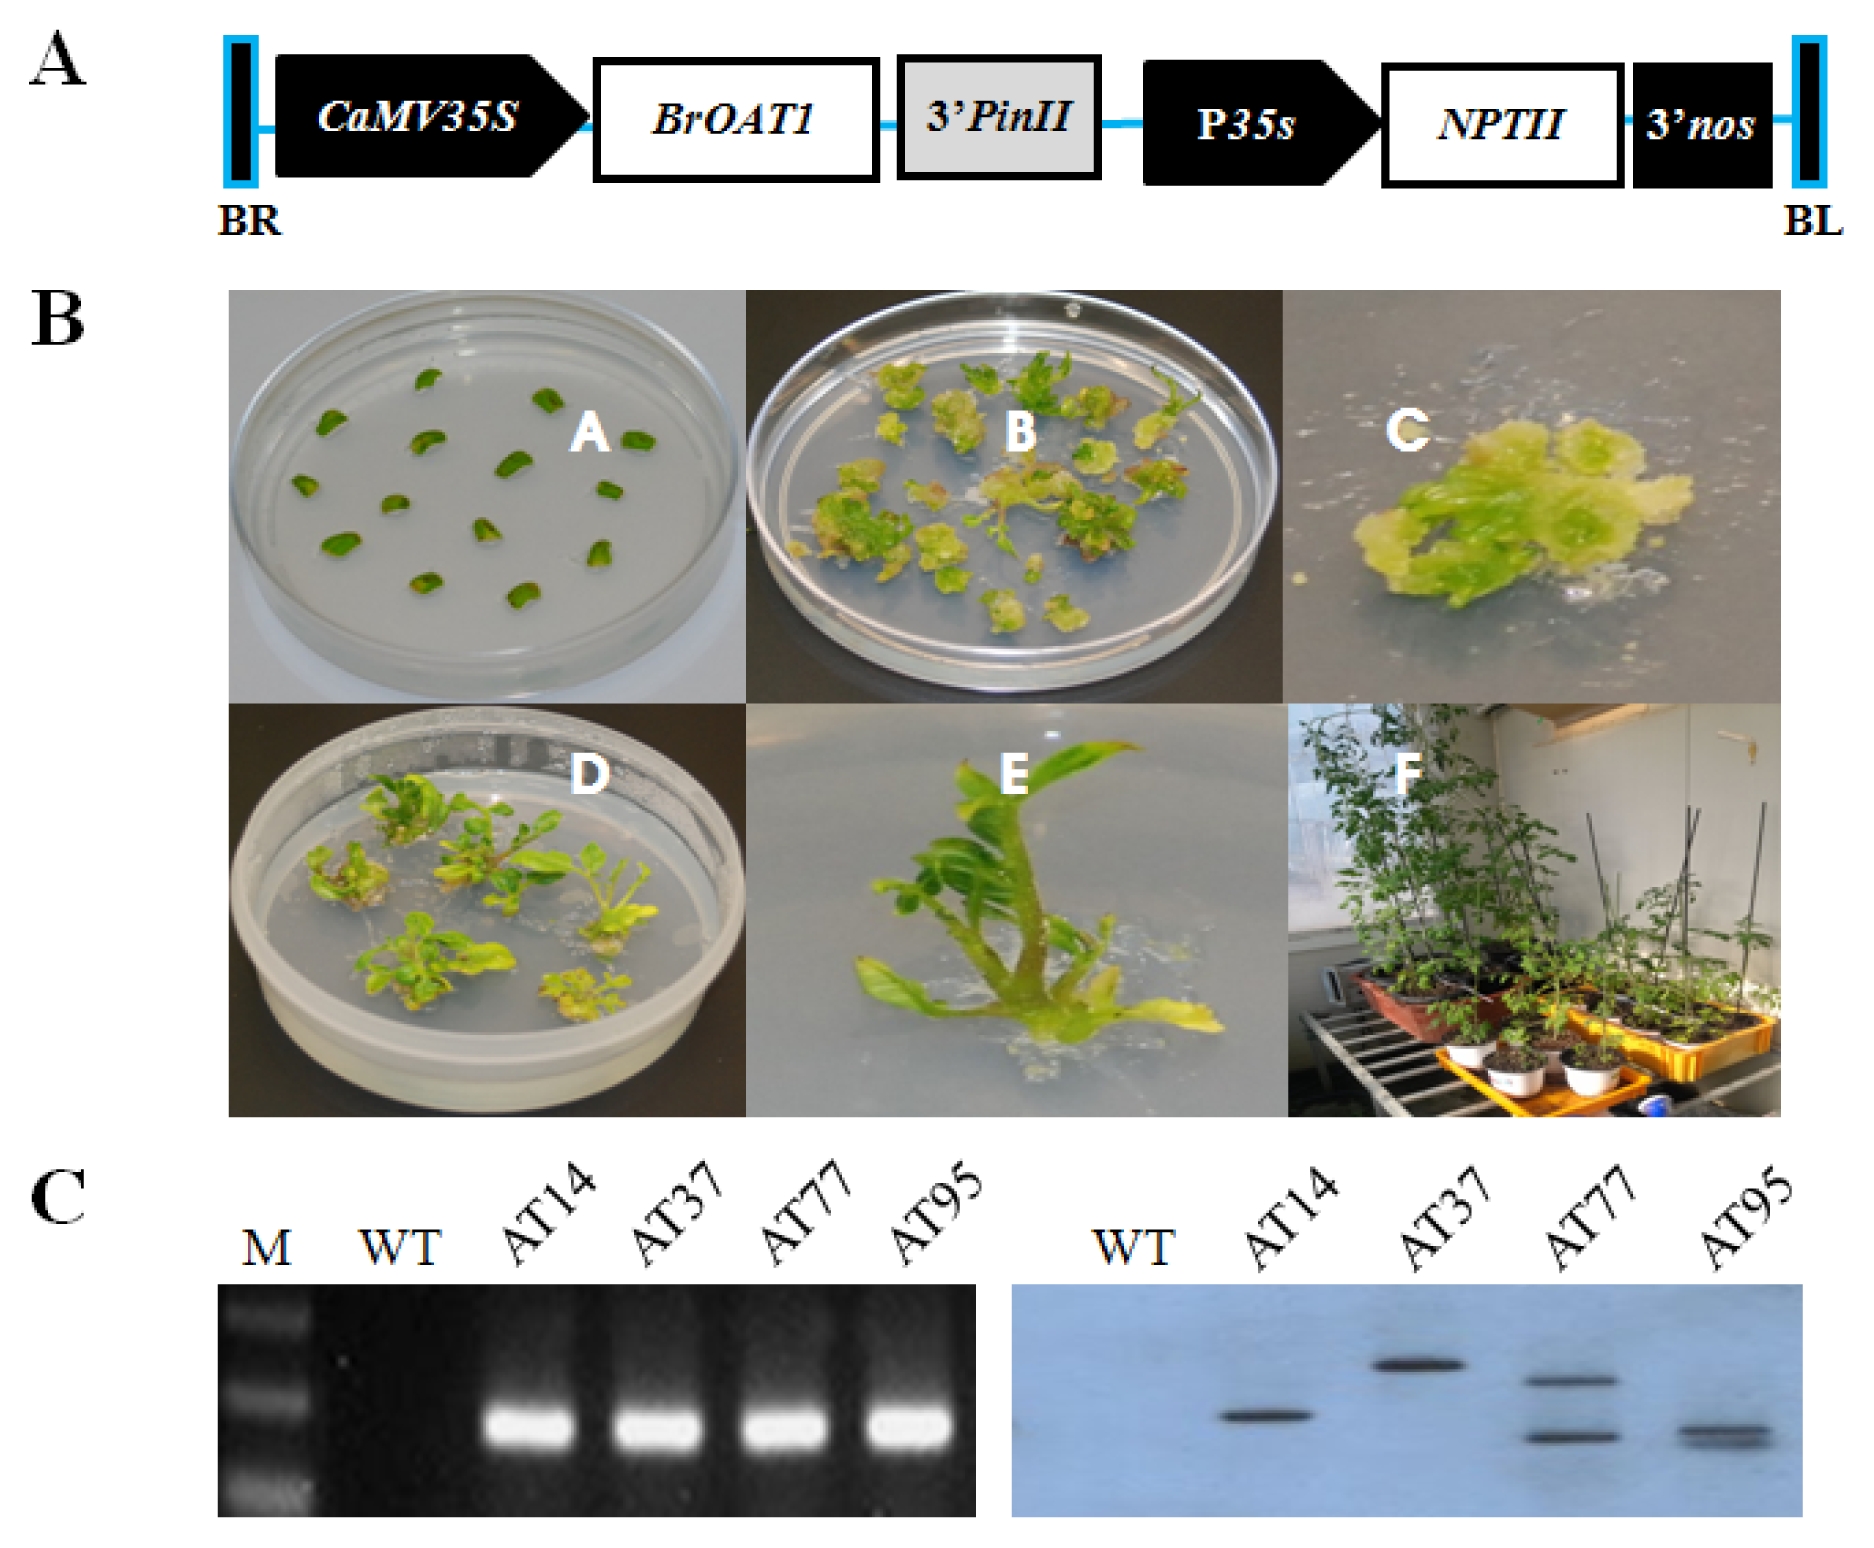
The leaf explants were transferred to fresh selection medium MS2 after 2 days of co-cultivation on MS1 medium. One week later, some explants had grown larger and thicker, followed by shoots regeneration which gradually appeared from the edges of these explants. After one month, 138 shoots of 2–3 cm in length were cut from the base of explants and placed on rooting medium MS3. After 2 weeks, 130 kanamycin-resistant plants developed normal roots on MS3. These 130 plants were transplanted to perlite for further molecular analysis and functional tests. Later, some plants were transferred to soil in greenhouse for seed production (
Fig. 5B). The presence of transgenes in putative transgenic plants was first analysed by PCR with specific primers to
BrOAT1 gene. Among 130 transformants, 36 were found to be positive for the
BrOAT1 gene through PCR analysis (data not shown). Subsequently, to further confirm transgenic status of the
BrOAT1-positive plants and to determine the copy number of insertions in independent transgenic lines, the genomic DNA was digested with
BglII and hybridized with labelled 1.4 kb
BrOAT1 gene probe. Southern analysis confirmed the integration of the
BrOAT1 gene in the genome of some transgenic lines, including AT14, AT37, AT77 and AT95. The number of the
BrOAT1 gene insertions in transgenic lines varied from 1 to 2, while the wild type plant did not show any hybridization signal (
Fig. 5C).
T1 progenies derived from the independent primary transformants (AT14, AT37, AT77 and AT95) expressing
BrOAT1 gene were analyzed for the segregation patterns of the induced
BrOAT1 gene by PCR analysis. The
BrOAT1 gene in 3 lines except the AT77 was segregated at a ratio of 3 : 1 (
Table 1), indicating the integration of the transgenes into tomato genomes in Mendelian manner.
Under the treatment of 50 mM NaCl, the control plants maintained the growth at the same rate as the transgenic plants. Under the 100 mM NaCl treatment, the leaves of the control plants became yellow much more quickly than the transgenic plants and some leaves wilted. The control plants after 200 mM NaCl treatment wilted quickly and died after 8 days, while the transgenic ones could grow with some leaves wilted. After 8 days of salt stress treatment, the transgenic plants were transplanted to soil in greenhouse where they flowered and produced seeds. This result showed that the transgenic plants maintained a better growth status than the wild type plants under salt stress.
Bioassay of whole plant
By being cultured on the salt stress medium, the leaves of the control plants became yellow much more quickly than those of the transgenic plants and some leaves wilted after 5 days under salt stress. Under salt stress, the transgenic plants accumulated more dry matter weight at different levels of salt stress, compared to wild type. However, there was variation among independent transgenic plants (
Fig. 6A). Dry matter production under stress conditions is a good indicator of abiotic tolerance in plants (
Reddy et al. 1992). Higher dry weight accumulation from transformed plants as compared to wild type plants clearly showed that the observed better growth of transgenic plants was due to higher biomass accumulation, not due to tissue expansion. However, there were no significant differences on the relative water content between the tested transgenic plants and the control (
Fig. 6B).
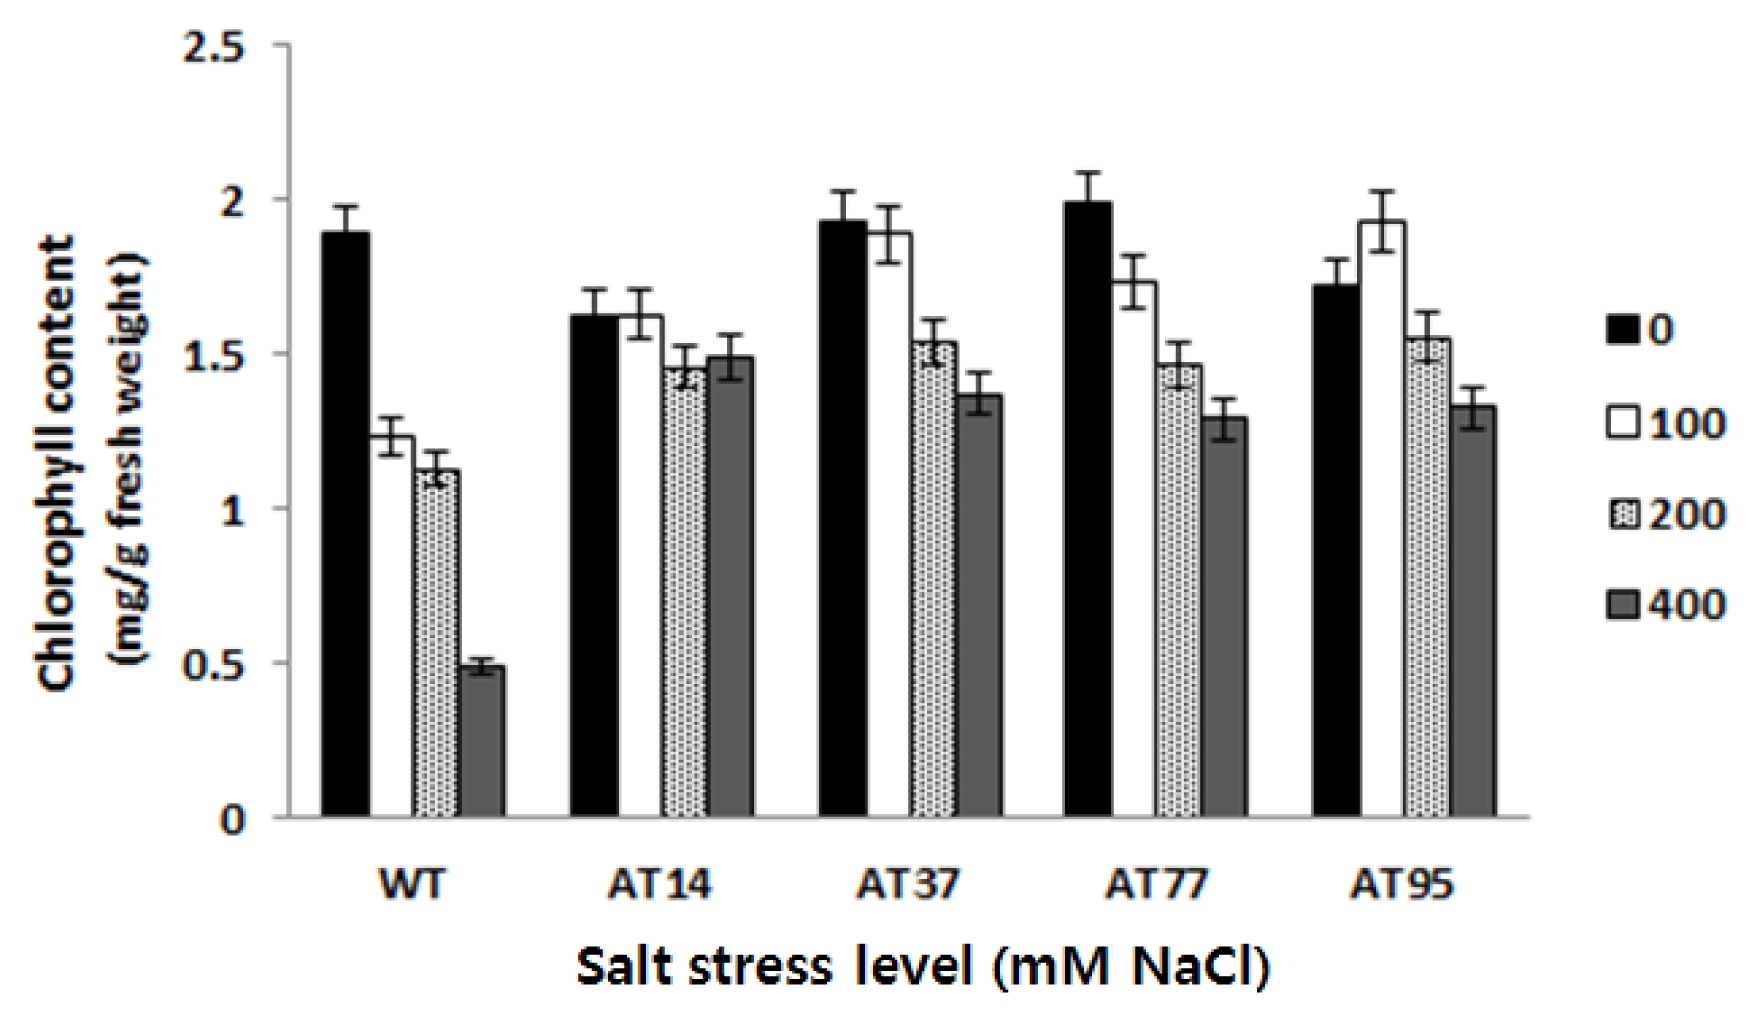
Total leaf chlorophyll content
After 15 days subjecting the plants to different salt stress levels, the total leaf chlorophyll content was monitored. The analysis of variance of the chlorophyll content data showed significant differences between transgenic plants and wild type plants according to the LSD test (
P < 0.05) (
Fig. 7). Compared to the wild type, a slower decreased of chlorophyll content in transgenic plants was observed along with the increase of salt stress level, revealing the better tolerance to salt stress. However, variation among independent transgenic plants was observed where transgenic plant named AT77 showed the highest total leaf chlorophyll content.
After 25 days germinating on the salt stress medium, the germination rates were counted and measured by LSD statistical analysis. Compared to the wild type, the transgenic lines maintained higher germination rate at different levels of salt stress. There were significant differences on the germination rate between the tested transgenic lines and the wild type. However, there was variation among independent transgenic lines (
Fig. 8). Line AT14 showed the highest level while line AT37 showed the lowest also indicate here the data/percentage rate value level on the germination rate.
DISCUSSION
In angiosperms, it has been proposed that δ-OAT plays an important role in proline biosynthesis during vegetative development and in response to different types of stresses (
Delauney et al. 1993;
Roosens et al. 1998). However, the contribution of the enzyme to Glu biosynthesis in plants has been barely considered. In this report, we have isolated the cDNA encoding the full δ-OAT protein from
B. rapa. The similarity of the predicted δ-OAT protein with the amino acid sequences from bacteria, yeast, and mammals was high (about 70%). However, the similarity with the only plant sequence available, moth bean, was only 65%. This did not seem to be associated with the existence of different isoforms of OAT. In fact, it is well known that two forms exist, α-OAT and δ-OAT (
Heimberg et al. 1990;
Schultz and Coruzzi 1995). The
BrOAT1 protein may play a role to enhance plants’ tolerant to abiotic stress. It is important to analyze the functions of stress-inducible genes not only to understand the molecular mechanisms of stress tolerance and responses of higher plants, but also to improve the stress tolerance of crops by gene manipulation. It was reported earlier that constitutive expression of proteins might hamper the normal growth of transgenic plants resulting in smaller phenotypes as compared to WT plants. However, in the present study, though some T0 transgenic plants showed smaller phenotypes, most of T0 and T1 transgenic plants had normal growth rate and showed normal phenotypes compared to the control plants. Analysis of the salt stress tolerance of T0 transgenic plants showed that the transformants exhibited better growth status under NaCl stress compared to the wild type plants. Physiological assessment of the salt stress tolerance of T1 transgenic lines revealed that transgenic lines showed better growth response, more accumulation of dry matter, greater stability in maintaining leaf chlorophyll content, and higher germination rate at increasing levels of salt stress, revealing higher metabolic activity and better carbon assimilation than the wild type lines. Maintenance of high (favorable) plant salt status, expressed as a high RWC, is an indication of salt stress and other stress resistance (
Bhattacharya et al. 2004;
Chandra Babu et al. 2004). However, significant difference in RWC did not exist in the early stage of plant growth generally, variation among different lines in dry matter weight could be derived from differences in plant (shoot) size (
Blum 1999), which may be a reason for no significant differences in RWC and significant differences in dry matter accumulation between the tested transgenic plants and the wild type plants. Our results demonstrate that over-expression of the
BrOAT1 gene in tomato can confer tolerance to salt stress under the tested conditions. Meanwhile, although
BrOAT1 was demonstrated to be expressed at various levels, the independent transgenic plants had similar response under salt stress, suggesting that a threshold expression of
BrOAT1 is sufficient to promote stress tolerance. Although further studies are necessary to demonstrate the molecular mechanism of
BrOAT1 gene, the results obtained in this study would be helpful for further evaluating the biological roles of
BrOAT1 gene under salt stress and in genetic modification of salt stress tolerance of crops.
ACKNOWLEDGEMENTS
This work was carried out with the support of the research grant of the iPET (Project No. 308020-5), Ministry for Food, Agriculture, Forestry and Fisheries, Republic of Korea.
Fig. 1Comparison of the deduced δ-OAT amino acid sequence from Brassica rapa (AB300311), Arabidopsis (NP_ 199430), Glycine max (ABA86965), Oryza sativa (AAU90265) and Medicago truncatula (CAC82185) protein sequences.

Fig. 2Cellular localization. Onion epidermal cell layers were bombarded with gold particles coated with 35S::BrOAT1-GFP or 35S::GFP alone, and observed by epifluorescence for GFP.

Fig. 3
BrOAT1 shows broad expression across plant tissues. A: Semiquantitative reverse transcription-polymerase chain reaction (RT-PCR) analysis of BrOAT11 in various tissues collected from Brassica rapa. Actin gene was used as a positive control and was detected in all tissues. Data presented are means ± SD of three independent replicated experiments.

Fig. 4
BrOAT1 expression is induced by abiotic stress treatments in Brassica seedlings. Expression levels were examined via RT-PCR at various times after treatment with salt (150 mM NaCl), cold (4°C) and 100 mM abscisic acid (ABA).

Fig. 5Vector construction, development of transgenic plant and DNA analysis for transgenic plant. (A); The schematic map of the transformation vector pCAMBIA::BrOAT1, (B); Development of transgenic tomato, (C); Molecular analyses of T0 transgenic plants, PCR analysis and Southern blot analysis.

Fig. 6Bioassay of T1 transgenic tomato lines for salt stress tolerance. WT; wild type plant, AT14-AT95; transgenic lines. Data represent the means of ten replicates per line per treatment ± standard error. (A) Dry matter accumulation. (B) Relative water content.
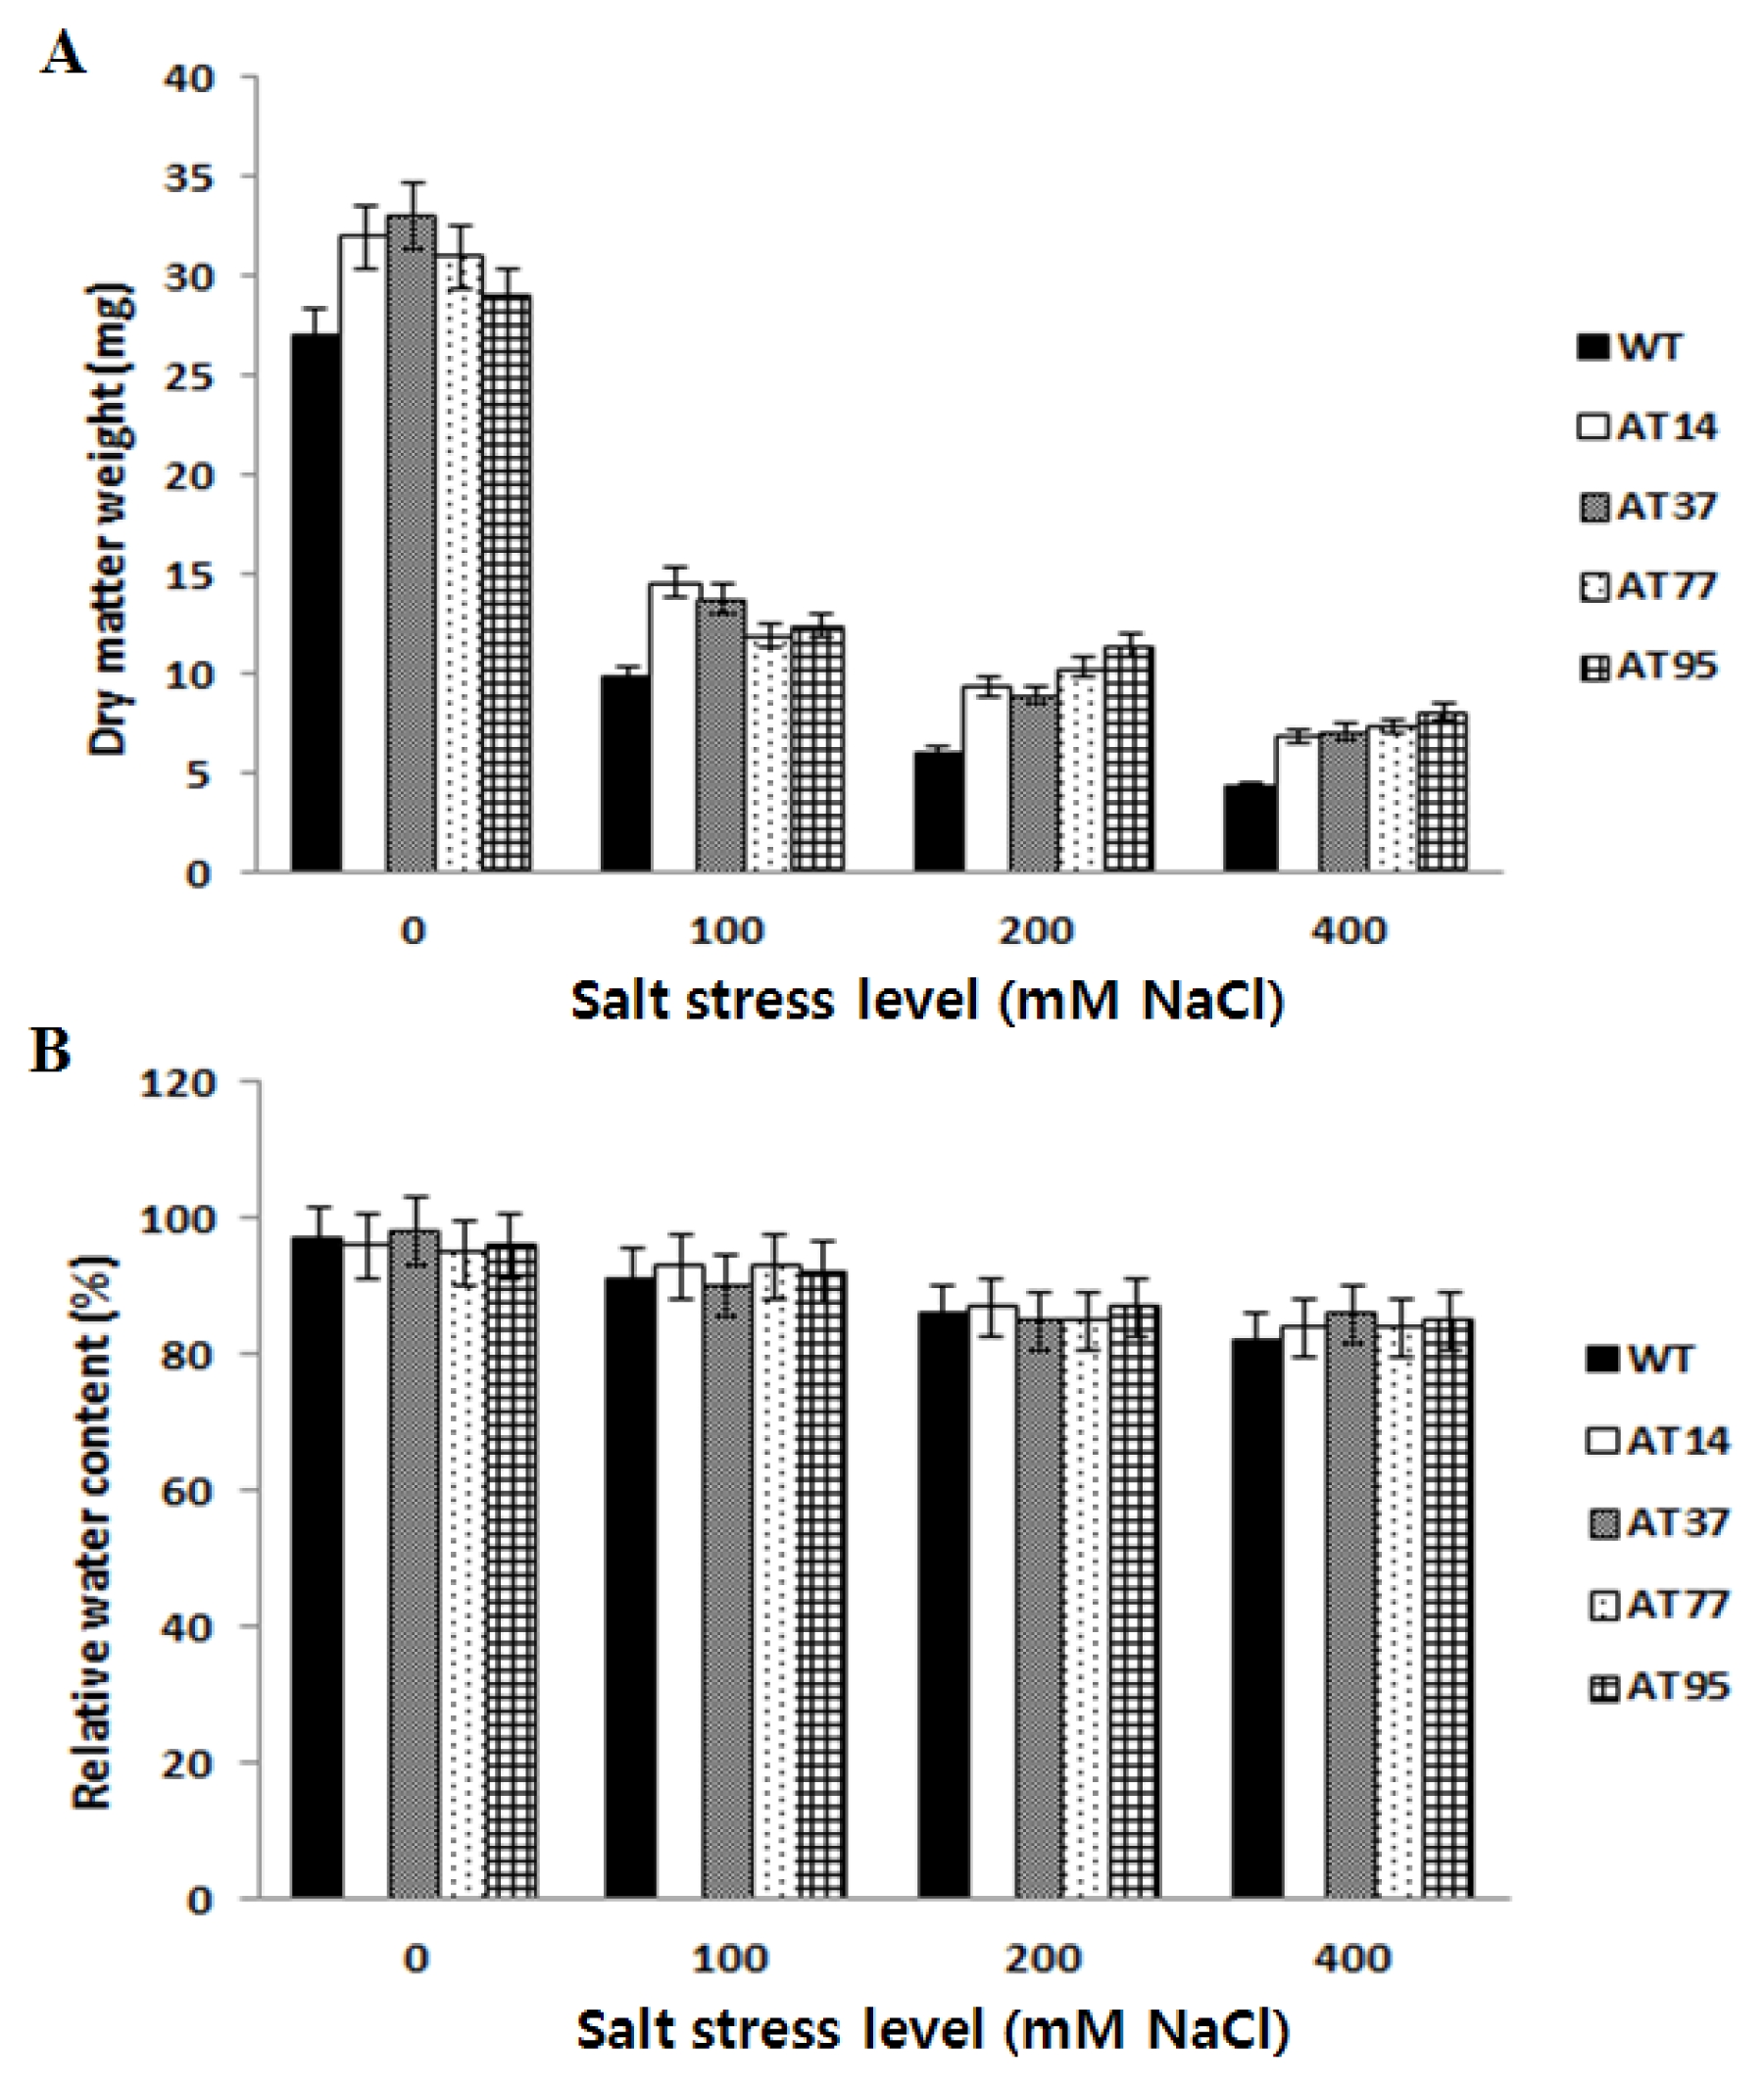
Fig. 7The leaf chlorophyll contents of T1 transgenic tomato lines and WT on MS medium with different levels of salt stress. Data represent the means of three replicates per line per treatment ± standard error.

Fig. 8The germination rates of T1 transgenic tomato lines and WT on MS medium with different levels of salt stress. Data represent the means of three replicates per line per treatment ± standard error.
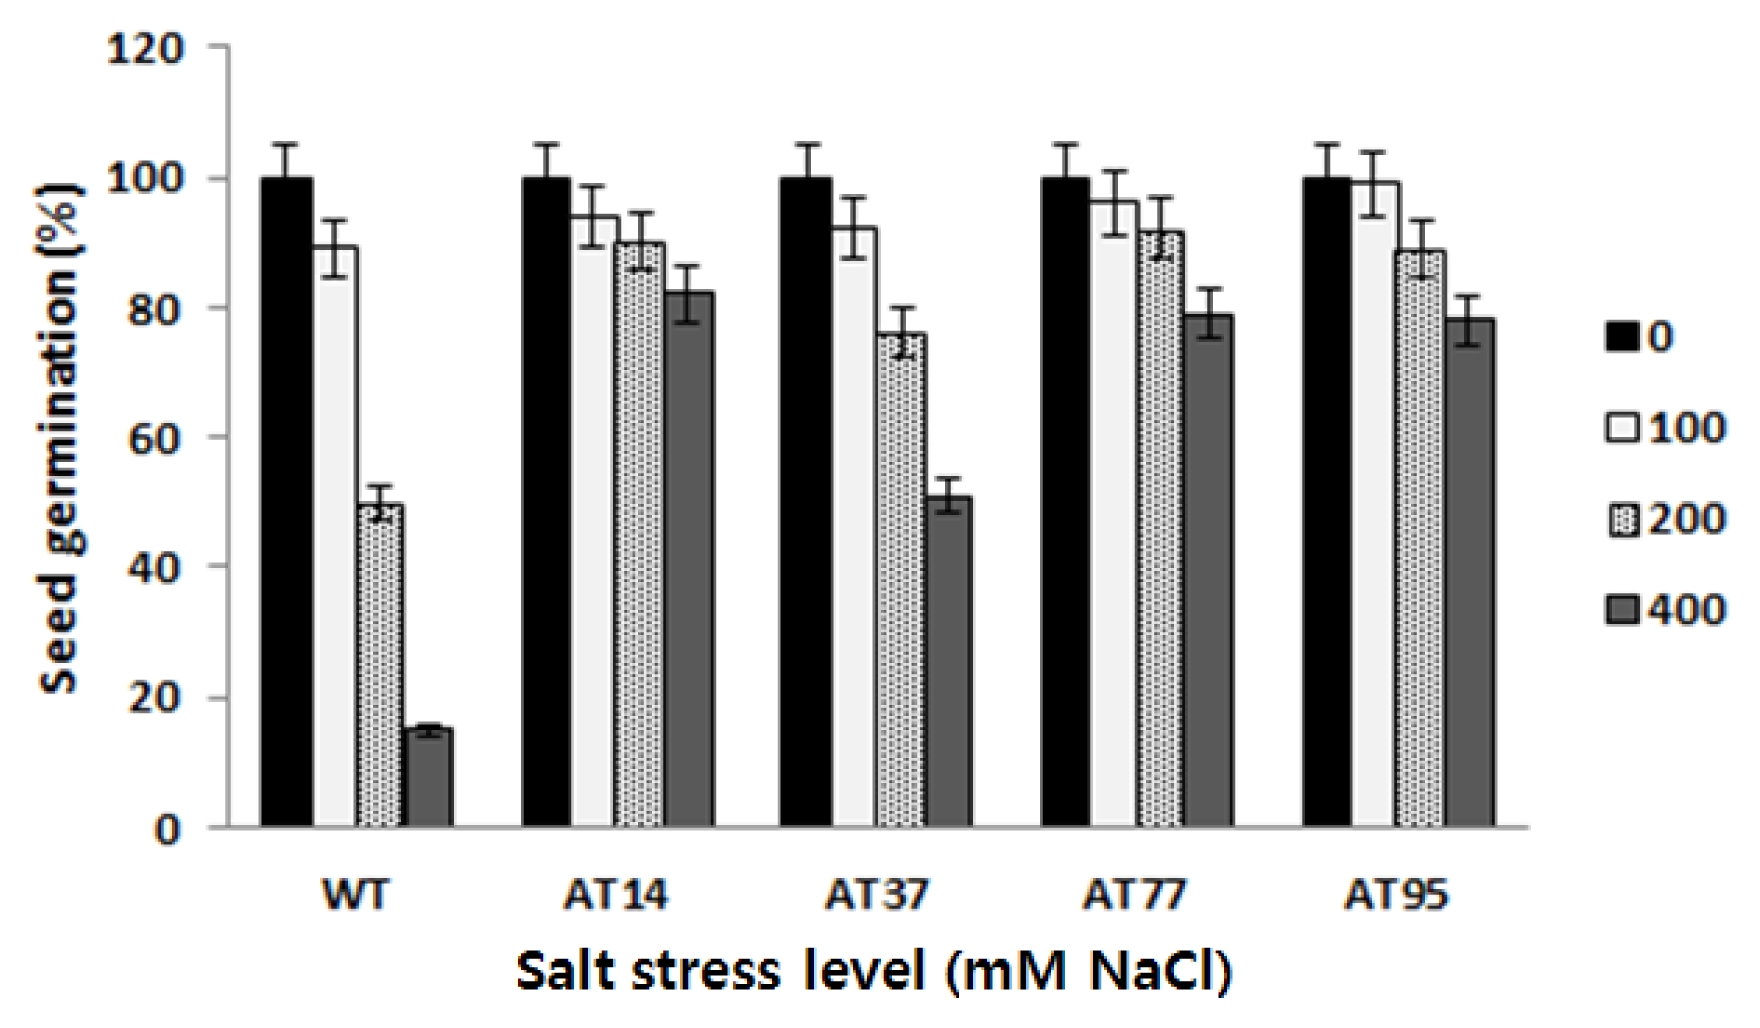
Table 1Segregation of BrOAT1 gene in T1 progenies of transgenic tomato lines.
Table 1
|
Line |
No. of plant |
Expected segregation ratio |
PCR for the BrOAT1 gene |
|
|
BrOAT1+
|
BrOAT−
|
X2
|
|
AT14 |
60 |
3 : 1 |
45 |
15 |
0 |
|
AT37 |
60 |
3 : 1 |
43 |
17 |
0.35 |
|
AT77 |
60 |
3 : 1 |
51 |
9 |
4.07 |
|
AT95 |
60 |
3 : 1 |
47 |
13 |
0.35 |
References
- Ali-Benali MA, Alary R, Joudrier P, Gautier M. 2005. Comparative expression of five LEA genes during wheat seed development and in response to abiotic stresses by real-time quantitative RT-PCR. Biochimica et Biophysica Acta. 1730: 56-65.
- Bhattacharya RC, Maheswari M, Dineshkumar V, Kirti PB, Bhat SR, Chopra VL. 2004. Transformation of Brassica oleracea var. capitata with bacterial betA gene enhaces to tolerance to salt stress. Sci Hortic. 100: 215-227.
- Blum A. 1999. Towards standard assays of drought resistance in crop plants. In: Proceedings of the workshop on molecular approaches for the genetic improvement of cereals for stable production in water-limited enviromments; Mexico: CIMMYT. pp 3-35.
- Chandra Babu R, Zhang JX, Blum A, David Ho TH, Wu R, Nguyen HT. 2004. HVA1, a LEA gene from barley confers dehydration tolerance in transgenic rice (Oryza sativa L.) via cell membrane protection. Plant Sci. 166: 855-862.
- Delauney AJ, Hu CAA, Kishor PBK, Verma DPS. 1993. Cloning of ornithine δ-aminotransferase cDNA from Vigna aconitifolia by trans-complementation in Escherichia coli and regulation of proline biosynthesis. Journal of Biological Chemistry. 268: 18673-18678.
- Doyle JJ, Doyle JL. 1990. Isolation of plant DNA from fresh tissue. Focus. 12: 13-15.
- Evenson RE, Gollin D. 2003. Assessing the impact of the green revolution, 1960–2000. Science. 300: 758-762.
- Heimberg H, Boyen A, Crabeel M, Glandsdorff N. 1990. Escherichia coli and saccharomyces cerevisiae acetyl-ornithine aminotransferases: evolutionary relationship with ornithine aminotransferases. Gene. 90: 69-78.
- Hervieu F, Le Dily L, Huault C, Billard JP. 1995. Contribution of ornithine aminotransferase to proline accumulation in NaCl treated radish cotyledons. Plant Cell Environ. 18: 205-210.
- Khush GS. 2001. Green revolution: the way forward. Nat Rev. 2: 815-822.
- Livak KJ, Schmittgen TD. 2001. Analysis of relative gene expression data using real-time quantitative PCR and the 2)DDCt method. Methods. 25: 402-408.
- Mazzucotelli E, Mastrangelo AM, Crosatti C, Guerra D, Stanca AM, Cattivelli L. 2008. Abiotic stress response in plants: when post-transcriptional and post-translational regulations control transcription. Plant Science. 174: 420-431.
- Reddy MP, Sanish S, Iyenger ERR. 1992. Photosynthetic studies and compartmentation of ions in different tissues of Isalicornia brachiata Toxb under saline conditions. Photosynthetica. 26: 173-179.
- Roosens NHCJ, Thu TT, Iskandar HM, Jacobs M. 1998. Isolation of ornithine-d-aminotransferase cDNA and effect of salt stress on its expression in Arabidopsis thaliana. Plant Physiology. 117: 263-271.
- Schultz CJ, Coruzzi G. 1995. The aspartate aminotransferase gene family of Arabidopsis thaliana encodes isoenzymes localized to three distinct subcellular compartments. Plant J. 7: 61-75.
- Van Roekel JSC, Damm B, Melchers LS, Hoekema A. 1993. Factors influencing transformation frequency of tomato (Lycopersicon esculentum). Plant Cell Rep. 12: 644-647.
- Yap YK, Kodama Y, Waller F, Chung KM, Ueda H, Nakamura K, Oldsen M, Yoda H, Yamakuchi Y, Sano H. 2005. Activation of a novel transcription factor through phosphorylation by WIPK, a wound-induced mitgen-activated protein kinase in tobacco plants. Plant Physiol. 139: 127-137.