Abstract
Coix lacryma-jobi L. is a cereal crop belonging to the Poaceae family, valued for its nutritional, medicinal, and ornamental uses. Among its varieties, two prominent landraces, C. lacryma-jobi var. kiboa and var. tapol, are cultivated for their distinct grain morphologies and favorable agronomic traits. However, despite its economic importance, detailed cytogenetic and molecular phylogenetic studies remain limited. This study presents a cytogenetic and molecular phylogenetic analysis of C. lacryma-jobi L. var. kiboa and tapol. Partial cytogenomic characterization on the 45S and 5S rDNA loci as well as Arabidopsis- type telomeric repeats using pre-labeled oligomer probes for fluorescence in situ hybridization (PLOP-FISH) technique confirmed a diploid chromosome number of 2n = 20 in both varieties. The 45S and 5S rDNA loci were localized on the nucleolar organizer region (NOR) of the short arm of chromosome 1 and the long arm of chromosome 4, respectively, indicating conserved chromosomal arrangements. Additionally, Arabidopsis-type telomeric repeats were detected at the terminal regions of all chromosomes. Chromosome sizes ranged from 2.98 ± 0.07 to 3.74 ± 0.11 μm in var. kiboa and from 3.42 ± 0.08 to 4.12 ± 0.05 μm in var. tapol. Phylogenetic analyses based on the internal transcribed spacer (ITS1 and ITS4) genes revealed a close genetic relationship between the two varieties, supporting their shared evolutionary lineage. These findings enhanced our understanding of adlay genetic diversity and provide foundational insights for plant breeding improvement, conservation strategies, and future genomic research.
-
Key words: Adlay, Chromosome mapping, Evolutionary relationship, Job’s Tears, PLOP-FISH
Introduction
Coix lacryma-jobi L., commonly known as adlay or Job’s tears, is a cereal crop of the Poaceae (Gramineae) family valued for its nutritional, medicinal, and ornamental uses (
Devaraj et al. 2020). Archaeobotanical evidence shows that adlay has a long cultivation history, dating back to the Late Paleolithic (~28,000 years ago) in northern China. After a decline during the Younger Dryas, it reemerged in the early Holocene within the Huai and Yangtze River basins and later spread alongside millet domestication in the Neolithic (~8,000 years ago;
Liu et al. 2020). Today, adlay is widely cultivated across Asia, including the China, India, Malaysia, Philippines, Sri Lanka and Taiwan (
Andriana et al. 2023;
Hedayetullah et al. 2022).
In the Philippines, two most important landraces,
C. lacryma-jobi var. kiboa and var. tapol, are cultivated for their unique grain morphologies, grain color and favored agronomic traits. Tapol is characterized by its dark to black-colored grains, whereas kiboa produces light-colored to white grains, traits that contribute to their local preference and utilization. Tapol has been reported as the highest-yielding variety, with an approximate yield of 3.07 tons per hectare, followed by kiboa at 2.31 tons per hectare, and other varieties such as gulian, ginampay, and an unknown variety, yielding 1.85, 1.65, and 0.98 tons per hectare, respectively. In addition to yield, tapol and kiboa exhibit superior morphological traits, including higher grain number per stem (322 in tapol and 205 in kiboa) and greater plant height (152.5 cm and 159.6 cm, respectively). Both varieties also possess the longest and widest leaves among Philippine landraces, with kiboa reaching up to 76.5 × 4.5 cm and tapol approximately 73.2 × 4.4 cm, traits associated with increased photosynthetic capacity and biomass accumulation (
Gloria et al. 2015). These contrasting yet superior agronomic characteristics make kiboa and tapol particularly suitable candidates for comparative cytogenetic and molecular investigations.
Despite their agricultural importance, detailed information on the cytogenetics and molecular relationships of Philippine adlay landraces remains limited. This lack of cytogenomic data constrains a deeper understanding of their chromosome constitution, repetitive DNA organization, and evolutionary divergence, thereby limiting their effective utilization in breeding and conservation programs.
The emerging field of cytogenomics integrates cytogenetic methods with genomic data and offers powerful tools for analyzing chromosome structure, genome organization, and repetitive DNA distribution. These are essential for species identification, understanding evolutionary relationships, and crop improvement (
Peniton Jr et al. 2022). When combined with molecular phylogenetics, which elucidates evolutionary relationships through DNA sequence analysis (
Li et al. 2021), these approaches provide a comprehensive framework to explore the genetic diversity, evolutionary history, and domestication of adlay.
This study aimed to investigate and compare the chromosome constitution and rDNA localization of C. lacryma-jobi var. kiboa and var. tapol using PLOP-FISH and molecular phylogenetic analyses. By mapping the chromosomal positions of the 5S and 45S rDNA loci and Arabidopsis-type telomeric repeats, this research advanced the cytogenetic profiling of Philippine adlay landraces. The resulting cytogenomic and phylogenetic data supported Coix breeding programs by facilitating germplasm evaluation, informed parental selection, and the development of molecular and cytogenetic markers linked to desirable agronomic traits, such as yield stability and genetic integrity. Ultimately, this work contributed to the conservation, improvement, and sustainable utilization of Coix genetic resources in Southeast Asia.
Materials and Methods
Plant Material and Sample Collection
Seeds of
C. lacryma-jobi var. kiboa and tapol were obtained from Cabanglasan and Lantapan, respectively, both located in the province of Bukidnon, Philippines. Each variety was separately soaked in distilled water for 8 hours to initiate germination. Then germinated on wet filter paper inside the petri-dishes and incubated in the dark at room temperature. Actively growing roots approximately 1-2 cm in length were harvested from 3-5-day-old seedlings at 11:00 AM, the optimal time for mitotic activity (
Waminal et al. 2018).
The collected roots were pretreated with 2 mM 8-hydroxyquinoline for 5 hours at 25℃ to arrest cells at metaphase. Following pretreatment, roots were fixed in Carnoy’s solution (3:1 ethanol: glacial acetic acid) overnight at 4℃ and stored in 70% ethanol at -20℃ until further use.
Somatic Chromosome Preparation
Fixed root tips were rinsed with distilled water and enzymatically digested with 50 µl of 1% (w/v) pectolyase Y-23 and 2% (w/v) Cellulase R-10 diluted in 100 mM citrate buffer for 90 min at 37℃. The enzymatic solution was then removed by pipetting, and the meristematic cells were suspended in Carnoy’s solution. The cell suspension was vortexed to homogenize, placed on ice, and centrifuged at 13,000 rpm. The resulting supernatant was discarded and the cell pellet was resuspended in a 9:1 acetic acid-ethanol solution. Then, cell suspensions were mounted onto the pre-cleaned glass slide that was pre-warmed in the water bath and allowed to air dry at room temperature to ensure optimal chromosome spreading (
Pellerin et al. 2019;
Peniton Jr et al. 2022;
Waminal et al. 2018). For each variety, three (3) well-spread metaphase chromosome preparations were selected for detailed analysis. Chromosome measurements and karyotypic parameters were calculated as the average values derived from these three metaphase spreads to ensure accuracy and reproducibility.
Fluorescence
in situ hybridization (FISH) using PLOPs based on tandem repeats was performed as previously described (
Campomayor et al. 2021;
Nguyen et al. 2021;
Waminal et al. 2018). FISH analysis was performed to visualize the chromosomal localization of the ribosomal DNA and telomeric repeat probes. The pre-labeled at both prime ends of the 5S rDNA, 45S rDNA and
Arabidopsis-type telomeric oligonucleotide probes were used following the method of
Waminal et al. (2018). A hybridization mixture consisted of 50% formamide, 10% dextran sulfate, 2× SSC, 50 ng/µL of each DNA probe, and nuclease-free water was pipetted onto the fixed slides containing good metaphase chromosome spread and denatured at 80℃ for 5 minutes. The slides were then incubated in a humid chamber overnight at room temperature. Post-hybridization washing was conducted sequentially with 2× SSC for 10 minutes, 0.1× SSC at 42℃ for 25 minutes, and 2× SSC again at room temperature for 5 minutes. Dehydration was performed through a graded ethanol series (70%, 90%, and 100%) for 3 minutes each at room temperature.
The slides were air-dried and the chromosomes were counterstained with Vectashield mounting medium (Vector Labs, H-1000, USA) containing 1 µg/mL DAPI. Fluorescent signals were visualized using the 100× oil immersion objective on an inverted fluorescence microscope (Olympus ix73, Japan) equipped with a digital camera (Olympus SC180, Japan). Images were captured and initially analyzed in Cellsens V.2.3 Imaging Software (Olympus, Japan), then further enhanced using Adobe Photoshop CS6, and finally measured using ImageJ software.
Chromosome numbering and pairing were standardized across varieties based on relative chromosome length, centromeric position, and PLOP-FISH signal distribution. Chromosome types were determined based on centromeric position, relative chromosome length, and PLOP-FISH signal distribution, following the applied methodologies of
Nguyen et al. (2021) and
Waminal et al. (2018). Homologous chromosomes were identified by integrating chromosome morphology, length, centromere index, and signal localization patterns (
Peniton Jr et al. 2024). After analysis, the slides were stored at 4℃ in a slide pocket wallet for future reference.
About four to six (4-6) leaves from the young seedlings of each of the varieties, tapol and kiboa, of
C. lacryma-jobi were harvested for total genomic DNA extraction. Approximately five (5) grams of dried leaf tissues were collected per sample and pulverized using a cryomill (mixer mill MM 400 Retsch). Total genomic DNA was extracted using the NucleoSpin
® Plant II DNA Extraction Kit, following the manufacturer’s protocol (Macherey-Nagel 2023). DNA samples were submitted to Macrogen Inc. (Seoul, South Korea) for PCR amplification and sequencing of the Internal Transcribed Spacer (ITS) 1 and 4, widely used markers for molecular phylogenetic studies in plants (
Baldwin et al. 1995).
Raw sequence chromatograms generated from both forward and reverse primers were downloaded from the Macrogen website, underwent initial visualization, and manually edited using FinchTV software. This is a crucial quality control to remove ambiguous base calls and low-quality regions. High-quality, trimmed sequences were assembled into consensus sequences using BioEdit software. Multiple sequence alignment using the consensus ITS sequence of
C. lacryma-jobi var. kiboa and var. tapol was performed along with reference sequences obtained from NCBI GenBank. This alignment was done using ClustalW algorithm as embedded in MEGA 11 software (
Kumar et al. 2018).
The evolutionary history of
C. lacryma-jobi varieties was inferred using the Maximum Likelihood (ML) method, specifically based on the Tamura-Nei model (
Tamura et al. 1993) as based on the model test result. The phylogenetic tree with the highest log likelihood of -2460.18 is presented, with the percentage of trees in which the associated taxa clustered together (bootstrap support values) indicated next to the branches. Initial tree for the heuristic search was automatically generated by applying both Neighbor-Joining and BioNJ algorithms to a matrix of pairwise distances, which were estimated using the Tamura-Nei model, followed by selection of the topology with the superior log likelihood value. The analysis included 24 nucleotide sequences, resulting in a final dataset of 396 aligned positions. All evolutionary analyses were performed using MEGA11 (
Tamura et al. 2021).
Results
Chromosome Constitution
Both
C. lacryma-jobi var. kiboa and var. tapol exhibited a diploid chromosome number of 2
n = 20. Chromosome constitution and PLOP-FISH karyotype analyses revealed clear differences between the two varieties, with var. kiboa (
Table 1) showing shorter chromosomes than var. tapol (
Table 2). The total chromosome length in var. tapol ranged from 2.51 ± 0.08 µm to 4.12 ± 0.05 µm, with a mean length of 3.42 ± 0.08 µm, whereas var. kiboa showed shorter chromosomes, ranging from 2.38 ± 0.06 µm to 3.74 ± 0.09 µm, with a mean length of 2.98 ± 0.07 µm. Differences were also observed at the level of individual chromosome arms. In var. tapol, short arms ranged from 1.21 ± 0.03 µm to 2.00 ± 0.03 µm (mean: 1.66 ± 0.01 µm), while long arms ranged from 1.29 ± 0.05 µm to 2.12 ± 0.01 µm (mean: 1.76 ± 0.01 µm). In contrast, var. kiboa exhibited shorter arm lengths, with short arms ranging from 1.13 ± 0.04 µm to 1.67 ± 0.06 µm (mean: 1.32 ± 0.04 µm) and long arms from 1.25 ± 0.01 µm to 2.07 ± 0.03 µm (mean: 1.62 ± 0.03 µm). Both varieties predominantly possessed metacentric chromosomes; however, differences in arm ratios were evident, with var. tapol showing a lower mean arm ratio (1.04 ± 0.08) compared with var. kiboa (1.19 ± 0.10;
Tables 1 and
2). Overall, these results indicate that despite sharing the same chromosome number, kiboa and tapol differ in chromosome size and probably arm composition, reflecting distinct karyotypic organization between the two varieties.
Multicolor PLOP-FISH was conducted to examine the chromosomal distribution of repetitive DNA elements in
Coix lacryma-jobi var. kiboa and var. tapol, using probes for 5S rDNA, 45S rDNA, and
Arabidopsis-type telomeric repeats (
Fig. 1). The respective FISH metaphase chromosome spreads and karyograms of var. kiboa (
Figs. 1A,
1B) and var. tapol (
Figs. 1C,
1D) revealed clear and consistent hybridization patterns across both varieties, each exhibiting a chromosome complement of 2
n = 20. In both var. kiboa and var. tapol, 45S rDNA signals were distinctly localized to the satellite region of chromosome 1, indicating the nucleolar organizing region (NOR), while 5S rDNA signals were positioned proximally on the long arm of chromosome 4. Telomeric signals were detected at the termini of all chromosomes, confirming intact chromosomal ends. These repetitive DNA sequences served as cytogenetic landmarks for chromosome identification and pairing, highlighting the conserved localization of 5S rDNA, 45S rDNA, and telomeric repeats in both varieties of
C. lacryma-jobi.
Coix lacryma-jobi var. tapol and var. kiboa were placed within a well-supported monophyletic clade comprising other
C. lacryma-jobi varieties. Within this clade, var. kiboa formed a sister relationship with var. ginampay, while var. tapol was more closely related to var. gulian, together forming a strongly supported subclade with bootstrap value of 100%. This internal structuring within the
Coix clade indicates clear genetic divergence among the varieties, despite their close evolutionary relationship. Notably, all
C. lacryma-jobi varieties in the clade are more closely related to each other than to other members of the Andropogoneae tribe, such as
Sorghum bicolor and
Saccharum officinarum. The phylogenetic positions of var. kiboa and tapol reinforce their taxonomic classification within Poaceae family, subfamily Panicoideae, and tribe Andropogoneae (
Fig. 2).
Discussion
Cytogenomic Analysis
The cytogenetic characterization of
C. lacryma-jobi varieties kiboa and tapol revealed highly conserved chromosome constitution between the two varieties, both possessing a diploid chromosome number of 2
n = 20. The karyotypic organization displayed a symmetrical arrangement of chromosomes with decreasing length, and no structural abnormalities or aneuploidy were observed in either variety, indicating uniformity at the metaphase chromosome level. Comparative data from other
C. lacryma-jobi varieties also report a consistent chromosome number of 2
n = 20, with individual chromosome lengths ranging from 2.54 ± 0.36 μm to 4.18 ± 0.62 μm for var. mayuen, and from 2.44 ± 0.27 μm to 3.63 ± 0.42 μm for var. puellarum (
Madhav et al. 2024). Furthermore, all chromosomes in these varieties were reported to be of the same chromosome type, all metacentric, indicating a conserved karyotypic architecture across different
C. lacryma-jobi landraces. The chromosome sizes and morphologies observed in this study fall within these reported ranges, further supporting the conserved nature of the genome among
C. lacryma-jobi varieties.
The observed difference in total chromosome length between
C. lacryma-jobi var. tapol and var. kiboa may reflect underlying genomic variation in DNA content or sequence composition. Chromosome length can be influenced by factors such as the amount of non-coding DNA, repetitive sequences, and heterochromatin content (
Schubert et al. 2011). The longer average chromosome length of var. tapol (3.42 ± 0.08 µm) compared to var. kiboa (2.98 ± 0.07 µm) may indicate a higher abundance of elements such as transposable elements, tandem repeats, or structural expansions. Such genomic expansions may influence chromatin organization and spatial gene regulation, potentially affecting gene expression patterns and regulatory dynamics rather than directly increasing gene number. Further experimental analyses are needed to clarify the specific contributions of these genomic features to the observed differences in chromosome length (
Grover et al. 2010).
Differences in chromosome size may also have implications for environmental adaptability. In plants, genome size variation has been linked to traits such as growth rate, stress tolerance, and phenotypic plasticity, which are often mediated through effects on cell size, cell cycle duration, and transcriptional regulation (
Bennett et al. 2005). The relatively longer chromosomes observed in var. tapol may therefore reflect genomic features that contribute to its reported superior agronomic performance and adaptability, although direct functional associations require further validation. This difference may also indicate genomic divergence between the two varieties, possibly due to adaptation to different environmental conditions or selective pressures during domestication or cultivation.
In cytogenetics, a longer chromosome length is sometimes associated with higher DNA content (C-value), which can impact nuclear organization, replication timing, and gene expression regulation (
Bennett et al. 2005;
Greilhuber et al. 2005). Although direct genome-size estimation was beyond the scope of this study, these findings provide a strong basis for future validation using complementary approaches such as flow cytometry or whole-genome sequencing. Genome size variation in plants is often attributed to accumulation of repetitive elements and differences in DNA elimination mechanisms, highlighting the importance of cytogenomic studies in understanding species diversity and evolutionary dynamics (
Pellicer et al. 2018).
Cytogenomic insights are fundamental to supporting genomic research and guiding breeding strategies for crop enhancement. FISH results using universal repeat probes for 5S and 45S rDNAs provide valuable information for identifying and pairing homologous chromosomes during karyotyping, as well as for analyzing telomeric repeats to investigate genomic differentiation among plant species (
Peniton Jr et al. 2024). Both varieties exhibited identical FISH signal patterns. The 45S rDNA loci were consistently mapped to the satellite region of chromosome 1 in var. kiboa and var. tapol, highlighting the nucleolar organizing region (NOR) and confirming its conserve d position across varieties. Meanwhile, 5S rDNA signals were localized to the long arm of chromosome 4 in both genotypes. The localization of rDNAs and telomeric repeats further substantiated the chromosomal integrity and provided specific cytogenetic markers for comparative analysis (
Roa et al. 2012). The conservation of these loci suggests strong evolutionary constraints on ribosomal gene positioning within
Coix, reinforcing the close genetic relationship between the two varieties.
Chromosome numbering in the karyotype analysis was assigned following the conventions of earlier cytogenetic studies of
Coix (
Cai et al. 2014), primarily based on the relative positions of rDNA loci rather than chromosome size alone. Although chromosome 4 in var. tapol appeared smaller than chromosomes 5, 6, and 7, the consistent placement of the 5S rDNA locus on this chromosome aligns with previous findings (
Cai et al. 2014), ensuring reliable identification of homologous chromosomes even when size differences are subtle. This approach supports chromosomal identity assignment and reflects the conserved locations of ribosomal gene regions among
Coix varieties. In agreement with
Cai et al. (2014) the 45S rDNA probe appeared as a single large signal at the end of the short arm of chromosome pair 1, while the 5S rDNA signal localized to the peri-centromeric region of chromosome pair 4. Telomeric repeats were observed at the termini of all chromosomes in both varieties, indicating the absence of interstitial telomeric sequences and consistent with cytogenetically stable chromosome ends (
Fuchs et al. 1995;
He et al. 2013).
Despite the genetic diversity potentially underlying the two Coix varieties, the uniformity in the chromosomal distribution of these repetitive elements suggests a high level of karyotypic conservation. This conserved cytogenetic framework provides a stable genomic background upon which phenotypic and agronomic variation may arise through smaller-scale sequence-level changes rather than large chromosomal rearrangements. This comparative FISH analysis confirms that the fundamental chromosome architecture, particularly the positioning of major ribosomal genes and telomeric repeats, is maintained in both kiboa and tapol. These findings not only reinforce the evolutionary relatedness of the two varieties but also provide valuable cytogenetic markers for further genomic and breeding studies in C. lacryma-jobi.
Future research directions should include direct genome-size estimation using flow cytometry to validate inferences of genome expansion and to quantify DNA content differences between varieties. Additionally, the use of other cytogenetic markers, such as centromeric repeats, satellite DNAs, and chromosome-specific BAC probes, could improve chromosome discrimination and reveal finer-scale structural variation. Integration of next-generation sequencing approaches, including whole-genome resequencing, repeatome analysis, and transcriptome profiling, would further elucidate the genetic and regulatory differences underlying the observed cytogenomic variation and support the development of improved Coix breeding strategies.
Molecular Phylogenetic Study
The phylogenetic analysis based on the ITS region provides valuable insights into the evolutionary relationships among C. lacryma-jobi varieties. As a highly variable and widely used molecular marker in plant systematics, the ITS region effectively resolves relationships at both interspecific and intraspecific levels (Xuan et al. 2020). In this study, C. lacryma-jobi var. kiboa and var. tapol were positioned within a well-supported monophyletic clade alongside other Coix accessions, underscoring their close genetic relatedness.
Within this clade, var. tapol clustered closely with var. gulian, while var. kiboa formed a sister relationship with var. ginampay, suggesting a degree of intraspecific divergence. The subclade containing these varieties was supported by a high bootstrap value of 100%, indicating a strong phylogenetic signal in the ITS sequences and reinforcing taxonomic coherence of C. lacryma-jobi within the Andropogoneae tribe. This suggests that despite morphological variation, these varieties share a common genetic lineage, supporting their classification as varieties of the same species and providing molecular evidence for their evolutionary relatedness.
Interestingly, the
Coix varieties were positioned near
Sorghum bicolor and
Saccharum officinarum, reflecting a shared evolutionary ancestry within the Panicoideae subfamily and their association with C4 photosynthetic lineages (
Leseberg et al. 2009;
Li et al. 2021). The observed genetic divergence between var. tapol and var. kiboa may reflect distinct ecological, geographic, or selective pressures that have driven their differentiation over time.
These results are consistent with the findings of
Li et al. (2021), who demonstrated that
Coix,
Sorghum,
Saccharum,
Zea, and
Tripsacum form a coherent group within the Andropogoneae tribe. Notably, their analysis revealed that
Coix is genetically closer to
Sorghum than to
Zea, a relationship that is also evident in our ITS-based phylogeny. This suggests a more recent common ancestor between
Coix and
Sorghum, potentially linked by similar genomic structures, C4 photosynthetic adaptations, or ecological niches.
Further evolutionary context is provided by
Liu et al. (2020), who estimated that
Coix diverged from
Sorghum approximately 10.41 million years ago, about 1.49 million years after the split between
Sorghum and
Zea. Their genome-wide resequencing of 27
Coix accessions revealed a clear genetic separation between wild and cultivated forms, along with evidence of a severe domestication bottleneck. This event led to a significant reduction in genetic diversity, although many morphological and agronomic traits remain undomesticated and potentially useful for breeding. Thus, the ITS-based phylogeny not only supports the current taxonomic classification of
C. lacryma-jobi varieties but also provides a molecular framework for understanding their evolutionary dynamics. These findings can inform future efforts in germplasm conservation, variety identification, and the strategic selection of genetically diverse accessions for crop improvement and breeding programs.
Therefore, this study presents the first cytogenomic and phylogenetic assessment of C. lacryma-jobi var. kiboa and var. tapol, revealing differences in chromosome length and karyotype symmetry, while both varieties share a diploid chromosome number (2n = 20) and conserved positions of 5S and 45S rDNA loci. Variety tapol displayed longer chromosomes than kiboa, reflecting subtle structural variation that may be relevant for adaptation or breeding considerations. PLOP-FISH successfully mapped the 5S and 45S rDNA loci and Arabidopsis-type telomeric repeats, and ITS-based phylogenetic analysis confirmed the close but distinct genetic identity of the two landraces. These findings provide valuable cytogenomic insights that can inform breeding programs by identifying stable chromosomal markers for selection, guiding crossbreeding strategies, and supporting the improvement of agronomic traits such as yield and adaptability. Additionally, the clarified chromosomal organization and phylogenetic relationships support germplasm conservation and contribute to accurate taxonomic classification of Philippine Coix landraces.
Acknowledgments
The authors gratefully acknowledge DOST-SEI STRAND for funding this research and CMU Tuklas Lunas Development Center (CMU TLDC) for technical support and laboratory access. We also thank Professors Agripina Aradilla and Joy Jamago for providing seed samples, and Dorx Meshillu Therese Bayani for her unwavering support throughout the study.
Fig. 1Distribution of repeat markers in Coix lacryma-jobi var kiboa and tapol. Respective PLOP-FISH metaphase spreads and karyogram of C. lacryma-jobi var kiboa (A, B) and tapol (C, D) elucidate the distribution of the repeat markers in the chromosome complement of 2n = 20. The three repeat probes of 5S rDNA (green), 45S rDNA (red), and telomeric repeat (blue) were revealed as cytogenetic markers for chromosome pairing and identification. Chromosome pairing and identification were based on the distribution of the repeats, and they were arranged in decreasing length. Scale bar = 5 μm.
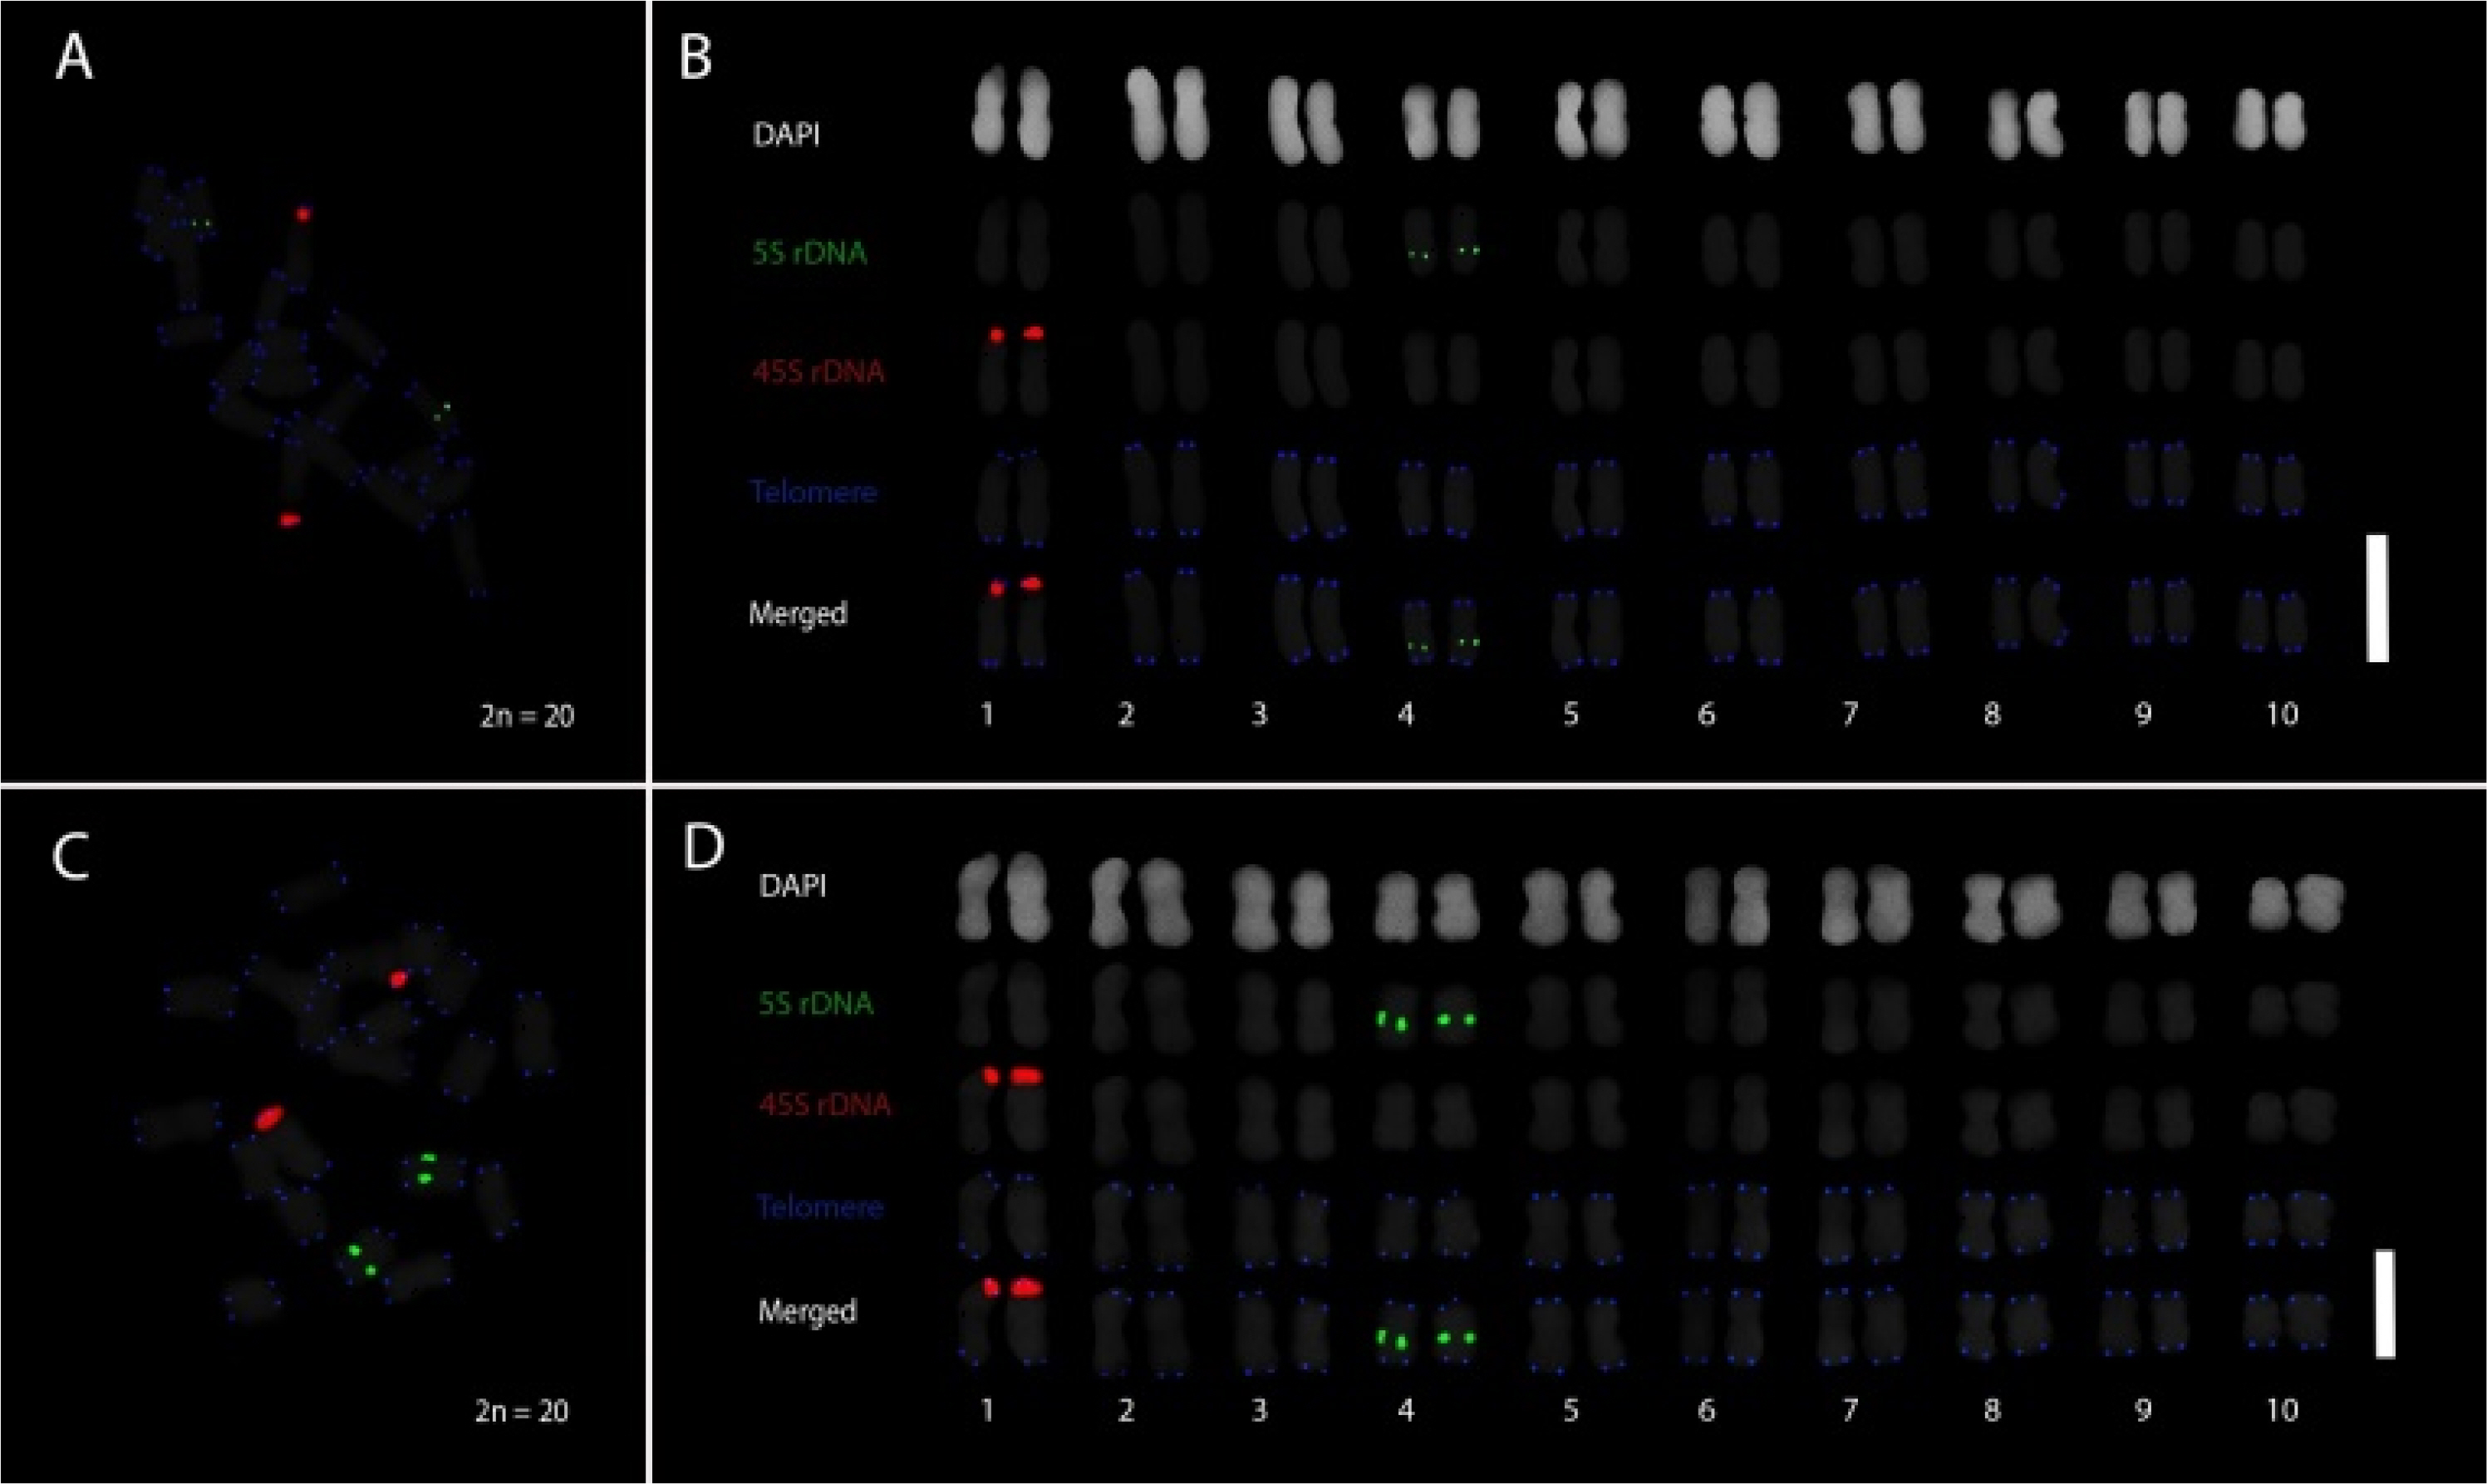
Fig. 2Phylogenetic relationships among Coix lacryma-jobi varieties inferred from molecular sequence data. The tree shows the placement of C. lacryma-jobi var. kiboa and var. tapol within the tribe Andropogoneae (subfamily Panicoideae) of the family Poaceae, in the PACMAD clade. Members of the BOP clade (Bambusoideae, Oryzoideae, and Pooideae) are included for comparison. Numbers at nodes indicate bootstrap support values (%). Asparagus officinalis was used as the outgroup.
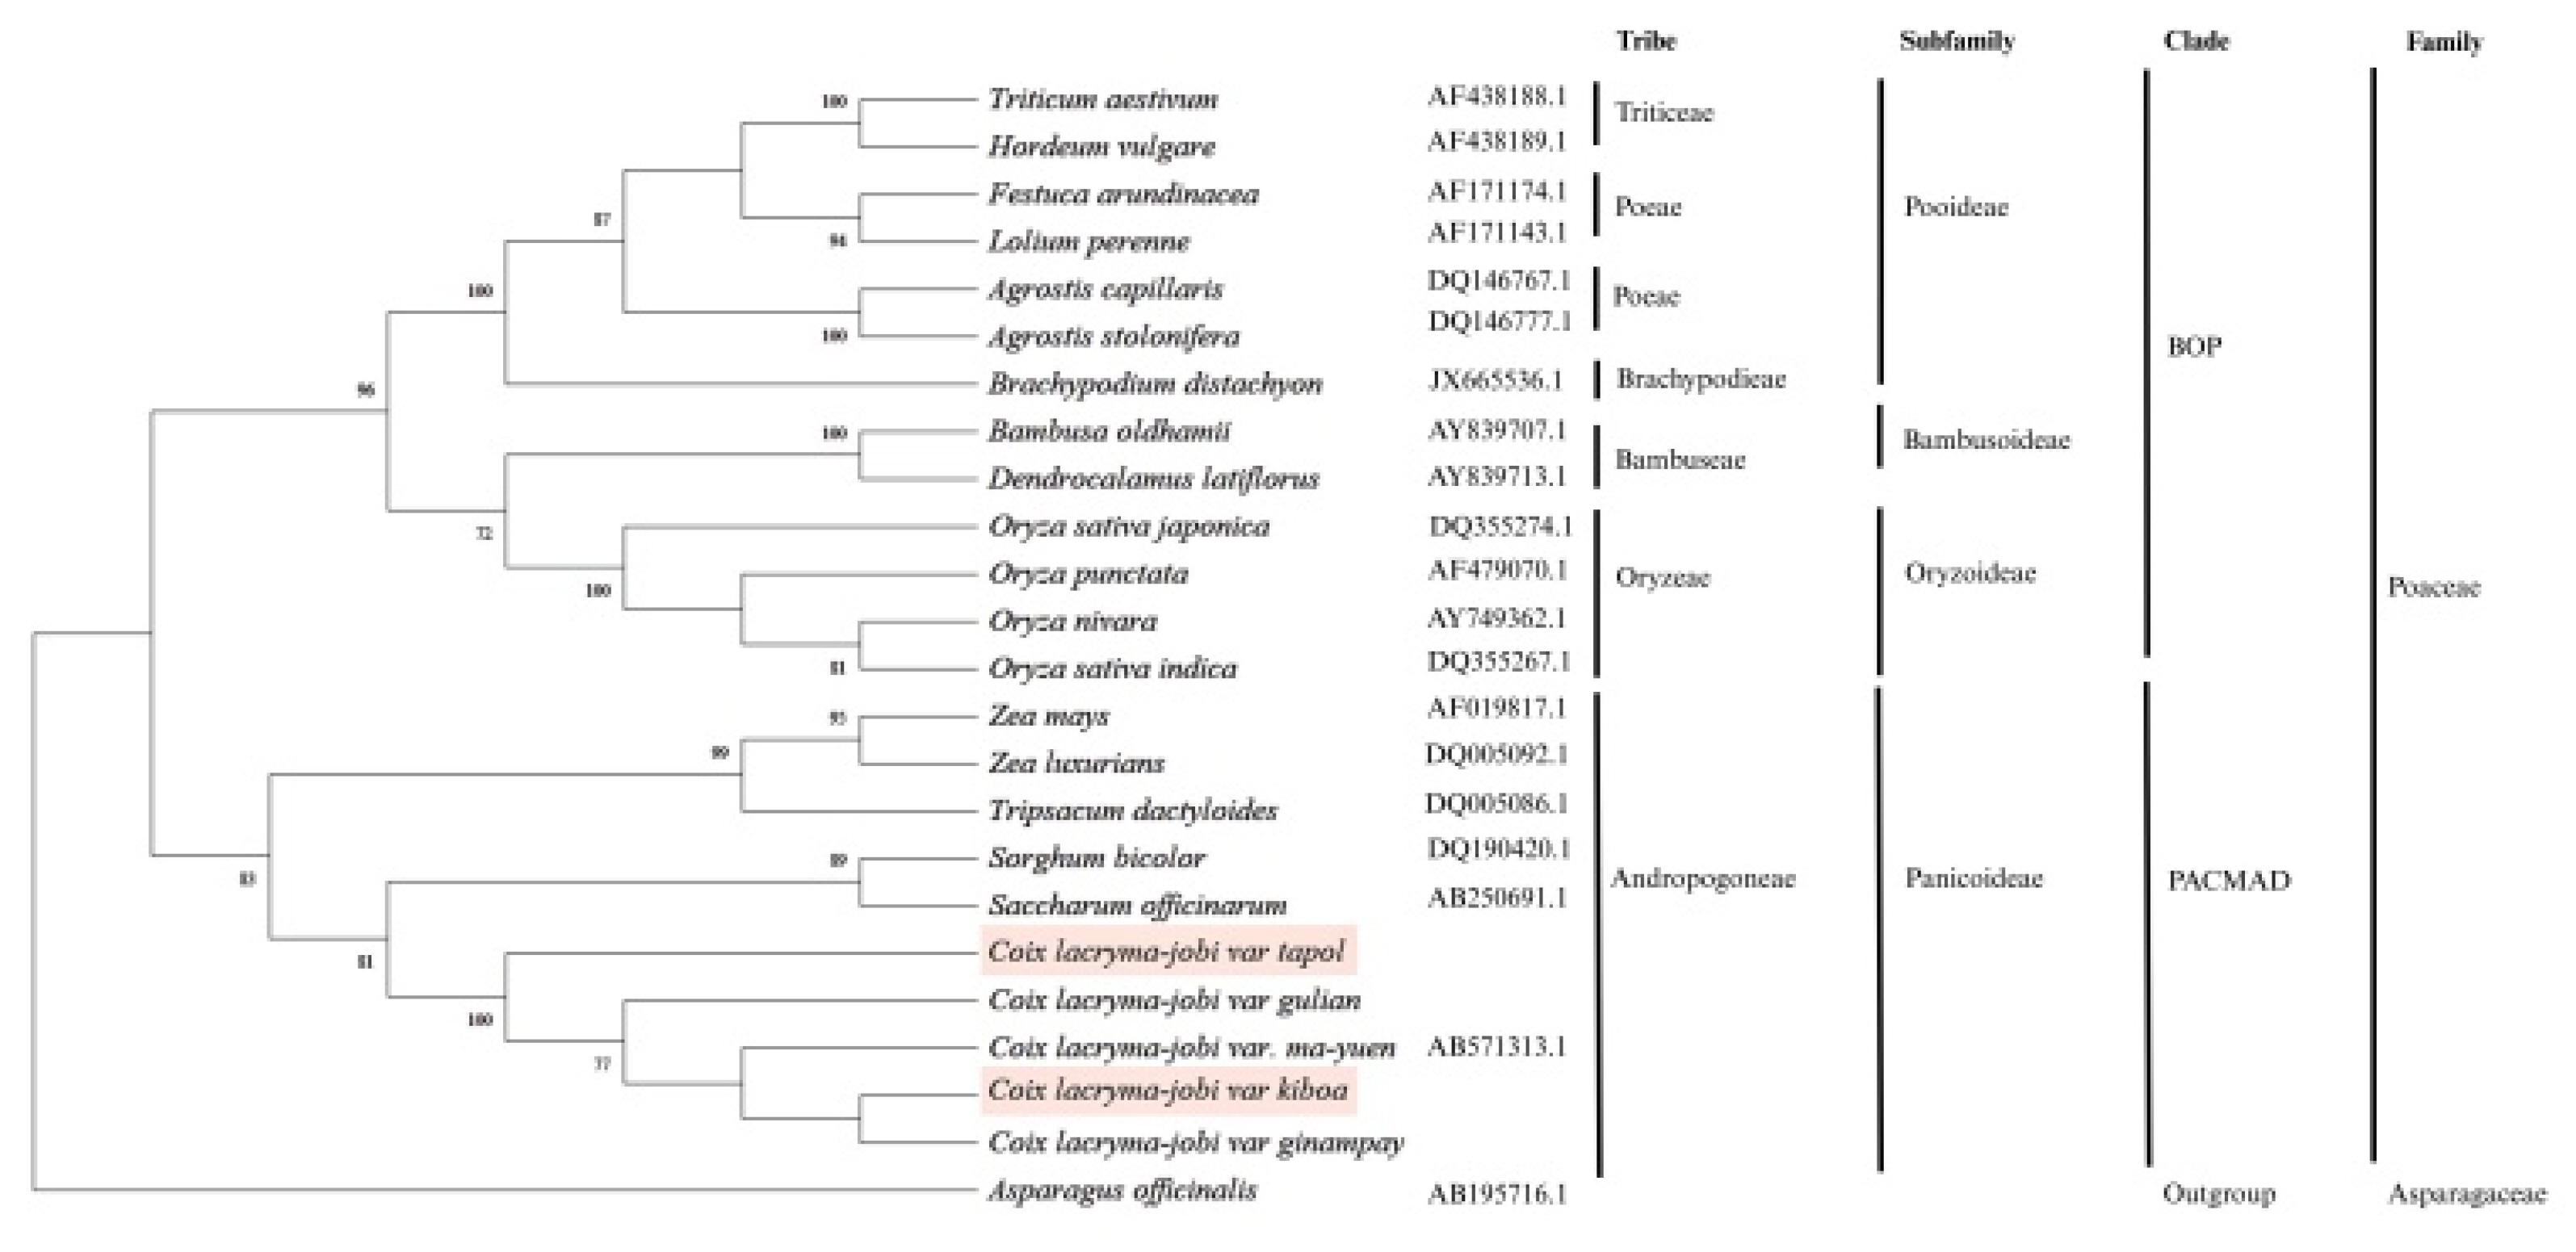
Table 1Chromosome constitution and fluorescence in situ hybridization (FISH) karyotype analysis of C. lacryma-jobi var kiboa. l: long arm, sat: satellite, m: metacentric, t: telomeric, values are expressed as mean ± SD.
Table 1
Chr
no |
Chromosome Length (µm) |
Arm ratio
l/s |
Chr
type |
5S
rDNA |
45S
rDNA |
Telomere |
|
|
Short arm (s) |
Long arm (l) |
Total |
|
1 |
1.67 ± 0.06 |
2.07 ± 0.03 |
3.74 ± 0.11 |
1.24 ± 0.09 |
m |
- |
sat |
t |
|
2 |
1.63 ± 0.03 |
2.06 ± 0.05 |
3.69 ± 0.14 |
1.26 ± 0.19 |
m |
- |
- |
t |
|
3 |
1.60 ± 0.03 |
1.79 ± 0.05 |
3.39 ± 0.04 |
1.12 ± 0.03 |
m |
- |
- |
t |
|
4 |
1.38 ± 0.03 |
1.61 ± 0.01 |
2.99 ± 0.09 |
1.17 ± 0.03 |
m |
l |
- |
t |
|
5 |
1.30 ± 0.02 |
1.66 ± 0.03 |
2.96 ± 0.07 |
1.28 ± 0.14 |
m |
- |
- |
t |
|
6 |
1.29 ± 0.03 |
1.52 ± 0.06 |
2.81 ± 0.13 |
1.18 ± 0.10 |
m |
- |
- |
t |
|
7 |
1.26 ± 0.03 |
1.48 ± 0.03 |
2.74 ± 0.02 |
1.17 ± 0.13 |
m |
- |
- |
t |
|
8 |
1.22 ± 0.03 |
1.42 ± 0.05 |
2.64 ± 0.05 |
1.16 ± 0.06 |
m |
- |
- |
t |
|
9 |
1.10 ± 0.07 |
1.35 ± 0.01 |
2.45 ± 0.01 |
1.23 ± 0.07 |
m |
- |
- |
t |
|
10 |
1.13 ± 0.04 |
1.25 ± 0.01 |
2.38 ± 0.06 |
1.11 ± 0.13 |
m |
- |
- |
t |
|
Ave |
1.32 ± 0.04 |
1.62 ± 0.03 |
2.98 ± 0.07 |
1.19 ± 0.10 |
- |
- |
- |
- |
Table 2Chromosome constitution and fluorescence in situ hybridization (FISH) karyotype analysis of C. lacryma-jobi var tapol. l: long arm, sat: satellite, m: metacentric, t: telomeric, values are expressed as mean ± SD.
Table 2
Chr
no |
Chromosome Length (µm) |
Arm ratio
l/s |
Chr
type |
5S
rDNA |
45S
rDNA |
Telomere |
|
|
Short arm (s) |
Long arm (l) |
Total |
|
1 |
2.00 ± 0.03 |
2.12 ± 0.01 |
4.12 ± 0.05 |
0.83 ± 0.12 |
m |
- |
sat |
t |
|
2 |
2.01 ± 0.01 |
2.09 ± 0.00 |
4.10 ± 0.00 |
1.04 ± 0.00 |
m |
- |
- |
t |
|
3 |
1.94 ± 0.00 |
2.04 ± 0.00 |
3.98 ± 0.21 |
1.05 ± 0.00 |
m |
- |
- |
t |
|
4 |
1.58 ± 0.02 |
1.69 ± 0.00 |
3.27 ± 0.03 |
1.07 ± 0.16 |
m |
l |
- |
t |
|
5 |
1.66 ± 0.00 |
1.69 ± 0.00 |
3.35 ± 0.10 |
1.01 ± 0.01 |
m |
- |
- |
t |
|
6 |
1.63 ± 0.03 |
1.74 ± 0.00 |
3.37 ± 0.17 |
1.07 ± 0.16 |
m |
- |
- |
t |
|
7 |
1.71 ± 0.02 |
1.79 ± 0.00 |
3.50 ± 0.02 |
1.05 ± 0.07 |
m |
- |
- |
t |
|
8 |
1.44 ± 0.00 |
1.66 ± 0.01 |
3.10 ± 0.00 |
1.15 ± 0.09 |
m |
- |
- |
t |
|
9 |
1.39 ± 0.00 |
1.47 ± 0.03 |
2.86 ± 0.09 |
1.06 ± 0.07 |
m |
- |
- |
t |
|
10 |
1.21 ± 0.03 |
1.29 ± 0.05 |
2.51 ± 0.08 |
1.07 ± 0.07 |
m |
- |
- |
t |
|
Ave |
1.66 ± 0.01 |
1.76 ± 0.01 |
3.42 ± 0.08 |
1.04 ± 0.08 |
- |
- |
- |
- |
References
- Andriana Y, Fajriani NA, Iwansyah AC, Xuan TD. 2023. Phytochemical constituents of Indonesian adlay (Coix lacrima-jobi L.) and their potential as antioxidants and crop protection agents. Agrochemicals. 2(1): 135-149.
- Baldwin BG, Sanderson MJ, Porter JM, Wojciechowski MF, Campbell CS, Donoghue MJ. 1995. The ITS region of nuclear ribosomal DNA: A valuable source of evidence on angiosperm phylogeny. Ann. Mo. Bot. Gard. 82(2): 247-277.
- Bennett M, Leitch I. 2005. Genome size evolution in plants: The evolution of the genome. Academic Press. New York.:
- Cai Z, Liu H, He Q, Pu M, Chen J, Lai J, et al. 2014. Differential genome evolution and speciation of Coix lacryma-jobi L. and Coix aquatica Roxb. hybrid guangxi revealed by repetitive sequence analysis and fine karyotyping. BMC Genomics. 15(1): 1025
- Campomayor NB, Waminal NE, Kang BY, Nguyen TH, Lee S-S, Huh JH, et al. 2021. Subgenome discrimination in Brassica and Raphanus allopolyploids using microsatellites. Cells. 10(9): 2358
- Devaraj RD, Jeepipalli SP, Xu B. 2020. Phytochemistry and health promoting effects of Job's tears (Coix lacryma-jobi)-A critical review. Food Biosci. 34: 100537
- Fuchs J, Brandes A, Schubert I. 1995. Telomere sequence localization and karyotype evolution in higher plants. Plant Syst. Evol. 196(3): 227-241.
- Gloria AL, Alegado JC Jr, Boco MDA. 2015. Adaptability trial of five (5) varietes of adlai (Coix lacryma, Jobi L.) grown in marginal land, under san miguel environment condition, surigao del sur, mindanao, philippines. SDSSU Multidiscip. Res. J. 3: 70-77.
- Greilhuber J, Doležel J, Lysák MA, Bennett MD. 2005. The origin, evolution and proposed stabilization of the terms 'genome size'and 'C-value'to describe nuclear DNA contents. Ann. Bot. 95(1): 255-260.
- Grover CE, Wendel JF. 2010. Recent insights into mechanisms of genome size change in plants. J. Bot. 2010(1): 382732
- He L, Liu J, Torres GA, Zhang H, Jiang J, Xie C. 2013. Interstitial telomeric repeats are enriched in the centromeres of chromosomes in Solanum species. Chromosome Res. 21(1): 5-13.
- Hedayetullah M, Zaman P. 2022. Forage crops world, 2-vol. set. Vol. I & II. CRC Press.
- Kumar S, Stecher G, Li M, Knyaz C, Tamura K. 2018. MEGA X: Molecular evolutionary genetics analysis across computing platforms. Mol. Biol. Evol. 35(6): 1547-1549.
- Leseberg CH, Duvall MR. 2009. The complete chloroplast genome of Coix lacryma-jobi and a comparative molecular evolutionary analysis of plastomes in cereals. J. Mol. Evol. 69(4): 311-318.
- Li X-D, Pan H, Lu X-J, Wei X-Y, Shi M, Lu P. 2021. Complete chloroplast genome sequencing of Job's tears (Coix l.): Genome structure, comparative analysis, and phylogenetic relationships. Mitochondrial DNA B: Resour. 6(4): 1399-1405.
- Liu H, Shi J, Cai Z, Huang Y, Lv M, Du H, et al. 2020. Evolution and domestication footprints uncovered from the genomes of Coix. Mol. Plant. 13(2): 295-308.
- Madhav NA, Chandore AN, Gosavi KVC. 2024. Cytology of two varieties of Coix lacryma-jobi L. (Poaceae) in India. Cytologia. 89(2): 153-156.
- Nguyen TH, Waminal NE, Lee DS, Pellerin RJ, Ta TD, Campomayor NB, et al. 2021. Comparative triple-color FISH mapping in eleven Senna species using rDNA and telomeric repeat probes. Hortic Environ Biotechnol. 62(6): 927-935.
- Pellerin RJ, Waminal NE, Kim HH. 2019. FISH mapping of rDNA and telomeric repeats in 10 Senna species. Hortic Environ Biotechnol. 60(2): 253-260.
- Pellicer J, Hidalgo O, Dodsworth S, Leitch IJ. 2018. Genome size diversity and its impact on the evolution of land plants. Genes. 9(2): 88
- Peniton EA Jr, Nguyen HT, Waminal NE, Yang T-J, Kim HH. 2024. Cytogenomic evaluation of regenerated Aralia elata using PLOP-FISH and flow cytometry. Sci. Rep. 14(1): 30289
- Peniton EA Jr, Waminal NE, Yang T-J, Kim HH. 2022. Cell cycle synchronization in Panax ginseng roots for cytogenomics research. Hortic Environ Biotechnol. 63(1): 137-145.
- Roa F, Guerra M. 2012. Distribution of 45S rDNA sites in chromosomes of plants: structural and evolutionary implications. BMC Evol. Biol. 12(1): 225
- Schubert I, Lysak MA. 2011. Interpretation of karyotype evolution should consider chromosome structural constraints. Trends Genet. 27(6): 207-216.
- Tamura K, Nei M. 1993. Estimation of the number of nucleotide substitutions in the control region of mitochondrial DNA in humans and chimpanzees. Mol. Biol. Evol. 10(3): 512-526.
- Tamura K, Stecher G, Kumar S. 2021. MEGA11: Molecular evolutionary genetics analysis version 11. Mol. Biol. Evol. 38(7): 3022-3027.
- Waminal NE, Pellerin RJ, Kim N-S, Jayakodi M, Park JY, Yang T-J, et al. 2018. Rapid and efficient FISH using pre-labeled oligomer probes. Sci. Rep. 8(1): 8224


