Abstract
Nitrogen is an essential nutrient for crop growth and development. Although the functions of several genes associated with nitrogen deficiency tolerance have been studied, many genetic components remain unknown. In this study, 190 North Korean (NK) rice genotypes were used to identify genes linked to nitrogen deficiency resistance. The NK population was hydroponically cultivated for 31 days under normal nitrogen (NN) and low nitrogen (LN) conditions. After this period, phenotypic evaluations were conducted on six agronomic traits (SPAD, shoot length, root length, shoot fresh weight, root fresh weight, and tiller number). A genome-wide association study (GWAS) was performed using the phenotypic values and resequencing data from 190 NK rice genotypes. As a result, 107 significant lead SNPs were identified. Among the genes related to these lead SNPs, 12 previously identified NUE-related genes for nitrogen use efficiency (NUE) and 6 unknown candidate genes exhibited significant differences in haplotype analysis. Nine of the 12 known genes (OsNPF4.1, OsNPF5.16, OsNPF6.1, OsNPF7.2, OsNPF7.7, OsAMT1.2, OsNRT1.3, OsAAP4, and OsLBD37) are involved in nitrogen uptake, while two (OsAAT1 and OsGS1;2) play a role in nitrogen assimilation, and one (OsNLP3) activates nitrate-responsive genes. This work demonstrates that the 190 NK rice genotypes analyzed harbor multiple critical genes involved in nitrogen uptake and identifies additional candidate genes associated with nitrogen deficiency tolerance. The genetic resources containing these known and novel genes for NUE could contribute to breeding rice varieties with high nitrogen deficiency tolerance (NDT).
-
Key words: Rice, GWAS, Nitrogen use efficiency, Haplotype
Introduction
Rice (
Oryza sativa) is a major staple crop, feeding a large part of the global population (
Shin et al. 2020). Rice productivity, like that of all crops, depends heavily on the availability of essential nutrients, particularly nitrogen, which plays a pivotal role in synthesizing amino acids, proteins, nucleic acids, chlorophyll, and plant hormones (
Fukushima and Kusano 2014). Nitrogen is a critical macronutrient for plant growth and development, influencing key processes such as photosynthesis, cell division, and biomass accumulation. However, nitrogen fertilizers are extensively applied in agriculture to meet crop nitrogen demands. Despite this, only 30-50% of the nitrogen applied through fertilizers is absorbed by crops, while the remainder lost to the environment, including soil and water systems (
Mandal et al. 2018). This inefficient nitrogen uptake not only results in excessive fertilizer use but also contributes to environmental pollution, including water contamination and greenhouse gase emissions. Thus, developing rice cultivars with enhanced nitrogen use efficiency (NUE) and nitrogen deficiency tolerance (NDT) is of critical importance. Improving NUE and NDT could reduce reliance on synthetic nitrogen fertilizers, enhancing the sustainability in rice production while maintaining or increasing crop yields.
Nitrogen metabolism in plants involves several key processes, including uptake, transport, reduction (conversion to usable forms), assimilation, translocation, and remobilization (
Lee 2021). These processes ensure the efficient acquisition and utilization of nitrogen from the soil to sustain plant growth and reproduction. Nitrogen is initially absorbed by the rice roots in the form of nitrate (NO₃⁻) or ammonium (NH₄⁺). The absorbed nitrogen is then transported through the plant to key tissues such as the leaves, where it is reduced and assimilated into amino acids, proteins, and other vital macromolecules. The nitrate reduction pathway involves the enzymatic conversion of nitrate to nitrite by nitrate reductase (NR) in the cytoplasm, followed by the reduction of nitrite to ammonium by nitrite reductase (NiR) in the chloroplasts (
Gao et al. 2019). The resulting ammonium is incorporated into amino acids via the glutamine synthetase-glutamate synthase (GS-GOGAT) cycle, which is essential for maintaining cellular nitrogen homeostasis and supporting metabolic functions critical for plant growth (
Tamura et al. 2011). However, despite the importance of these processes, nitrogen uptake in rice is often suboptimal, with current NUE levels ranging from 30-40% (
Hakeem et al. 2011). As a result, the development of rice varieties with higher NUE and improved NDT has become a critical focus for agricultural research.
The genome-wide association study (GWAS) has emerged as a powerful tool to explore the genetic basis of complex traits, including NUE and NDT, in crops such as rice (
Huang et al. 2012;
Zhao et al. 2011). GWAS enables the identification of single nucleotide polymorphisms (SNPs) associated with phenotypic variation across genetically diverse populations. This method has several advantages over traditional quantitative trait locus (QTL) mapping, particularly for studying complex traits with high genetic diversity. GWAS can provide high mapping resolution due to the large number of genetic recombination events and the use of genetically diverse populations, making it possible to identify genetic loci with a strong correlation to the trait of interest (
Famoso et al. 2011;
Li et al. 2013). Recent studies have applied GWAS to identify genes associated with NUE in rice. For instance,
OsNAC42,
OsNPF6.1, and
OsNLP4 have been identified as key regulators involved in nitrogen uptake and assimilation (
Tang et al. 2019;
Yu et al. 2021). By pinpointing these candidate genes, GWAS provides valuable insights that can be used in breeding programs aimed at improving NUE and NDT in rice. Moreover, high-resolution genome data, such as those generated by the 3,000 rice genomes project (3K-RGP), offer an expansive resource for GWAS and provide essential genetic information for trait improvement (3
K RGP 2014;
Li et al. 2014).
In this study, we used the North Korean (NK) rice population, which has been relatively underexplored in genetic research, despite its significant potential for the discovery of new genetic traits. NK rice is genetically distinct due to its isolated breeding history and unique environmental conditions. Understanding the genetic makeup of NK rice offers an opportunity to uncover novel genes and pathways that enhance NDT and NUE. Given its genetic diversity, this population serves as an excellent resource for GWAS to identify genes that can be leveraged in breeding programs to develop rice cultivars suited for nitrogen-limited environments. This study aims to investigate the genetic basis of NDT in a diverse population of 190 NK rice accessions. By applying GWAS, we seek to identify candidate genes and genetic markers associated with NDT, which could potentially lead to the development of rice varieties with improved NUE and tolerance to nitrogen-deficient soils. Additionally, this study will provide valuable insights into the genetic diversity of NK rice, contributing to a broader understanding of rice genetics and supporting future rice breeding efforts.
Materials and Methods
Plant materials and phenotype analysis
A population of 190 NK rice genotypes was provided by the International Rice Research Institute (IRRI). The rice seeds were surface-sterilized by shaking them in 1,000 ppm prochloraz for 30 minutes, then incubated at 30°C with daily water changes for two days to promote germination. The plants were then hydroponically grown in a greenhouse at Hankyong National University in Anseong-si, Gyeonggi-do, South Korea, beginning on March 31, 2023. Each variety was grown hydroponically in six biological replicates using Yoshida solution as the nutritional medium (
Yoshida et al. 1971). The Yoshida solution contained the following nutrients: 40 ppm NH
4NO
3 for nitrogen, 10 ppm NaH
2PO
4⋅H
2O for phosphorus, 40 ppm K
2SO
4 for potassium, 40 ppm CaCl
2 for calcium, 40 ppm MgSO
4⋅7H
2O for magnesium, 0.5 ppm MnCl2
⋅4H
2O for manganese, 0.05 ppm (NH
4)
6Mo
7O
24⋅4H
2O for molybdenum, 0.2 ppm H
3BO
3 for boron, 0.01 ppm ZnSO
4⋅7H
2O for zinc, 0.01 ppm CuSO
4⋅5H
2O for copper, 2 ppm FeCl
3⋅6H
2O for iron, 0.02 ppm C
6H
8O
7⋅H
2O, and 0.006 ppm H
2SO
4.
The hydroponic system maintained a pH of 5.0, and the Yoshida solution was refreshed weekly. The control group received the standard Yoshida solution under normal-nitrogen (NN) conditions, whereas the treatment group received a low-nitrogen (LN) solution with nitrogen levels reduced to 10% of those in NN (1 ppm NH4NO3). After 31 days of cultivation, the plants were evaluated for six agronomic traits: soil plant analysis development (SPAD), shoot length (SL), root length (RL), shoot fresh weight (SFW), root fresh weight (RFW), and tiller number (TN). Extreme observations were identified as outliers and removed due to high variability. Outliers from the six biological replicates were removed due to high variability, and the mean values were calculated to generate a phenotypic dataset for GWAS analysis. The relative low-N (ReLN) value was calculated as (LN/NN)×100.
NGS analysis and Genotyping
The genomic sequencing data for the 190NK rice genotypes used in this study were previously generated and reported by
Jadamba et al. (2022). In that study, genomic DNA was extracted, libraries were prepared, and sequencing was performed using the MGI sequencing platform with 150-bp paired-end reads. Detailed protocols for DNA isolation, library preparation, and sequencing can be found in their study.
GWAS was conducted using the fixed and random model circulating probability unification (FarmCPU), implemented in the rMVP R package. FarmCPU is particularly well-suited for large-scale GWAS investigations as it iteratively updates fixed effects and random effects models, effectively reducing false positive errors typical in mixed linear models (MLM) (
Liu et al. 2016). The rMVP package, recognized for its memory efficiency, enhanced visualization, and parallel acceleration capabilities (
Lipka et al. 2012), facilitated the analysis. This comprehensive approach ensured robust results, accounting for agricultural and environmental conditions to yield consistent and biologically meaningful insights. FarmCPU accounts for confounding factors such as population structure and environmental impacts, enabling more accurate genetic signal extraction. Consequently, FarmCPU is widely adopted in agricultural and life sciences research and was selected as the GWAS model for this study. The analysis included a total of 2,394,361 SNPs. We filtered the data using PLINK with the following criteria: minor allele frequency (MAF)≥0.05, missing data rate≤25%, minimum genotype quality≥30, and minimum depth≥4. After filtering, the Bonferroni multiple test adjustment was applied to control for false positives, resulting in a threshold value of -log
10 (P)=5.9 (0.05 divided by the number of independent SNPs at a 5% significance level). Lead SNPs were identified based on significance, and linkage disequilibrium (LD) plots were generated to pinpoint genomic regions of importance for each lead SNP. Genes located within 1 Mb of the lead SNPs were considered potential candidates. Haplotype analysis was then performed on genes physically adjacent to the lead SNPs. To evaluate haplotype-specific differences in phenotype, Duncan's test was applied to determine statistical significance.
Haplotyping of candidate genes identified through GWAS was performed to explicitly evaluate SNPs that cause significant phenotypic differences, as well as the distribution of genotypes harboring these SNPs across the 190 NK rice population. To capture all SNP variants, including insertion and deletion (InDel) calls, haplotype analysis was performed on raw, unfiltered genotyping data. After removing heterozygotes and missing data, SNPs and InDels in exon regions were used to conduct haplotype variation studies. We used annotation version 6.1 to scan the genomic areas of the important loci with japonica cv. Nipponbare genomic pseudomolecules from the Michigan State University (MSU) rice database. The candidate genes identified from the GWAS results were then evaluated using Duncan's test.
Results
Phenotypic variation in the NK rice population under nitrogen deficiency
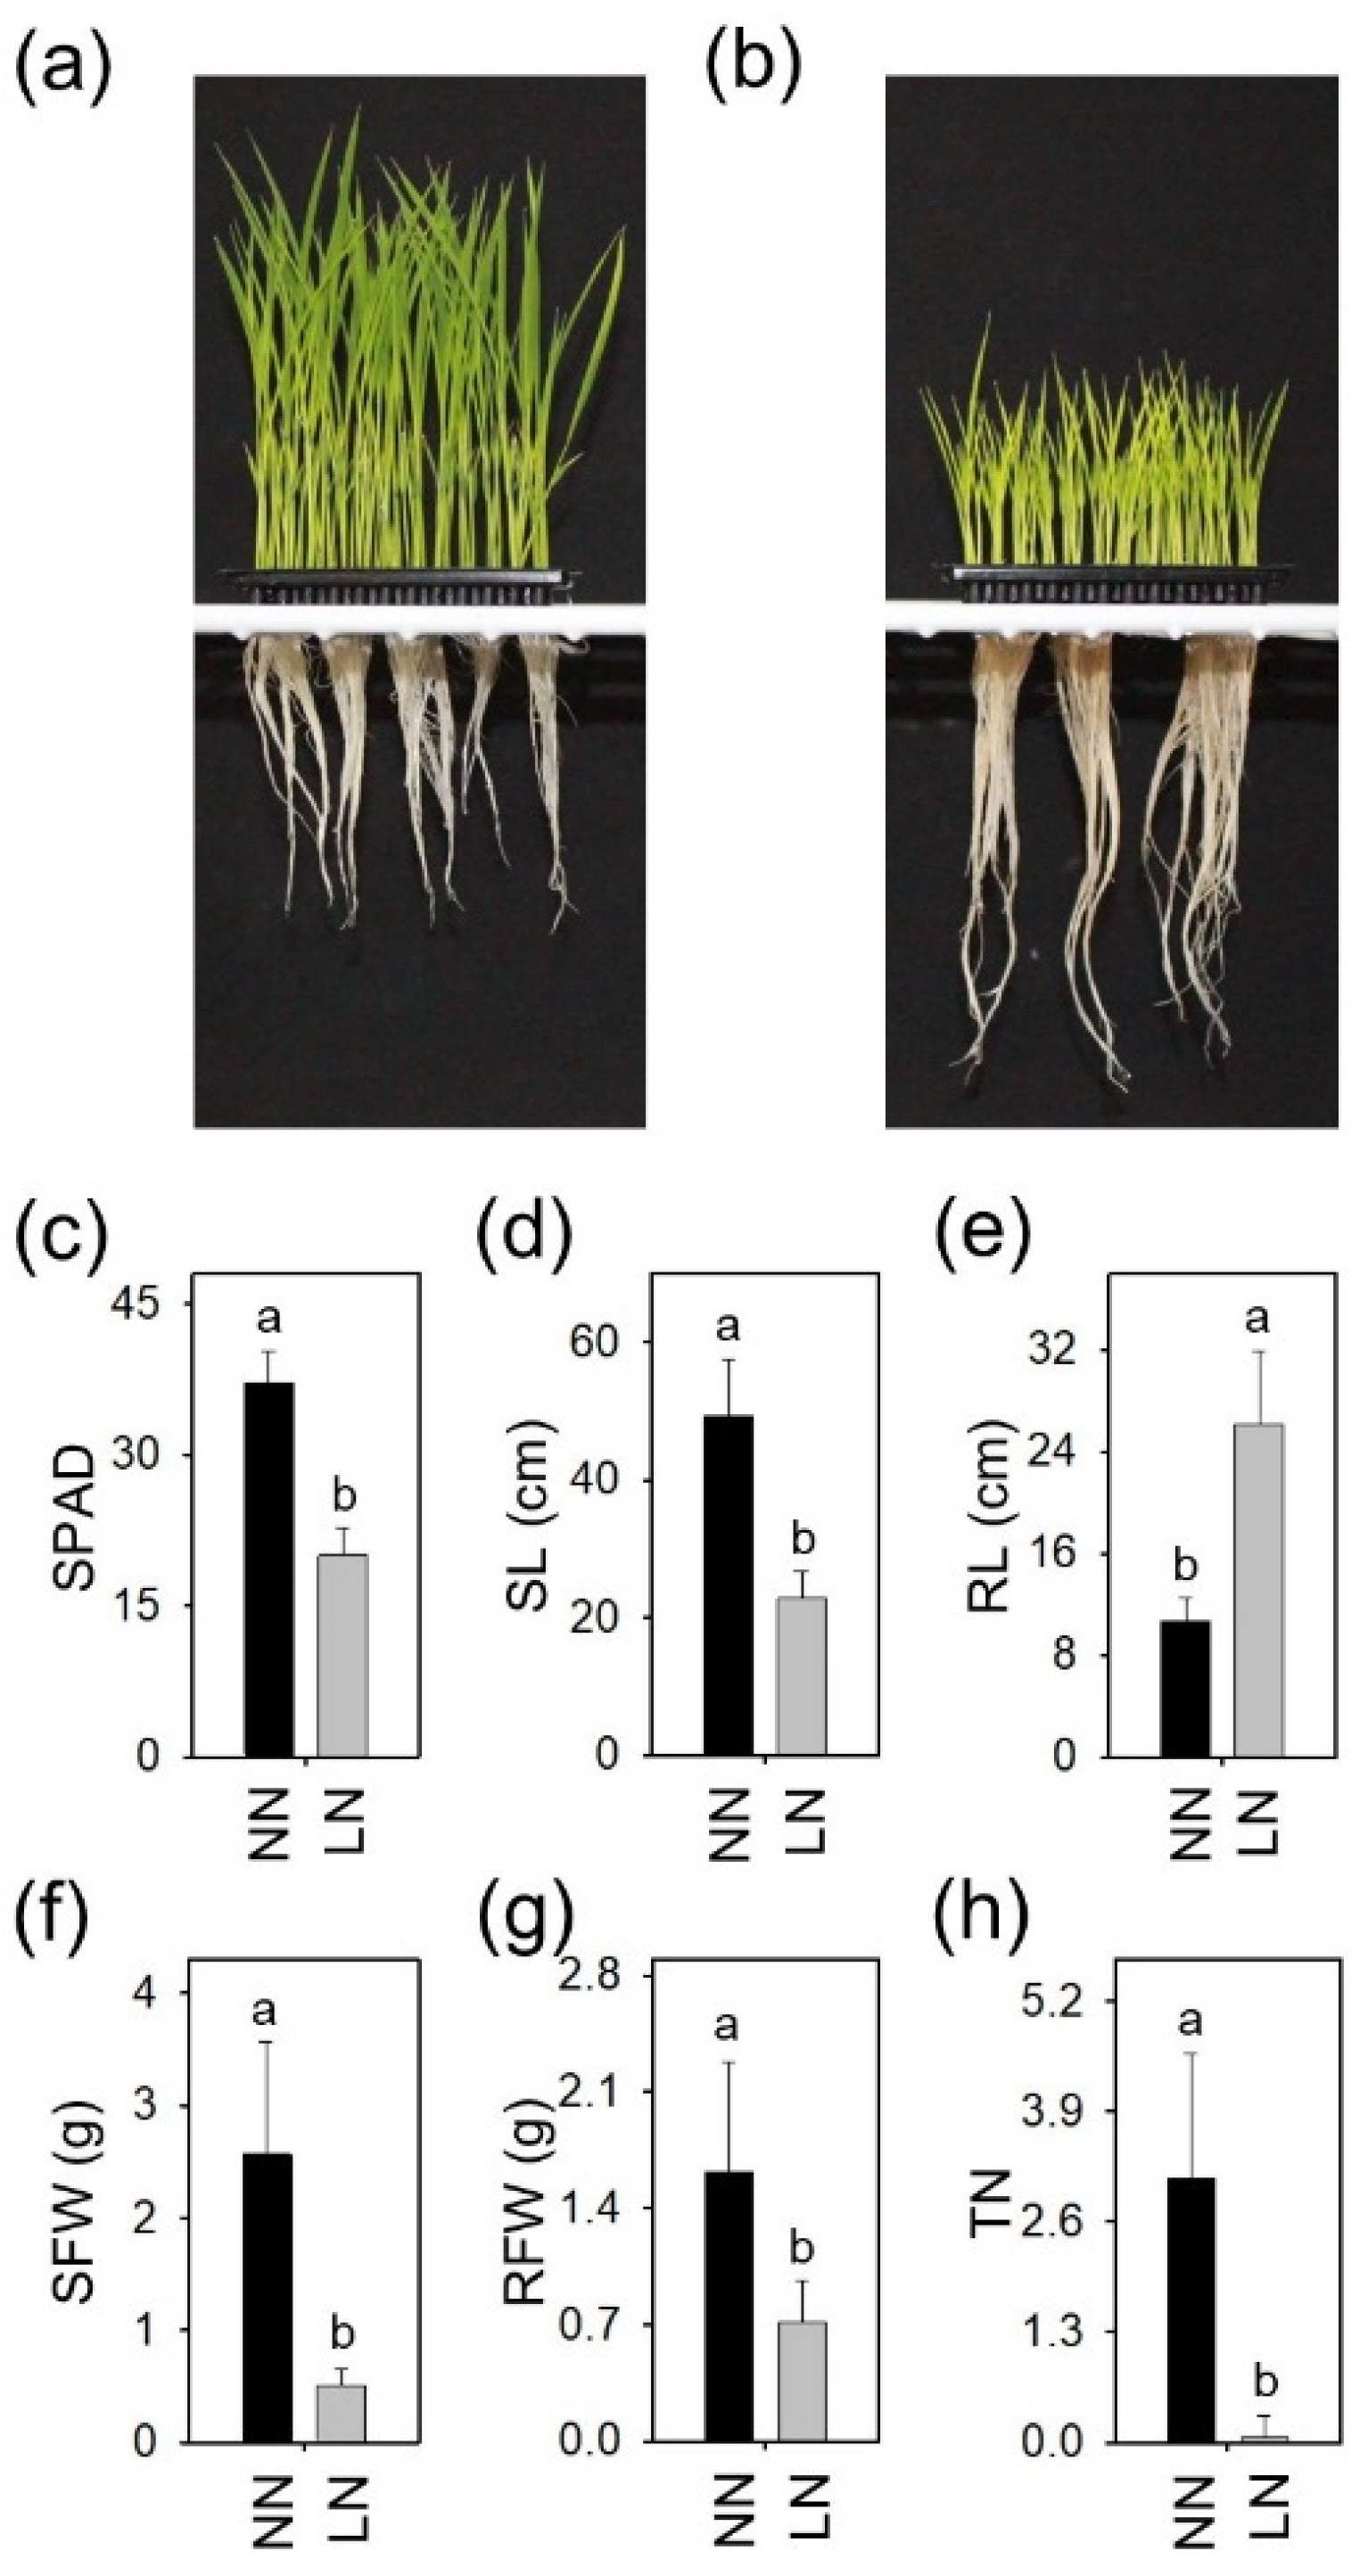
Nitrogen deficiency significantly hindered the growth of rice seedlings, as demonstrated by the phenotypic analysis of six agronomic traits after 31 days of hydroponic cultivation under NN and LN conditions (
Fig. 1). The phenotypic values of five traits declined considerably under LN conditions (
Figs. 1c,
1d,
1f,
1h). Notably, the decrease in SPAD value was evident in the color of the rice seedling shoots (
Figs. 1a,
1b), indicating that nitrogen is essential for chlorophyll accumulation. Interestingly, RL significantly increased under LN conditions, likely as an adaptive response to enhance nitrogen uptake (
Fig. 1e). However, although RL increased under nitrogen deficiency conditions, RFW significantly declined. This was likely due to physiological changes that elongated the roots but did not allocate sufficient energy or resources to increase root width or thickness.
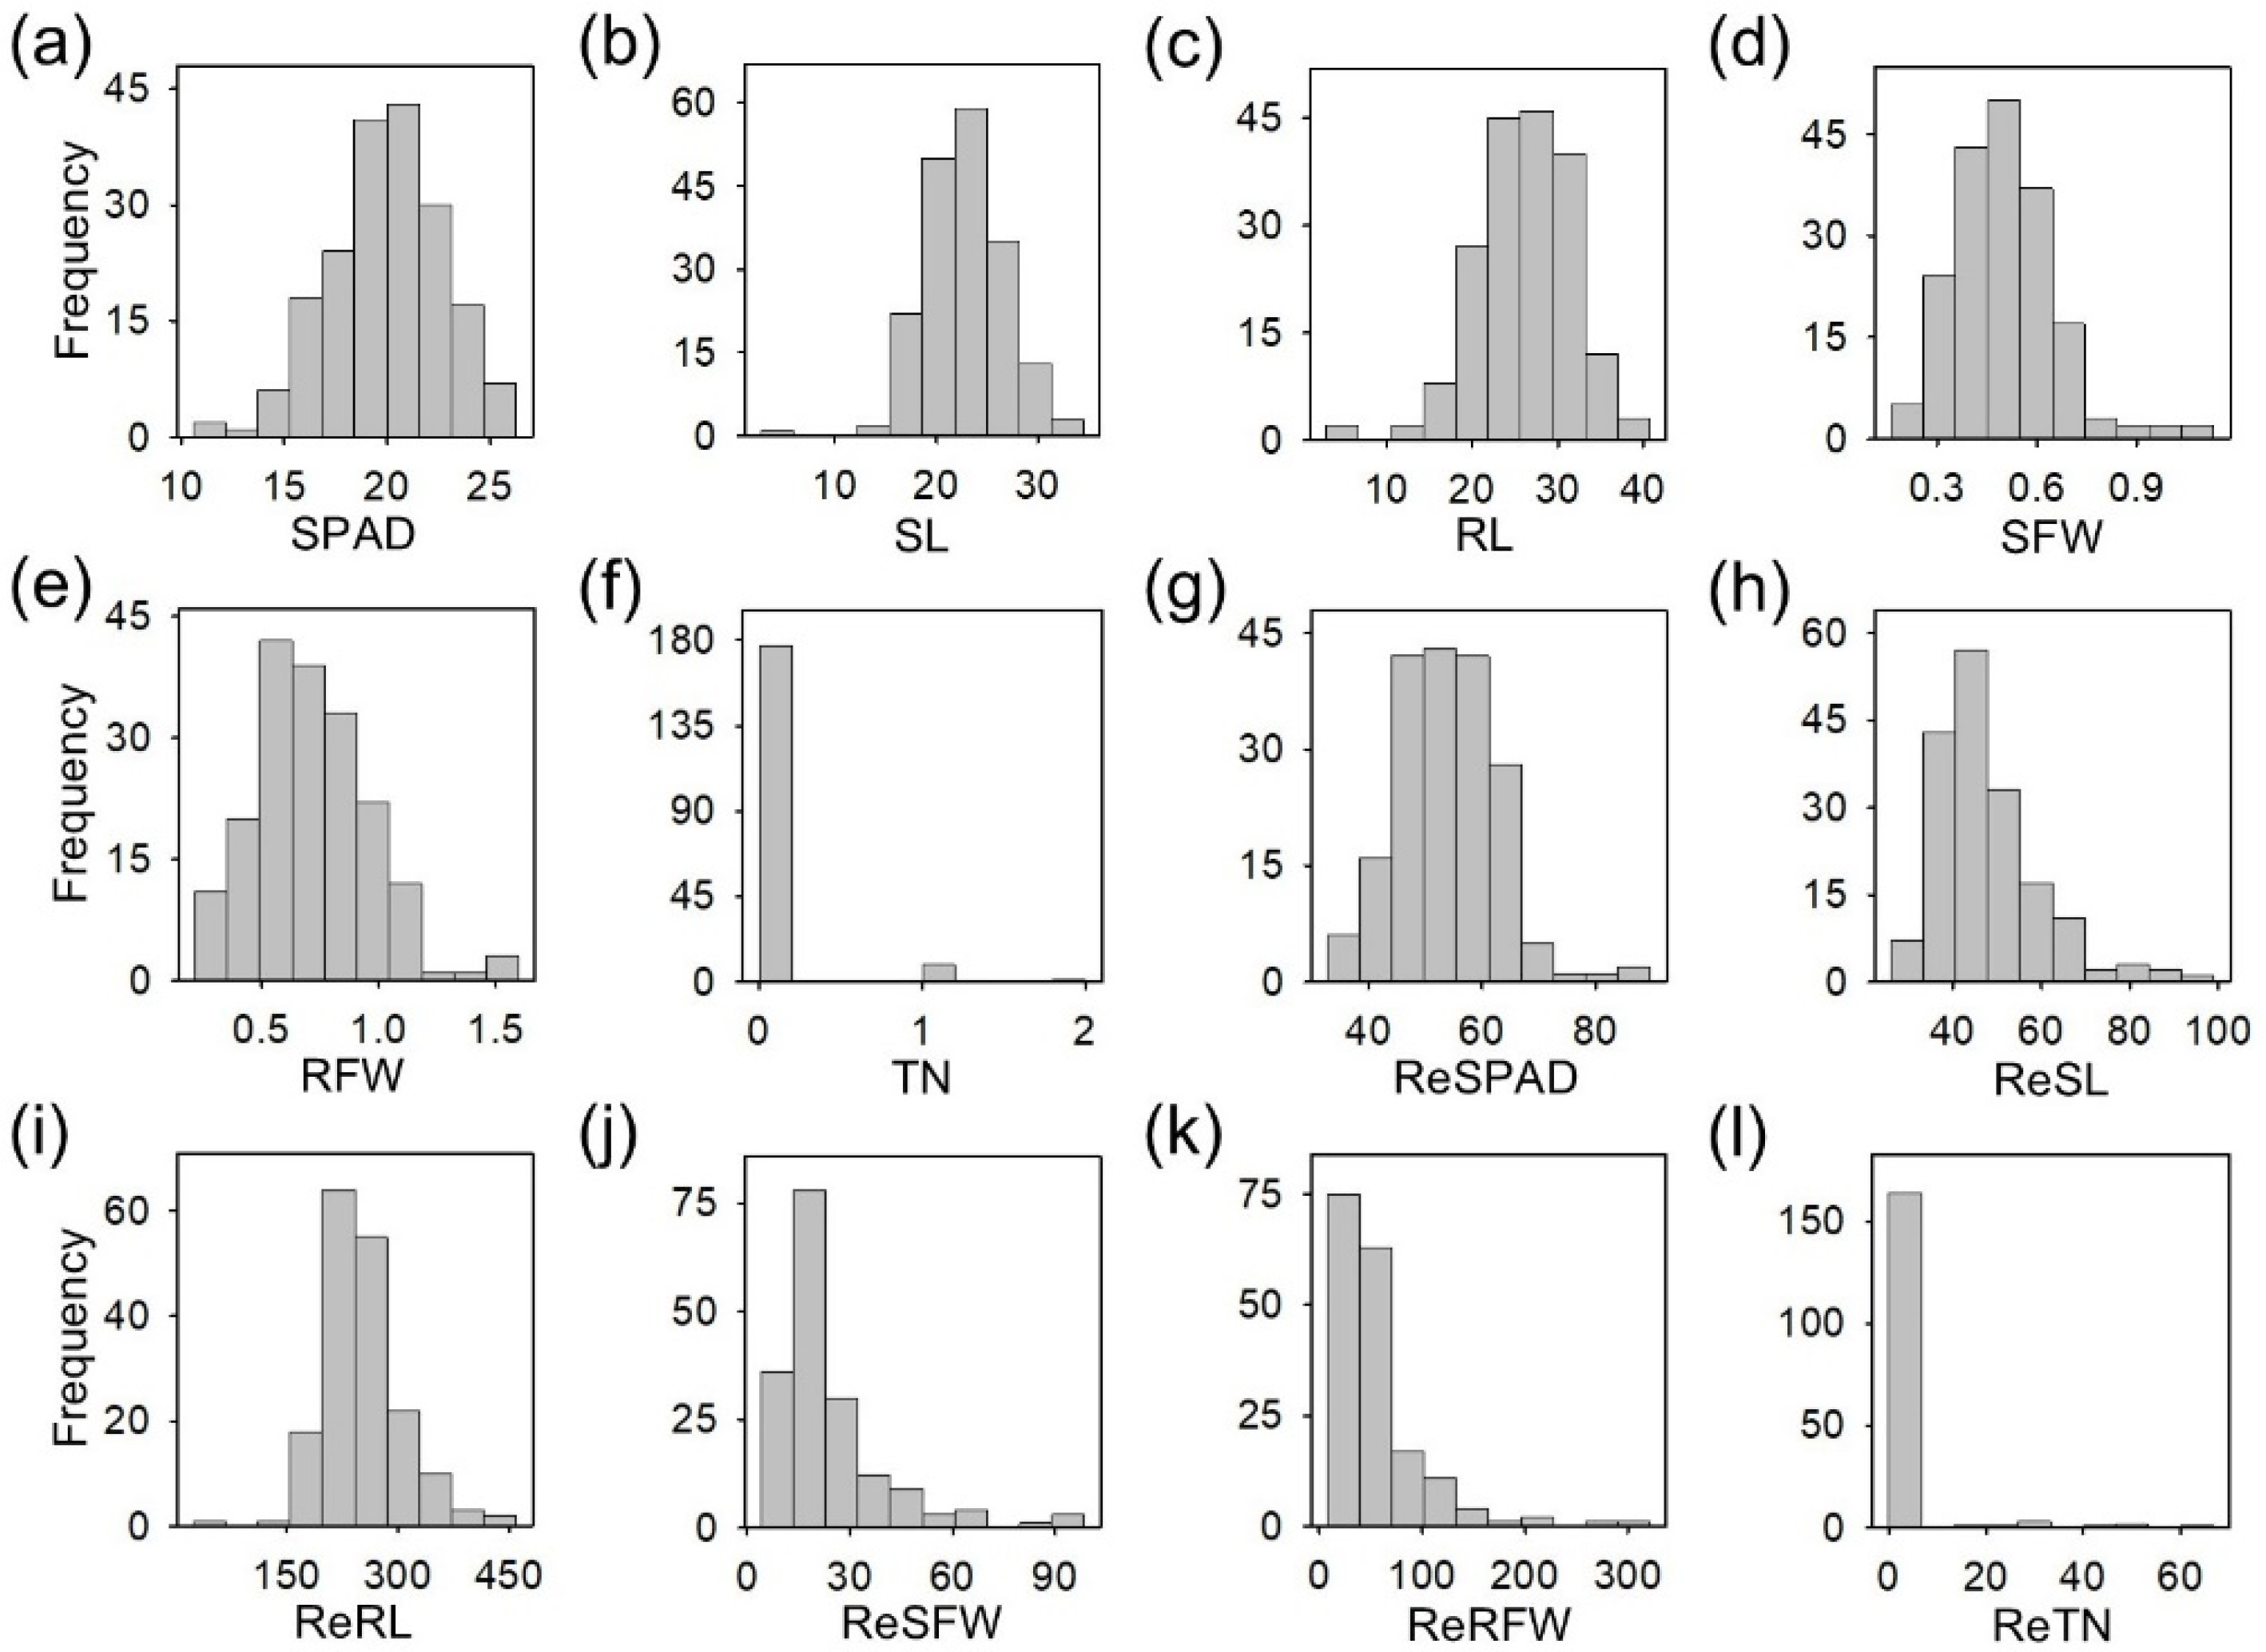
The frequencies of the twelve phenotypes mostly followed a normal distribution, except for TN and ReTN, which exhibited significant skewness. This skewness is likely due to the strong suppression of tiller development caused by nitrogen deficiency (
Fig. 2). The normal distribution of most traits suggests that the 190 NK rice population is genetically diverse, with some genotypes demonstrating superior plant growth under nitrogen-deficient conditions. These genotypes could serve as valuable resources for breeding cultivars with high NDT.
The correlation analysis for the six agronomic traits was performed between LN and ReLN values (
Table 1). We found that SFW was positively correlated with SL and RFW in both LN and ReLN. Among them, ReSFW showed the highest correlation with ReRFW (0.9241) in ReLN. Notably, RL was negatively correlated with SPAD in both LN and ReLN.
To identify candidate genes associated with low-N tolerance, we performed a GWAS with 190 NK rice accessions. GWAS was performed using FarmCPU implemented in the rMVP R package, with 2,394,361 SNPs filtered using PLINK. A total of 107 significant lead SNPs were found across the 12 chromosomes. The quantile-quantile (Q-Q) plot revealed that while some features exhibited skewed distributions, there was an overall alignment between the expected and observed -log
10 (P) values. LD analysis was used to identify candidate genomic regions associated with each significant peak. Candidate genes underlying the lead SNPs were determined by examining genomic regions 100 kb to 1 Mb adjacent to the lead SNPs. This analysis utilized pairwise R² values for SNPs, and gene annotations were sourced from the Rice Genome Annotation Project (RGAP;
http://rice.uga.edu).
GWAS and LD analyses identified twelve known genes (
OsNPF4.1,
OsNPF5.16,
OsNPF6.1,
OsNPF7.2,
OsNPF7.7,
OsLBD37,
OsGS1;2,
OsAAP4,
OsAMT1.2,
OsNRT1.3,
OsAAT1 and
OsNLP3) related to NUE, and six unknown candidate genes (
OsWAK104,
OsCRSH2,
OsCIPK23,
ART2,
OsAlaAT1 and
OsWRKY31). For the LN traits, five known genes were identified: three (
OsNPF5.16,
OsNPF7.2, and
OsAAP4) for SPAD, one (
OsNRT1.3) for SL, and two (
OsNLP3 and
OsNRT1.3) for SFW. No associated genes were identified for RL and RFW (
Fig. 3). Among them,
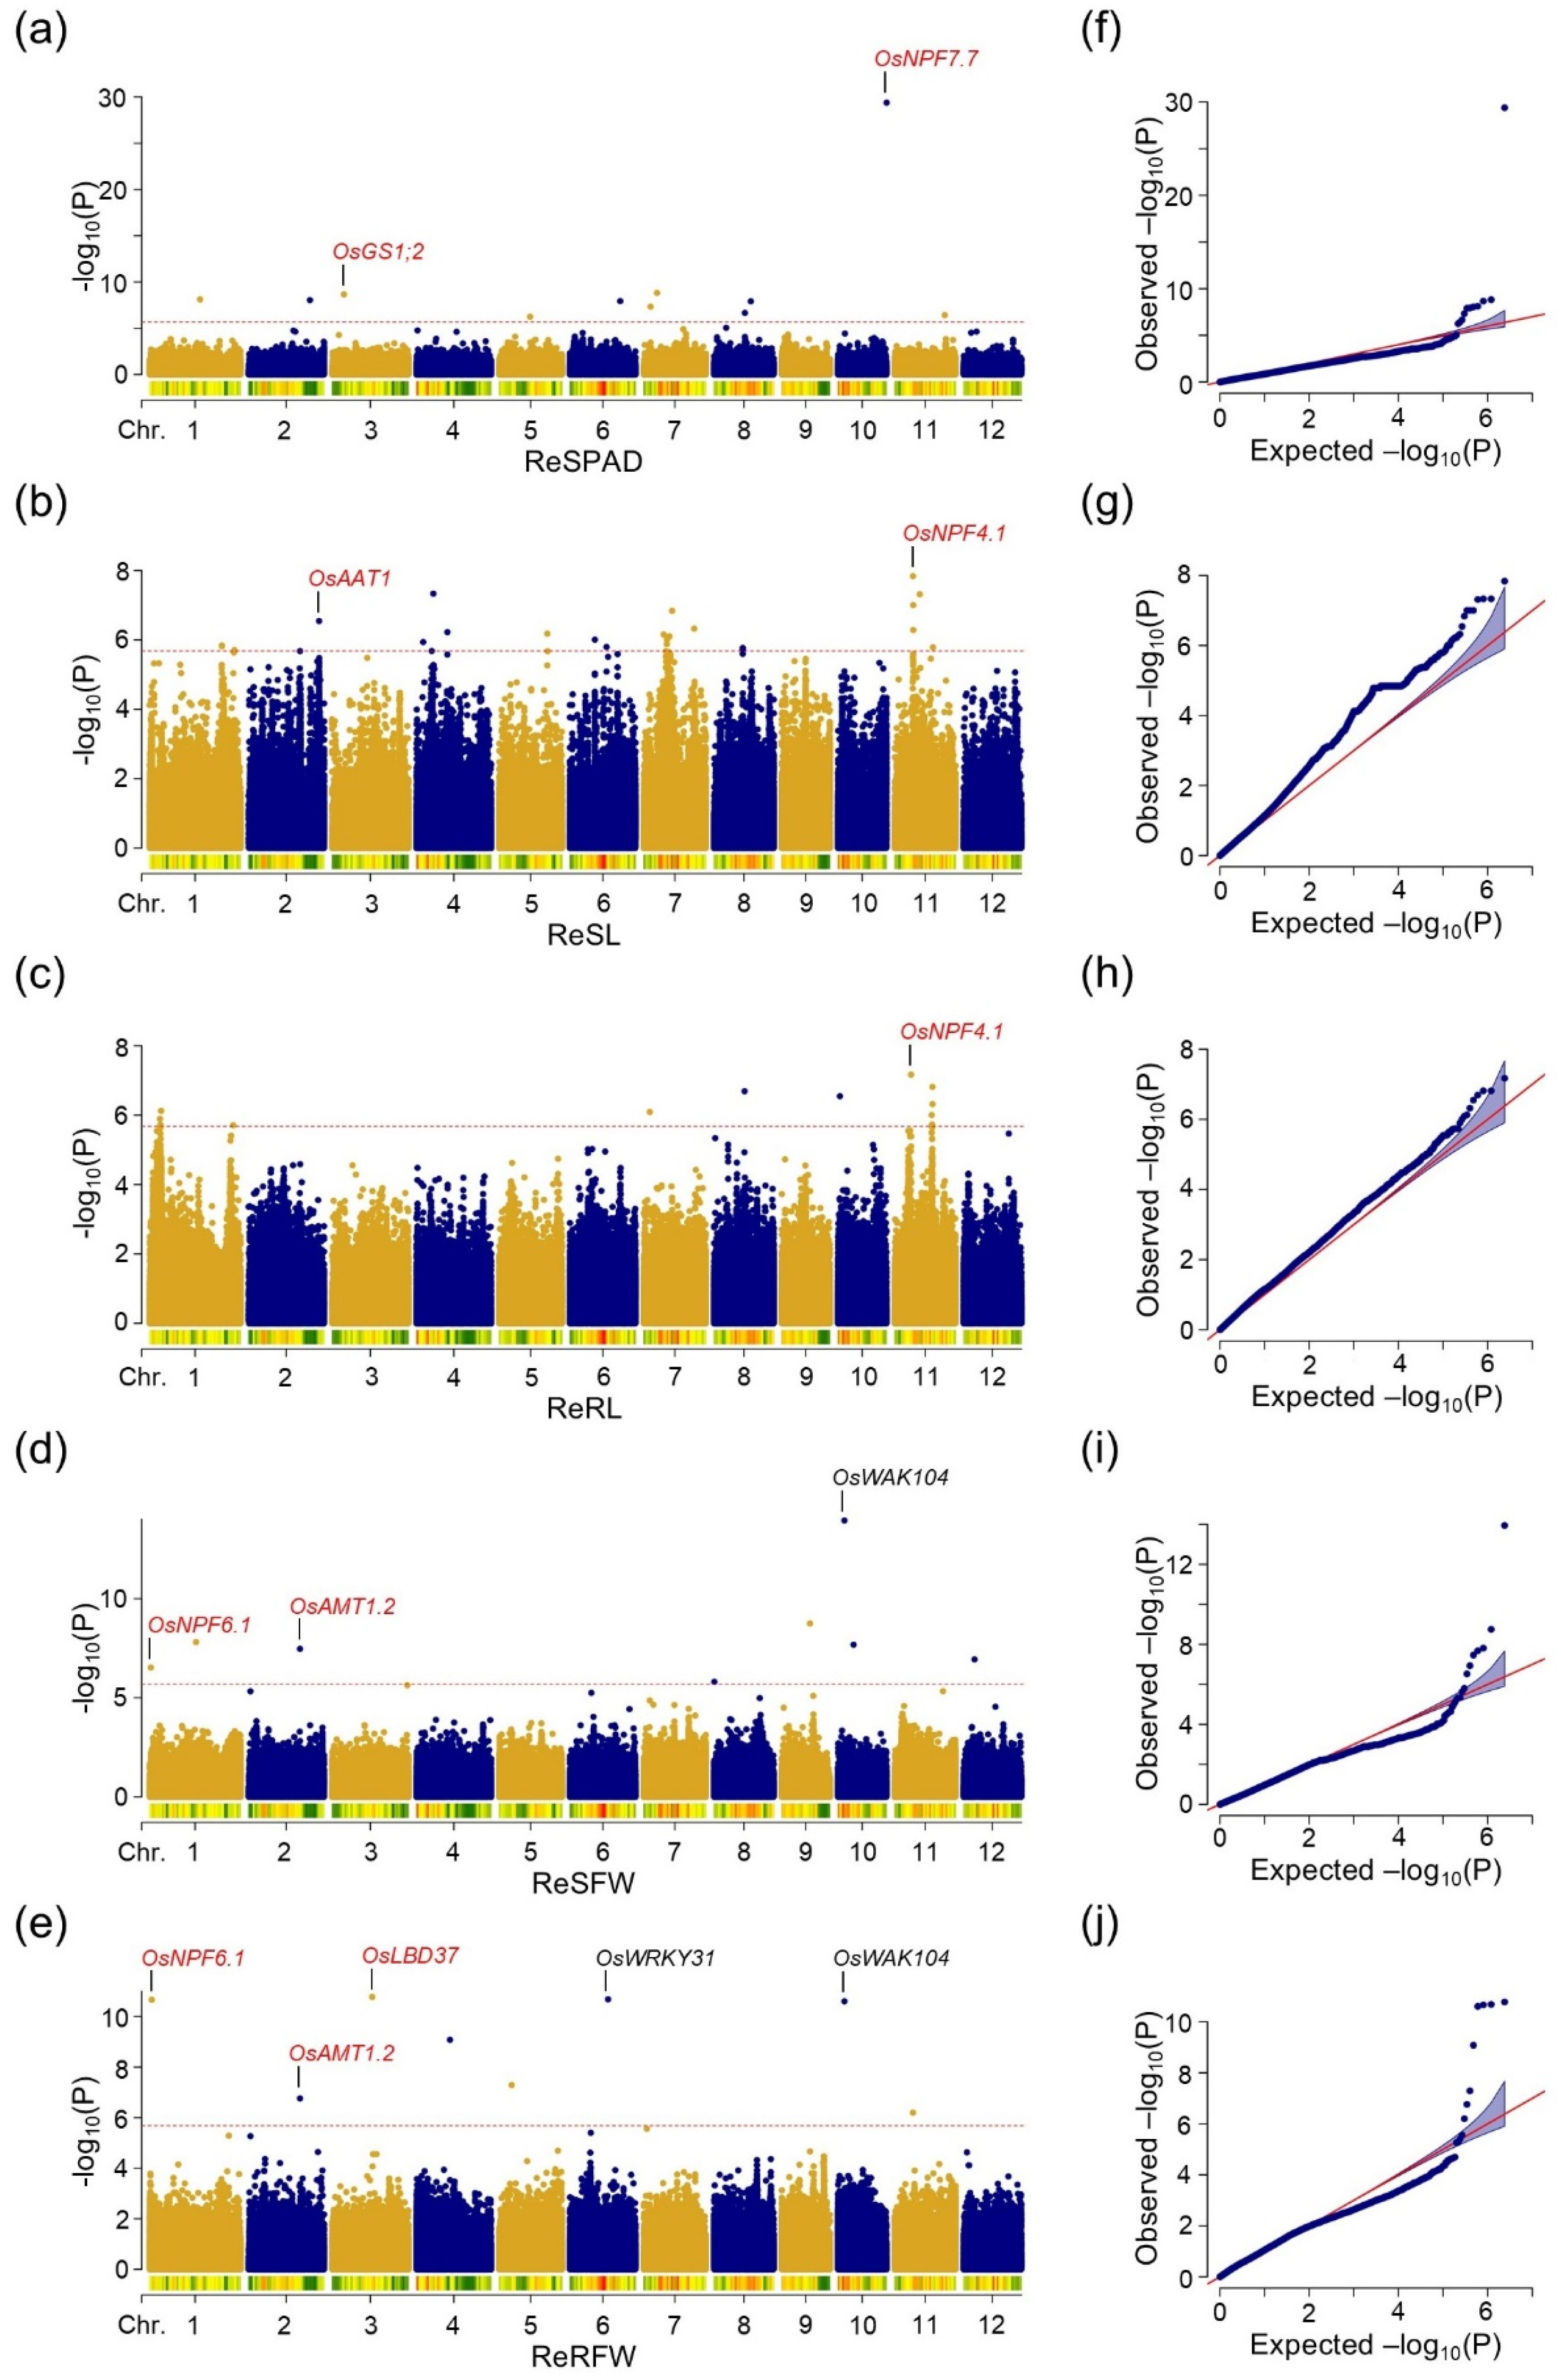
OsNRT1.3 was repeatedly identified for SL and SFW. For the ReLN traits, seven known genes were identified: two (
OsGS1;2 and
OsNPF7.7) for ReSPAD, two (
OsAAT1 and
OsNPF4.1) for ReSL, one (
OsNPF4.1) for ReRL, two (
OsNPF6.1 and
OsAMT1.2) for ReSFW, and three (
OsNPF6.1,
OsAMT1.2, and
OsLBD37) for ReRFW (
Fig. 4). Among them, three genes (
OsNPF4.1,
OsNPF6.1,
OsAMT1.2) were repeatedly identified. More genes were repeatedly identified in ReLN compared to those in LN trait.
The twelve known genes identified through GWAS were categorized according to nitrogen metabolic processes. Nine of the twelve genes (
OsNPF4.1,
OsNPF5.16,
OsNPF6.1,
OsNPF7.2,
OsNPF7.7,
OsAMT1.2,
OsNRT1.3,
OsAAP4, and
OsLBD37) were involved in nitrogen uptake, two (
OsAAT1 and
OsGS1;2) in nitrogen assimilation, and one (
OsNLP3) in the activation of nitrate-responsive genes (
Table 2). The process involving the most genes was nitrogen uptake, and these nine genes were further classified into major families, consisting of five NPF family genes (
OsNPF4.1,
OsNPF5.16,
OsNPF6.1,
OsNPF7.2, and
OsNPF7.7), one AMT family gene (
OsAMT1.2), and one NRT family gene (
OsNRT1.3).
OsNPF6.1 was previously identified by GWAS on rice landraces with severe N-related traits.
OsNPF6.1HapB, which is generated from wild rice variants, improved nitrate uptake and provided a high NUE by increasing output under low-nitrogen supplies (
Tang et al. 2019). Another gene
OsNPF7.2 is a tonoplast localized low-affinity nitrate transporter, and its knock-down plants exhibit a slowed growth phenotype under high nitrate input (
Hu et al. 2016). Overexpression of
OsNPF7.7 increases N influx to the root, which increases grain production and nitrogen utilization efficiency (
Huang et al. 2018). For the AMT gene family,
OsAMT1.2 expresses root-specific and is induced by ammonium. At the seedling stage, overexpression of
OsAMT1.2 led to improved ammonium absorption and tolerance to nitrogen starvation (
Sonoda et al. 2003). The associated lead SNPs,
p-values, characteristics, and functions of the twelve known genes were summarized in
Table 2.
Among the six unknown genes identified by GWAS,
OsWAK104 was repeatedly identified for ReSFW and ReRFW (
Table 3). Additionally, four genes (
OsCRSH2,
OsCIPK23,
ART2, and
OsAlaAT1) were associated with SL. Notably, all lead SNPs associated with the six unknown genes showed strong significance, with
p-values greater than 10. The associated lead SNPs,
p-values, characteristics, and functions of the six unknown genes were summarized in
Table 3.
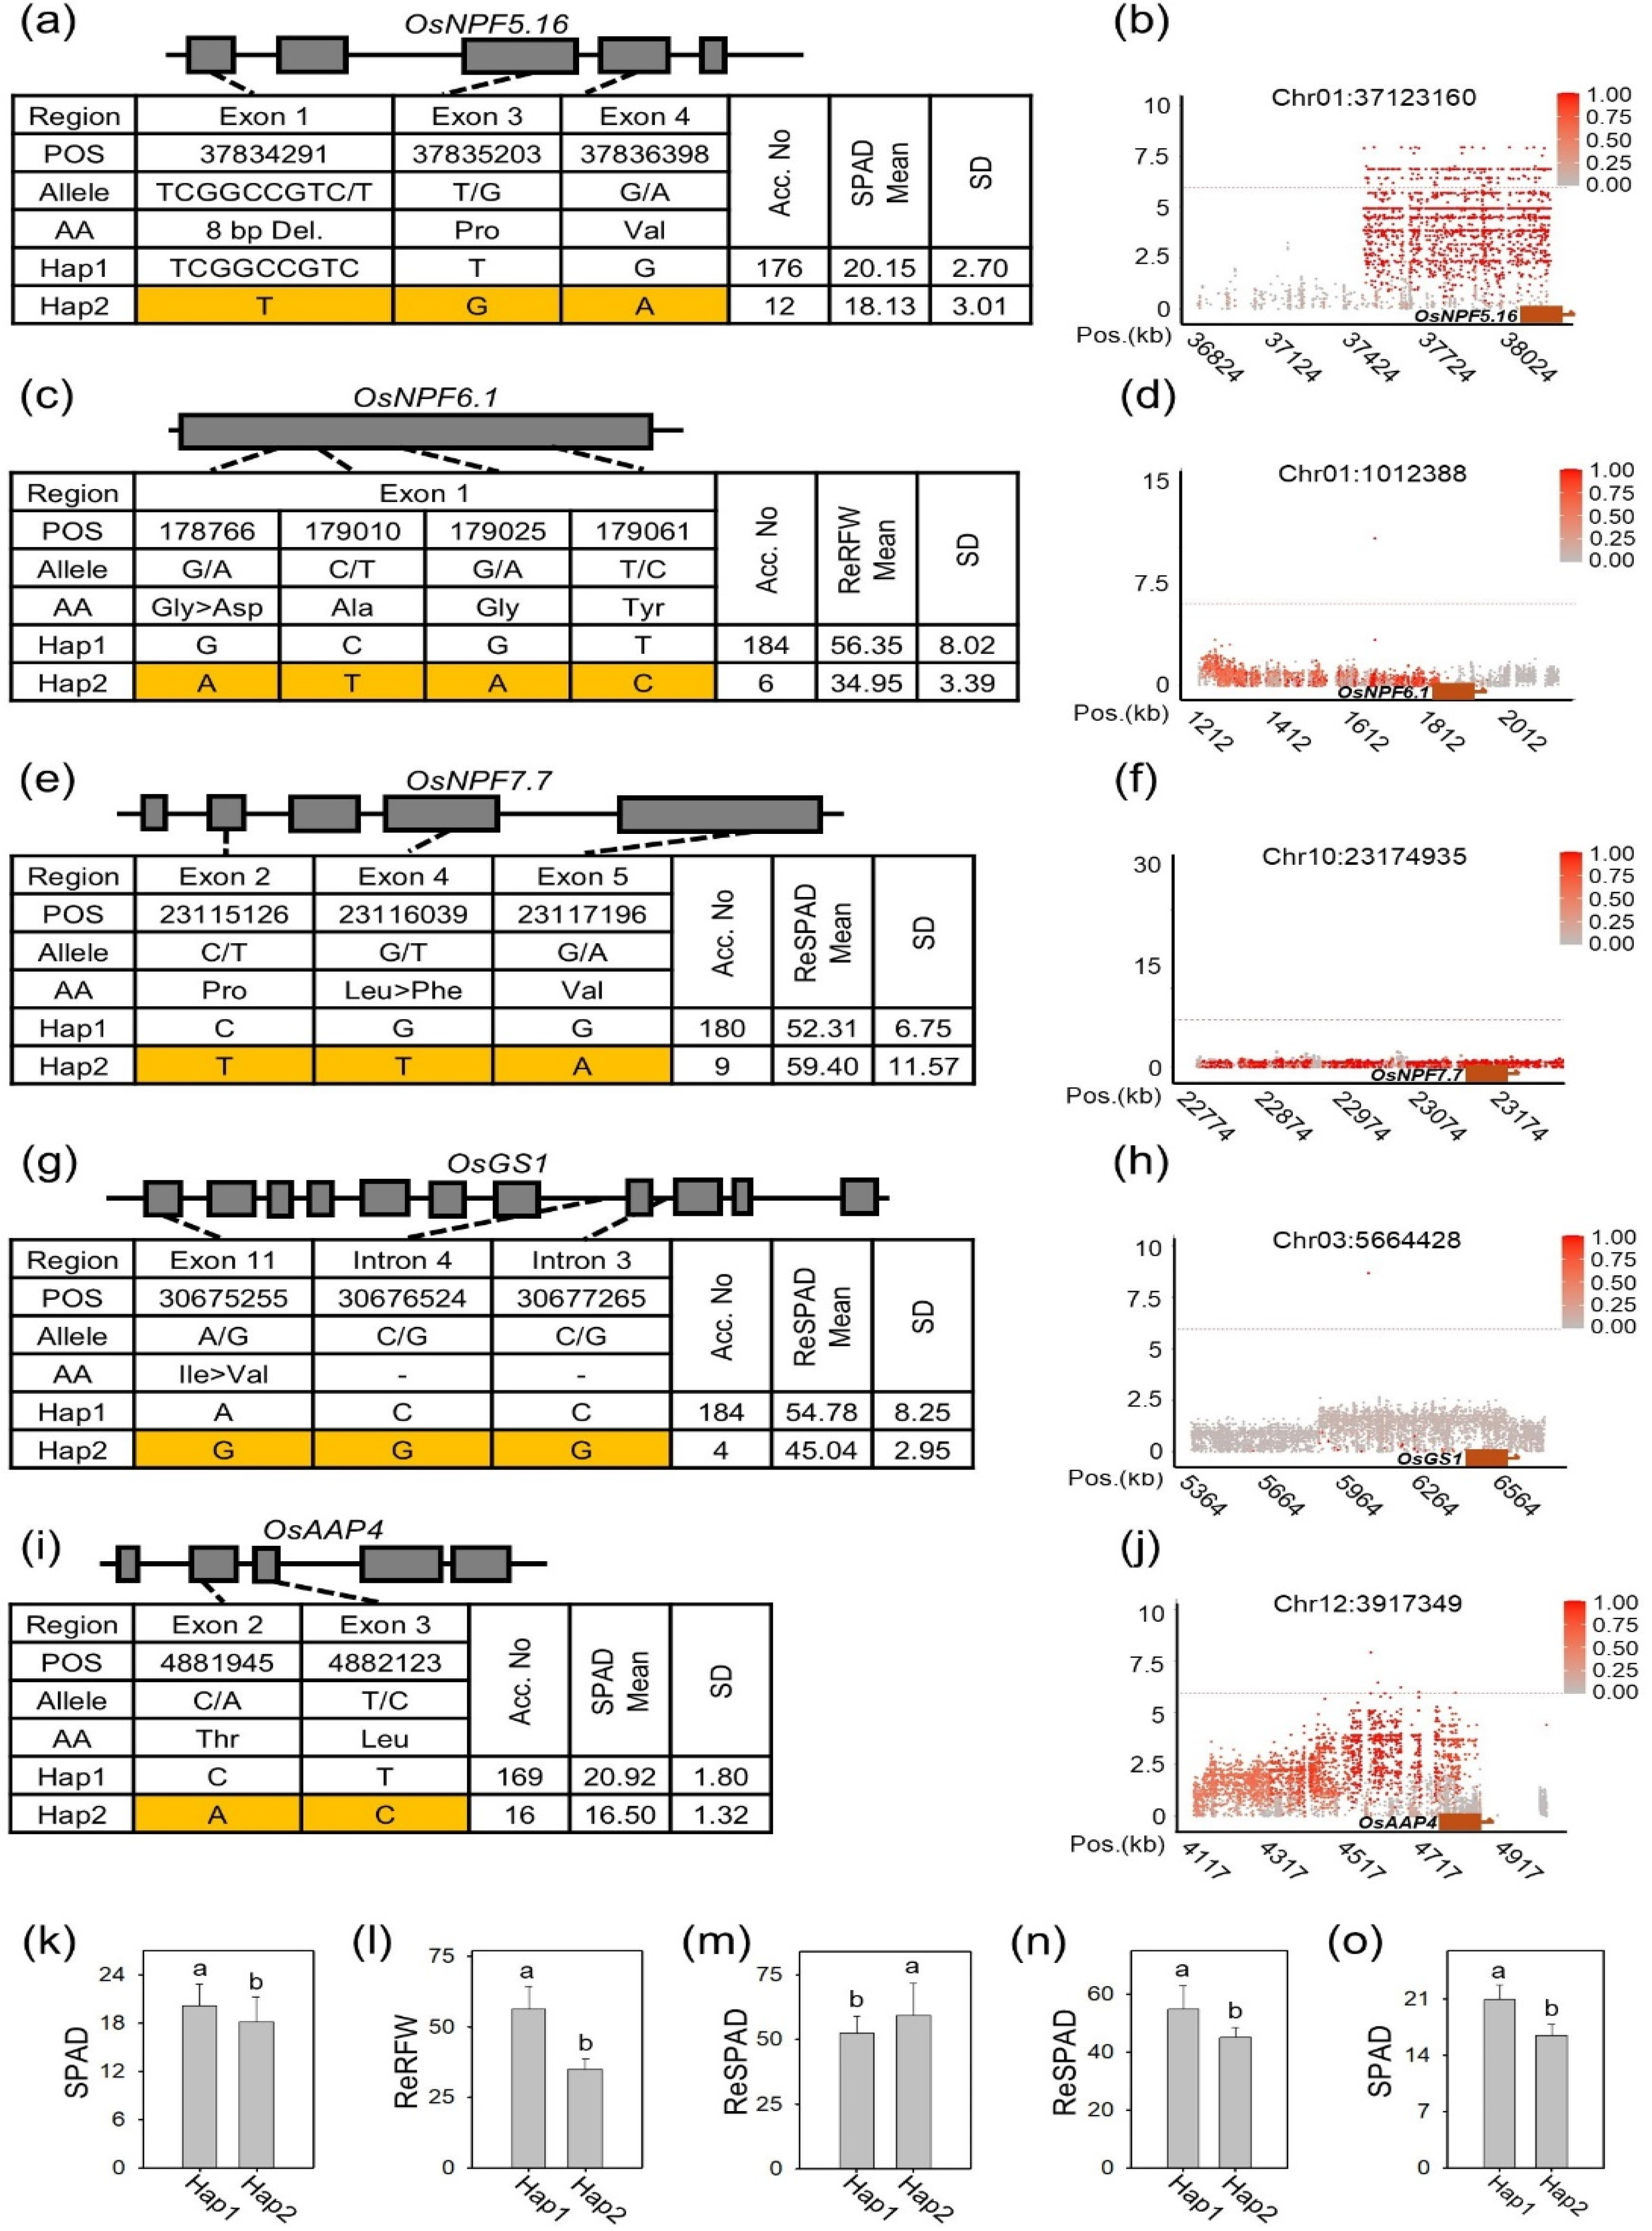
Haplotype analysis was conducted on all twelve known genes identified by GWAS. The haplotypes of the candidate genes were classified based on differences in SNPs and Indels located in the genomic DNA sequence of each gene. The haplotypes and their positions on the LD plot are shown for five known genes associated with the most significant lead SNPs (
Fig. 5).
OsNPF5.16 (Os01g0872500) was located approximately 700 kb away from the lead SNP (Chr01:37123160).
OsNPF5.16, which consists of four exons and contains two SNPs and an 8 bp deletion (CGGCCGTC), is divided into two haplotypes. Among these, Hap 2, which carries this deletion, showed lower SPAD values than the other haplotype. This 8 bp deletion is likely associated with a loss-of-function allele (
Figs. 5a,
5k).
The second known gene,
OsNPF6.1 (Os01g0103100), identified on chromosome 1 for ReSFW and ReRFW, is located about 830 kb away from the lead SNP (Chr01:1012388). The genomic DNA sequence region of
OsNPF6.1 includes four SNPs in the single exon. One of these SNPs (Chr01:178766 G/A) caused an amino acid change. Hap 2, which carries the A allele of this SNP, exhibited a lower ReRFW value than the other haplotypes (
Figs. 5c,
5l).
The third known gene,
OsNPF7.7 (Os10g0579600), which is linked to the most significant lead SNP (
p-value=29.38), is located 57 kb away from the lead SNP (Chr10:23174935).
OsNPF7.7 harbors three SNPs, with one non-synonymous SNP (Chr10:23116039 G/T) on exon 4. Hap 2 showed an increased value for ReSPAD and nine genotypes were classified into Hap 2 (
Figs. 5e,
5m).
The fourth known gene,
OsGS1;2 (Os03g0223400), is located 790 kb away from the lead SNP (Chr03:5664428).
OsGS1;2 contains one non-synonymous SNP in exon 11. Hap 2 showed a lower ReSPAD value compared to the other haplotype (
Figs. 5g,
5n).
The fifth known gene,
OsAAP4 (Os12g0194900), identified on chromosome 12 for SPAD, is located 963 kb away from the lead SNP (Chr12:3917349).
OsAAP4, carrying two SNPs, is divided into two haplotypes. Among them, Hap 2 exhibited a lower SPAD value then Hap 1, and 16 accessions were classified into Hap 2 (
Figs. 5i,
5o). The results of haplotype analysis for the other seven known NUE-related genes are provided in Supplemental
Figs. 1 and
2.
Haplotype analysis of the six unknown genes identified by GWAS was performed and statistical significance was observed for all of them. The haplotypes and positions on the LD plot are shown for three unknown genes associated with the most significant lead SNPs (
Fig. 6).
The first candidate gene
ART2 (Os04g0165200), encoding a transcription factor, is located 465 kb away from the lead SNP (Chr04:3959459). Five SNPs were identified in a single exon of this gene, including two deletions, two synonymous SNPs, and one non-synonymous SNP. The combination of these five SNPs was classified into six haplotypes. Interestingly, Hap 4, which carried a 12 bp insertion (CGGCGGCCGCGG), showed the highest SL value among all haplotypes. Only six accessions belonged to Hap 4 (
Figs. 6a,
6g).
The second candidate gene,
OsAlaAT1 (Os10g0390500), encoding alanine aminotransferase 1, is located 415 kb away from the lead SNP (Chr10:12552737). This gene contains two SNPs and is divided into three haplotypes. Hap 2 of this gene exhibited higher SL than the other two haplotypes (
Figs. 6c,
6h).
The third candidate gene
OsWRKY31 (Os06g0504900), well-known as a transcription factor, is located approximately 180 kb away from the lead SNP (Chr06:18103083).
OsWRKY31 has six SNPs in the coding sequence, all of which cause amino acid changes. This gene was classified into three haplotypes. Notably, Hap 3, which carried all six non-synonymous SNPs, showed the highest ReRFW value (
Figs. 6e,
6i). The results of haplotype analysis for the other three unknown candidate genes are provided in Supplemental
Fig. 3.
Discussion
This study highlights the identification of candidate genes associated with NDT in the 190 NK rice genotypes through GWAS. By analyzing six agronomic traits under NN and LN conditions, we identified 18 significant genes, including 12 known genes related to NUE and six novel candidates. These findings underscore the potential of 190 NK rice genotypes as valuable genetic resources for improving NUE and NDT. The results not only provide new insights into the genetic basis of NDT but also offer promising targets for future breeding programs aimed at enhancing rice productivity in nitrogen-limited environments.
Shoot-related traits are key indicators of NUE in rice
Shoot-related traits, such as SL and SFW, are critical phenotypes in NUE studies (
Sharma et al. 2021), as they are directly linked to biomass production and overall plant growth—both of which are primary indicators of NUE. Under LN conditions, two known genes were significantly associated with shoot-related traits:
OsNRT1.3 for SL, and
OsNLP3 and
OsNRT1.3 for SFW (
Fig. 3). These genes are known to regulate nitrogen uptake and signaling pathways (
Hu et al. 2015;
Hu et al. 2019). Similarly, under ReLN conditions, four genes were significantly associated with shoot-related traits:
OsAAT1 and
OsNPF4.1 for ReSL, and
OsNPF6.1 and
OsAMT1.2 for ReSFW (
Fig. 4), emphasizing the importance of shoot traits in nitrogen-limited environments. Notably, SL and SFW showed a strong positive correlation in both LN and ReLN traits (
Table 1). This suggests that both SL and SFW are important target traits determining a plant's tolerance to nitrogen deficiency. Therefore, more focus should be placed on these shoot growth-related traits to identify genes for improving NUE.
Nitrogen deficiency significantly affects rice growth and development, resulting in changes to both morphological and physiological traits. A notable reduction in SPAD value, an indicator of chlorophyll content, was observed under LN conditions, reflecting decreased photosynthetic capacity. This decline in SPAD value was accompanied by an increase in RL, a common adaptive response to nitrogen deficiency (
Liu et al. 2023). Correlation analysis results further supported this trend, revealing a negative correlation between RL and SPAD (
Table 1). Likewise, ReSPAD also exhibited a negative correlation with RL (
Table 1), suggesting that under severe nitrogen deficiency, rice plants tend to prioritize root elongation over chlorophyll biosynthesis to enhance nitrogen uptake. Nitrogen deficiency is known to promote primary root growth by promoting cell elongation and division, thereby increasing root surface area for nitrogen absorption (
Zhang et al. 2012). These findings align with previous reports describing chlorotic leaf symptoms and elongated, thinner roots in nitrogen-deficient rice plants (
Hsieh et al. 2018). This adaptive strategy underscores a trade-off between enhanced root development and reduced photosynthetic capacity, enabling rice plants to cope with nitrogen stress.
The GWAS analysis for NDT identified a total of 18 candidate genes, including 12 previously known genes (
Table 2) associated with NUE and six novel candidates (
Table 3). Notably, more genes were identified in ReLN traits (seven known genes) than in LN traits (five known genes), emphasizing the advantage of using relative traits in identifying key genetic components of NUE. The ReLN value, calculated as (LN/NN) x 100, enabled for the assessment of how well the 190 NK rice genotypes perform under LN conditions compared to NN conditions. Furthermore, the repeated identification of genes across different ReLN traits (
Fig. 4), such as
OsNPF4.1,
OsNPF6.1, and
OsAMT1.2, underscores the effectiveness of relative-valued traits in capturing consistent genetic signals across multiple phenotypes. This study suggests that using relative values in GWAS analysis— by comparing phenotypic data obtained under nitrogen-deficient and nitrogen-sufficient conditions—provides a more precise assessment of genetic variations related to NUE, facilitating the identification of key genetic components.
In this study, we identified six candidate genes associated with NDT through GWAS analysis (
Table 3), highlighting their potential roles in NDT. Notably, three genes—
ART2,
OsAlaAT1, and
OsWRKY31—showed strong significance based on haplotype analysis. These genes have previously implicated in responses to various stresses and resistance mechanisms, leading us to propose their potential involvement in nitrogen deficiency tolerance as well.
ART2, a Zn finger transcription factor, is primarily expressed in roots and plays a significant role in regulating gene networks related to aluminum resistance (
Che et al. 2018). Knockout of
ART2 results in increased sensitivity to aluminum toxicity, suggesting its broader role in stress tolerance. The second gene
OsAlaAT1, which regulates glutamate levels under nitrogen-limited conditions, plays a key role in nitrogen metabolism. Its overexpression leads to increased rice yield (
Yang et al. 2015), suggesting its potential to optimize nitrogen use efficiency. The thirds gene
OsWRKY31, a transcription factor modulating auxin responses, plays a crucial role in plant growth and development (
Zhang et al. 2008). Overexpression of
OsWRKY31 reduces sensitivity to high concentrations of auxin, implying that it may alter auxin transport and signaling pathways. Auxin is closely linked to nitrogen metabolism, particularly in nitrogen-deficient environments, where it regulates root development and plays a central role in nitrogen absorption and utilization (Hu et al. 2021). Therefore, the influence of
OsWRKY31 on auxin signaling pathways could regulate NUE. These three candidates would be promising targets for functional analysis and genetic engineering approaches to enhance nitrogen deficiency tolerance in rice and other crops. Future studies should focus on validating their specific roles through gene knockout, overexpression experiments, and field trials to assess their impact on nitrogen use efficiency and overall plant productivity.
Acknowledgments
This work was supported by the Cooperative Research Program for Agriculture Science and Technology Development Project (RS-2022-RD010405) of the Rural Development Administration and the National Research Foundation (NRF) of Republic of Korea (No. RS-2023-00253851).
Fig. 1Effect of nitrogen deficiency on the growth of 190 North Korean rice seedlings. 31-day-old rice seedlings hydroponically grown in NN (a) and LN (b) conditions, respectively. Phenotypic comparisons were made between the NN and LN conditions. SPAD value (c); SL, shoot length (d); RL, root length (e); SFW, shoot fresh weight (f); RFW, root fresh weight (g); TN, tiller number (h). Duncan's test found significant differences in alphabetic letters (p<0.05). NN, normal nitrogen; low nitrogen, LN.

Fig. 2Phenotypic distributions of 190 NK rice genotypes. The graphs depict the frequency of 12 traits, including SPAD (a), shoot length (SL) (b), root length (RL) (c), shoot fresh weight (SFW) (d), root fresh weight (RFW) (e), tiller number (TN) (f), relative SPAD (ReSPAD) (g), relative shoot length (ReSL) (h), relative root length (ReRL) (i), relative shoot fresh weight (ReSFW) (j), relative root fresh weight (ReRFW) (k), and relative tiller number (ReTN) (l).

Fig. 3Manhattan and Q-Q plots for GWAS of five LN traits. Manhattan and Q-Q plots for SPAD (a, f), shoot length (SL) (b, g), root length (RL) (c, h), shoot fresh weight (SFW) (d, i), and root fresh weight (RFW) (e, j) using the FarmCPU model on rMVP. The horizontal red line represents the threshold (-log10 (P)=5.934) for identifying significant SNPs associated with the low-N response. Candidate genes, including both known and novel ones, are highlighted in red and black above the lead SNPs. In the Q-Q plots, the horizontal axis shows the expected –log10 (P), while the vertical axis indicates the observed -log10 (P) for each SNP.
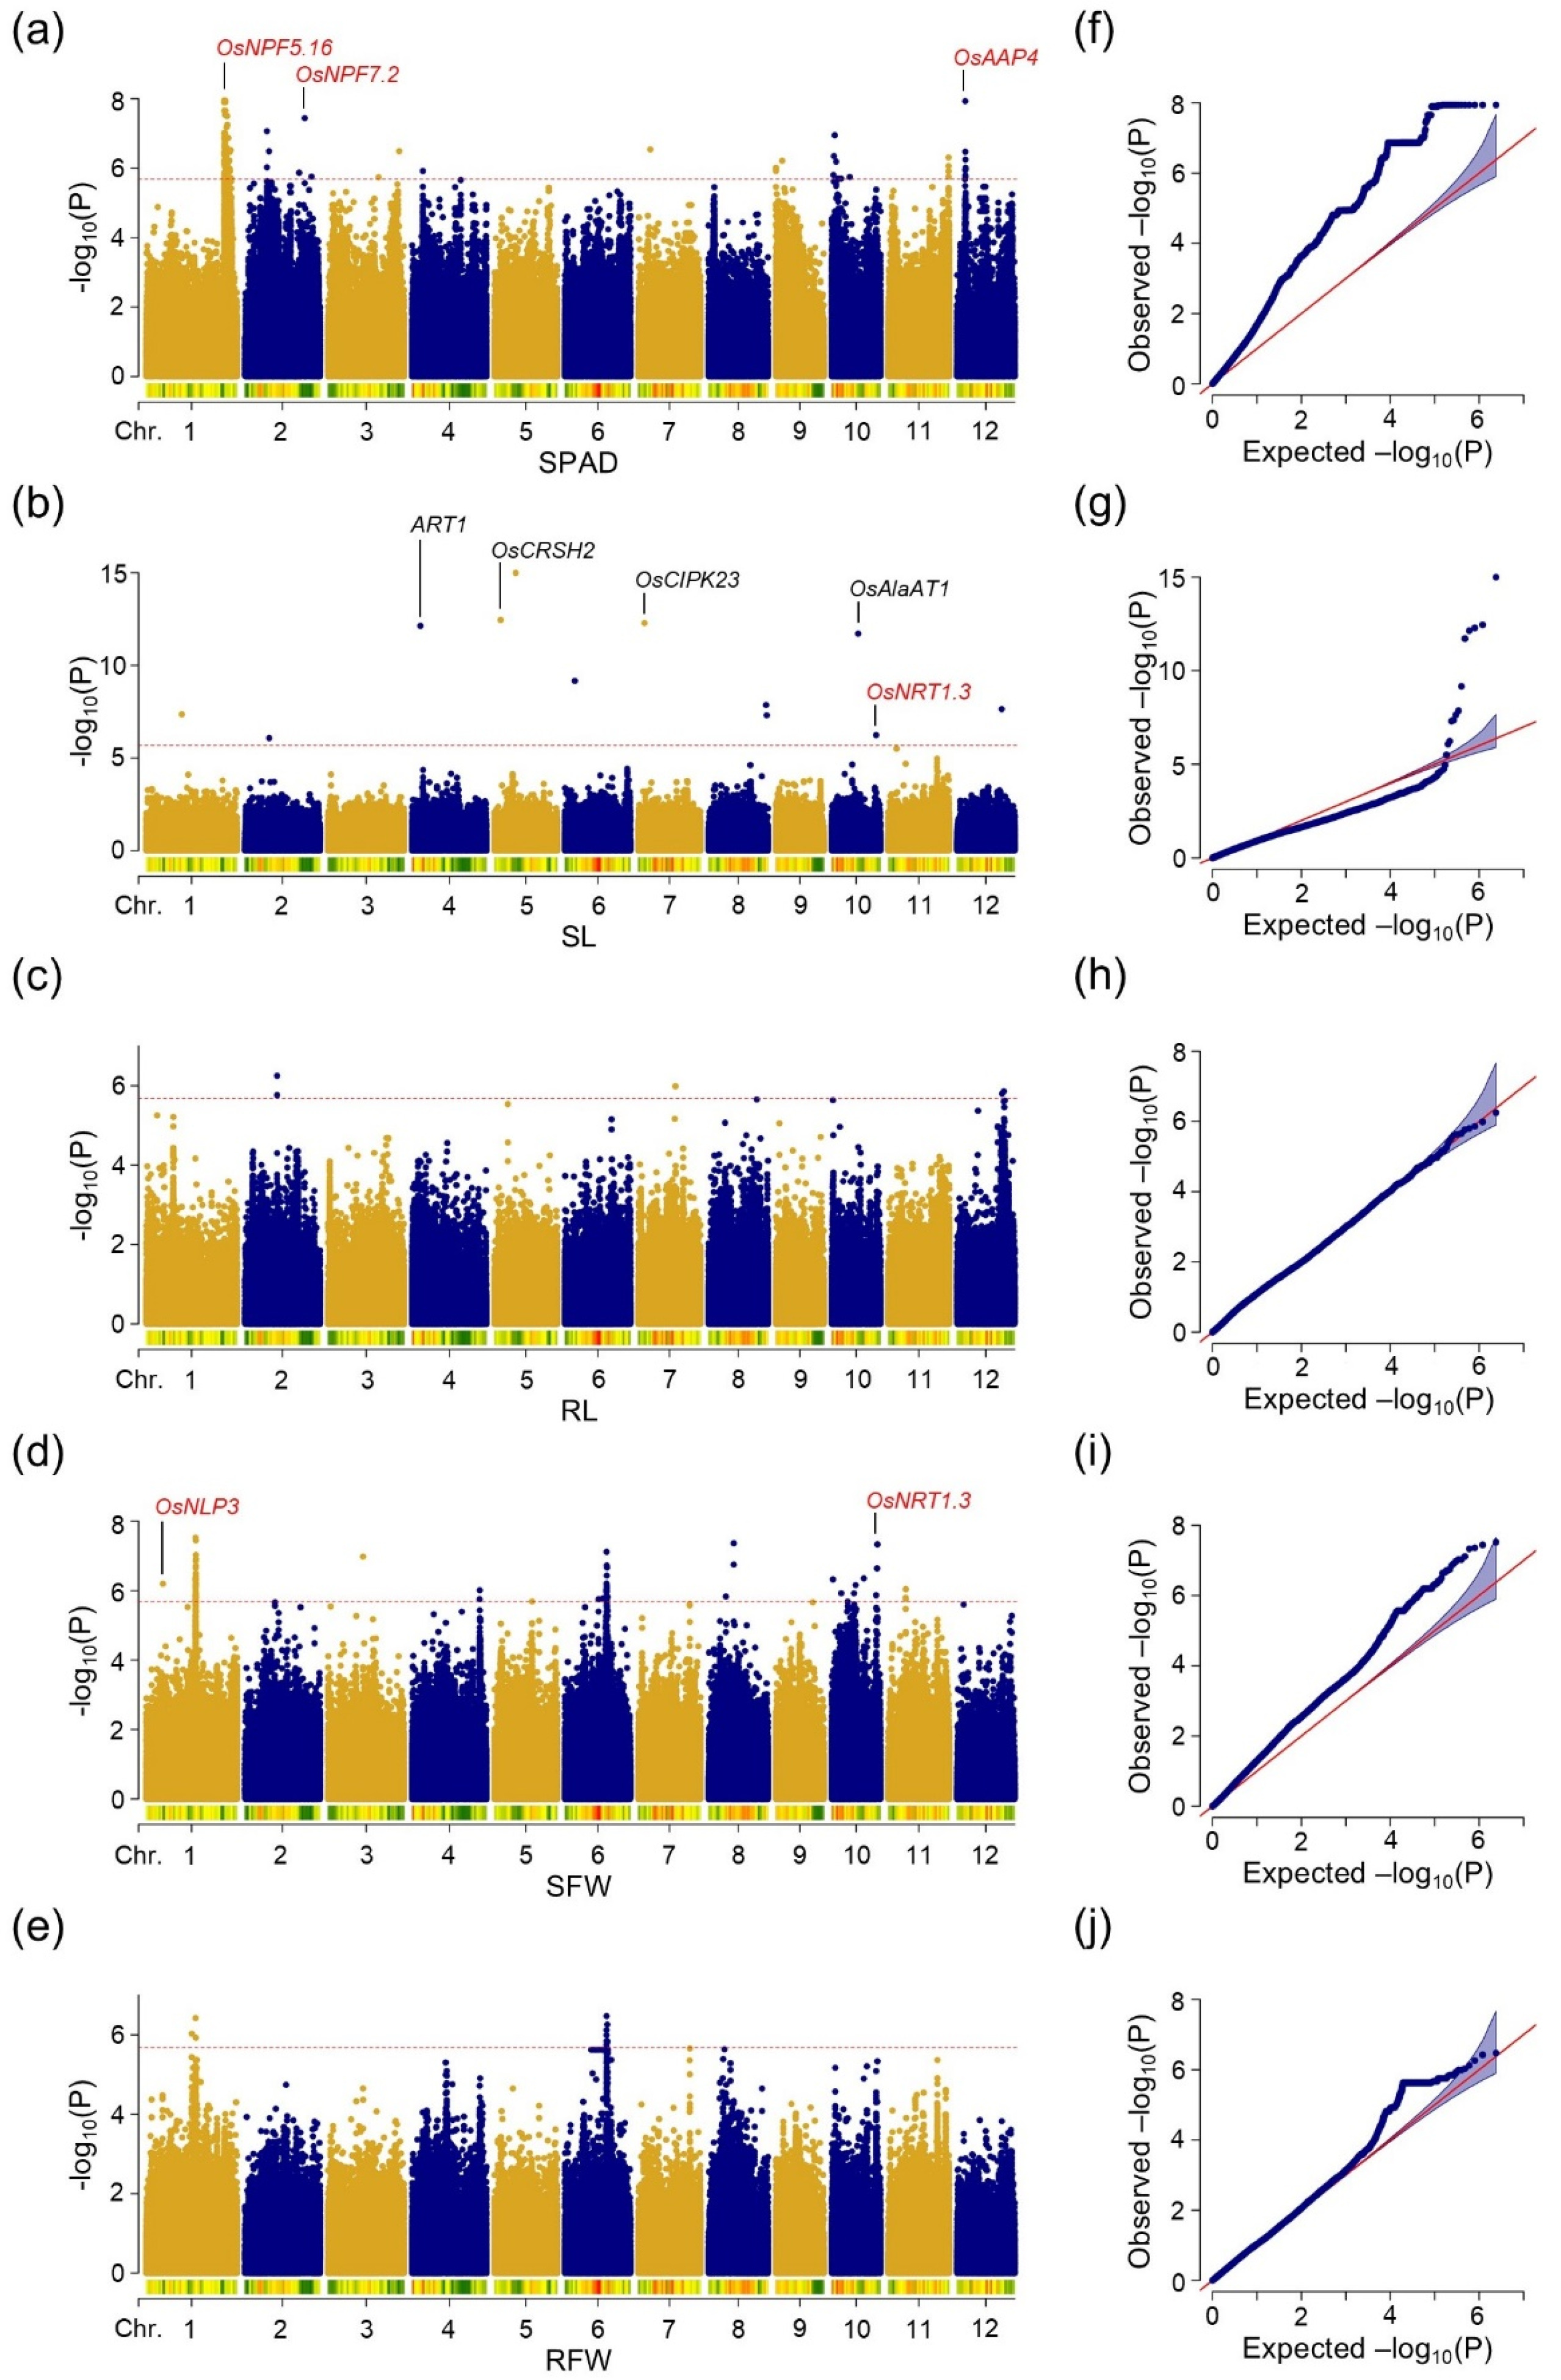
Fig. 4Manhattan and Q-Q plots for GWAS of five ReLN traits. Manhattan and Q-Q plots for relative SPAD (ReSPAD) (a, f), relative shoot length (ReSL) (b, g), relative root length (ReRL) (c, h), relative shoot fresh weight (ReSFW) (d, i), and relative root fresh weight (ReRFW) (e, j) using the FarmCPU model on rMVP. The horizontal red line represents the threshold (-log10 (P)=5.934) for identifying significant SNPs associated with the low-N response. Candidate genes, including both known and novel ones, are highlighted in red and black above the lead SNPs. In the Q-Q plots, the horizontal axis shows the expected -log10 (P), while the vertical axis indicates the observed -log10 (P) for each SNP.

Fig. 5Haplotype analysis of five known candidate genes identified by GWAS. Haplotype structures of OsNPF5.17 (a), OsNPF6.1 (c), OsNPF7.7 (e), OsGS1;2 (g), and OsAAP4 (i). LD plots showing the association loci for OsNPF5.17 (b), OsNPF6.1 (d), OsNPF7.7 (f), OsGS1;2 (h), and OsAAP4 (j). Phenotypic variations among haplotypes for OsNPF5.17 (k), OsNPF6.1 (l), OsNPF7.7 (m), OsGS1 (n), and OsAAP4 (o).

Fig. 6Haplotype analysis of three unknown candidate genes identified by GWAS. Haplotype structures of ART2 (a), OsAlaAT1 (c), and OsWRKY31 (e). LD plots showing the association loci for ART2 (b), OsAlaAT1 (d), and OsWRKY31 (f). Phenotypic variations among haplotypes for ART2 (g), OsAlaAT1 (h), and OsWRKY31 (i).
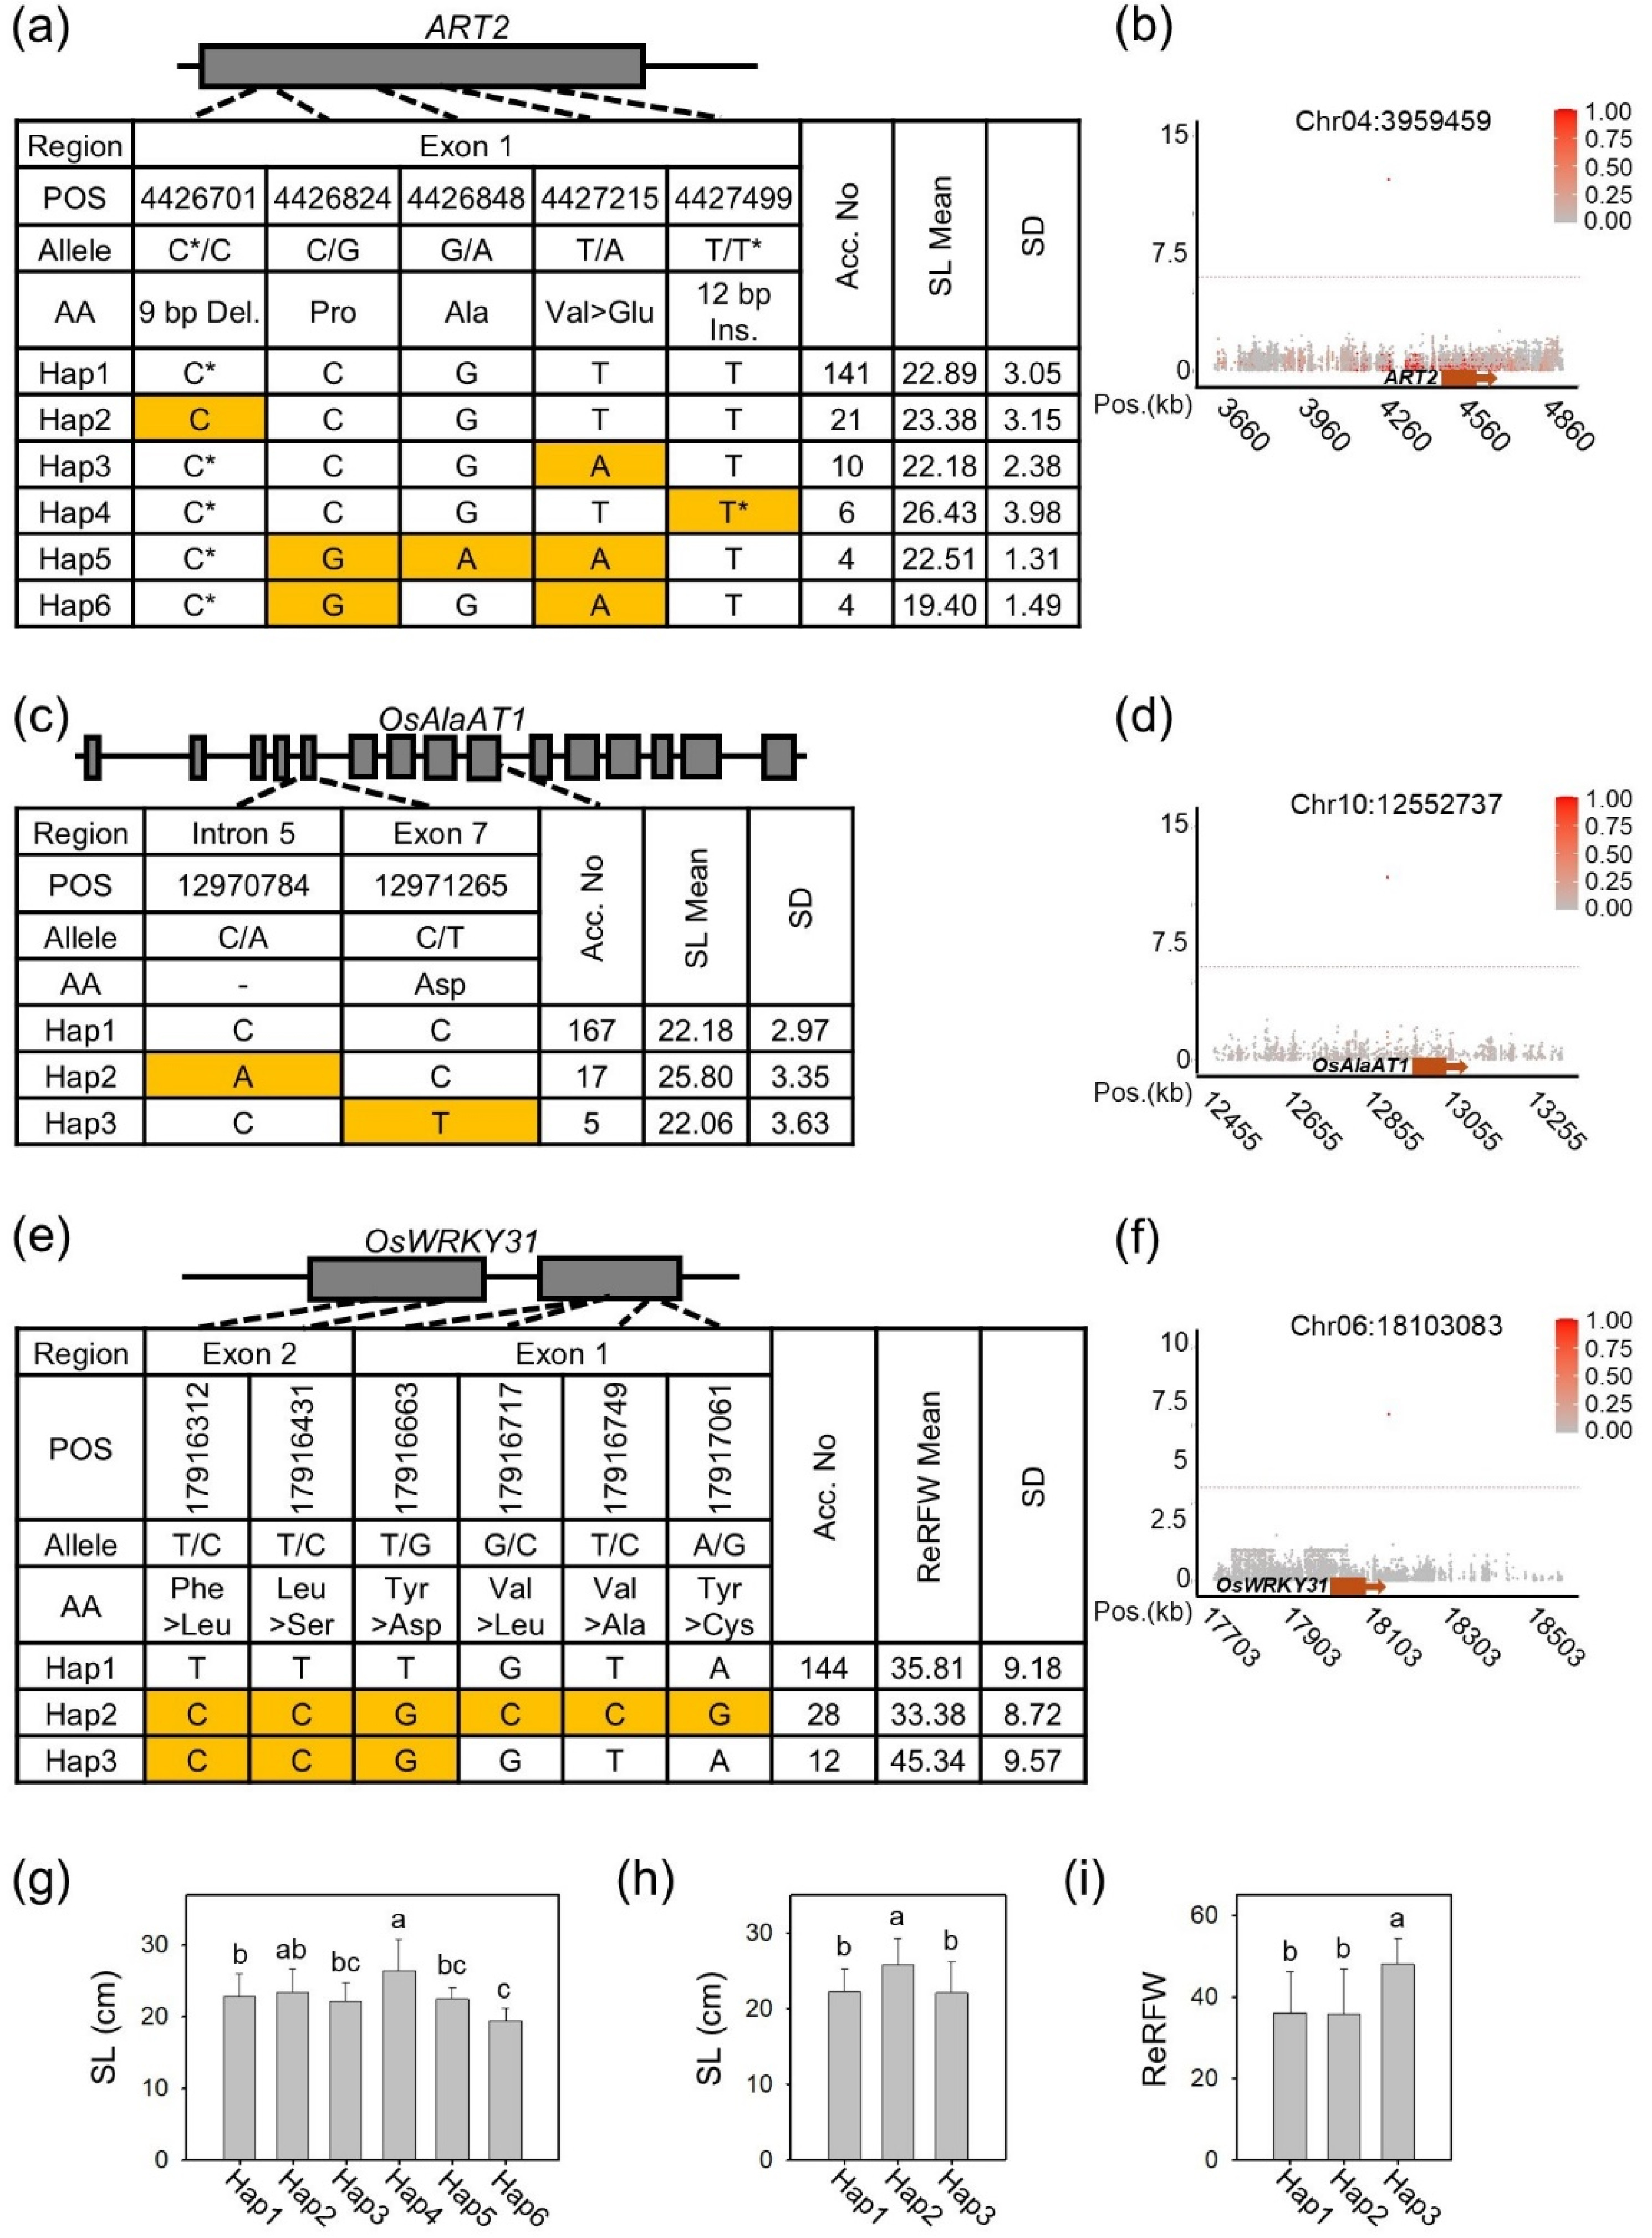
Table 1Correlations among six traits used in GWAS.
Table 1
|
SPAD |
SL |
RL |
SFW |
RFW |
|
SPAD |
1 |
|
|
|
|
|
SL |
0.1987 |
1 |
|
|
|
|
RL |
-0.1648*
|
0.1351*
|
1 |
|
|
|
SFW |
0.2303 |
0.5892***
|
0.0806 |
1 |
|
|
RFW |
0.1934 |
0.4034 |
0.1348*
|
0.7607***
|
1 |
|
|
ReSPAD |
ReSL |
ReRL |
ReSFW |
ReRFW |
|
|
ReSPAD |
1 |
|
|
|
|
|
ReSL |
0.4951***
|
1 |
|
|
|
|
ReRL |
-0.0230 |
0.0622 |
1 |
|
|
|
ReSFW |
0.4195 |
0.7887***
|
0.1134 |
1 |
|
|
ReRFW |
0.3873 |
0.7359 |
0.1425 |
0.9241***
|
1 |
Table 2List of twelve known candidate genes linked to lead SNPs identified by GWAS.
Table 2
|
Lead SNP |
-Log10 (P) |
Trait |
Candidate gene |
Gene ID |
Description |
Ref. |
|
Chr10:23174935 |
29.38 |
ReSPAD |
OsNPF7.7
|
Os10g0579600 |
Nitrate transporter |
(Huang et al. 2018) |
|
Chr03:19112695 |
10.78 |
ReRFW
|
OsLBD37
|
Os03g0790600 |
Transcription factor |
(Zhu et al. 2022) |
|
Chr01:1012388 |
10.66
6.52 |
ReRFW
ReSFW |
OsNPF6.1
|
Os01g0103100 |
Nitrate transporter |
(Tang et al, 2019) |
|
Chr03:5664428 |
8.66 |
ReSPAD |
OsGS1;2
|
Os03g0223400 |
Glutamine synthetase |
(Tabuchi et al. 2005) |
|
Chr01:37123160 |
7.94 |
SPAD |
OsNPF5.16
|
Os01g0872500 |
Nitrate transporter |
(Wang et al. 2022) |
|
Chr12:3917349 |
7.93 |
SPAD |
OsAAP4
|
Os12g0194900 |
Amino acid permease |
(Fang et al. 2021) |
|
Chr02:24491851 |
7.47
6.76 |
ReSFW
ReRFW |
OsAMT1.2
|
Os02g0620600 |
Ammonium transporter |
(Sonoda et al. 2003) |
|
Chr02:28607552 |
7.44 |
SPAD |
OsNPF7.2
|
Os02g0699000 |
Nitrate transporter |
(Hu et al. 2016) |
|
Chr10:21719487 |
7.33
6.24 |
SFW
SL |
OsNRT1.3
|
Os10g0554200 |
Nitrate transporter |
(Hu et al. 2015) |
|
Chr11:7816560 |
7.84
7.17 |
ReSL
ReRL |
OsNPF4.1
|
Os11g0235200 |
Nitrate transporter |
(Li et al. 2009) |
|
Chr02:33539436 |
6.55 |
ReSL
|
OsAAT1
|
Os02g0797500 |
Aminotransferase |
(Zhou et al. 2009) |
|
Chr01:7938122 |
6.19 |
SFW
|
OsNLP3
|
Os01g0236700 |
Transcription factor |
(Hu et al. 2019) |
Table 3List of six unknown candidate genes linked to lead SNPs identified by GWAS.
Table 3
|
Lead SNP |
-Log10 (P) |
Trait |
Candidate gene |
Gene ID |
Description |
Ref. |
|
Chr10:3108237 |
13.95
10.60 |
ReSFW
ReRFW |
OsWAK104
|
Os10g0151500 |
Kinase |
(Zhang et al. 2005) |
|
Chr05:3016061 |
12.45 |
SL |
OsCRSH2
|
Os05g0161500 |
(p)ppGpp synthetase |
(Tozawa et al. 2007) |
|
Chr07:2925373 |
12.28 |
SL |
OsCIPK23
|
Os07g0150700 |
Kinase |
(Yang et al. 2008) |
|
Chr04:3959459 |
12.13 |
SL |
ART2
|
Os04g0165200 |
Transcription factor |
(Che et al. 2018) |
|
Chr10:12552737 |
11.71 |
SL |
OsAlaAT1
|
Os10g0390500 |
Aminotransferase |
(Yang et al. 2015) |
|
Chr06:18103083 |
10.68 |
ReRFW |
OsWRKY31
|
Os06g0504900 |
Transcription factor |
(Zhang et al. 2008) |
References
- 3K RGP2014. The 3,000 rice genomes project. Gigascience. 3: 7
- Che J, Tsutsui T, Yokosho K, Yamaji N, Ma JF. 2018. Functional characterization of an aluminum (Al)-inducible transcription factor, ART 2, revealed a different pathway for Al tolerance in rice. New Phytol. 220: 209-218.
- Famoso AN, Zhao K, Clark RT, Tung CW, Wright MH, Bustamante C, et al. 2011. Genetic architecture of aluminum tolerance in rice (Oryza sativa) determined through genome-wide association analysis and QTL mapping. PLoS Genet. 7: e1002221
- Fang Z, Wu B, Ji Y. 2021. The amino acid transporter OsAAP4 contributes to rice tillering and grain yield by regulating neutral amino acid allocation through two splicing variants. Rice. 14: 1-17.
- Fukushima A, Kusano M. 2014. A network perspective on nitrogen metabolism from model to crop plants using integrated 'omics' approaches. J Exp Bot. 65: 5619-5630.
- Gao Z, Wang Y, Chen G, Zhang A, Yang S, Shang L, et al. 2019. The indica nitrate reductase gene OsNR2 allele enhances rice yield potential and nitrogen use efficiency. Nat. Commun. 10: 5207
- Hakeem KR, Ahmad A, Iqbal M, Gucel S, Ozturk M. 2011. Nitrogen-efficient rice cultivars can reduce nitrate pollution. ESPR. 18: 1184-1193.
- Hsieh PH, Kan CC, Wu HY, Yang HC, Hsieh MH. 2018. Early molecular events associated with nitrogen deficiency in rice seedling roots. Sci. Rep. 8: 12207
- Hu B, Jiang Z, Wang W, Qiu Y, Zhang Z, Liu Y, et al. 2019. Nitrate-NRT1. 1B-SPX4 cascade integrates nitrogen and phosphorus signalling networks in plants. Nat. Plants. 5: 401-413.
- Hu B, Wang W, Ou S, Tang J, Li H, Che R, et al. 2015. Variation in NRT1. 1B contributes to nitrate-use divergence between rice subspecies. Nat. Genet. 47: 834-838.
- Hu R, Qiu D, Chen Y, Miller AJ, Fan X, Pan X, et al. 2016. Knock-down of a tonoplast localized low-affinity nitrate transporter OsNPF7. 2 affects rice growth under high nitrate supply. Front. Plant Sci. 7: 1529
- Huang W, Bai G, Wang J, Zhu W, Zeng Q, Lu K, et al. 2018. Two splicing variants of OsNPF7. 7 regulate shoot branching and nitrogen utilization efficiency in rice. Front. Plant Sci. 9: 300
- Huang X, Zhao Y, Wei X, Li C, Wang A, Zhao Q, et al. 2012. Genome-wide association study of flowering time and grain yield traits in a worldwide collection of rice germplasm. Nat. Genet. 44: 32-39.
- Jadamba C, Vea RL, Ryu JH, Paek NC, Jang S, Chin JH, et al. 2022. GWAS analysis to elucidate genetic composition underlying a photoperiod-insensitive rice population, North Korea. Front. Genet. 13: 1036747
- Lee S. 2021. Recent advances on nitrogen use efficiency in rice. Agronomy. 11: 753
- Li H, Peng Z, Yang X, Wang W, Fu J, Wang J, et al. 2013. Genome-wide association study dissects the genetic architecture of oil biosynthesis in maize kernels. Nat. Genet. 45: 43-50.
- Li J-Y, Wang J, Zeigler RS. 2014. The 3,000 rice genomes project: New opportunities and challenges for future rice research. Gigascience. 3: 8
- Li S, Qian Q, Fu Z, Zeng D, Meng X, Kyozuka J, et al. 2009. Short panicle1 encodes a putative PTR family transporter and determines rice panicle size. Plant J. 58: 592-605.
- Lipka AE, Tian F, Wang Q, Peiffer J, Li M, Bradbury PJ, et al. 2012. GAPIT: Genome association and prediction integrated tool. Bioinformatics. 28: 2397-2399.
- Liu L, Cui K, Qi X, Wu Y, Huang J, Peng S. 2023. Varietal responses of root characteristics to low nitrogen application explain the differing nitrogen uptake and grain yield in two rice varieties. Front. Plant Sci. 14: 1244281
- Liu X, Huang M, Fan B, Buckler ES, Zhang Z. 2016. Iterative usage of fixed and random effect models for powerful and efficient genome-wide association studies. PLoS Genet. 12: e1005767
- Mandal VK, Sharma N, Raghuram N. 2018. Molecular targets for improvement of crop nitrogen use efficiency: Current and emerging options. Engineering nitrogen utilization in crop plants. pp. 77-93. Springer International Publishing..
- Sharma N, Sinha VB, Prem Kumar NA, Subrahmanyam D, Neeraja C, Kuchi S, et al. 2021. Nitrogen use efficiency phenotype and associated genes: roles of germination, flowering, root/shoot length and biomass. Front. Plant Sci. 11: 587464
- Shin D, Lee S, Kim TH, Lee JH, Park J, Lee J, et al. 2020. Natural variations at the Stay-Green gene promoter control lifespan and yield in rice cultivars. Nat. Commun. 11: 2819
- Sonoda Y, Ikeda A, Saiki S, Yamaya T, Yamaguchi J. Wirén Nv2003. Distinct expression and function of three ammonium transporter genes (OsAMT1; 1-1; 3) in rice. Plant Cell Physiol. 44: 726-734.
- Tabuchi M, Sugiyama K, Ishiyama K, Inoue E, Sato T, Takahashi H, et al. 2005. Severe reduction in growth rate and grain filling of rice mutants lacking OsGS1; 1, a cytosolic glutamine synthetase1; 1. Plant J. 42: 641-651.
- Tamura W, Kojima S, Toyokawa A, Watanabe H, Tabuchi-Kobayashi M, Hayakawa T, et al. 2011. Disruption of a novel NADH-glutamate synthase2 gene caused marked reduction in spikelet number of rice. Front. Plant Sci. 2: 57
- Tang W, Ye J, Yao X, Zhao P, Xuan W, Tian Y, et al. 2019. Genome-wide associated study identifies NAC42-activated nitrate transporter conferring high nitrogen use efficiency in rice. Nat. Commun. 10: 5279
- Tozawa Y, Nozawa A, Kanno T, Narisawa T, Masuda S, Kasai K, et al. 2007. Calcium-activated (p) ppGpp synthetase in chloroplasts of land plants. J Biol Chem. 282: 35536-35545.
- Wang J, Wan R, Nie H, Xue S, Fang Z. 2022. OsNPF5. 16, a nitrate transporter gene with natural variation, is essential for rice growth and yield. Crop J. 10: 397-406.
- Yang J, Kim SR, Lee SK, Choi H, Jeon JS, An G. 2015. Alanine aminotransferase 1 (OsAlaAT1) plays an essential role in the regulation of starch storage in rice endosperm. Plant Sci. 240: 79-89.
- Yang W, Kong Z, Omo-Ikerodah E, Xu W, Li Q, Xue Y. 2008. Calcineurin B-like interacting protein kinase OsCIPK23 functions in pollination and drought stress responses in rice (Oryza sativa L.). J Genet Genomics. 35: 531-S532.
- Yoshida S, Forno DA, Cock JH. 1971. Laboratory manual for physiological studies of rice. The International Rice Research Institute..
- Yu J, Xuan W, Tian Y, Fan L, Sun J, Tang W, et al. 2021. Enhanced OsNLP4-OsNiR cascade confers nitrogen use efficiency by promoting tiller number in rice. Plant Biotechnol. J. 19: 167-176.
- Zhang J, Peng Y, Guo Z. 2008. Constitutive expression of pathogen-inducible OsWRKY31 enhances disease resistance and affects root growth and auxin response in transgenic rice plants. Cell Res. 18: 508-521.
- Zhang J, Xu L, Wang F, Deng M, Yi K. 2012. Modulating the root elongation by phosphate/nitrogen starvation in an OsGLU3 dependant way in rice. Plant Signal Behav. 7: 1144-1145.
- Zhang S, Chen C, Li L, Meng L, Singh J, Jiang N, et al. 2005. Evolutionary expansion, gene structure, and expression of the rice wall-associated kinase gene family. Plant Physiol. 139: 1107-1124.
- Zhao K, Tung CW, Eizenga GC, Wright MH, Ali ML, Price AH, et al. 2011. Genome-wide association mapping reveals a rich genetic architecture of complex traits in Oryza sativa. Nat. Commun. 2: 467
- Zhou Y, Cai H, Xiao J, Li X, Zhang Q, Lian X. 2009. Over-expression of aspartate aminotransferase genes in rice resulted in altered nitrogen metabolism and increased amino acid content in seeds. Theor. Appl. Genet. 118: 1381-1390.
- Zhu X, Wang D, Xie L, Zhou T, Zhao J, Zhang Q, et al. 2022. Rice transcription factors OsLBD37/38/39 regulate nitrate uptake by repressing OsNRT2. 1/2.2/2.3 under high-nitrogen conditions. Crop J. 10: 1623-1632.