Abstract
Peanut variety identification is essential for protecting the intellectual property rights of researchers, ensuring quality management for producers, and safeguarding the interests of seed production stakeholders. In this research, we developed a molecular marker set for peanut variety identification using single nucleotide polymorphism (SNP) markers. We used genotyping data and selection procedures, including decision tree and optimal combination selection, to identify a minimal set of informative SNP sites. These SNPs were then converted into Kompetitive allele-specific PCR (KASP) markers. We selected a subset of 14 informative SNPs from a pool of 22 candidate markers, representing the minimum number of combinations required to distinguish cultivars. SNPs obtained from the microarrays were converted to KASP markers and then evaluated across 51 peanut varieties. The developed marker set, which consists of a minimal number of markers, is expected to be a rapid and cost-effective tool for peanut variety identification.
-
Key words: Peanut, Cultivar identification, SNP microarray, Decision tree, KASP marker
INTRODUCTION
Determining crop varieties is essential for agricultural producers, researchers, and stakeholders involved in seed production and supply systems, as well as for protecting intellectual property rights. Various approaches have been reported for determining crop varieties, including assessing morphological characteristics such as seed or plant shape and analyzing nutritional indicators and seed components (
Ben-Ayed et al. 2013;
Korir et al. 2013). However, dis-crimination based on the appearance or composition of individual plants can be challenging due to environmental or cultivation factors. Advances in molecular biology and genetics have led to the development of DNA-based methods for rapid and reliable crop variety identification. These methods are based on the genetic fingerprints of individual plants, which differ between varieties due to genetic polymorphisms. Molecular markers based on this information are widely used in the seed industry (
Park et al. 2020;
Choi et al. 2022;
Tang et al. 2022).
Recent advancements in genotype and phenotype tech-nologies have enabled the development of various ap-proaches for plant variety discrimination. Machine learning, a powerful tool widely used in biological research, encom-passes various classification algorithms, including the de-cision tree model. Decision trees are valuable tools for forming classification models based on existing data, which can then be used to classify and predict unknown samples (
Tarca et al. 2007). They can be effectively used for separating varieties into sub-branches based on genotype or phenotype information unique to each variety.
Ropelewska et al. (2021) showed that the decision tree model can be effectively used for sweet cherry varietal identification based on phenotypic information.
Ishikawa et al. (2018) used fruit image data to identify strawberry varieties by a decision tree approach. Other studies have also employed decision trees for identification based on genotype information.
Torkzaban et al. (2017) employed a decision tree approach to classify populations and determine the geographical origin of olive trees using informative microsatellites as nodes.
Park et al. (2022) used a similar strategy to differentiate silkworms with SNP markers.
In peanut (
Arachis hypogaea L.),
He et al. (2005) iden-tified 38 polymorphic Simple Sequence Repeats (SSR) markers from 24 accessions and selected eight to discri-minate between botanical varieties.
Han et al. (2011) selected 12 SSR markers and applied them to 36 Korean- bred varieties.
Ren et al. (2016) used a core primer set to identify polymorphic SSR markers for 100 peanut varieties. The advent of genomic data and sequencing technologies have enabled the generation of extensive genome-wide genotype information in peanut (
Bertioli et al. 2019). SNP-based methods offer several advantages over tradi-tional methods for peanut variety classification, including simplicity, gel-free operation, and higher reproductivity.
In this study, we designed a molecular marker set for the identification of 55 Korean peanut varieties using SNP microarray genotype data. However, multiple alleles ob-tained from the microarray had the same value when assessed based on polymorphic information content (PIC), a simple parameter indicating marker informativeness. Computer automation or other selection algorithms were essential for selecting the minimal set of informative mar-kers that could be redundantly used while distinguishing each variety. We employed a series of selection processes to discover a candidate set with the minimum number of essential markers for peanut cultivar genetic fingerprint-ing. Thus, we developed a highly reproducible and high- resolution peanut cultivar identification set and converted the selected SNP markers into Kompetitive allele-specific PCR (KASP) markers.
MATERIALS AND METHODS
Plant materials and DNA extraction
Peanut varieties from the breeder’s seed was used in the experiment. The list of varieties used in the experimental procedure is provided in
Supplementary Table S1. The seeds were germi-nated in 50-cell plug trays and grown in the greenhouse at the Department of Southern Area Crop Science, National Institute of Crop Science, Miryang, South Korea. Plug trays were kept at 25 ± 3℃. Approxi-mately 15 days after sowing, bulk samples of the first true leaves were collected. The leaves were immersed in liquid nitrogen and pulverized using an automated tissue homo-genizer (Tissuelyzer2, Qiagen, Hilden, Germany). Sub-sequently, DNA was extract-ed using a kit (Nucleospin2, Macherey-Nagel, Allentown, PA, USA). The quality of the nucleic acids was analyzed using a NanoDrop spectropho-tometer (ThermoFisher Scientific, Waltham, MA, USA).
Genotyping was performed using the 48K Axiom
Ⓡ Arachis2 SNP microarray chip (Affymetrix Inc., Santa Clara, CA, USA). Each sample was hybridized to the microarray following the Affymetrix GeneTitan Platform manufacturer’s instructions (Affymetrix Inc.). Quality co-ntrol and polymorphic variant calling were performed using the Axiom Analysis Suite 4.0 software (Applied Biosystems, Foster City, CA, USA), following the Best Practices Workflow. Probesets identified as polymorphic markers were selected for further analysis. Probesets that failed to genotype for one or more varieties or hetero-zygous genotypes were eliminated from the tested set, and probesets with minor allele frequency (<0.1) were sub-sequently filtered out using TASSEL 5 (
Bradbury et al. 2007). The filtered SNP data was initially converted to binary code, and redundant SNPs with identical genotype patterns across all varieties were removed. Next, a decision tree model was trained on the SNP data to distinguish between peanut cultivars. Based on SNP information, feature importance was calculated to select SNPs and create marker combinations. In the final step, all possible combinations of the minimum number of markers required for cultivar identification were screened to find the optimal marker combination. Customized KASP (LGC Group, Teddington, UK) assays were additionally designed based on Axiom
Ⓡ Arachis2 annotation data.
Real-time PCR was performed on a QuantStudio 5 instrument (ThermoFisher Scientific) using the thermal cycling conditions recommended by the manufacturer (LGC group). Allele discrimination was conducted using QuantStudio Design and Analysis software (ThermoFisher Scientific).
Statistical analysis
RESULTS
Genotyping and classification of SNP probesets
Genotyping data for cultivar identification markers was obtained using the Axiom
Ⓡ Arachis2 SNP microarray. All 55 varieties passed quality control, with an average call rate of 98.27% and an average heterozygous rate of 11.67%. Of the total probesets, 6966 (approximately 14.6%) were determined to be polymorphic SNP sites. Of the 47837 probesets, approximately 53.0% were monomorphic, and the remaining 32.4% were classified as ‘no minor homo-zygous’, ‘call rate below threshold’, ‘off-target value’, or others group (
Table 1). For further analysis, this study focused on the 6966 polymorphic probesets.
Fig. 1 depicts the overall workflow for selecting the cultivar identification set. We initially reduced the number of SNPs from 6966 through the filtering process. Based on annotation information (
Bertioli et al. 2019), we excluded 698 SNPs that were not assigned to either the A (
A. duranensis) or B (
A. ipaensis) subgenome sequences. A total of 1,177 markers with failed genotype calls or heterozygous alleles for one or more samples were also removed. Probesets with minor allele frequency (MAF) <0.1 were also filtered out. In the marker-by-cultivar matrix, where SNP markers were encoded in binary code (0 and 1 for reference and alternative alleles, respectively), redundant markers with identical genotypes across 55 cultivars were removed. Of the initial 6966 markers, 547 remained after filtering for candidate marker cultivar identification. The ‘Scikit-learn’ (
Pedregosa et al. 2011) module was used as a decision tree classifier tool, and the feature importance of each marker was calculated and ranked by entropy index from the model. From this procedure, 36 SNP markers with the highest feature importance were selected from the 547 markers and then subjected to an additional round of decision tree analysis, resulting in 22 candidate SNP markers.
The decision tree analysis revealed that cv. ‘Charm-pyeong’, cv. ‘Pungan’, and cv. ‘Ilpyeong’ had identical genotypes to cv. ‘Sangpyeong’ and, therefore, they were removed from the tested varieties. Similarly, cv. ‘Sinnam-kwang’ was excluded because it had the same genotype as cv. ‘Namkwang’. A total of 51 varieties and 22 candidate SNP markers remained after the removal of redundant varieties and SNPs.
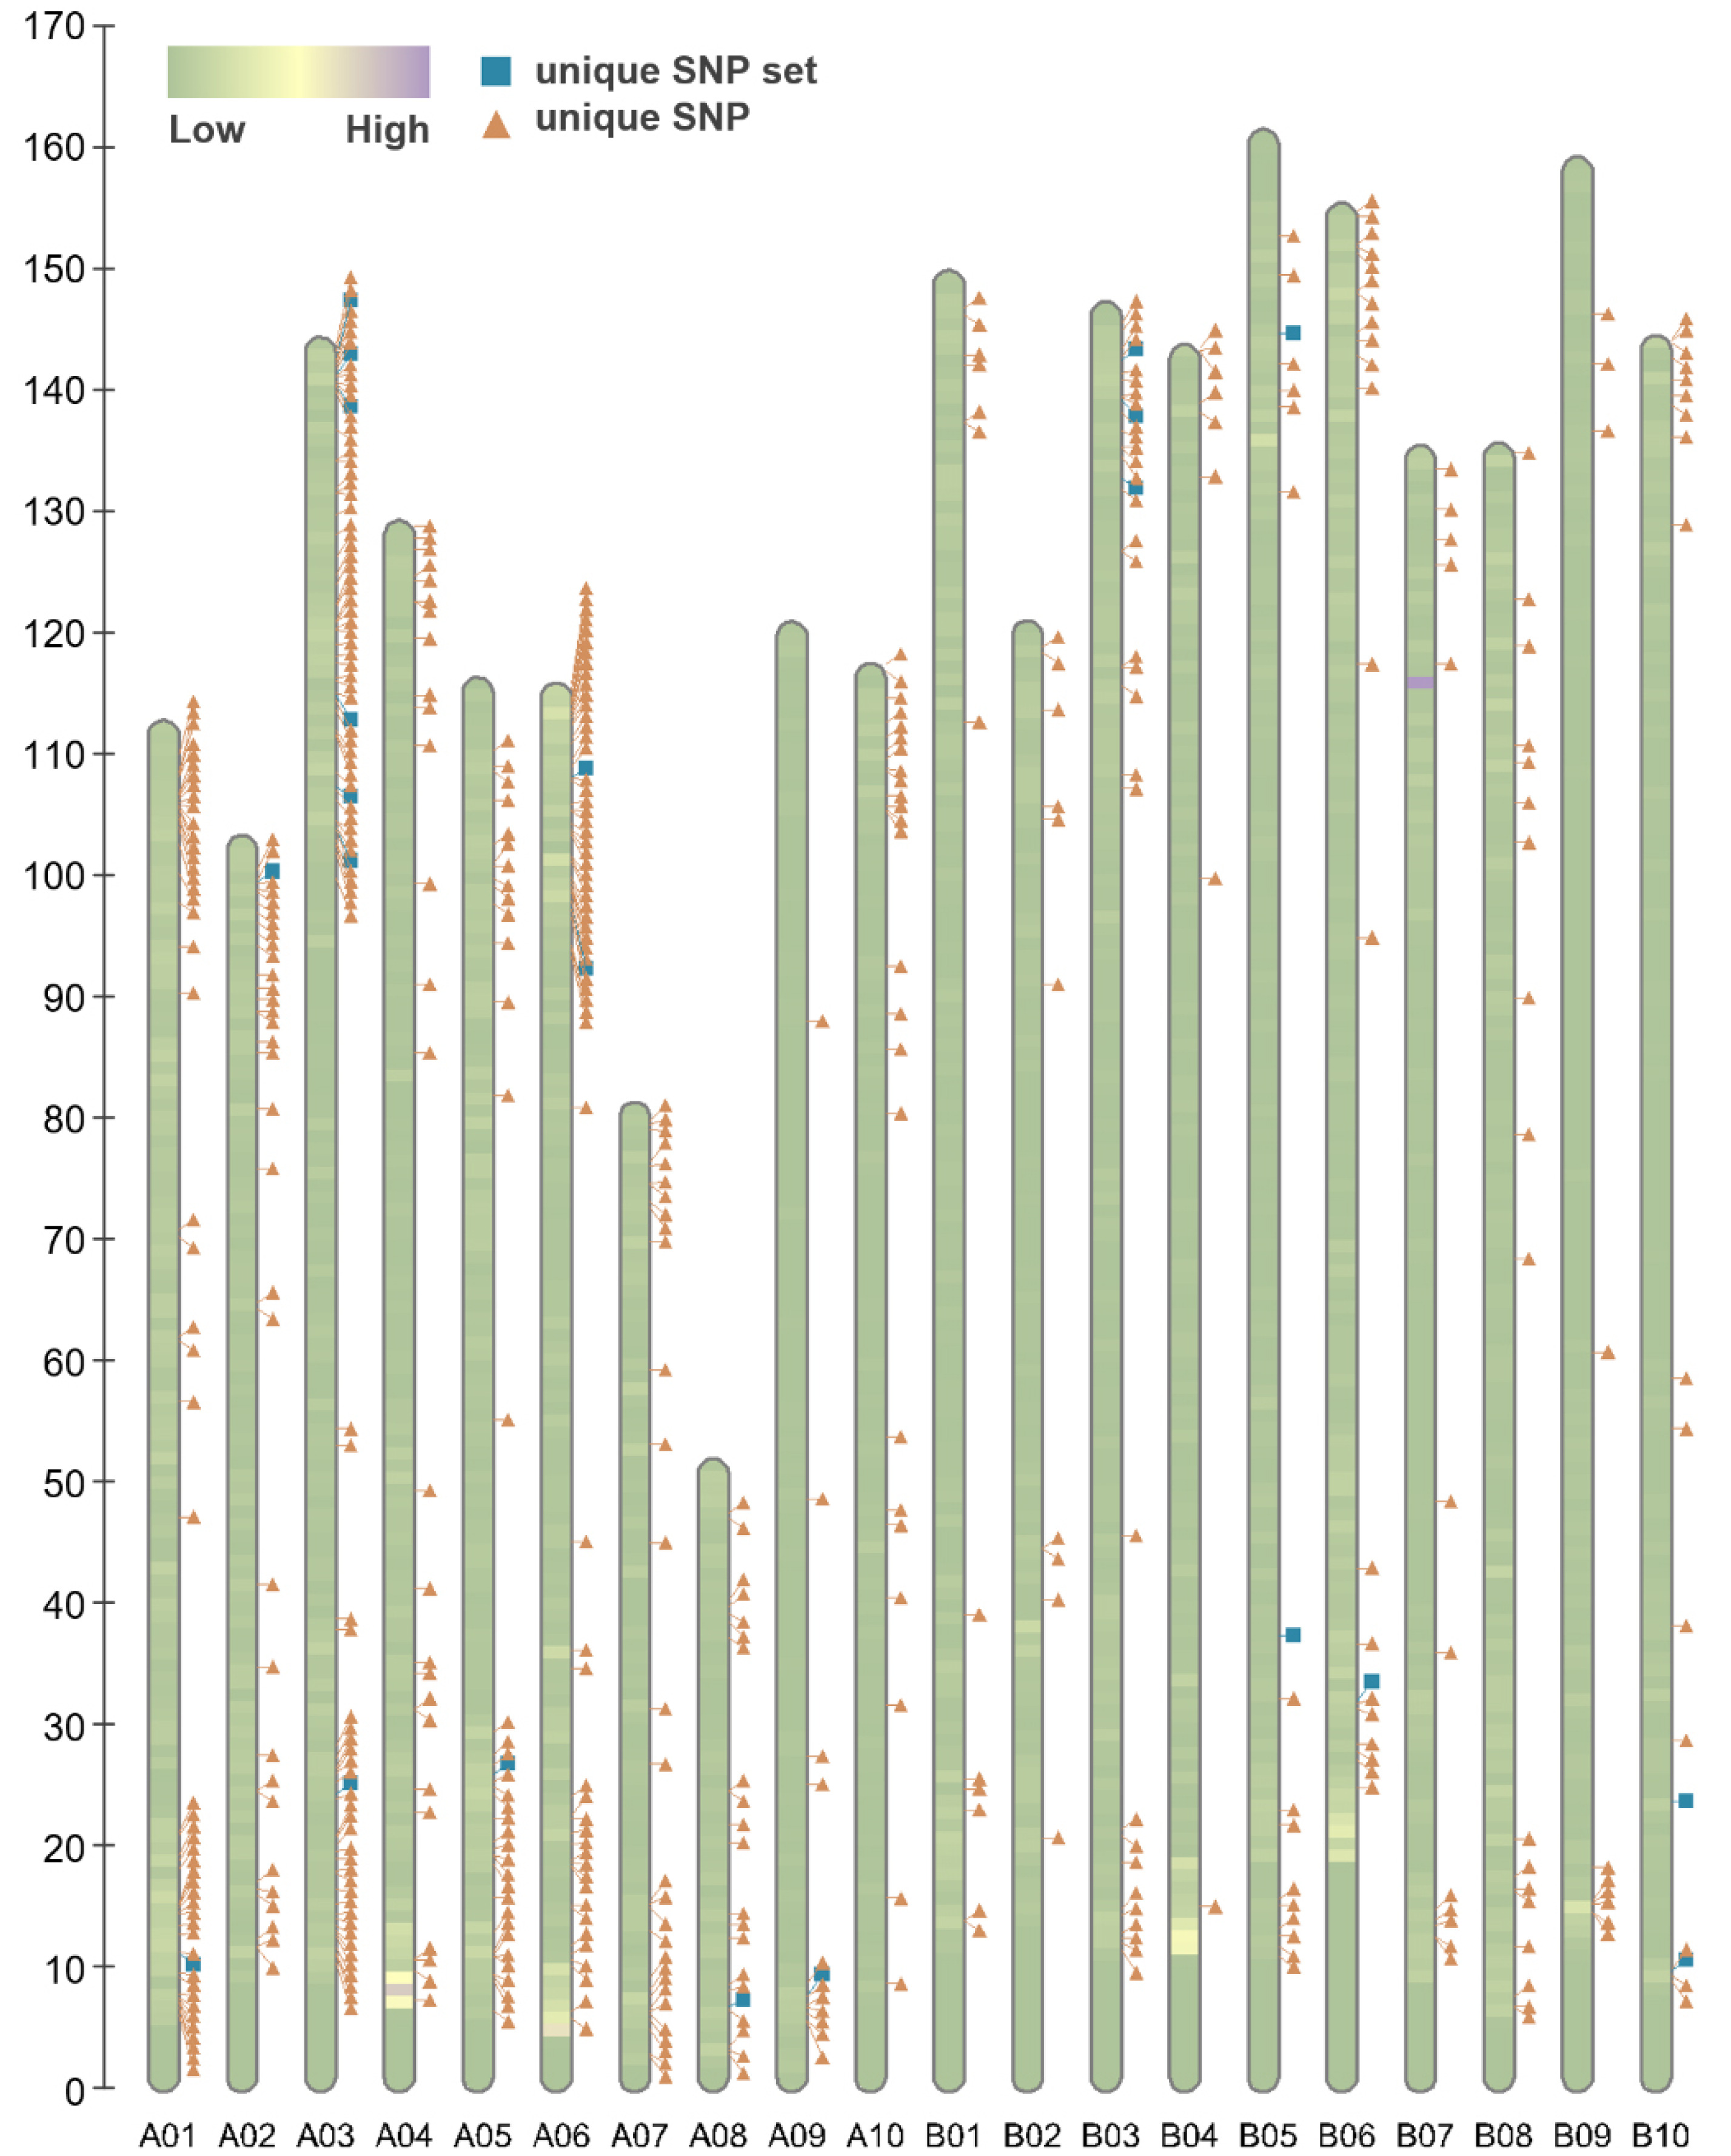
Fig. 2 displays 547 distinct SNP patterns from the genotyping data, highlighting 22 unique SNP markers.
Candidate SNP combinations were assessed to select a minimum number of SNPs for cultivar identification from the 22 SNP markers identified by decision tree analysis (
Supplementary Table S2). Our objective was to ensure that each of the 55 cultivars could be identified using a single marker set. To minimize the number of markers in the set, a custom script was used to search all possible marker combinations. The cultivar identification set was initially found to contain 14 markers. Therefore, ten pos-sible combinations of 14 markers out of the 22 markers were selected. The KASP markers were designed based on the SNP microarray flanking sequences for each SNP array site (
Table 2).
DNA templates extracted from the 55 cultivars were tested with the 19 KASP markers selected from the ten marker sets. The KASP genotyping results were predomi-nantly concordant with the SNP microarray data, except for a few cultivars. Of the 19 markers tested, ahcv08 failed to amplify in cv. ‘Saedeul’, and ahcv18 showed the alter-native allele in cv. ‘Daekwang’, cv. ‘Daewon’, and cv. ‘Wangddangkong’ compared to the microarray data (data not shown). The cultivar identification marker set was selected based on the KASP results that exhibited the most significant concordance with the microarray analysis. Although most KASP markers matched the expected genotypes, cv. ‘Saedeul’ failed to amplify for ahcv02. Moreover, cv. ‘Hae-Ol’, cv. ‘Daekwang’, and cv. ‘Pung-kwang’ had alternative alleles for ahcv16, in contrast to the microarray results. In addition, the KASP assays revealed a heterozygous allele for ahcv14 in cv. ‘Wangddangkong’, cv. ‘Danwon’, and cv. ‘Daan’.
Table 3 details the finalized cultivar identification marker set, which was converted into KASP markers. This set consists of one marker from each of chromosomes A02, A05, and B06; two markers from each of chromosomes A06 and B10; three markers from chromosome B03; and four markers from chromo-some A03.
PCA was performed on two sets of SNP markers: the initial set of 547 markers filtered from the polymorphic SNP array results and the final set of 14 markers selected for cultivar identification (
Fig. 3). Based on the two principal components of the 547 SNPs (
Fig. 3A), which excluded cv. ‘Charmpyeong’, cv. ‘Pungan’, cv. ‘Ilpyeong’, and cv. ‘Sinnamkwang’ due to their identical genotypes to other varieties on the microarray, the 51 remaining varieties were uniformly distributed across the plot with no overlap. Similarly, the PCA plot based on the 14 markers (
Fig. 3B) revealed that the 51 remaining varieties were evenly dispersed along a relatively short axis with no overlap. The nearest distance between the two varieties was consistent in both PCA plots, measuring 0.500. However, the PCA plot with 547 markers displayed a comparably wider distribution of varieties, with some clustering. Conversely, the PCA plot with 14 markers compressed the spacing between varieties while preserving their distinctions, resulting in an evenly dispersed pattern, and suggesting that these 14 markers are sufficient to distinguish between varieties.
DISCUSSION
The development of an SNP chip for peanuts has made it possible to obtain a large amount of genome-wide SNP information, which can be utilized as a highly reproducible marker in a gel-free-based analysis (Janila
et al. 2017). SNP microarray genotyping resulted in a list of 6966 polymorphic SNPs among varieties. To minimize the number of markers, a series of filtering processes were applied. With binary allele markers like SNPs, the poly-morphic informative content (PIC) is not always a reliable measure of informativeness (
Cabezas et al. 2011). This was evident in our study, where we found it difficult to select useful markers from a large SNP dataset with the same MAF and PIC.
Theoretically, to distinguish 2k (number) different vari-eties, a minimum k or more number of SNPs are required. In this study, there are a total of 720 combinations for selecting a minimum number of 6 markers out of initially derived 547 SNPs. To find the best combination of markers for discriminating between 55 varieties, a large number of combinations must be examined. For seven markers, there would be 5040 combinations, and for eight markers, there would be 40320 combinations. Alternative approaches were necessary to select markers with a higher discrimi-native value because of the large number of combinations to evaluate. Therefore, the decision tree algorithm was used to collect and filter markers with sufficient informativeness for varietal discrimination.
As reported in previous studies, the decision tree model efficiently selects highly discriminative genetic markers based on the genotype information of each accession, making them useful for classification (
Torkzaban et al. 2015;
Park et al. 2022). In this study, we used attributes of nodes, which are components of the decision tree model, as a primary filtering procedure, selecting nodes with high discriminative power among varieties. In contrast to
Park et al. (2022), this study aimed to develop a set of multiple markers that could be used to identify unknown peanut varieties rather than a sequential marker-based approach. Therefore, to minimize the number of markers and exploit the redundancy of polymorphic information from the top nodes’ markers, all possible combinations of markers were screened.
The experiments were designed to ensure that the 51 varieties possessed unique allele combinations through different genotype combinations of the informative markers. To differentiate between some closely related varieties, 14 markers were required for combination construction, which is considerably higher than the hypothetical number of 6.
The selected markers were successfully converted into KASP markers and enabled the discrimination of 51 varieties based on their unique SNP patterns. Although some KASP markers failed to amplify or genotyped as different alleles in some varieties, they still yielded unique genotype data for the 51 varieties. The unexpected results in the KASP assay may be attributable to the high sequence similarity within subgenomes and gene duplication in the tetraploid peanut genome consisting of
A. duranensis and
A. ipaensis ancestral genomes, which served as templates for the microarray (
Clevenger et al. 2017). Additional analyses are required to verify the uniqueness of the marker sequences within subgenomes.
The findings of this study demonstrate that varietal iden-tification can be accomplished rapidly and at a low cost using only a small number of markers and without re-quiring large-scale arrays or resequencing approaches. Additionally, our approach is expected to be useful for developing varietal identification markers in other crops.
ACKNOWLEDGEMENTS
This work was supported and funded by the project (PJ016076032023) of the Rural Development Adminis-tration, Republic of Korea.
Fig. 1Schematic procedures of development of cultivar identification marker in peanut.
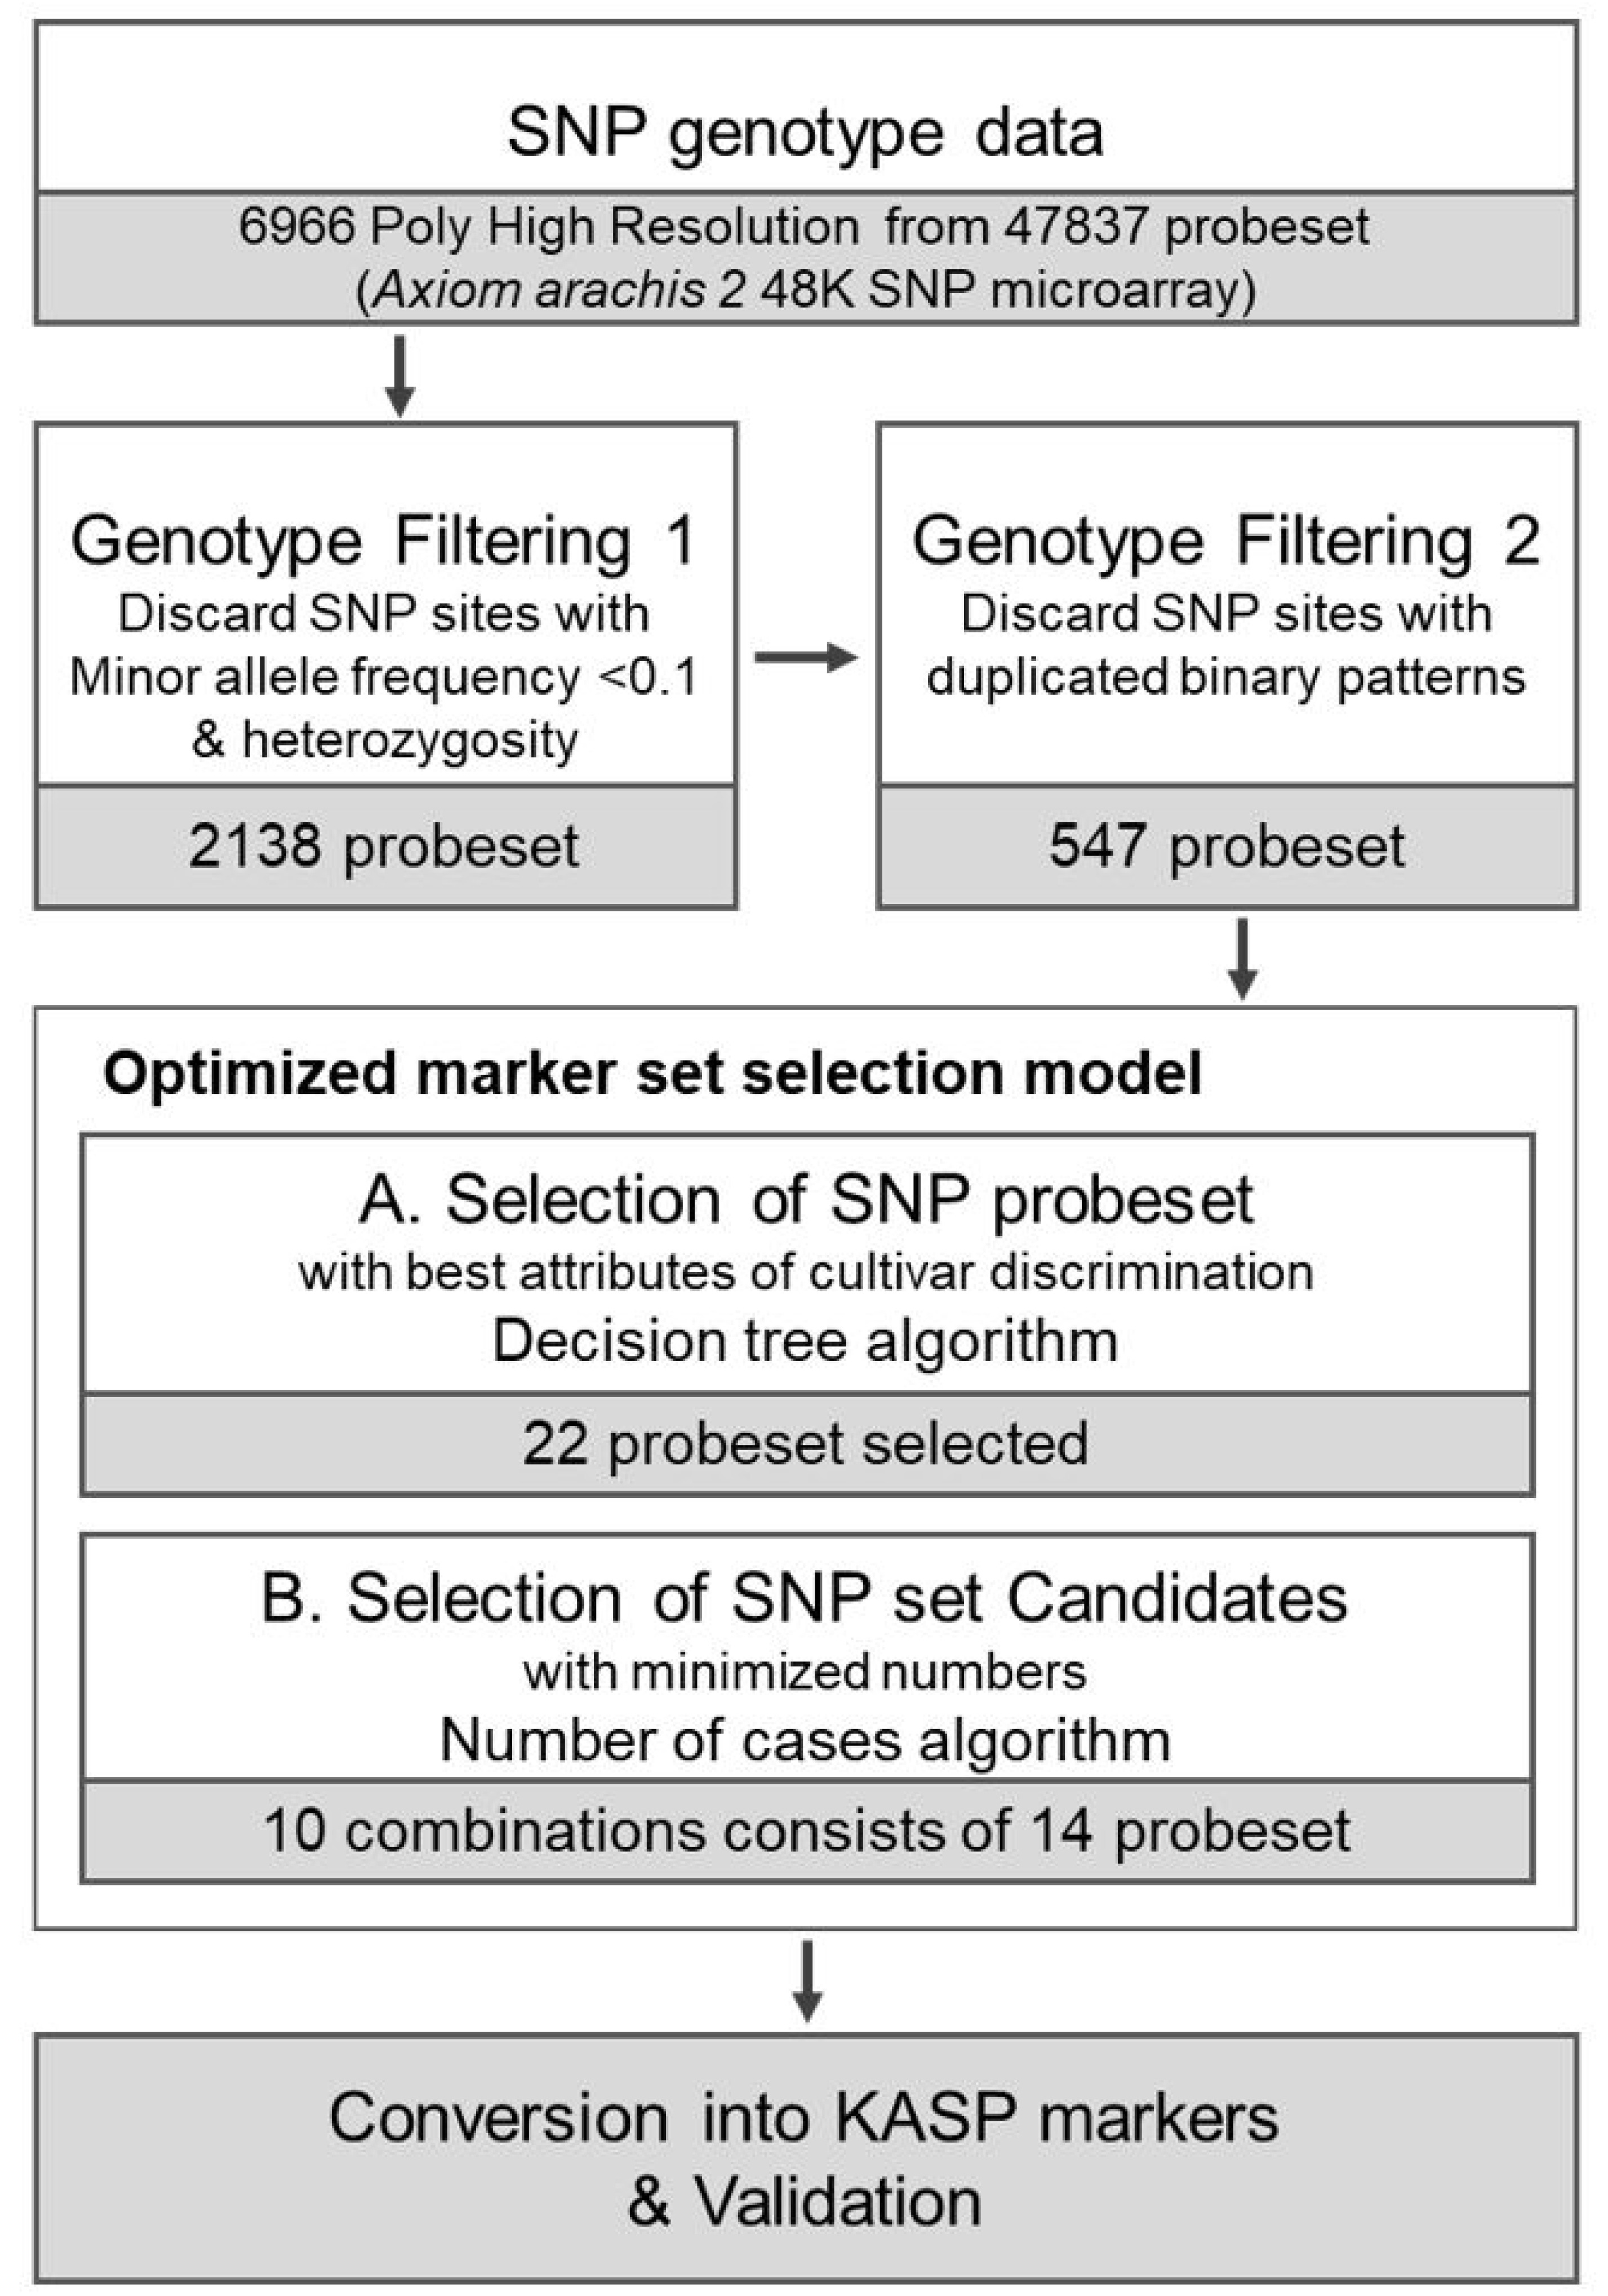
Fig. 2Poly high resolution SNP density of analyzed SNP microarray among 55 peanut cultivars. Each bar consists of pseudomolecules of subgenome A and B, color blocks represents variants density, the marks represents filtered 547 SNP probeset from the array (orange triangle) and 22 cultivar identification marker candidates (blue square).

Fig. 3Comparison of principal component analysis based on SNP data consist of 537 probeset (A) and 14 selected probeset (B) in 51 peanut cultivars. Red dashed lines indicate the connection between the closest cultivars by the PCA distance.
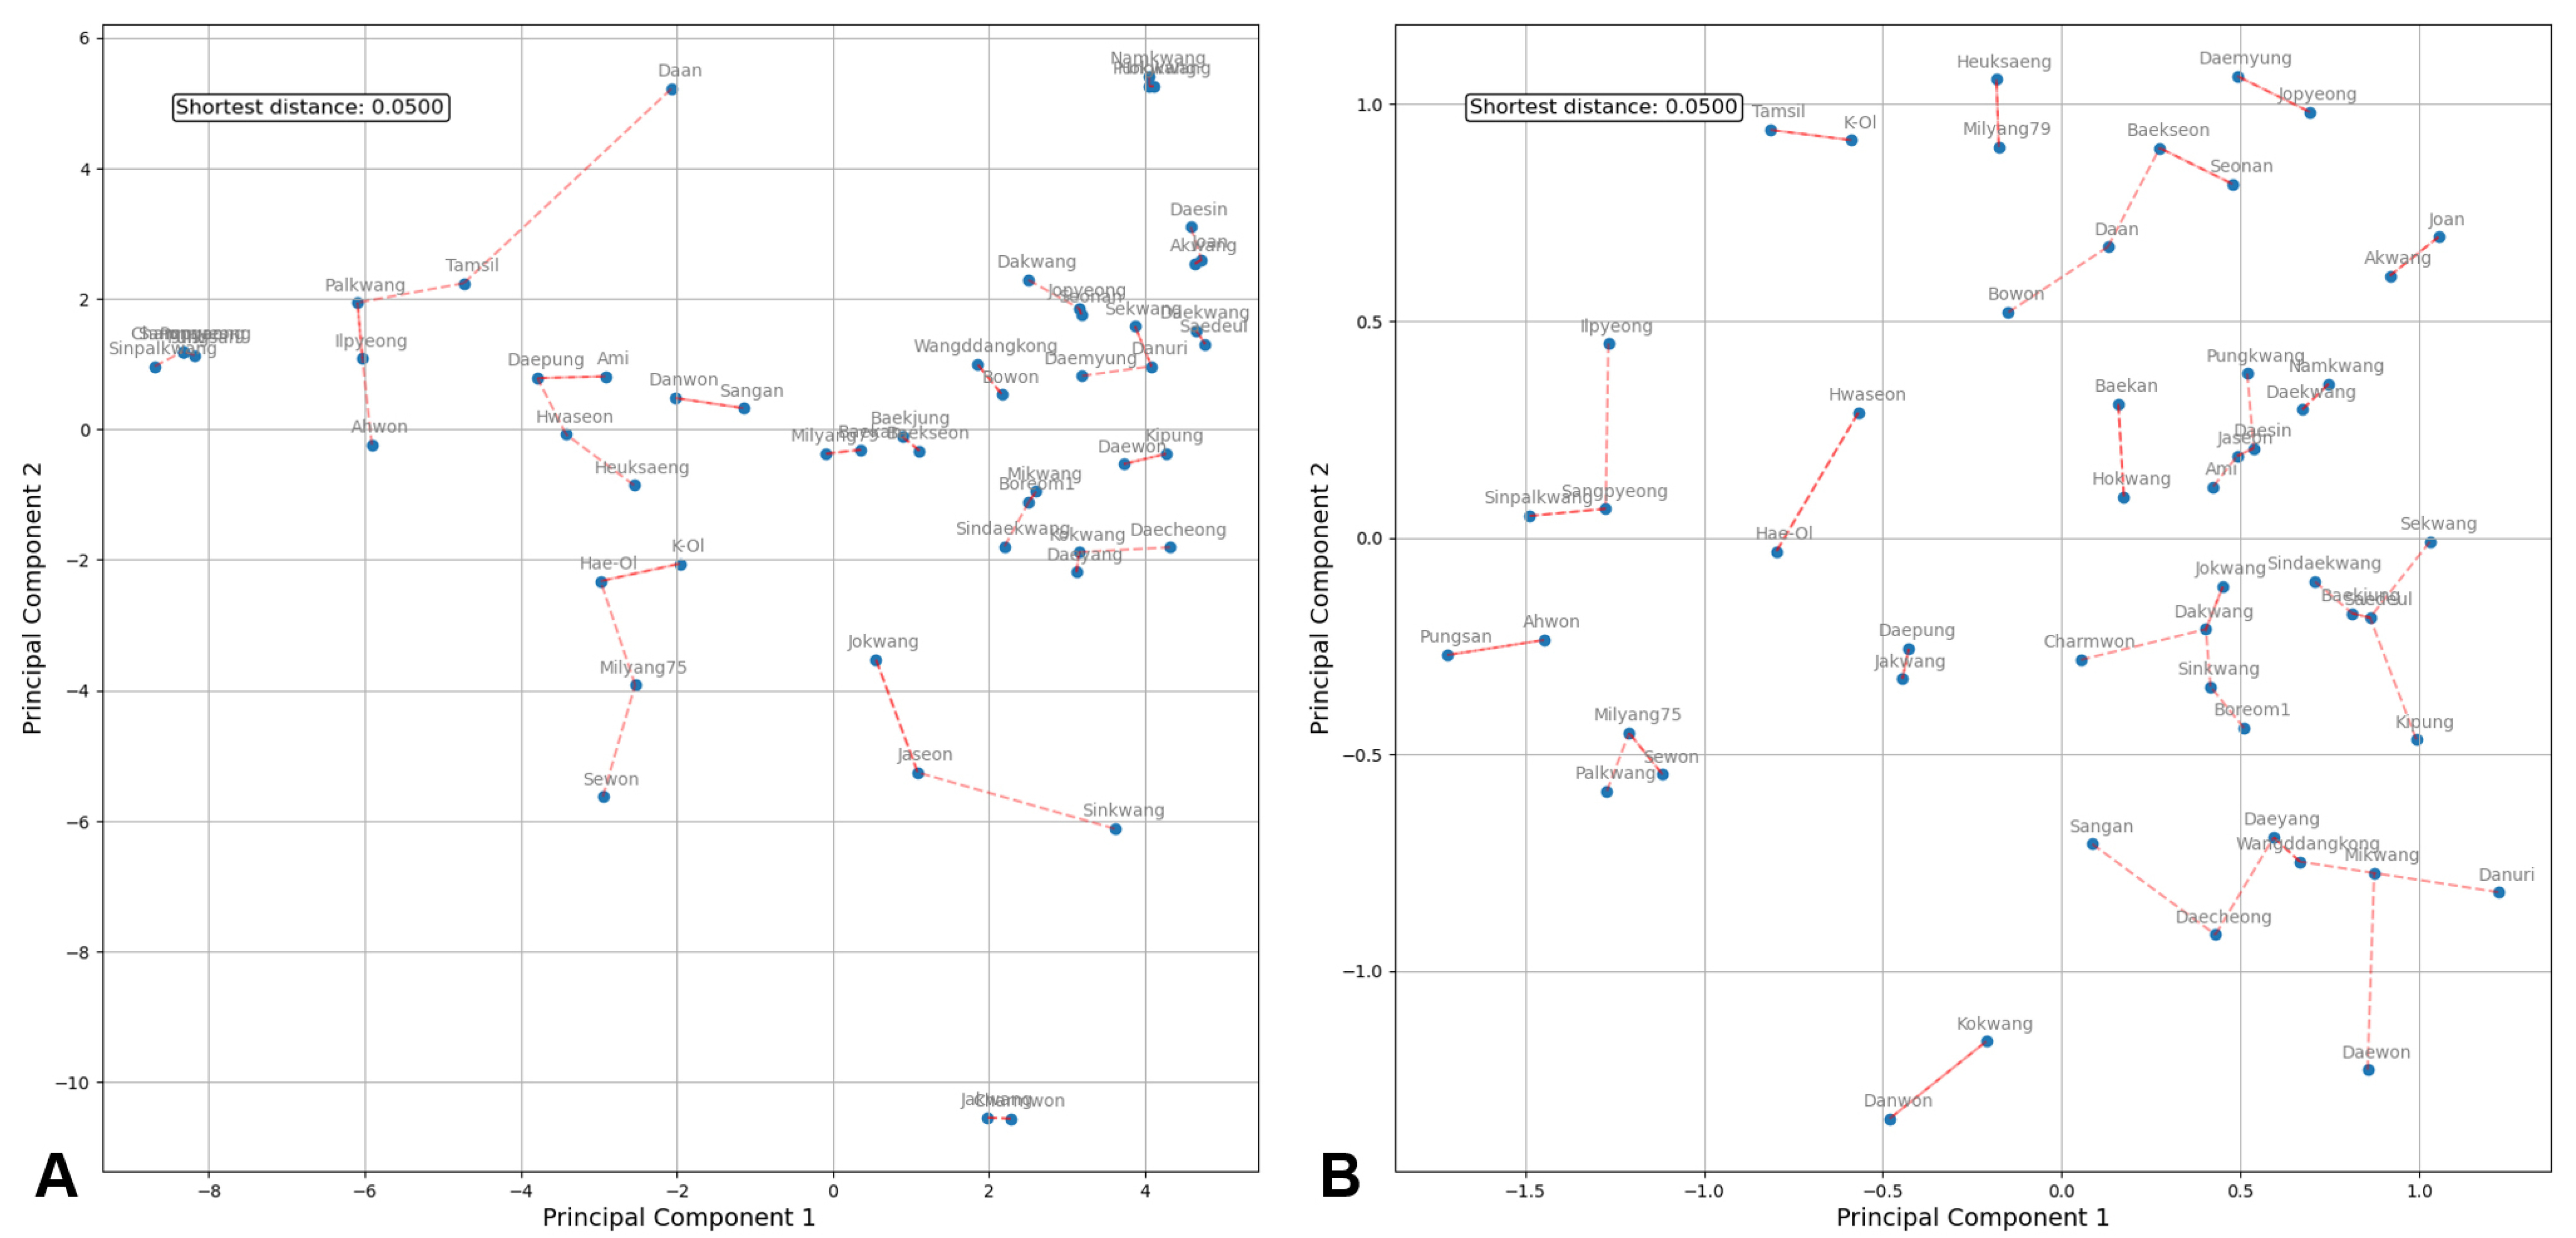
Table 1Summary of probeset classification and properties of 55 peanut varieties from 48K Axiom arachis 2 SNP microarray.
Table 1
|
List of probeset |
No. of probeset |
Percentage (%) |
|
Poly high resolution |
6966 |
14.562 |
|
Mono high resolution |
25356 |
53.005 |
|
No minor homozygous |
6322 |
13.216 |
|
Call rate below threshold |
1968 |
4.114 |
|
Off target value |
179 |
0.374 |
|
Others |
7046 |
14.729 |
|
|
Call rate and heterozygosity rate of 55 sample |
Ratio (%) |
|
|
Average call rate |
98.27 |
|
Average heterozygous rate |
11.67 |
Table 2Selected cultivar identification marker candidates and their sequence information on Kompetitive Allele Specific PCR (KASP) marker conversion.
Table 2
|
Marker name |
List No. |
Probeset ID |
Primer Seq Allele X |
Primer Seq Allele Y |
Primer Seq common |
|
ahcv01 |
21 |
AX-177637377 |
CAACATCTAGCCAATCAGGATGAGT |
AACATCTAGCCAATCAGGATGAGC |
TTTCCTTCATTTTTTTCCATGTAGATGGAT |
|
ahcv02 |
11 |
AX-176793939 |
ATATGAAAATATTCAATGCAAGATTCCAGC |
ATATGAAAATATTCAATGCAAGATTCCAGA |
GTCTAAAGTATTTTAATAAATTACCACTCA |
|
ahcv03 |
13 |
AX-176815388 |
CGTACTTTAAAACAACTGAGACTAAGAATT |
GTACTTTAAAACAACTGAGACTAAGAATC |
GCTGCAAAGACACTATATTAATGAAGCAA |
|
ahcv04 |
18 |
AX-176809362 |
AAAGATTGCAGGAGGAACTTCAATTTG |
CAAAGATTGCAGGAGGAACTTCAATTTA |
ATGGCTCTGAACATCAAAATACATGTTGAT |
|
ahcv05 |
10 |
AX-176802618 |
AATATATAGACAAAATTGTAGCCAAATTTATGC |
AATATATAGACAAAATTGTAGCCAAATTTATGT |
CTGCGCTGTATTTTTTTCATTTCACTCGT |
|
ahcv06 |
4 |
AX-176818000 |
CCTTCTTCCTCTTTATCCCTTCC |
CCCTTCTTCCTCTTTATCCCTTCT |
GAAGGAGGAGCGAGGTTCACGAA |
|
ahcv07 |
5 |
AX-176802670 |
ATCTTTATGTCTAAAATGTCTAGAGTTTAATCT |
CTTTATGTCTAAAATGTCTAGAGTTTAATCC |
GCTAATTTATTCCACTTTTAAAATTCACAA |
|
ahcv08 |
6 |
AX-147217672 |
AACAGTTCATCCACTGCTACTCA |
AACAGTTCATCCACTGCTACTCG |
AATCCACCTCTGAACATATATGGTACCAT |
|
ahcv09 |
20 |
AX-176791561 |
CAATGTATAATTGTATATATCTCTCTTTTAA |
CTCAATGTATAATTGTATATATCTCTCTTTTAG |
AACAAAGGCTAGCTAAAGACTTAAAACCAT |
|
ahcv10 |
15 |
AX-176804113 |
GACATATAACAGTAAGTTGTTAGAGTTATG |
AGACATATAACAGTAAGTTGTTAGAGTTATA |
CAGCCTTTTCTTAGCAACTACTTTGACAA |
|
ahcv11 |
2 |
AX-147212864 |
ATATATTTTGACCACTTCATTACGTTTTGC |
CATATATTTTGACCACTTCATTACGTTTTGT |
CTGGTGACATACTAGACGAAATAGAGTAT |
|
ahcv12 |
7 |
AX-176814227 |
GATGATCGTCCATGGCAGGGAAT |
ATGATCGTCCATGGCAGGGAAC |
GCTTCTTCGTCCTCGAACGGATTT |
|
ahcv13 |
12 |
AX-147224640 |
GAGATGAAACGTGTGCGTCTCTA |
GAGATGAAACGTGTGCGTCTCTG |
GGCACTCGTGAAGCGATGGCAT |
|
ahcv14 |
16 |
AX-176797614 |
ACCCTTTCAACTCCACTACATCCAT |
CCTTTCAACTCCACTACATCCAC |
GTCTGTAGGGGCAGTTTGATGTGAT |
|
ahcv15 |
17 |
AX-176793831 |
TGTGATTCACAAATTTCATAACTTATTACTA |
GTGATTCACAAATTTCATAACTTATTACTC |
TGCCATACATCTGCCAACAAATAATAGCA |
|
ahcv16 |
8 |
AX-176814341 |
CGGTTATGGTAGGAGAAGGGTG |
TCGGTTATGGTAGGAGAAGGGTT |
CTTCCCAACAACCCACATTCAAATTCAAT |
|
ahcv17 |
14 |
AX-176802696 |
AGTTAGCTAGCAGCACCGCAG |
AGTTAGCTAGCAGCACCGCAA |
GTGAATAGTTACCTACTTACCTTATAATAT |
|
ahcv18 |
9 |
AX-147216563 |
GATGACTAACTATCTTACAAATTCATCAG |
CTGATGACTAACTATCTTACAAATTCATCAT |
CTCTCCCTTGAGGTCACAAAGTTCAA |
|
ahcv19 |
22 |
AX-177639117 |
GAAGTGAGGAGTTATCAAACGTCAAATA |
AAGTGAGGAGTTATCAAACGTCAAATC |
CTACGACTAGTCCTTGCTTGCCTTT |
Table 3Allelic variations and validation of cultivar identification marker converted into Kompetitive Allele Specific PCR (KASP) marker.
Table 3
|
List No. |
Samplez)
|
ahcv
01 |
ahcv 02 |
ahcv 05 |
ahcv 06 |
ahcv 07 |
ahcv 09 |
ahcv 10 |
ahcv 11 |
ahcv 12 |
ahcv 13 |
ahcv 14 |
ahcv 15 |
ahcv 16 |
ahcv 19 |
|
1 |
Saedeul |
A |
G |
C |
C |
G |
G |
T |
T |
A |
A |
G |
A |
T |
A |
|
2 |
Daekwang |
A |
G |
C |
C |
G |
G |
C |
T |
A |
A |
G |
A |
T |
A |
|
3 |
Namkwang |
G |
G |
T |
C |
G |
G |
C |
T |
A |
G |
A |
A |
G |
A |
|
4 |
Daewon |
G |
G |
T |
T |
G |
A |
T |
T |
A |
G |
A |
A |
T |
A |
|
5 |
Sinnamkwang |
G |
G |
T |
C |
G |
G |
C |
T |
A |
G |
A |
A |
G |
A |
|
6 |
Wangddangkong |
G |
G |
T |
T |
G |
A |
C |
T |
A |
G |
H
|
A |
T |
A |
|
7 |
Daepung |
G |
T |
T |
T |
G |
G |
C |
T |
A |
A |
A |
A |
T |
C |
|
8 |
Sindaekwang |
G |
G |
T |
C |
G |
G |
T |
T |
A |
A |
A |
A |
G |
A |
|
9 |
Sinkwang |
G |
G |
T |
C |
A |
G |
T |
T |
A |
A |
G |
A |
T |
A |
|
10 |
Jokwang |
G |
G |
T |
C |
G |
A |
C |
T |
A |
G |
G |
C |
T |
A |
|
11 |
Kipung |
G |
G |
C |
C |
G |
A |
T |
T |
A |
A |
G |
A |
T |
A |
|
12 |
Daecheong |
G |
G |
T |
C |
G |
A |
T |
T |
G |
A |
G |
A |
T |
A |
|
13 |
Palkwang |
G |
T |
T |
T |
G |
G |
C |
C |
G |
A |
A |
A |
T |
C |
|
14 |
Mikwang |
G |
G |
C |
C |
G |
A |
T |
T |
G |
G |
G |
A |
T |
A |
|
15 |
Joan |
A |
G |
C |
C |
G |
A |
C |
T |
A |
A |
G |
A |
G |
A |
|
16 |
Sekwang |
G |
G |
C |
C |
G |
A |
C |
T |
A |
G |
G |
A |
T |
A |
|
17 |
Hokwang |
G |
G |
T |
C |
G |
G |
C |
T |
G |
A |
A |
A |
G |
A |
|
18 |
Daeyang |
G |
G |
T |
C |
G |
G |
T |
T |
A |
A |
A |
A |
T |
A |
|
19 |
Daesin |
G |
G |
C |
C |
G |
G |
C |
T |
A |
A |
G |
A |
T |
A |
|
20 |
Bowon |
G |
T |
T |
C |
A |
G |
C |
T |
A |
A |
A |
C |
G |
A |
|
21 |
Dakwang |
G |
G |
T |
C |
G |
G |
C |
T |
A |
A |
A |
A |
T |
A |
|
22 |
Pungkwang |
G |
G |
T |
C |
G |
G |
C |
T |
A |
A |
A |
A |
G |
A |
|
23 |
Akwang |
G |
G |
C |
C |
G |
A |
C |
T |
A |
A |
G |
A |
G |
A |
|
24 |
Daemyung |
G |
G |
C |
C |
G |
G |
C |
T |
A |
G |
G |
A |
G |
C |
|
25 |
Kokwang |
G |
G |
T |
T |
A |
G |
T |
T |
G |
G |
A |
C |
T |
A |
|
26 |
Jakwang |
G |
G |
T |
C |
A |
G |
T |
C |
A |
A |
G |
C |
T |
A |
|
27 |
Baekjung |
G |
G |
T |
C |
G |
A |
C |
T |
A |
G |
G |
A |
T |
A |
|
28 |
Danuri |
A |
G |
T |
C |
G |
A |
T |
T |
A |
G |
A |
A |
T |
A |
|
29 |
Baekseon |
G |
G |
T |
C |
G |
G |
C |
T |
A |
G |
G |
A |
G |
C |
|
30 |
Sangpyeong |
G |
G |
T |
C |
G |
G |
C |
C |
G |
A |
G |
C |
T |
C |
|
31 |
Baekan |
G |
G |
T |
C |
G |
G |
C |
T |
A |
G |
G |
A |
T |
C |
|
32 |
Jopyeong |
A |
G |
C |
C |
A |
G |
C |
T |
A |
A |
G |
A |
G |
A |
|
33 |
Charmwon |
G |
G |
T |
C |
A |
G |
T |
T |
A |
A |
G |
C |
T |
A |
|
34 |
Charmpyeong |
G |
G |
T |
C |
G |
G |
C |
C |
G |
A |
G |
C |
T |
C |
|
35 |
Pungsan |
G |
T |
T |
T |
G |
G |
C |
C |
G |
A |
G |
C |
T |
C |
|
36 |
Seonan |
A |
G |
T |
C |
A |
G |
C |
T |
A |
A |
G |
A |
G |
A |
|
37 |
Pungan |
G |
G |
T |
C |
G |
G |
C |
C |
G |
A |
G |
C |
T |
C |
|
38 |
Ilpyeong |
G |
T |
T |
T |
A |
G |
C |
C |
A |
A |
A |
C |
G |
C |
|
39 |
Yeonpung |
G |
G |
T |
C |
G |
G |
C |
C |
G |
A |
G |
C |
T |
C |
|
40 |
Boreom1 |
G |
G |
T |
C |
G |
G |
T |
T |
A |
A |
G |
A |
T |
A |
|
41 |
Sangan |
G |
G |
T |
C |
G |
G |
T |
T |
G |
G |
A |
A |
T |
C |
|
42 |
Jaseon |
G |
G |
T |
C |
G |
G |
T |
T |
A |
G |
G |
C |
G |
A |
|
43 |
Sinpalkwang |
G |
T |
T |
C |
G |
G |
C |
C |
G |
A |
G |
C |
T |
C |
|
44 |
Ami |
G |
G |
T |
C |
G |
A |
C |
T |
A |
G |
G |
A |
T |
C |
|
45 |
Hwaseon |
G |
G |
T |
C |
G |
G |
C |
C |
A |
A |
G |
A |
T |
C |
|
46 |
Danwon |
G |
G |
T |
T |
G |
G |
T |
C |
G |
A |
H
|
A |
T |
A |
|
47 |
K-Ol |
G |
G |
T |
C |
G |
G |
C |
C |
A |
G |
G |
C |
G |
C |
|
48 |
Daan |
G |
G |
T |
C |
G |
G |
C |
T |
A |
A |
H
|
A |
G |
C |
|
49 |
Heuksaeng |
G |
G |
T |
C |
A |
G |
C |
T |
A |
G |
G |
C |
G |
C |
|
50 |
Ahwon |
G |
T |
T |
T |
A |
G |
C |
C |
G |
A |
G |
A |
T |
C |
|
51 |
Tamsil |
G |
G |
T |
C |
G |
G |
C |
C |
A |
A |
G |
C |
G |
C |
|
52 |
Sewon |
G |
G |
T |
T |
G |
G |
C |
C |
G |
A |
G |
C |
T |
A |
|
53 |
Hae-Ol |
G |
G |
T |
T |
G |
G |
C |
C |
A |
A |
G |
A |
T |
C |
|
54 |
Milyang79 |
G |
G |
C |
C |
A |
G |
C |
T |
G |
A |
G |
A |
G |
C |
|
55 |
Milyang75 |
G |
G |
T |
T |
A |
G |
C |
C |
G |
A |
G |
C |
T |
A |
References
- Ben-Ayed R, Kamoun-Grati N, Rebai A. 2013. An overview of the authentication of olive tree and oil. Compr. Rev. Food Sci. Food Saf.. 12: 218-227.
- Bertioli DJ, Jenkins J, Clevenger J, Dudchenko O, Gao D, Seijo G, et al. 2019. The genome sequence of segmental allotetraploid peanut Arachis hypogaea. Nat. Genet.. 51: 877-884.
- Bradbury PJ, Zhang Z, Kroon DE, Casstevens TM, Ramdoss Y, Buckler ES. 2007. TASSEL: software for association map-ping of complex traits in diverse samples. Bioinformatics. 23: 2633-5.
- Cabezas JA, Ibáñez J, Lijavetzky D, Vélez D, Bravo G, Rodríguez V, et al. 2011. A 48 SNP set for grapevine cultivar identification. BMC Plant Biol.. 11: 153
- Choi R, Yu JH, Hong SM, Kim KM, Jung HY, Mo Y, et al. 2022. identification of korean wheat cultivars using multiplex STS-SSR markers. Korean. J. Breed. Sci.. 54: 119-129.
- Clevenger J, Chu Y, Chavarro C, Agarwal G, Bertioli DJ, Leal-Bertioli SCM, et al. 2017. Genome-wide SNP geno-typing resolves signatures of selection and tetrasomic recombination in peanut. Mol Plant.. 10: 309-322.
- Han SI, Bae SB, Ha TJ, Lee MH, Jang KC, Seo WD, et al. 2011. The development and selection of SSR markers for identification of peanut (Arachis hypogaea L.) varieties in Korea. J. Breed. Sci.. 43: 133-138.
- He G, Meng R, Gao H, Guo G, Gao G, Newman M, et al. 2005. Simple sequence repeat markers for botanical varieties of cultivated peanut (Arachis hypogaea L.). Euphytica. 142: 131-136.
- Ishikawa T, Hayashi A, Nagamatsu S, Kyutoku Y, Dan T, Wada T, et al. 2018. Classification of strawberry fruit shape by machine learning. ISPRS Archives. 42: 463-470.
- Janila P, Nigam SN, Pandey MK, Nagesh P, Varshney RK. 2013. Groundnut improvement: use of genetic and geno-mic tools. Front Plant Sci.. 4: 23
- Korir NK, Han J, Shangguan L, Wang C, Kayesh E, Zhang Y, et al. 2013. Plant variety and cultivar identification: ad-vances and prospects. Crit. Rev. Biotechnol.. 33: 111-25.
- McKinney W. 2010. Data Structures for Statistical Computing in Python. In Proceedings of the 9th Python in Science Conference.. 445: 51-56.
- McKinney W. 2011. pandas: a foundational Python library for data analysis and statistics. Python for high performance and scientific computing.. 14: 1-9.
- Park JW, Park JS, Jeong CY, Kwon HG, Kang SK, Kim SW, et al. 2022. Identification of domesticated silkworm va-rieties using a whole genome single nucleotide polymor-phisms-based decision tree. J. Life Sci.. 32: 947-955.
- Park YO, Chio ST, Son JY, Kim EG, Ahn GH, Park JH, et al. 2020. The application of Single Nucleotide Polymorphism markers for discrimination of sweet persimmon cultivars. J. Life Sci.. 30: 614-624.
- Pedregosa F, Varoquaux G, Gramfort A, Michel V, Thirion B, Grisel O, et al. 2011. Scikit-learn: Machine Learning in Python. J Mach Learn Res.. 12: 2825-2830.
- R CoreTeam.2021. R: A language and environment for statistical computing, R Foundation for Statistical Computing. Vienna. Austria.
- Ren X, Zheng Y, Huang K, Chen Y, Zhou X, Chen W, et al. 2016. Selection of core SSR markers and identification of fingerprint on peanut cultivars. Chinese Journal of Oil Crop Sciences.. 38: 563-571.
- Ropelewska E. 2021. The application of machine learning for cultivar discrimination of sweet cherry endocarp. Agri-culture.. 11: 6
- Tang W, Lin J, Wang Y, An H, Chen H, Pan G, et al. 2022. Selection and validation of 48 KASP markers for variety identification and breeding guidance in conventional and hybrid rice (Oryza sativa L.). Rice.. 15: 48
- Tarca AL, Carey VJ, Chen XW, Romero R, Drăghici S. 2007. Machine learning and its applications to biology. PLoS Comput. Biol.. 3: 116
- Torkzaban B, Kayvanjoo AH, Ardalan A, Mousavi S, Mariotti R, Baldoni L, et al. 2015. Machine learning based classification of microsatellite variation: an effective approach for phylogeographic characterization of olive populations. PLoS ONE.. 10: 0143465
- Van Der Walt S, Colbert SC, Varoquaux G. 2011. The NumPy array: a structure for efficient numerical computation. Comput Sci Eng.. 13: 22-30.
- Woo JK, Yun SH, Yi KU, Park YC, Lee HY, Kim M, et al. 2020. Identification of citrus varieties bred in korea using microsatellite markers. Hortic. Sci. Technol.. 38: 374-384.