Abstract
Genetic variability and correlation analysis are fundamental references for the innovative development of breeding programs to improve varieties and desirable traits. In the present study, the correlation and path analysis was conducted to understand the association among yield, micronutrients (iron and zinc), and protein content under aerobic conditions in local rice landraces from various agro ecological regions of Karnataka, India. The grain yield per plant showed a significant positive correlation with plant height, the tiller number, spikelet fertility, flag leaf length, and test weight. The zinc content was negatively correlated with grain yield per plant. The phenotypic path-coefficient analysis revealed that the total number of tillers, grain length, test weight, and harvest index exhibited a positive direct effect on grain yield per plant, while Grain protein content showed a low direct effect on this trait. This study also indicated that harvest index, flag leaf length, spikelet fertility, and test weight could be considered to make for a higher yield.
-
Key words: Rice (Oryza sativa L.), Correlation, Path coefficient, Micronutrients, Grain yield
INTRODUCTION
Rice (
Oryza sativa L.) is one of the most important grains for global nutrition and the primary source of energy for people in Asia, Africa, and Latin America (
Fukagawa and Ziska 2019). Worldwide, more than 3% of the agriculture area (162 million ha) was used for rice culture and pro-duced 755 million tons (
FAOSTAT 2021). India comprised more than 25% of the rice culture area of the world and is the world’s second-biggest rice producer. This crop also plays an important role in the food supply and country’s food security in India. (
Rathna Priya et al. 2019).
The genetic diversity of rice is rich with numerous rice cultivars are grown in more than 100 countries, and in India, there were 6000 varieties, which has been found (
Muthayya et al. 2014). Variability in genotypes for yield, and grain nutrition depends on varieties (
Rathna Priya et al. 2019). Genetic richness in germplasm plays a vital role in favorable alleles integration and leads to desired modified selection. A deep understanding of genetic diversity is required for agriculture development in general and espe-cially in breeding. For the selection of expected pheno-type in segregating generations, the inborn trait deviation is the key.
The majority of concern interest traits are complicated and depend on the interaction and synergetic effects of different components. Asante, Adjah, and Annan-Afful (2019) studied on the yield of plants are positive correla-tions with various factors as, days to flowering, plant height, flag leaf length to width ratio, number of grains per panicle, tillers and panicles per hill, spikelet per panicle, panicle length, and spikelet fertility. Moreover, many studies showed that the micronutrient elements (N, P, K, Na, Mg, Cu, Fe, Zn) correlated positively and significantly with protein percentage in rice (
Sha et al. 2017;
Al-Daej 2022). Understanding the relationships among its com-ponents, yield, and grain nutrition are of predominant importance for utilizing these relationships to obtain desired modification and is suggested for a further recombinant breeding program.
The information derived from the correlation coefficient between yield, and its components have always been helpful as a basis for the selection of the need for nutrition requirement and high grain yield in breeding programs. Besides, the relationships among these traits could be visualized directly and indirectly in a more meaningful way by path correlation coefficient. The present research was undertaken to find out the association and path analysis of diverse aspects for the contribution of yield, and grain micronutrients on grain yield in rice accessions.
MATERIALS AND METHODS
Plant materials
The plant materials used in the study consisted of 50 local landraces and 5 checks of rice, collected from distinct Karnataka agro-ecological regions, India, and maintained in the Department of Genetics and Plant Breeding, Univer-sity of Agricultural Science (UAS), Bangalore (
Table 1). The genetic variability parameter for rice grain yield and its related traits of these landraces were evaluated at the experimental plots of the Department of Genetics and Plant Breeding, ‘K’ block, UAS, Gandhi Krishi Vignna Kendra (GKVK), Bengaluru.
The 50 landraces and 5 checks (MAS 946-1, MAS 26, HP1, HP7 and HP9) were sown in Randomized Complete Block Design with two replications. The spacing of 25 cm between rows and 20 cm between plants was followed.
Data observations
For each trait, data from each plant and the means of the five plants were observed and recorded (
IRRI 1980). The 16 characters observed are as shown as follows: Date of sowing, days to 50% flowering, plant height at 60 days after sowing (cm), plant height at 90 days after sowing (cm), number of tillers per plant at maturity, number of pro-ductive tillers per plant, panicle traits, panicle length (cm), number of spikelets per panicle, grain quality traits, grain length (mm), grain breadth (mm), grain L: B ratio, test weight (g), grain yield per plant (g), harvest index (%).
The crude protein, Iron, and zinc content was estimated by Near-infrared reflectance spectroscopy (NIR system, Broker, Denmark). This absorption measurement technique is quick and non-harmful that characterizes different bio-logical compositions based on molecular vibrations caused by Infrared radiation (
Yuan et al. 2013).
Phenotypic coefficients of correlation among experi-mental characters were calculated based on Burton and Devane’s formula (1953) as follows:
Where, Px: Phenotypic co-variance of traits x, Py: Pheno-typic co-variance of traits y, Vpx: Phenotypic variance of traits x, Vpy: Phenotypic variance of traits y, rp(x,y): phenotypic correlation co-efficient of traits x and y.
The calculated value of ‘r’ and the table ‘r’ value from Fisher and Yates were compared with n-2 degree of freedom (n: number of pairs of observations) at 5% and 1% of statistically significance.
Where, rij = mutual association between the independent character i (yield related trait) and dependent character, j (yield) as measured by the genotypic correlation coefficient; Pij is components of direct effect of the independent character (i) on the dependent character (j) as measured by the genotypic path coefficients; and Σrikpkj = summation of components of indirect effects of a given independent characters (i) on the given dependent character (j) via all other independent characters (k). Whereas the contribution of the remaining unknown characters are measured as the residual which is calculated as:
The scale of the strength of indirect and direct values was established based on Lenka and Mishra (1973) where very strong represents more than 1, strong represents 0.3-0.9, medium represents 0.2-0.29, weak represents 0.1-0.19, less than 1 represents neglected.
RESULTS
Correlation analysis under aerobic condition
The variance analysis revealed that the genotypes of all studied components had highly significant differences among them. The phenotypic correlation coefficients of different characters in local landraces grown under aerobic condition were researched to discover the nature of the association (
Table 2;
Figs. 1 and
2).
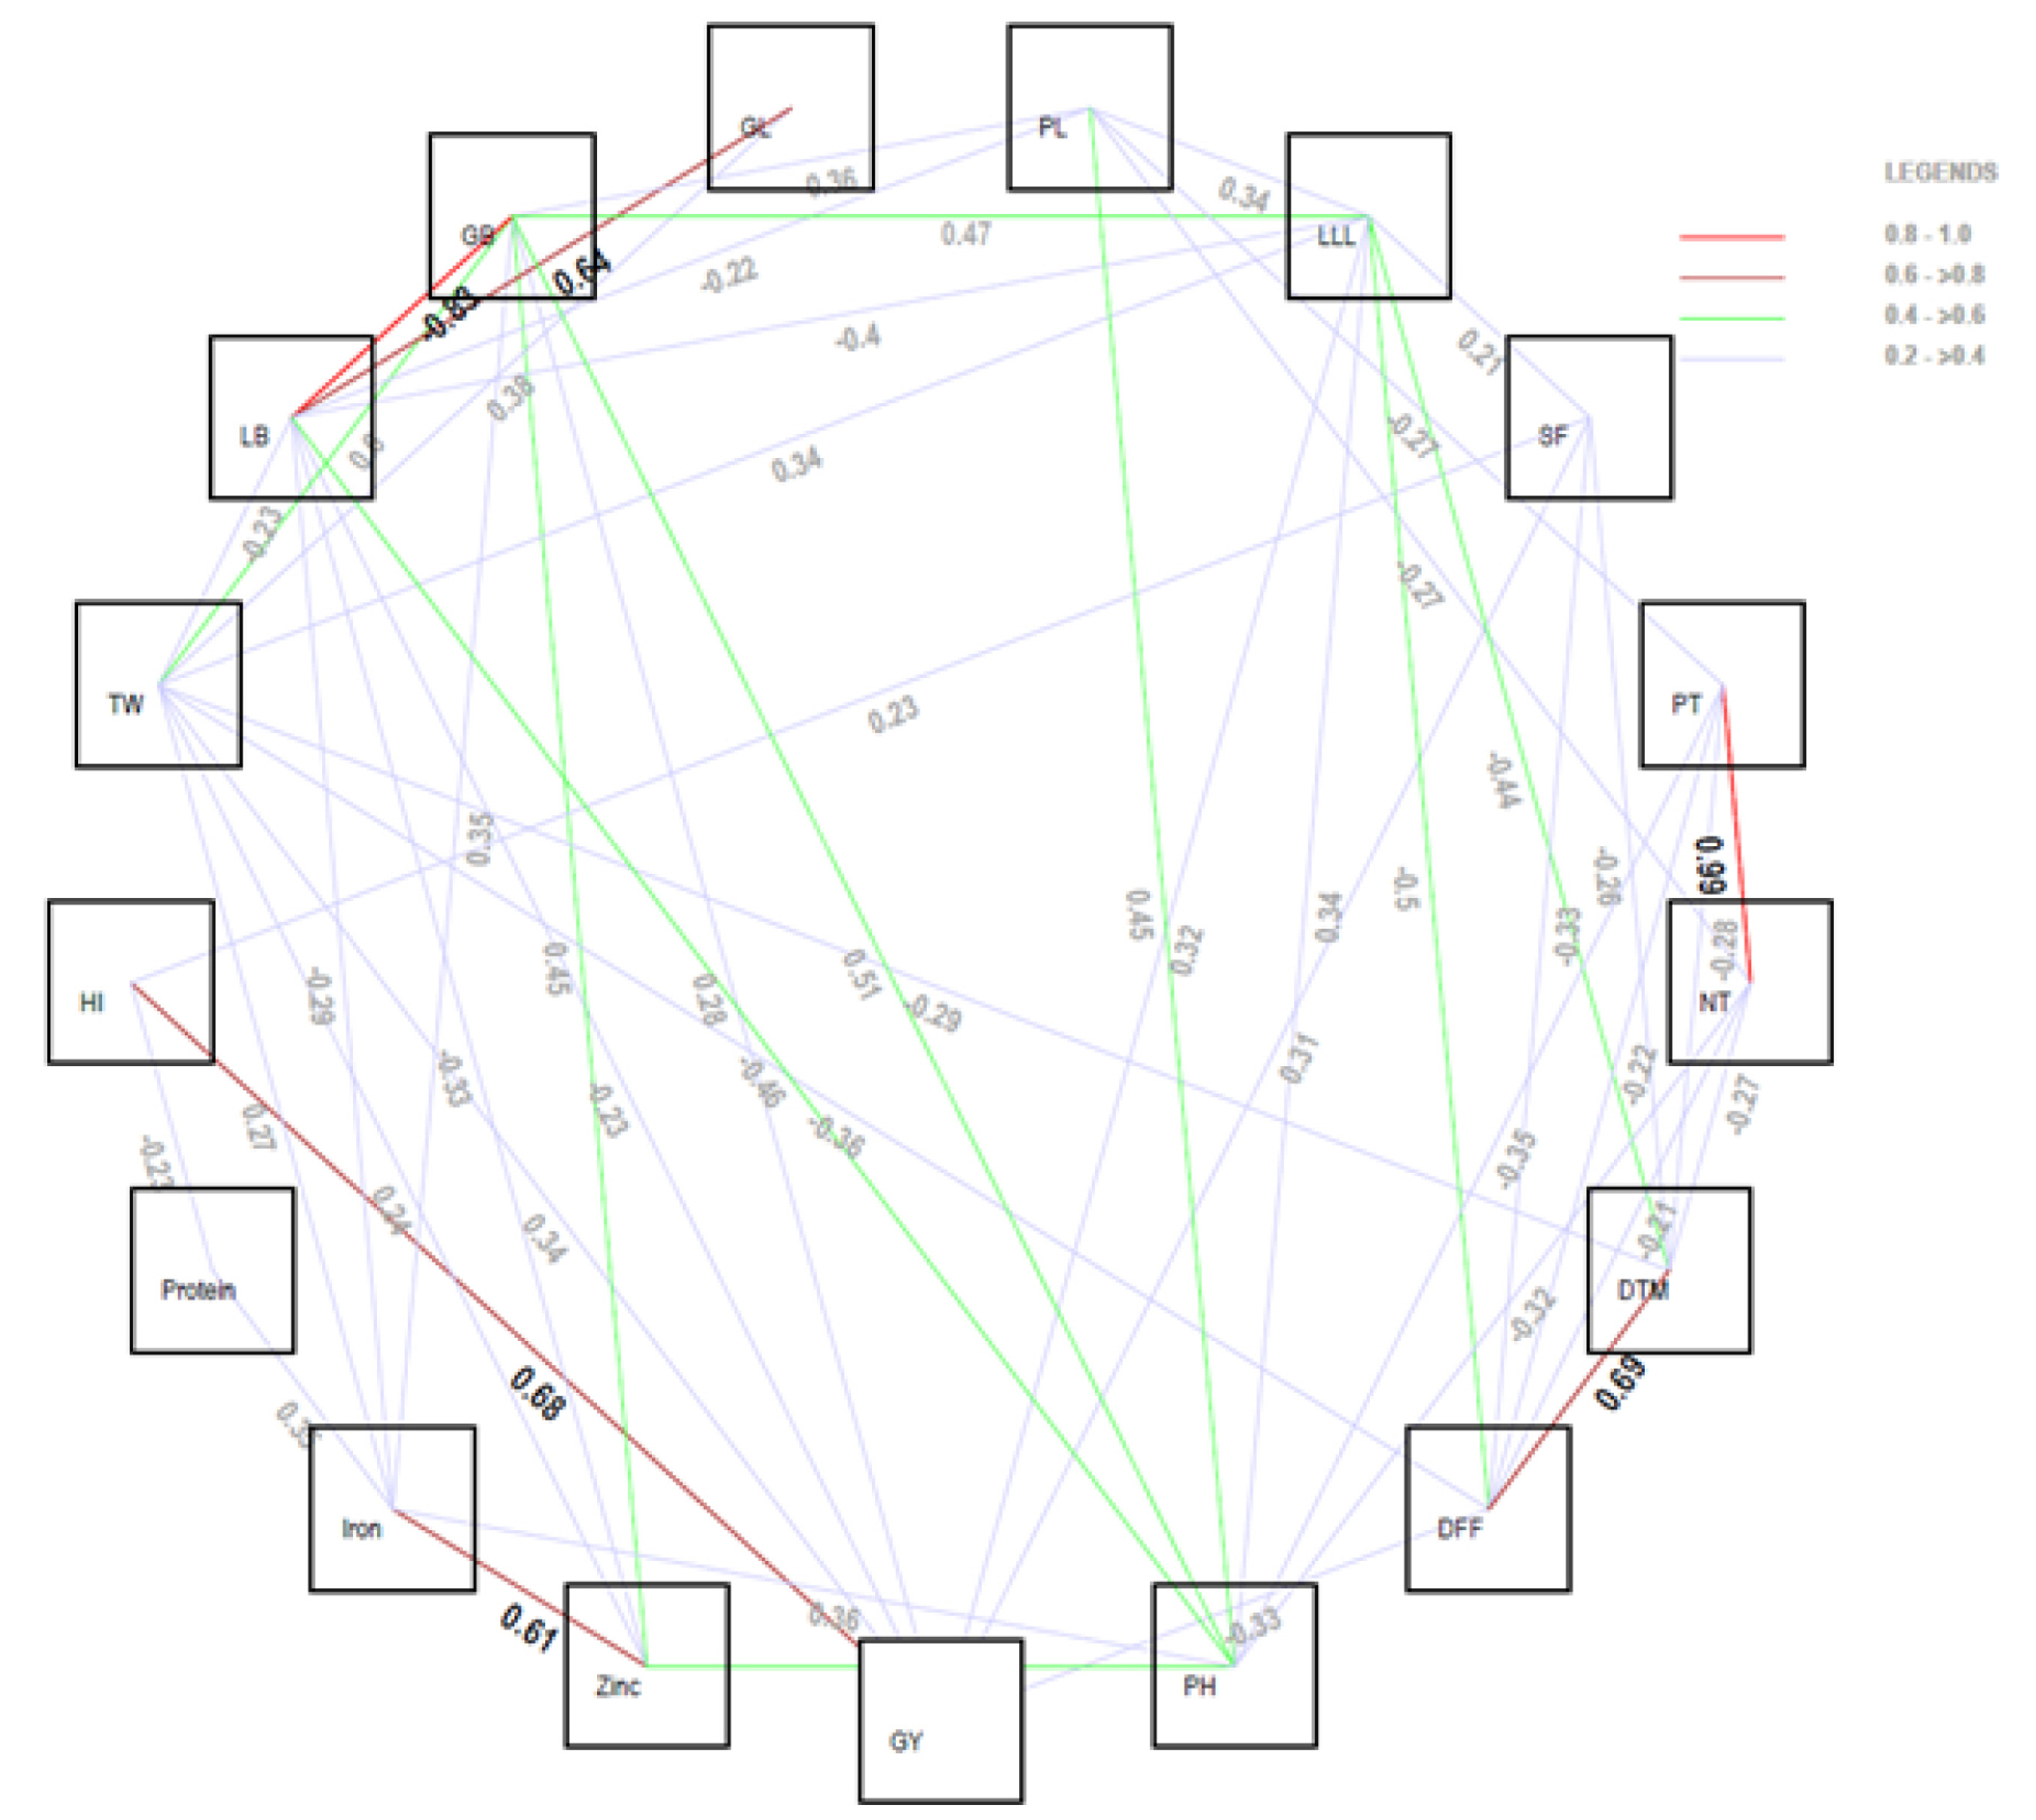
The results showed that grain yield per plant had a significant positive correlation with a total number of tillers (0.05), plant height (0.03), spikelet fertility (0.31), flag leaf length (0.32), zinc content (0.03), harvest index (0.68), test weight (0.34), but significantly and negatively correlated with day to maturity (‒0.12), day to 50 percent flowering (‒0.34), and protein content (‒0.09). The positive signifi-cant correlation of plant height with panicle length (0.45), and flag leaf length (0.34), was observed. However, plant height was a negative significant correlation with the num-ber of productive tillers (‒0.35), the total number of tillers (‒0.32), and L/B ratio (‒0.46). The positive significant correlation between days to 50% flowering with days to maturity (0.69) was recorded. A negative significant correlation of days to 50% flowering with a total number of tillers (‒0.21), spikelet fertility (‒0.33), number of pro-ductive tillers (‒0.22), test weight (‒0.36), and the length of flag leaf (‒0.49) was recognized Furthermore, there was no significant correlation found between grain yield per plant with days to 50% flowering. A negative significant correlation of days to maturity with the total number of tillers (‒0.27), number of productive tillers (‒0.28), flag leaf length (‒0.44), spikelet fertility (‒0.26), and test weight (‒0.29) were detected. Days to maturity with grain yield per plant were not significantly correlated. A positive significant correlation between the total number of tillers with the number of productive tillers (0.99), but a negative significant correlation between panicle length and the total number of tillers (‒0.27) was detected. A significant cor-relation was found between the total number of tillers and grain yield per plant. Productive tillers had no significant correlation with grain breadth (‒0.19) and panicle length (‒0.27), and no significant correlation with grain yield per plant. Spikelet fertility was significantly and positively correlated with flag leaf length (0.21), harvest index (0.23), and test weight (0.19). The correlation between spikelet fertility with grain yield per plant was determined. Flag leaf length showed a positive significant correlation with test weight (0.34), grain breadth (0.47), panicle length (0.34), and grain yield per plant (0.32), but was not significantly correlated with length/breadth ratio (‒0.39). Panicle length had a positive significant correlation with grain breadth (0.36), and a negative significant correlation with length/ breadth ratio (‒0.22). There was no significant correlation found between panicle lengths with grain yield per plant. Grain length had a positive significant correlation with the length/breadth ratio (0.64) and test weight (0.38). The correlation between grain breadth with test weight was significant and positive (0.60). However, the correlation between grain breadth with the length/breadth ratio was significant and negative (‒0.83). Test weight had a negative significant correlation with the length/breadth ratio (‒0.23) and there was a significant association with grain yield per plant.
The correlation between grain protein content and iron content was positive and significant (0.35), but a negative significant correlation with the harvest index had been observed (‒0.23). There was a positive significant correla-tion on iron content with analyzed chacracters that included zinc content (0.61), plant height (0.36), grain breadth (0.35), and test weight (0.28), but had a negative significant correlation with length/breadth ratio (‒0.29). Zinc content has a positive effect on plant height (0.52), test weight (0.24), grain breadth (0.45), and. However, it had a signifi-cant negative effect on grain length and breadth ratio (‒0.33).
Path-coefficient analysis
The results of the path coefficient analysis of growth and yield characters on grain nutrients under aerobic conditions are presented in
Table 3 and
Fig. 3. The highest positive direct effect on the grain yield per plant was the harvest index (0.6283) whereas, the lowest positive direct effect on grain yield per plant was zinc (0.0567). Protein had a ne-glected on grain yield per plant. Among studied traits, the highest negative direct effect on grain yield per plant was L/B ratio (‒0.9070) whereas, the lowest negative direct effect on grain yield per plant was plant height (‒0.0236). Iron had a weak and negative direct effect on grain yield per plan (‒0.1047).
The highest positive indirect effect on grain yield per plant via L/B ratio was plant height (0.0108), whereas the lowest positive indirect effect was plant height via protein (0.0012). The plant height on grain yield had the highest negative indirect effect via zinc (‒0.0123), while via har-vest index was at the bottom of the indirect negative effect (‒0.0001). The days to 50% flowering had neglected in the direct impact on grain yield and the highest positive via flag leaf length (0.0715) and also neglected but the lowest posi-tive via protein (0.0065), whereas it was the highest negative and neglected via days to maturity (‒0.0996) and the lowest negative and neglected via panicle length (‒0.0001). The days to maturity on grain yield via each of the days had indirect impact of 50% flowering at a positive weak level (0.1376). Whereas it was the highest negative and weak via flag leaf length (‒0.0884) and neglected via Iron (‒0.0049). The total number of tillers on grain yield via the number of productive tillers was strong and positive (0.4374), whereas a weak and negative via plant height of the analyzed traits (‒0.1423) had been recorded. The panicle number per plant on grain yield was positive and weak indirect effect via plant height (0.1502), while via the number of productive tillers was strong and negative (‒0.4249). The spikelet fertility showed a positive neglected indirect effect on grain yield and was positively neglected via harvest index (0.0137), whereas it was neglected and negative via days to 50% flowering (‒0.0197). The flag leaf length had an indirect effect on grain yield and it was positively neglected via grain breadth (0.0708), whereas via days to 50% flowering was at a negative neglected level (‒0.0752). The panicle length had an indirect effect on grain yield via each of the total numbers of tillers and it was neglected and the highest positive (0.0326). Whereas the highest negative and neglected was via plant height (‒0.0533). The positive and weak indirect effect of grain length on grain yield was via the L/B ratio (0.1906), while neglected and negative via the number of productive tillers (‒0.0401). The grain breadth on grain yield had an indirect effect and it was positive and strong via the L/B ratio 0.6426, while strong and negative via test weight (‒0.4627). The indirect effect of L/B ratio on grain yield via each grain breadth was strong and the highest positive 0.7552. Whereas it was the highest negative and neglected via grain length (‒0.0533). The indirect impact of test weight on grain yield via each grain breadth was medium and the highest positive (0.2656). Whereas it was the highest negative and weak via grain length (‒0.1613). The indirect impact of the harvest index on grain yield was positive and weak via spikelet fertility 0.1429, while weak and negative via protein (‒0.1451).
The indirect impact of protein on grain yield was positive via other studied characters and neglected via each of the total numbers of tillers (0.0090), number of produc-tive tillers (0.0111), flag leaf length (0.0017), grain length (0.0081), grain breadth, L/B ratio (0.0026), test weight (0.0075), Iron (0.0283), Zinc (0.0145), while negative via plant height (‒0.0040), days to 50% flowering (days) (‒0.0036), days to maturity (‒0.0135), spikelet fertility (‒0.0115), and panicle length (‒0.0071).
The indirect impact of iron on grain yield via, spikelet fertility (0.0028), each of the days to maturity (0.0026), panicle length (0.0011), grain length (0.0031), L/B ratio (0.0301), and harvest Index (0.0182) was neglected and posi-tive, but neglected and negative via plant height (‒0.0379), days to 50% flowering (‒0.0018), total numbers of tillers (‒0.0053), number of productive tillers (‒0.0044), flag leaf length (‒0.0142), grain length (‒0.0366), test weight (‒0.0288), protein (‒0.0371), and Zinc (‒0.0634).
The indirect impact of Zinc on grain yield was positively neglected via days to 50% flowering (0.0042), flag leaf length (0.0006), days to maturity (0.0100), panicle length (0.0093), grain length (0.0034), plant height (0.0296), grain breadth (0.0256), test weight (0.0137), protein (0.0103), Iron (0.0343), whereas it was neglected and negative via total numbers of tillers (‒0.0020), spikelet fertility (‒0.0039), number of productive tillers (‒0.0026), L/B ratio (‒0.0189), and harvest index (‒0.0042).
DISCUSSION
Correlation analysis under aerobic condition
The prime economic trait, grain yield per plant cor-related significantly and positively with all most traits. Therefore, the selection of such characters will indirectly enhance the grain yield. The associations between yield and other traits including the number of effective tillers per hill, plant height, flag leaf length, spikelet sterility percen-tage, number of filled spikelets per panicle, and harvest index were also revealed by
Faysal et al. (2022). These traits would be efficient for enhancing the yield, and the yield of rice in future breeding programs would be increased. Furthermore, test weight and grain yield showed positive correlation (
Nagesh et al. 2013). Various research also indicated that grain yield was correlated negatively and significantly with protein content (
Anandan et al. 2011).
Anusha et al. (2021) Under limited water conditions the grain Zn was positively correlated with grain yield (
Anusha et al. 2021). However,
Dixit et al. (2019) and
Inabangan-Asilo et al. (2019) reported that high negative correlations between grain zinc content grain and the yield was observed. The negative correlation of grain yield with day to 50% flowering indicates that grain yield can be improved by selecting early maturing lines, the grain yield can be boosted and this was indicated by the negative correlation between day to 50% flowering and grain yields.
The report is also similar to the findings of Soujanya
et al. (2020), and
Srijan et al. (2016) which showed significant and positive associations between panicle length and plant height. The days to 50% flowering correlated positively with days to maturity, which was reported by
Islam et al. (2016) but grain yield per plant had no significant correlation with days to 50% flowering. These results are also in agreement with the report of
Kahani and Hittalmani (2015) that showed days to maturity is a negative signifi-cant correlation with the number of productive tillers, the total number of tillers, spikelet fertility, flag leaf length, and test weight. On the other hand,
Bhutta et al. (2019) reported that under drought stress spikelet fertility had a non-significantly correlation to yield/plant. The flag leaf length correlated positively and significantly with grain yield per plant, but negatively and significantly with the L/B ratio (‒0.39). This conformed with the results of
Panja et al. (2017), for grain yield per plant in their studies. Besides that, the results were similar to that of
Dixit et al. (2019) who claimed that zinc content and plant height had a highly significant positive correlation. The similarity in the research reported that grain zinc concentration signi-ficantly and positively correlated with grain iron concen-tration (
Nagesh et al. 2013;
Ajmera et al. 2017). This correlation indicated the opportunity for simultaneous enhancement of both traits. The pleiotropic effect of genes or the regulation of the physiology of iron and zinc by tightly linked genetic stock co-segregation would be ex-planations for this case.
In the present study, these rice characters mentioned above have also been reported by earlier scientists (
Karim et al. 2014;
Kumar et al. 2017;
Bhutta et al. 2019;
Saleh et al. 2020). The correlation response in certain characters could lead to the selection of the expected characters, and the understanding of the relationship among traits would assist in the suitable selection process (
Gonçalves et al. 2017). Generally, one or two desired traits could be selected at the same time, so a deep understanding of the effect of these traits on other characters was required. For example, yield improvement could be achieved by the genotype development with long panicle length and high number of panicles (Singh and Nandan 2010). Moreover, knowledge about the correlation between various characters with grain yield per plant, which is the most important target character, is required. By using this knowledge, this critical trait could be obtained by selecting easily observable traits. Our research results confirmed that essential yield- related traits are spikelet fertility, the total number of tillers, plant height, test weight, and flag leaf length, and they could be used as selection standards for rice grain yield enhancement.
Knowledge of the association among phenotypic cha-racters and their effect on yield would be essential for selecting desired lines to be integrated with a breeding programme and for releasing new varieties (
Dhavaleshvar et al. 2019). The direct and indirect impacts among yield and yield-related components could be positive or negative, but the direct impact of that particular character and indirect impact via other components could be pointed out. Therefore, the determination of the path coefficient is crucial, so the correlation of these impacts could be observed partially and revealed the root and relationship that exist between yield-related elements and yield. In the present study, path coefficient analysis was carried out at the phenotypic level for sixteen traits which showed a signi-ficant correlation with grain yield per plant. Among the characters studied, days to maturity, total numbers of tillers, spikelet fertility, flag leaf length, grain length, harvest index, test weight, protein, and zinc affected directly, posi-tively, and significantly grain yield per plant. Consequently, rice grain yield enhancement could be obtained by selec-ting those characters. Positive direct effects of various traits on grain yield reported in the present research are in agreement with the findings of Yadav
et al. (2017) for the number of tillers per plant,
Faysal et al. (2022) for harvest index and test weight,
Saleh et al. (2020) for days to heading and 1000 grain weight. Our results are in accor-dance with the results of
Sarwar et al. (2015) which confirmed that the days to maturity affected directly yield per plant, and the relationship among them had been pointed out. Hence, yield per plant could be increased effectively by selecting direct days to maturity.
Various phenotypic traits including days to 50% flowering, plant height, panicle length, number of productive tillers, the L/B ratio, grain breadth, and iron expressed a negative direct effect on grain yield through path coefficient analysis for yield-related traits. The results proved that these characters did not have any role in enhancing grain yield per plant.
Bhutta et al. (2019) reported a negative direct effect of panicle length on grain yield under normal conditions, also confirming plant height was a negative direct effect on grain yield under drought conditions. Our studies are in agreement with the result of
Chandra and Nilanjaya (2017) which showed that various characters including the number of tillers per plant, number of spi-kelets per panicle, and days to 50% flowering effected negatively and directly on desired traits under aerobic and normal condition. Muthuvijayaragavan and Murugan (2017) also reported that a number of productive tillers were effected negatively and directly on rice grain per plant.
The correlation between two factors could be divided into indirect and direct impact through other factors based on path coefficient analysis (Wright 1921). Our results were in agreement with that of
Reetisana et al. (2022), which revealed that days to 50% flowering had a negative indirect impact on grain yield per plant via panicle length.
Saleh et al. (2020) also reported that the indirect impact of plant height on grain yield via studied traits including panicle number per plant, panicle length, and the days to heading was all neglected and negative.
In this research, the indirect and direct effects of yield contributing factors and yield were calculated. The relation-ship between the effect and a causal factor was similar to its direct effect, so the true relationship was explained and plant breeder could selected directly through this traits. However, the positive correlation could be caused by indirect effects in the case of the direct effect were negligible or negative. In that case, in the selection process, the other factors were involved simultaneously. Besides, some restrictions could be used to limit the unex-pected indirect effects in order to utilize the direct effect when the direct effect was strong and positive but the correlation was negative. For improvement of grain yield, based on the correlation and coefficient data, test weight, harvest index, flag leaf length, and spikelet fertility were essential factors, which should be considered as selection criteria.
Overall, among the local landraces, grain yield per plant showed a highly significant and positive correlation with its component traits (plant height, total number of tillers, spikelet fertility, flag leaf length, and test weight), while it exhibited a strong negative correlation with zinc content. Therefore, a separated but simultaneous selection for enhancement of these traits could be executed.
A high positive direct effect of total number of tillers, grain length, test weight, and harvest index on grain yield per plant was observed through the phenotypic path- coefficient analysis. On the contrary, grain protein content showed low direct effect on grain yield per plant. The results also revealed that the total number of tillers per plant had maximum positive direct effects as well as indirect effects on other traits, which suggested that selection based on this trait for grain yield would be most effective strategy.
It is possible to apply the selection of grain yield under aerobic condition but it needs to be postponed to later generations. Additionally, the role of number of panicles had maximum positive effect on grain yield that could be used for selection. This study assists breeders to select desirable and suitable genotypes for aerobic conditions.
ACKNOWLEDGEMENTS
Authors would like to express their thank to Department of Genetics and Plant Breeding, University of Agricultural Sciences for providing all research facilities, Vinh Long University of Technology Education and Tra Vinh Uni-versity to carry out this research work.
Fig. 1Phenotypical correlations of growth and yield characters in local landraces of rice. DFF: days to 50% flowering (days), PH: plant height (cm), DTM: days to maturity, TNT: total numbers of tillers, NPT: number of productive tillers, SF: spikelet fertility (%), FLL: flag leaf length (cm), PL: panicle length (cm), GL: grain length.

Fig. 2Shaded correlation matrix of growth and yield characters in local landraces of rice. DFF: Days to 50% flowering (days), PH: plant height (cm), DTM: days to maturity, TNT: total numbers of tillers, NPT: number of productive tillers, SF: spikelet fertility (%), FLL: flag leaf length (cm), PL: panicle length (cm), GL: grain length.
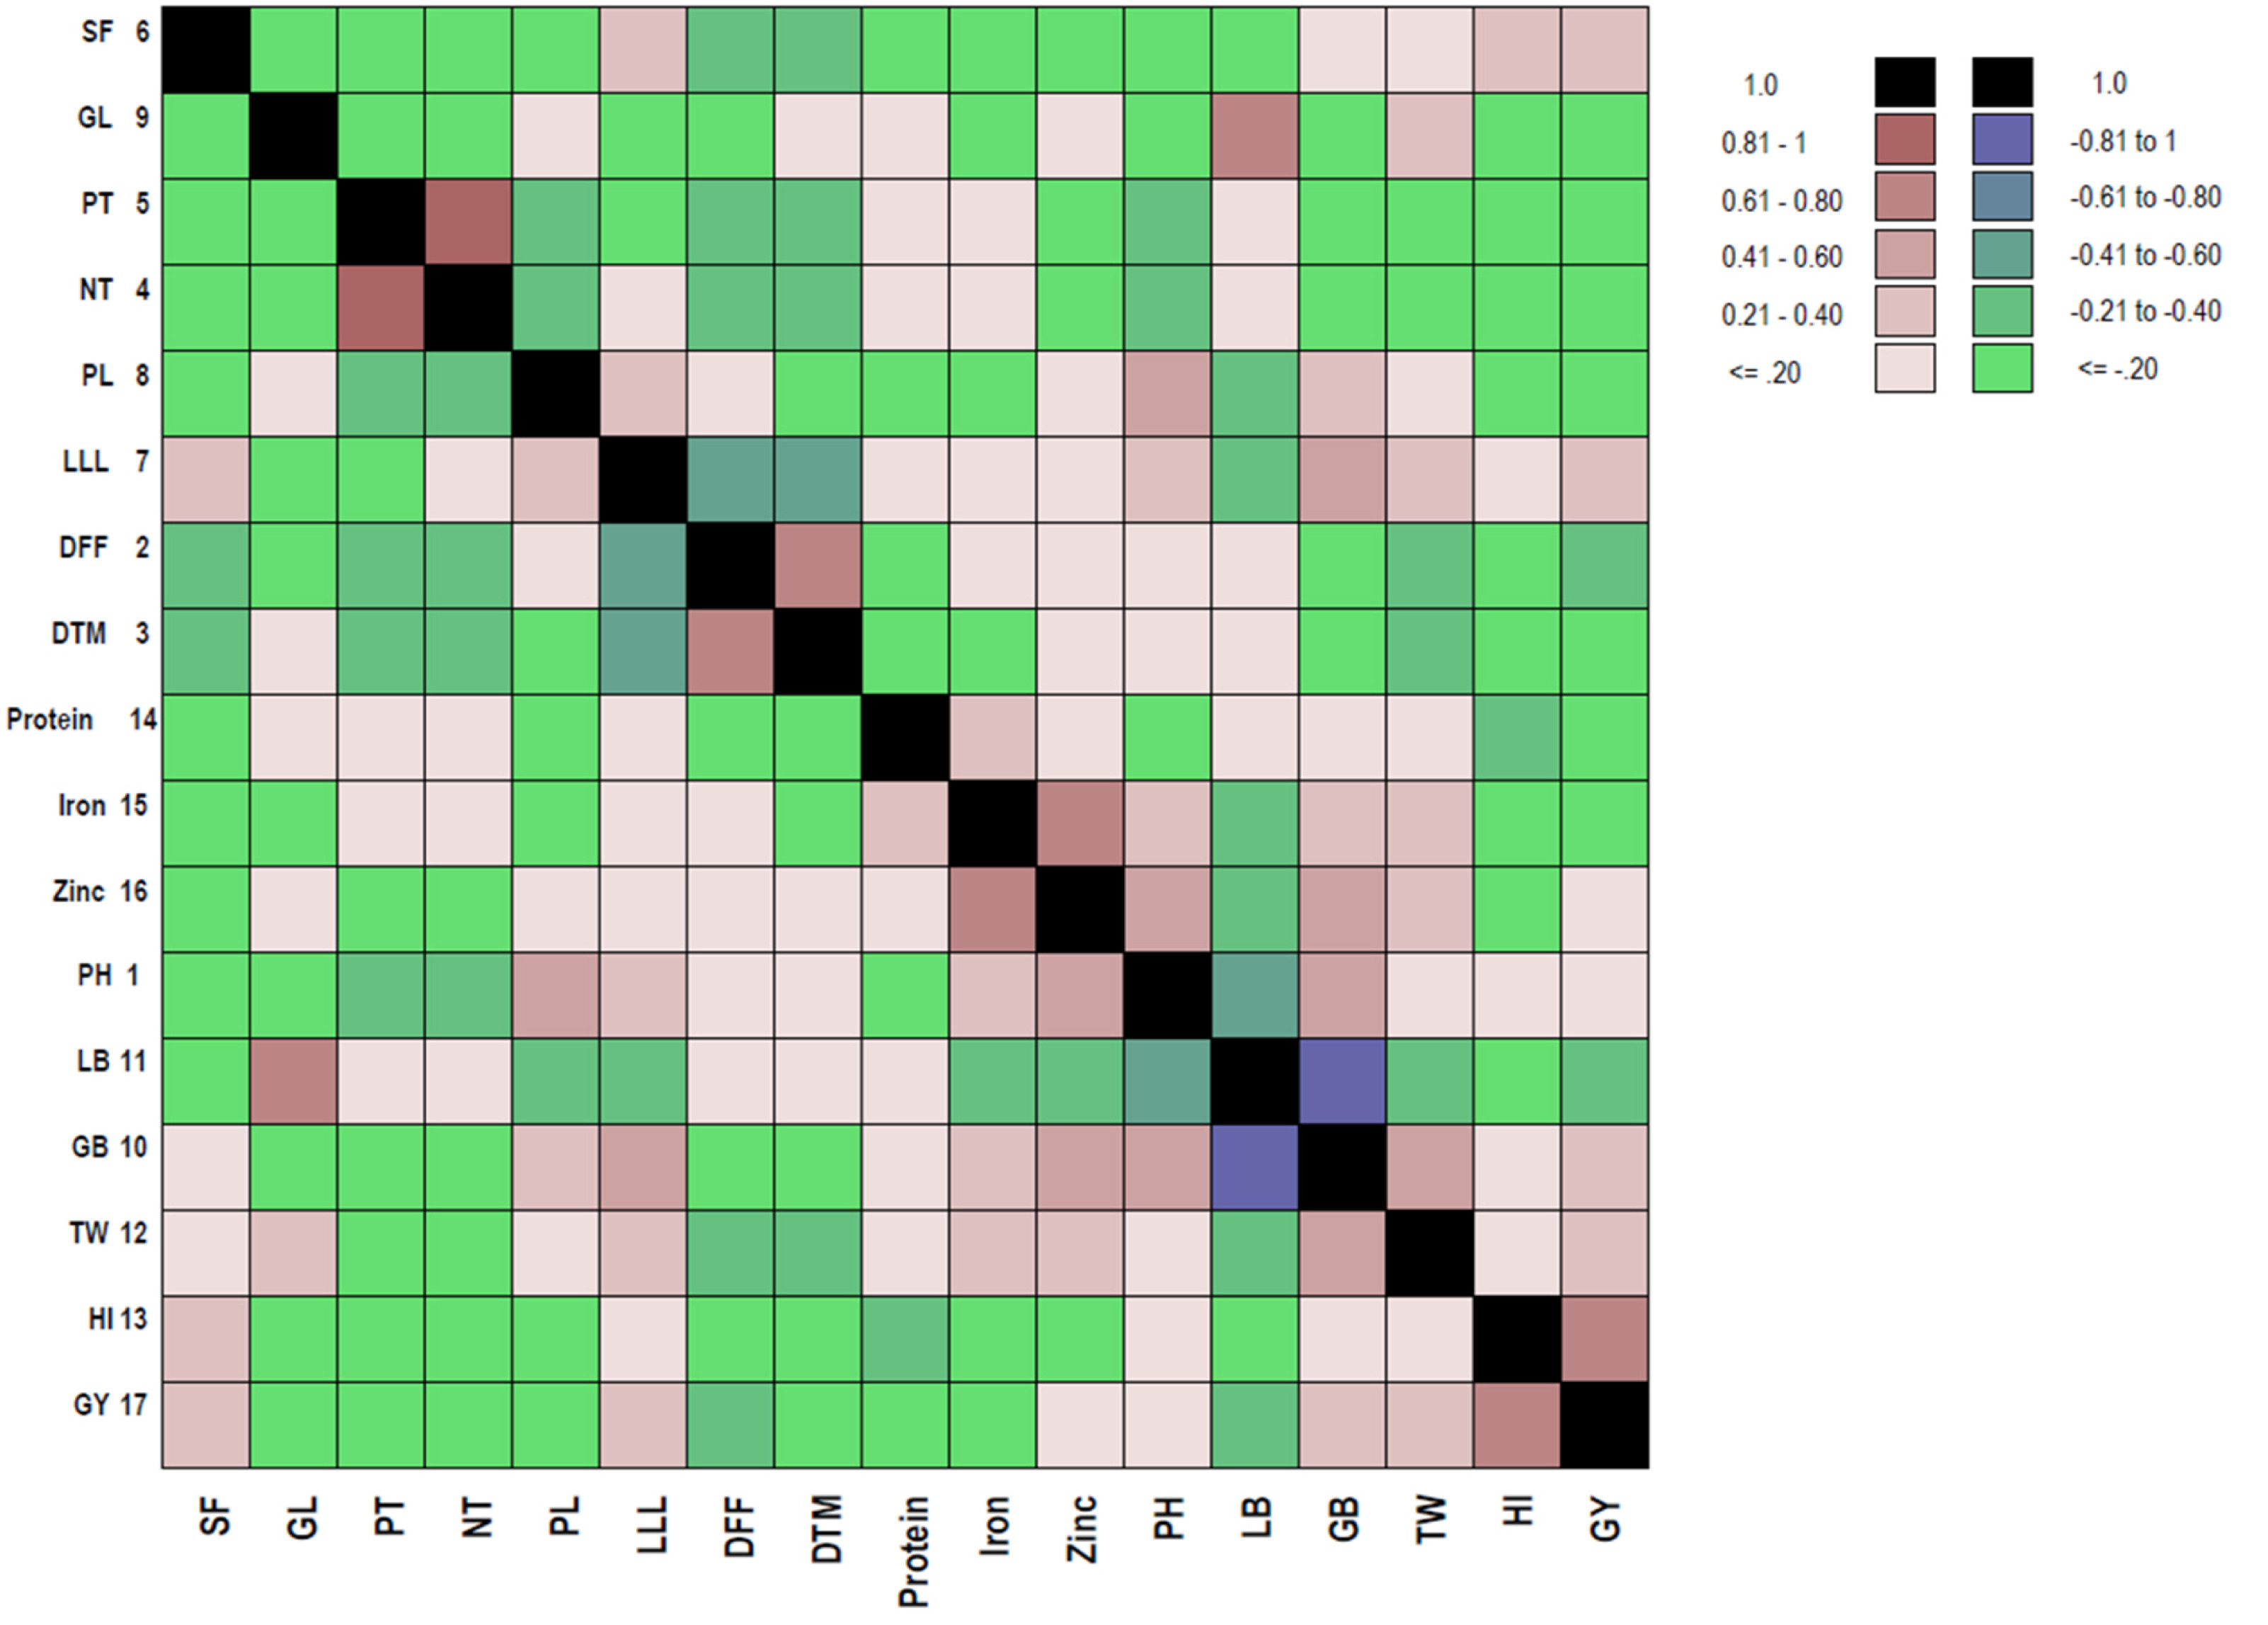
Fig. 3Phenotypical path diagram for growth and yield attributing in local landraces of rice.
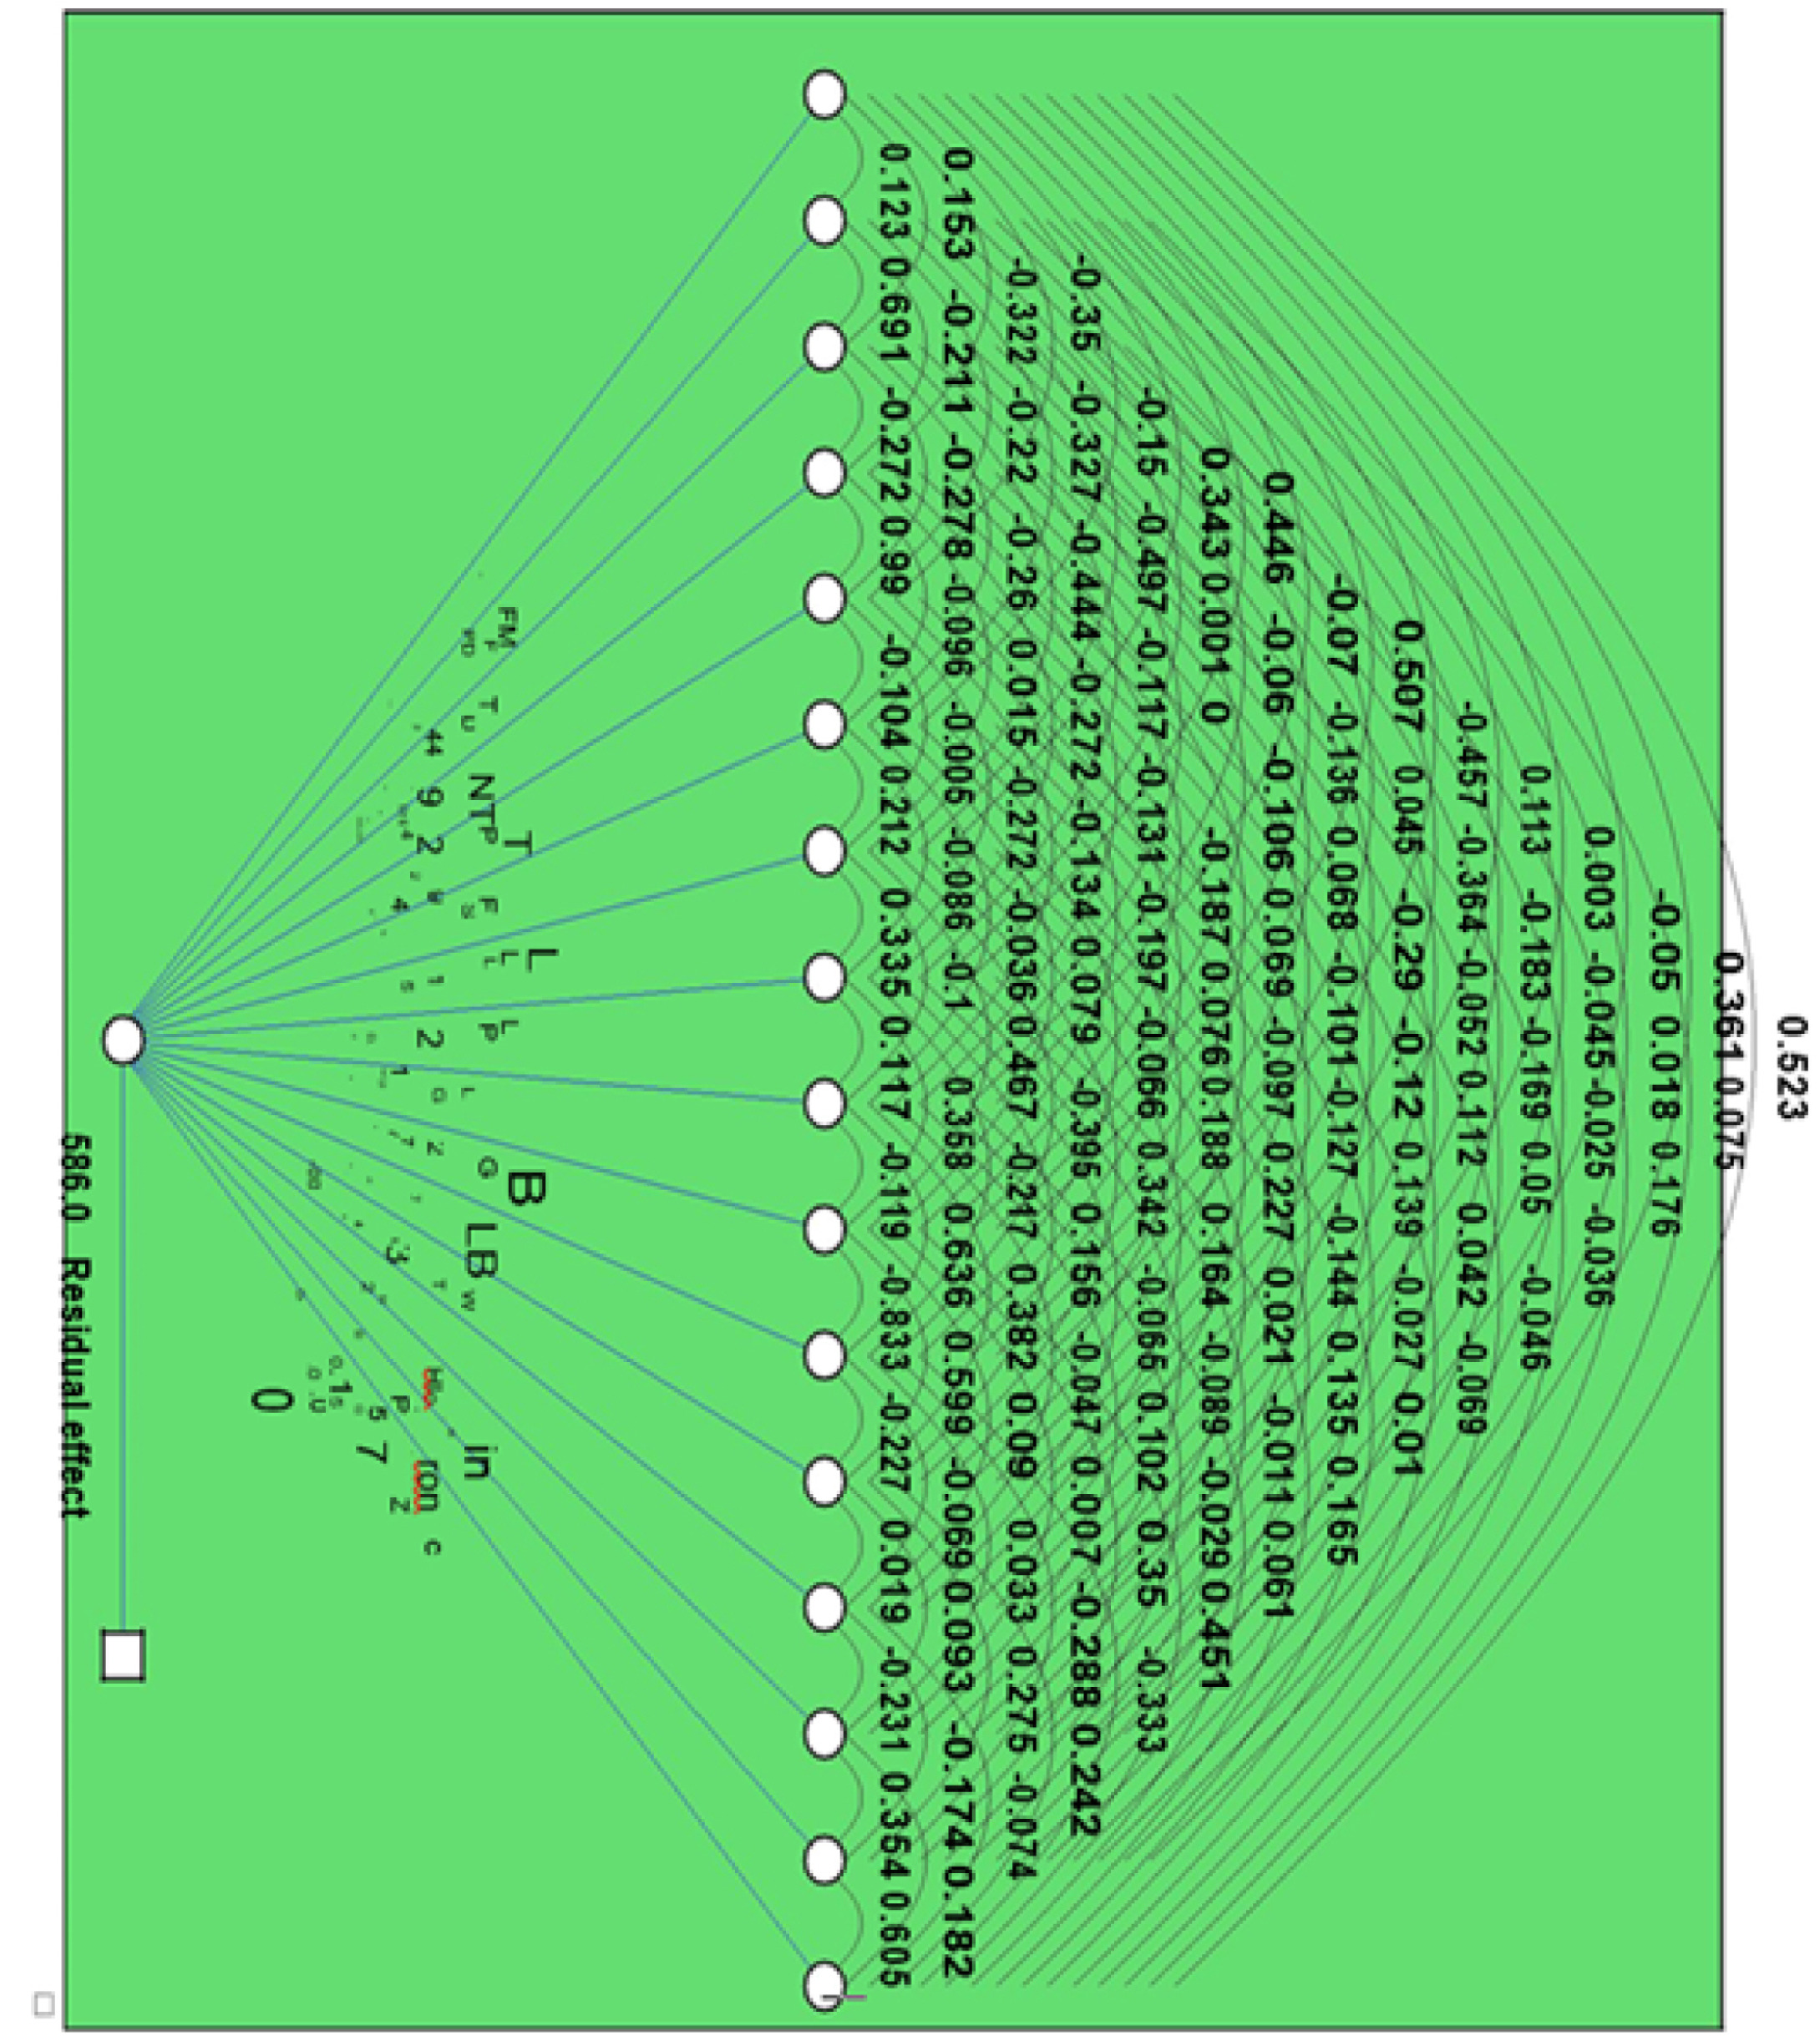
Table 1List of 50 local landraces and 5 checks used for the study.
Table 1
|
Sl. No. |
Landraces |
Sl. No. |
Landraces |
Sl. No. |
Landraces |
Sl. No. |
Landraces |
|
1 |
Alibulla |
16 |
Gowri Sanna |
31 |
Karidoddi |
46 |
Mattalaga |
|
2 |
Alugidda |
17 |
Gidda Rajakamala |
32 |
Rajmudi-1 |
47 |
Mugadhsughanda |
|
3 |
Anthrasali |
18 |
Gud Batta |
33 |
Kesarnellu |
48 |
Sannakki Batta |
|
4 |
DBN |
19 |
Halu Gidda |
34 |
Kirwana |
49 |
Neermullare |
|
5 |
Biliakki |
20 |
Howne Kattu |
35 |
Marabatta |
50 |
Sanna Mullu |
|
6 |
Biliakki-1 |
21 |
Jaddu Batta |
36 |
Neergoli |
|
Checks |
|
7 |
Bilidoddi Marthayala |
22 |
Jeerige Batta |
37 |
Malligae |
51 |
MAS 946-1 |
|
8 |
Rajmudi |
23 |
Kadullite |
38 |
Mysore Malligae |
52 |
MAS 26 |
|
9 |
Bilidoddi |
24 |
Kaduvelpe |
39 |
Putta Batta |
53 |
HP 1 |
|
10 |
Budda |
25 |
Kalajeera |
40 |
Raj Bhog |
54 |
HP 7 |
|
11 |
Coimbatore Sanna |
26 |
Kalu Mottaga |
41 |
Naga Batta |
55 |
HP 9 |
|
12 |
Dodda Batta |
27 |
Karihasali |
42 |
Navasali |
|
|
|
13 |
Dodda Mullare |
28 |
Kari Kondaga |
43 |
Sampigae Batta-1 |
|
|
|
14 |
Dodda Mullare-1 |
29 |
Kanakasali |
44 |
Sampigae Batta-2 |
|
|
|
15 |
Doddiga |
30 |
Karijaddu |
45 |
Sanesali |
|
|
Table 2Phenotypical correlationand yield characters in local landraces of rice.
Table 2
|
PH |
DFF |
DTM |
TNT |
NPT |
SF |
FLL |
PL |
GL |
GB |
L/B |
TW |
HI |
Protein |
Iron |
Zinc |
GY/P |
|
PH |
1 |
|
|
|
|
|
|
|
|
|
|
|
|
|
|
|
|
|
DFF |
0.123 |
1 |
|
|
|
|
|
|
|
|
|
|
|
|
|
|
|
|
DTM |
0.153 |
0.69***
|
1 |
|
|
|
|
|
|
|
|
|
|
|
|
|
|
|
TNT |
‒0.32***
|
‒0.21*
|
‒0.27**
|
1 |
|
|
|
|
|
|
|
|
|
|
|
|
|
|
NPT |
‒0.35***
|
‒0.22*
|
‒0.28**
|
0.99***
|
1 |
|
|
|
|
|
|
|
|
|
|
|
|
|
SF |
‒0.15 |
‒0.33***
|
‒0.26**
|
‒0.09 |
‒0.10 |
1 |
|
|
|
|
|
|
|
|
|
|
|
|
FLL |
0.34***
|
‒0.49***
|
‒0.44***
|
0.02 |
‒0.01 |
0.22*
|
1 |
|
|
|
|
|
|
|
|
|
|
|
PL |
0.45***
|
0.001 |
‒0.12 |
‒0.27**
|
‒0.27**
|
‒0.09 |
0.34***
|
1 |
|
|
|
|
|
|
|
|
|
|
GL |
‒0.07 |
‒0.06 |
0.00 |
‒0.13 |
‒0.13 |
‒0.04 |
‒0.10 |
0.12 |
1 |
|
|
|
|
|
|
|
|
|
GB |
0.51 |
‒0.14 |
‒0.11 |
‒0.19 |
‒0.19*
|
0.08 |
0.47***
|
0.36***
|
‒0.12 |
1 |
|
|
|
|
|
|
|
|
L/B |
‒0.46***
|
0.05 |
0.07 |
0.07 |
0.08 |
‒0.07 |
‒0.39***
|
‒0.22*
|
0.64***
|
‒0.83***
|
1 |
|
|
|
|
|
|
|
TW |
0.11 |
‒0.36***
|
‒0.29**
|
‒0.10 |
‒0.09 |
0.19*
|
0.34***
|
0.16 |
0.38***
|
0.59***
|
‒0.23*
|
1 |
|
|
|
|
|
|
HI |
0.003 |
‒0.18 |
‒0.05 |
‒0.12 |
‒0.13 |
0.23*
|
0.16 |
‒0.07 |
‒0.05 |
0.09 |
‒0.07 |
0.02 |
1 |
|
|
|
|
|
Protein |
‒0.05 |
‒0.05 |
‒0.17 |
0.11 |
0.14 |
‒0.14 |
0.02 |
‒0.09 |
0.10 |
0.07 |
0.03 |
0.09 |
‒0.23*
|
1 |
|
|
|
|
Iron |
0.36***
|
0.02 |
‒0.03 |
0.05 |
0.04 |
‒0.03 |
0.14 |
‒0.01 |
‒0.03 |
0.35***
|
‒0.29**
|
0.28**
|
‒0.17 |
0.35***
|
1 |
|
|
|
Zinc |
0.52***
|
0.08 |
0.18 |
‒0.04 |
‒0.05 |
‒0.07 |
0.00 |
0.17 |
0.06 |
0.45***
|
‒0.33***
|
0.24*
|
‒0.07 |
0.18 |
0.61***
|
1 |
|
|
GY/P |
0.03*
|
‒0.34*
|
‒0.12*
|
0.05*
|
‒0.06 |
0.31**
|
0.32**
|
‒0.13 |
‒0.05 |
0.280 |
‒0.23 |
0.34**
|
0.68**
|
‒0.09*
|
‒0.04 |
0.03*
|
1 |
Table 3Path analysis forand yield attributing characters in local landraces of rice.
Table 3
|
PH |
DFF |
DTM |
TNT |
NPT |
SF |
FLL |
PL |
GL |
GB |
L/B |
TW |
HI |
Protein |
Iron |
Zinc |
|
PH |
‒0.0236 |
‒0.0029 |
‒0.0036 |
0.0076 |
0.0082 |
0.0035 |
‒0.0081 |
‒0.0105 |
0.0016 |
‒0.0119 |
0.0108 |
‒0.0027 |
‒0.0001 |
0.0012 |
‒0.0085 |
‒0.0123 |
|
DFF |
‒0.0177 |
‒0.1441 |
‒0.0996 |
0.0305 |
0.0317 |
0.0471 |
0.0715 |
‒0.0001 |
0.0086 |
0.0195 |
‒0.0065 |
0.0525 |
0.0263 |
0.0065 |
‒0.0025 |
‒0.0108 |
|
DTM |
0.0304 |
0.1376 |
0.1991 |
‒0.0541 |
‒0.0553 |
‒0.0517 |
‒0.0884 |
‒0.0233 |
0.0000 |
‒0.0210 |
0.0136 |
‒0.0578 |
‒0.0103 |
‒0.0337 |
‒0.0049 |
0.0351 |
|
TNT |
‒0.1423 |
‒0.0935 |
‒0.1201 |
0.4419 |
0.4374 |
‒0.0422 |
0.0065 |
‒0.1204 |
‒0.0581 |
‒0.0826 |
0.0303 |
‒0.0447 |
‒0.0531 |
0.0496 |
0.0222 |
‒0.0158 |
|
NPT |
0.1502 |
0.0945 |
0.1192 |
‒0.4249 |
‒0.4294 |
0.0448 |
0.0023 |
0.1169 |
0.0574 |
0.0844 |
‒0.0325 |
0.0416 |
0.0545 |
‒0.0595 |
‒0.0179 |
0.0197 |
|
SF |
‒0.0091 |
‒0.0197 |
‒0.0157 |
‒0.0058 |
‒0.0063 |
0.0603 |
0.0128 |
‒0.0052 |
‒0.0022 |
0.0048 |
‒0.0040 |
0.0114 |
0.0137 |
‒0.0087 |
‒0.0016 |
‒0.0042 |
|
FLL |
0.0519 |
‒0.0752 |
‒0.0673 |
0.0022 |
‒0.0008 |
0.0321 |
0.1515 |
0.0508 |
‒0.0151 |
0.0708 |
‒0.0599 |
0.0518 |
0.0248 |
0.0032 |
0.0205 |
0.0015 |
|
PL |
‒0.0533 |
‒0.0001 |
0.0140 |
0.0326 |
0.0325 |
0.0103 |
‒0.0401 |
‒0.1195 |
‒0.0140 |
‒0.0428 |
0.0259 |
‒0.0186 |
0.0078 |
0.0107 |
0.0013 |
‒0.0197 |
|
GL |
‒0.0209 |
‒0.0178 |
0.0000 |
‒0.0394 |
‒0.0401 |
‒0.0109 |
‒0.0299 |
0.0351 |
0.2998 |
‒0.0356 |
0.1906 |
0.1145 |
‒0.0140 |
0.0305 |
‒0.0088 |
0.0181 |
|
GB |
‒0.3910 |
0.1047 |
0.0815 |
0.1442 |
0.1517 |
‒0.0609 |
‒0.3608 |
‒0.2766 |
0.0917 |
‒0.7718 |
0.6426 |
‒0.4627 |
‒0.0693 |
‒0.0056 |
‒0.2699 |
‒0.3483 |
|
L/B |
0.4147 |
‒0.0407 |
‒0.0619 |
‒0.0622 |
‒0.0687 |
0.0595 |
0.3586 |
0.1965 |
‒0.5767 |
0.7552 |
‒0.9070 |
0.2062 |
0.0623 |
‒0.0298 |
0.2610 |
0.3019 |
|
TW |
0.0500 |
‒0.1613 |
‒0.1287 |
‒0.0448 |
‒0.0430 |
0.0834 |
0.1516 |
0.0690 |
0.1693 |
0.2656 |
‒0.1007 |
0.4431 |
0.0083 |
0.0413 |
0.1217 |
0.1070 |
|
HI |
0.0018 |
‒0.1148 |
‒0.0324 |
‒0.0754 |
‒0.0798 |
0.1429 |
0.1029 |
‒0.0408 |
‒0.0293 |
0.0564 |
‒0.0432 |
0.0118 |
0.6283 |
‒0.1451 |
‒0.1092 |
‒0.0465 |
|
Protein |
‒0.0040 |
‒0.0036 |
‒0.0135 |
0.0090 |
0.0111 |
‒0.0115 |
0.0017 |
‒0.0071 |
0.0081 |
0.0006 |
0.0026 |
0.0075 |
‒0.0185 |
0.0799 |
0.0283 |
0.0145 |
|
Iron |
‒0.0379 |
‒0.0018 |
0.0026 |
‒0.0053 |
‒0.0044 |
0.0028 |
‒0.0142 |
0.0011 |
0.0031 |
‒0.0366 |
0.0301 |
‒0.0288 |
0.0182 |
‒0.0371 |
‒0.1047 |
‒0.0634 |
|
Zinc |
0.0296 |
0.0042 |
0.0100 |
‒0.0020 |
‒0.0026 |
‒0.0039 |
0.0006 |
0.0093 |
0.0034 |
0.0256 |
‒0.0189 |
0.0137 |
‒0.0042 |
0.0103 |
0.0343 |
0.0567 |
|
R² |
‒0.0007 |
0.0482 |
‒0.0232 |
‒0.0203 |
0.0248 |
0.0184 |
0.0482 |
0.0149 |
‒0.0157 |
‒0.2164 |
0.2052 |
0.1501 |
0.4241 |
‒0.0069 |
0.0041 |
0.0019 |
References
- Ajmera S, Kumar SS, Ravindrababu V. 2017. Character associa-tion analysis for grain iron and zinc concentrations and grain yield components in rice genotypes. Int. J. Pure App. Biosci.. 5: 940-945.
- Al-Daej MI. 2022. Genetic studies for grain quality traits and correlation analysis of mineral element contents on al-ahsa rice and some different varieties (Oryza sativa L.). Saudi J. Biol. Sci.. 29: 1893-1899.
- Anandan A, Rajiv G, Eswaran R, Prakash M. 2011. Genotypic variation and relationships between quality traits and trace elements in traditional and improved rice (Oryza sativa L.) genotypes. J. Food Sci.. 76: H122-H130.
- Anusha G, Sanjeeva RD, Jaldhani V, Beulah P, Neeraja CN, Gireesh C, et al. 2021. Grain Fe and Zn content, heterosis, combining ability and its association with grain yield in irrigated and aerobic rice. Sci. Rep.. 11: 1-12.
- Asante MD, Adjah KL, Annan-Afful E. 2019. Assessment of genetic diversity for grain yield and yield component traits in some genotypes of rice (Oryza sativa L.). J. Crop. Sci. Biotechnol.. 22: 123-130.
- Bhutta MA, Munir S, Qureshi MK, Shahzad AN, Aslam K, Manzoor H, et al. 2019. Correlation and path analysis of morphological parameters contributing to yield in rice (Oryza sativa) under Drought stress. Pak J Bot.. 51: 73-80.
- Burton GW, Devane EH. 1953. Estimating heritability in tall Fescue (Festuca arundinacea) from replicated clonal material. Agron. J.. 45: 478-481.
- Chandra K. Nilanjaya2017. Path coefficient analysis of yield components of rice under normal and aerobic conditions. Int. J. Bio-Resour. Stress Manag.. 8: 832-837.
- Chitanda L, Mativavarira M, Manjeru P, Kang KH, Nzuma JK, Kamunhukamwe T, et al. 2022. Performance of doubled haploid elite rice (Oryza Sativa L. ) germplasm for grain yield and associated traits in Harare. Zimbabwe. Adv. Agric. Hindawi.:
- Dewey DR, Lu KH. 1959. A Correlation and path‐coefficient analysis of components of crested wheatgrass seed pro-duction. Agron. J.. 51: 515-518.
- Dhavaleshvar M, Malleshappa C, Dushyanth-Kumar BM. 2019. Variability, correlation and path analysis studies of yield and yield attributing traits in advanced breeding lines of rice (Oryza sativa L.). Int. J. Pure. App. Biosci.. 7: 267-273.
- Dixit S, Singh UM, Abbai R, Ram T, Singh VK, Paul A, et al. 2019. Identification of genomic region(s) responsible for high Iron and Zinc content in rice. Sci. Rep.. 9: 1-8.
- FAOSTAT.2021. Food and Agriculture organization accessed June 11 2021 http://www. fao.org/faostat/en/#data/QC..
- Faysal ASM, Ali L, Azam MG, Sarker U, Ercisli S, Golokhvast KS, et al. 2022. Genetic variability, character association, and path coefficient analysis in transplant aman rice geno-types. Plants. 11: 2952
- Fukagawa NK, Ziska LH. 2019. Rice: Importance for global nutrition. J Nutr Sci Vitaminol (Tokyo).. 65: S2-S3.
- Barelli MAA, Oliveira TC, Santos PRJ, Silva CR, Poletine JP, et al. Gonçalves DL.2017. Genetic correlation and path analysis of common bean collected from Caceres Mato Grosso state, Brazil. Cienc. Rural. 47..
- Hossain S, Haque M, Rahman J. 2015. Genetic variability, correlation and path coefficient analysis of morphological traits in some extinct local aman rice (Oryza Sativa L). J. Rice. Res.. 3: 158
- Inabangan-Asilo MA, Swamy BPM, Amparado AF, Descalsota- Empleo GIL, Arocena EC, Reinke R. 2019. Stability and G× E analysis of Zinc-biofortified rice genotypes evalu-ated in diverse environments. Euphytica. 215: 1-17.
- IRRI.1980. Minimum list of descriptors and descriptor-states for rice (Oryza Sativa L). IRRI. Descriptor for Rice Oryza Sativa L. IRRI, Manila, Philippines..
- Islam MZ, Khalequzzaman M, Bashar MK, Ivy NA, Haque MM, Mian MAK. 2016. Variability assessment of aromatic and fine rice germplasm in bangladesh based on quan-titative traits. The Sci. World J..
- Kahani F, Hittalmani S. 2015. Genetic analysis and traits association in F2 intervarietal populations in rice under aerobic condition. J Rice Res.. 3: 2
- Karim D, Siddique MNA, Sarkar U, Hasnat Z, Sultana J. 2014. Phenotypic and genotypic correlation co-efficient of quan-titative characters and character association of aromatic rice. J. Biosci. Agric. Res.. 1: 34-46.
- Kumar S, Bhuvaneswari S, Devi EL, Sharma SK, Ansari MA, Singh IM, et al. 2017. Estimation of genetic variability, correlation and path analysis in short duration rice geno-types of manipur. JAS.. 4: 112-118.
- Lenka D, Misr B. 1973. Path coefficient analysis of yield in rice varieties. Indian J Agr Sci.. 43: 376-379.
- Muthayya S, Sugimoto JD, Montgomery S, Maberly GF. 2014. An overview of global rice production, supply, trade, and consumption. Ann. N.Y. Acad. Sci.. 1324: 7-14.
- Nagesh RBV, Usha RG, Dayakar RT, Surekha K, Vishnu VRD. 2013. Association of grain Iron And Zinc content with yield in high yielding rice cultivars. Oryza. 50: 41-44.
- Panja S, Garg HS, Debnath K, Sarkar KK, Mukherjee S, Bhattacharya C. 2017. Effect of water stress on different morphological traits of rice (Oryza Sativa L.) genotypes in Red & Laterite zone of West Bengal. IJABR.. 7: 419-425.
- Rathna Priya TS, Nelson ARLE, Ravichandran K, Antony U. 2019. Nutritional and functional properties of coloured rice varieties of South India: a review. J. Ethn. Food.. 6: 1-11.
- Reetisana N, Sastry EVD, Renuka T, Julia T. HP Artibashisha2022. Correlation and path coefficient analysis studies in rice hybrids (Oryza sativa L.) genotypes of Manipur. Bio. Forum - Inter. J.. 14: 972-980.
- Saleh MM, Salem KFM, Elabd AB. 2020. Definition of selection criterion using correlation and path coefficient analysis in rice (Oryza Sativa L.) genotypes. Springer. 44: 1-6.
- Sarwar G, Harun-Ur-Rashid M, Parveen S, Hossain M. 2015. Correlation and path coefficient analysis for agro- morphological important traits in aman rice genotypes (Oryza sativa L.). Adv. Bio.. 6: 40-47.
- Sha Z, Chu Q, Zhao Z, Yue Y, Lu L, Yuan J, et al. 2017. Variations in nutrient and trace element composition of rice in an organic rice-frog coculture system. Sci. Rep.. 7: 1-10.
- Soujanya T, Hemalatha V, Revathi P, Prasad MS, Yamini KN. 2020. Correlation and path analysis in rice (Oryza Sativa L.) for grain yield and its components. The J. Res. PJTSAU.. 48: 88-92.
- Srijan A, Kumar SS, Raju CD, Jagadeeshwar R. 2016. Cha-racter association and path coefficient analysis for grain yield of parents and hybrids in rice (Oryza Sativa L.). J. Appl. & Nat. Sci.. 8: 167-172.
- Yuan L, Wu L, Yang C, Qian L. 2013. Effects of Iron and Zinc foliar applications on rice plants and their grain accumu-lation and grain nutritional quality. J. Sci. Food. Agric.. 93: 254-261.