Abstract
Morphological variation was investigated among 31 maize landrace accessions collected from the fields of various farmers in South Sudan by examining 7 quantitative agronomic characteristics. A significant positive correlation was found between days to tasseling (DT) and days to silking (DS), between plant height (PH) and ear height (EH) and stem width (SW), and between EH and SW and leaf length (LL). First and second principal components accounted for 69% of the total variance (40.9% and 28.6%, respectively). PH, EH, SW, LL, and leaf width (LW) were clearly characterized in a positive direction on the first axis. DT and DS were clearly characterized in a positive direction on the second axis. A scatter plot based on phenotypic data revealed the existence of 3 groups based on the most discriminating characteristics: Group I included 5 maize landrace accessions, Group II comprised 14 maize landrace accessions, and Group III included 10 maize landrace accessions. In principal component analysis, generally the investigated genotypes were not clearly grouped into their geographical origins owing to a weak geographic relationship among the accessions. In conclusion, even though the morphological characterization studies were conducted in the South Korean climate, this study revealed significant phenotypic variation among the explored maize landrace accessions collected from South Sudan. Therefore, this information about phenotypic divergence may be very useful for future breeding research programs as well as for genetic improvement of South Sudan maize accessions.
-
Key words: Maize, Landrace, Morphological variation, Quantitative traits, Correlation coefficient, Principal component analysis
INTRODUCTION
Maize (
Zea mays L. 2n = 20) is the world’s most widely distributed crop and one of the major and popular cereals grown worldwide (
Shiferaw et al. 2011). Maize is also considered to be one of the most diverse crops, with great diversity in morphological and physiological traits and extensive polymorphism in its DNA sequences (
Thakur et al. 2017). Therefore, these diversity traits are being used as tools for maize breeding programs (
Tanavar et al. 2014). In South Sudan, maize is the second most cultivated cereal after sorghum, occupying an estimated 207,714 hectares, which is about 21% of the country’s total cereal area (
FAO 2022). Although maize is considered as one of the most important cereals that make up the main source of food for local populations in many states, South Sudan still relies on imports from neighboring countries for most of its needs for maize. Out of 870 metric tons of domestic annual cereal production, maize share 100 metric tons per year (
FAO 2022), which is insufficient to meet local con-sump-tion leading the country to food insecurity. In particular, despite the tropical savanna climate of South Sudan, maize is cultivated in all agro-ecological regions. However, climate variation in South Sudan sometimes has negative effects on maize cultivation, especially in semiarid areas with low rainfall (mostly far northern areas) and areas affected by high floods as a result of heavy rain and poor water drainage (mostly central and south-eastern areas), which contributes to reductions in the yields from small-scale farms (AfDB 2019). Such climate differences influence traditional farmers by encouraging them to maintain their own landrace varieties, which suit the growing conditions in each region (
FAO 2022). Hence, serious steps are needed to improve local production of maize by adopting breeding strategies such as hybrid breeding and improved open pollinated varieties to maximize productivity in order to satisfy local demand. Therefore, exploring the available genetic resources is critical for upgrading maize yield efficiency as well as providing breeders with insights to select superior germplasm for developing varieties with desirable traits. Consequently, determining the level of variation of quantitative traits available in genetic resources is useful for breeding programs because such traits reflect the agronomic use of germplasm (
Darrudi et al. 2018).
Morphological differences in crop germplasm between regions of cultivation area have attracted considerable interest in genetic studies of landrace varieties in each region. Phenotypic variation has been utilized to characterize and manage the genetic diversity for various crop species because it is a strong determinant of agronomic value as well as revealing differences between cultivars or varieties (
Cömertpay et al. 2012). Although one of the limitations of morphological characteristics is that they are affected by environmental influences (
Belalia et al. 2019), they allow simple grouping of landrace accessions and also help in identifying specific germplasm for breeding (
Rohini et al. 2020). Multivariate analysis is a popular statistical instrument for morphological variation studies, and it is considered a useful approach for genetic variation estima-tion, especially as it allows many traits to be estimated jointly (
Barth et al. 2022). Among multivariate techniques, principal component analysis (PCA) is one of the preferred methods and is widely used for morphological characteri-zation of populations (
Malik et al. 2014;
Khavari et al. 2014). PCA allows multicollinear data to be evaluated and the traits most suitable for classification to be determined. PCA has been employed successfully for phenotypic characterization of maize as well as for various other crop species (
Darrudi et al. 2018;
Sa et al. 2019;
Ha et al. 2021). Utilization of this method will help in forming an accurate estimation of the level of phenotypic variation in maize accessions collected from South Sudan. In a previous study, we used simple sequence repeat (SSR) or micro-satellite markers for genetic diversity studies of maize landrace accessions collected from South Sudan, and provided the first report about the genetic variation of maize landrace accessions of South Sudan (
Mathiang et al. 2022). Recently, many tools have become available for studying the genetic relationships between landrace germplasm using various molecular markers; however, morphological characterization is the first step in germ-plasm evaluation and classification (
Smith et al. 1990). Even today, morphological data continues to be used as a useful analysis method for the management and preser-vation of collected genetic resources. Therefore, combining information on both phenotypic and molecular variation will enable complete and comprehensive knowledge to be formed accurately about the level of genetic diversity present in the maize landrace accessions of South Sudan.
For this study, we collected 31 maize landrace acces-sions from local farmers’ field in various climatic zones of South Sudan, aiming to investigate the phenotypic vari-ations among them. The results of current study will provide maize breeders with information on the morpho-logical differentiation among maize landrace accessions which will aid in the development of improved maize varieties.
MATERIALS AND METHODS
Plant materials
The materials used for this study were 31 maize landrace accessions collected from the fields of different farmers across South Sudan (17 accessions from the southern region, 7 accessions from the central region, and 7 accessions from the northern region). These maize landrace accessions were divided into 3 populations based on their geographi-cal distribution, namely northern, central, and southern South Sudan. Information about the 31 maize landrace accessions collected from South Sudan is presented in
Table 1 and
Fig. 1.
In our study, to evaluate the morphological variation of the 31 maize landrace accessions collected from South Sudan, 10 individuals of each accession were cultivated from the middle of May to the end of October in 2022 at the research field of Kangwon National University, Chuncheon, Gangwon-do. We examined 7 quantitative characteristics: days to tasseling (DT), days to silking (DS), plant height (PH), ear height (EH), stem width (SW), leaf width (LW), and leaf length (LL) for each maize accession (
Table 2).
PCA was performed to detect any morphological dif-ferences between and within the maize accessions col-lected from the different regions of South Sudan. To analyze the morphological variation of the 31 maize land-race accessions of South Sudan, multivariate analysis was performed using the Microsoft Excel Statistical Analysis System Program and NTSYS-pc V2.1 Program (
Rohlf 1998). SPSS software was used to perform correlation analysis for the 7 quantitative characteristics of the 31 maize landrace accessions of South Sudan.
RESULTS
Morphological variation among maize landrace accessions.
All maize landrace accessions collected from South Sudan used in this study showed considerable morphological differences in accordance with their collection area (southern, central, and northern regions). The morphological characteristics of the 31 maize landrace accessions for the 7 agricultural characteristics are shown in
Supplementary Table S1.
To understand the differences in morphological variation among the maize accessions of the 3 regions (southern region accessions, central regions accessions, and northern region accessions) of South Sudan, the mean, standard deviation, and minimum and maximum values for all characteristics were calculated for accessions of the 3 regions (
Table 3). Based on the survey of the 7 quantitative characteristics for accessions of the 3 regions of South Sudan, the average of DT for the maize landrace accessions of southern, central, and northern regions was 83.0 ± 6.24 (76-97), 91.9 ± 9.06 (80-99), and 83.6 ± 4.22 (79-89), respectively. The average of DS was 86.1 ± 6.89 (78-101), 93.1 ± 10.3 (79-101), and 82.3 ± 4.26 (78-90) for the accessions of southern, central, and northern regions, respectively. The average values of PH were 253.7 ± 34.7 (210-350), 252.6 ± 19.8 (214-273), and 266.6 ± 12.8 (250-281) cm for the accessions of southern, central, and northern regions, respectively. The average values of EH for the maize landrace accessions of southern, central, and northern regions were 137.6 ± 30.9 (96-225), 141.3 ± 21.0 (103-170), and 156.5 ± 16.2 (134-176) cm, respectively. The average values of SW for the maize landrace acces-sions of southern, central, and northern regions were 3.0 ± 0.86 (2.1-5.4), 3.5 ± 0.73 (2.5-4.4), and 3.8 ± 0.85 (2.8-5.4) cm, respectively. The average values of LL were 98.6 ± 12.6 (66.5-120), 96.3 ± 4.85 (89.3-103), and 107.1 ± 12.9 (94.3-131) cm for the maize landrace accessions of southern, central, and northern regions, respectively. The average values of LW were 9.7 ± 1.08 (7.3-11.7), 10.2 ± 1.64 (7.2-11.8), and 10.5 ± 1.06 (8.5-12) cm for the accessions of southern, central, and northern regions, respectively (
Table 3).
Meanwhile, we performed a correlation analysis to detect the morphological relationships between the 7 agronomic characteristics in the 31 maize landrace acces-sions collected from the 3 regions of South Sudan (
Table 4). In our study, the 7 agronomic characteristics showed statistically significant positive or negative correlation coefficients at significance levels of 0.05 and 0.01. Among all the morphological characteristics, the combinations between DT (QN1) and DS (QN2) (0.960**), between PH (QN3) and EH (QN4) (0.767**), between QN3 and SW (QN5) (0.518**), between QN4 and QN5 (0.564**), and between QN4 and LL (QN6) (0.496**) showed compara-tively higher positive correlation coefficients at signifi-cance levels of 0.01. Further, the combination between QN3 and QN6 (0.373*), between QN3 and LW (QN7) (0.440*), between QN4 and QN7 (0.401*), and between QN5 and QN6 (0.403*) showed comparatively higher positive correlation coefficients at the 0.05 significance level. The remaining characteristics showed low correla-tions in both positive and negative directions (
Table 4).
PCA in this study was performed to evaluate the mor-phological differentiation among the 31 maize landrace accessions. The first principal component (PC1) and second principal component (PC2) accounted for 40.9% and 28.6%, respectively, of the total variance (
Table 5). Among all morphological characteristics, 3 characteristics, PH (QN3), EH (QN4), and SW (QN5) made a significant contribution to the positive direction of PC1. Also DT (QN1) and DS (QN2) made a remarkable contribution in the positive direction on PC2 (
Table 5). Along axis 1 of the PCA (
Fig. 2), most maize landrace accessions of South Sudan were not clearly segregated based on their collection areas of the southern, central, and northern regions. In detail, except for several exceptional accessions, most maize landrace acces-sions of the southern region were formed in a group on the negative side on the first axis, and most maize landrace accessions of the central region were formed in a group on the positive and negative sides on the first axis. Also, most maize landrace accessions of the northern region, with a few exceptional accessions, were formed in a group on the positive side on the first axis.
DISCUSSION
Morphological characterization is a fundamental method for estimating the variation and genetic diversity in plant breeding programs (
Park et al. 2015;
Vathana et al. 2019). Although it presents many limitations such as low polymorphism and environmental influence on phenotypic expression, it provides critical information that is necessary for characterizing genetic resources (
Belalia et al. 2019). The morphological trait phenotypes of crop species are important characteristics that appear when crops adapt to their environment, and the phenotypic plasticity of crop species may be related to the specific environmental conditions in which crops live (
Schlichting 1986). Thus, environmental conditions play an important role in the morphological variation in crop species. Also, morphologi-cal variation in crop species can evolve in response to changing environments and can show different patterns across cultivation regions because of geographical distri-bution.
Descriptive statistics used in our study were calculated to account for morphological variation in maize landrace accessions collected from South Sudan. The data obtained provides measurements and forms the basis for almost all quantitative analysis of data, including the mean, mini-mum, maximum, and standard deviation of each quanti-tative characteristic in the accessions of maize germplasm (
Table 3). Previously there have been few reports on the results of cultivation tests in domestic cultivation fields for foreign maize germplasm accessions from areas such as Africa including South Sudan. Thus, in the present study, morphological characteristics were investigated to under-stand the morphological variation of 31 maize landrace accessions collected from farmers' fields in South Sudan. Even though the growth survey experiment was conducted in Korean fields, an examination of the morphological characteristics of the 31 maize landrace accessions col-lected in the southern, central, and northern regions of South Sudan showed that they had different growth characteristics depending on the collection region. In our study, although the maximum and minimum values for each accession collected from the 3 regions of South Sudan did not show any particular tendency based on the collection region, for the average value of the accessions of each of the 3 regions, the accessions of CA region showed the highest values for DT (QN1) and DS (QN2), while the accessions of SA region showed the highest values for PH (QN3), EH (QN4), SW (QN5), and LL (QN6). Despite the results being from an investigation in the climatic environment of South Korea, the maize landrace acces-sions collected in the central and southern regions of South Sudan showed comparatively good growth characteristics. In addition, relationships between morphological characte-ristics were examined using correlation coefficients, and the results of a simple correlation coefficient analysis revealed generally the existence of both significant positive and negative correlations between the 7 morphological characteristics. However, among the combinations, the combinations between QN1 and QN2 (0.960**), between QN3 and QN4 (0.767**), QN3 and QN5 (0.518**), and between QN4 and QN5 (0.564**), and QN4 and QN6 (0.496**) showed significant high positive correlation coefficient compared with the other characteristics at
P < 0.01 (
Table 4). Similar results for a high and positive correlation between agronomic traits were recorded in several other reports, especially for maize (
Cömertpay et al. 2012;
Iqbal et al. 2015;
Belalia et al. 2019). This positive correlation between traits indicates that improve-ment of any characteristic may have a positive effect on desired traits, as a correlation between traits is caused by the presence of linked genes and the occurrence of an inter allelic effect between genes (
Cömertpay et al. 2012).
PCA helps in determining the most relevant traits that can be employed as indicators by explaining much of the overall variation in the original set of variables, and the traits that contribute greatly to the divergence provide considerable affirmation for deciding on a cluster for the purpose of selection of parents for hybridization (
Thakur et al. 2017). Therefore, PCA was carried out to classify the maize landrace accessions based on the most discrimina-ting characteristics, and the results disclosed that PC1 and PC2 accounted for 40.9% and 28.6%, respectively, of the total variance. Among the evaluated characteristics, PH (QN3), EH (QN4), SW (QN5), LL (QN6), and LW (QN7) contributed positively for PC1; while DT (QN1) and DS (QN2) had a large positive contribution for PC2. The PCA based grouping for maize landrace accessions is in good agreement with previous reports by
Hartings et al. (2008),
Mijangos-Cortés et al. (2007),
Jarić et al. (2010), and
Belalia et al. (2019). These studies reported that plant and ear height characteristics were the most discriminative characteristics for identifying maize landrace populations in Italy, Mexico, Eastern Serbia, and Algeria, respectively. Therefore, these characteristics, which revealed a maximum variance with relatively high vectors, are important cha-racteristics for distinguishing phenotypic variation in maize landrace accessions of South Sudan. Therefore, selection with regard to these characteristics should be taken into consideration when choosing parent lines to ensure yield improvement.
Scatter plot based on PC1 and PC2 showed the existence of 3 major groups (
Fig. 2). Group 1 allocated in the first quadrant on the positive side on the first axis included 5 maize accessions that had higher values for DT (QN1), DS (QN2), and PH (QN3). Group 2 allocated in the second and third quadrants on the positive side on the first axis comprised 14 maize accessions that showed low values for PH (QN3) and EH (QN4). Group 3 allocated in the fourth quadrant on the negative side on the first axis included 10 maize accessions that showed high values for PH (QN3) and EH (QN4). PH (QN3), EH (QN4), and DS (QN2) are important characteristics associated with flowering time, which is a crucial characteristic that contributes to crop yield (
Zhang et al. 2011;
Vathana et al. 2019); therefore, this result provides useful details for choosing lines for the improvement of characteristics associated with flowering time. In general, the PCA did not clearly group the different accessions based on their areas of origin, which corres-ponds to the findings of
Hartings et al. (2008),
Sharma et al. (2010), and
Belalia et al. (2019). These studies investigated the phenotypic traits of maize accessions from Italy, the north-eastern Himalayas, and Algeria respectively and found that the accessions were not clustered together based on their geographical region. Mixing of germplasm accessions among local farms could be the reason behind the weak relationship among the accessions from the same region, which is the same finding that was reported in our previous report for accession clustering based on microsatellite marker data (
Mathiang et al. 2022).
In conclusion, despite the morphological characterization studies being conducted in the Korean climate, our study sheds light on and provides details about morphological variation among maize landrace accessions collected from South Sudan. The characteristics that show high variability among the accessions are the most discriminating cha-racteristics and were the best for describing the morpho-logical variation for our explored genotypes. The grouping results based on PCA offer information for selecting suitable genetic materials for breeding. This study together with our previous report provides a comprehensive under-standing of genetic diversity present in South Sudan maize, which had been little investigated. These findings will be crucial in future for advancing molecular breeding studies such as marker-assisted selection (MAS), genome wide association study (GWAS), and genome selection.
Supplemental Material
ACKNOWLEDGEMENTS
This study was supported by the National Research Foundation of Korea (NRF) funded by the Ministry of Education, Science and Technology (NRF-2021R1A6A1 A03044242) and the Golden Seed Project (No. 213009- 05-1-WT821, PJ012650012017), Ministry of Agriculture, Food, and Rural Affairs (MAFRA), Ministry of Oceans and Fisheries (MOF), Korea Forest Service (KFS), Republic of Korea.
Fig. 1Map of South Sudan showing collection sites of 31 maize landrace accessions (refer to
Table 1 for accession numbers and remainder of the summary).
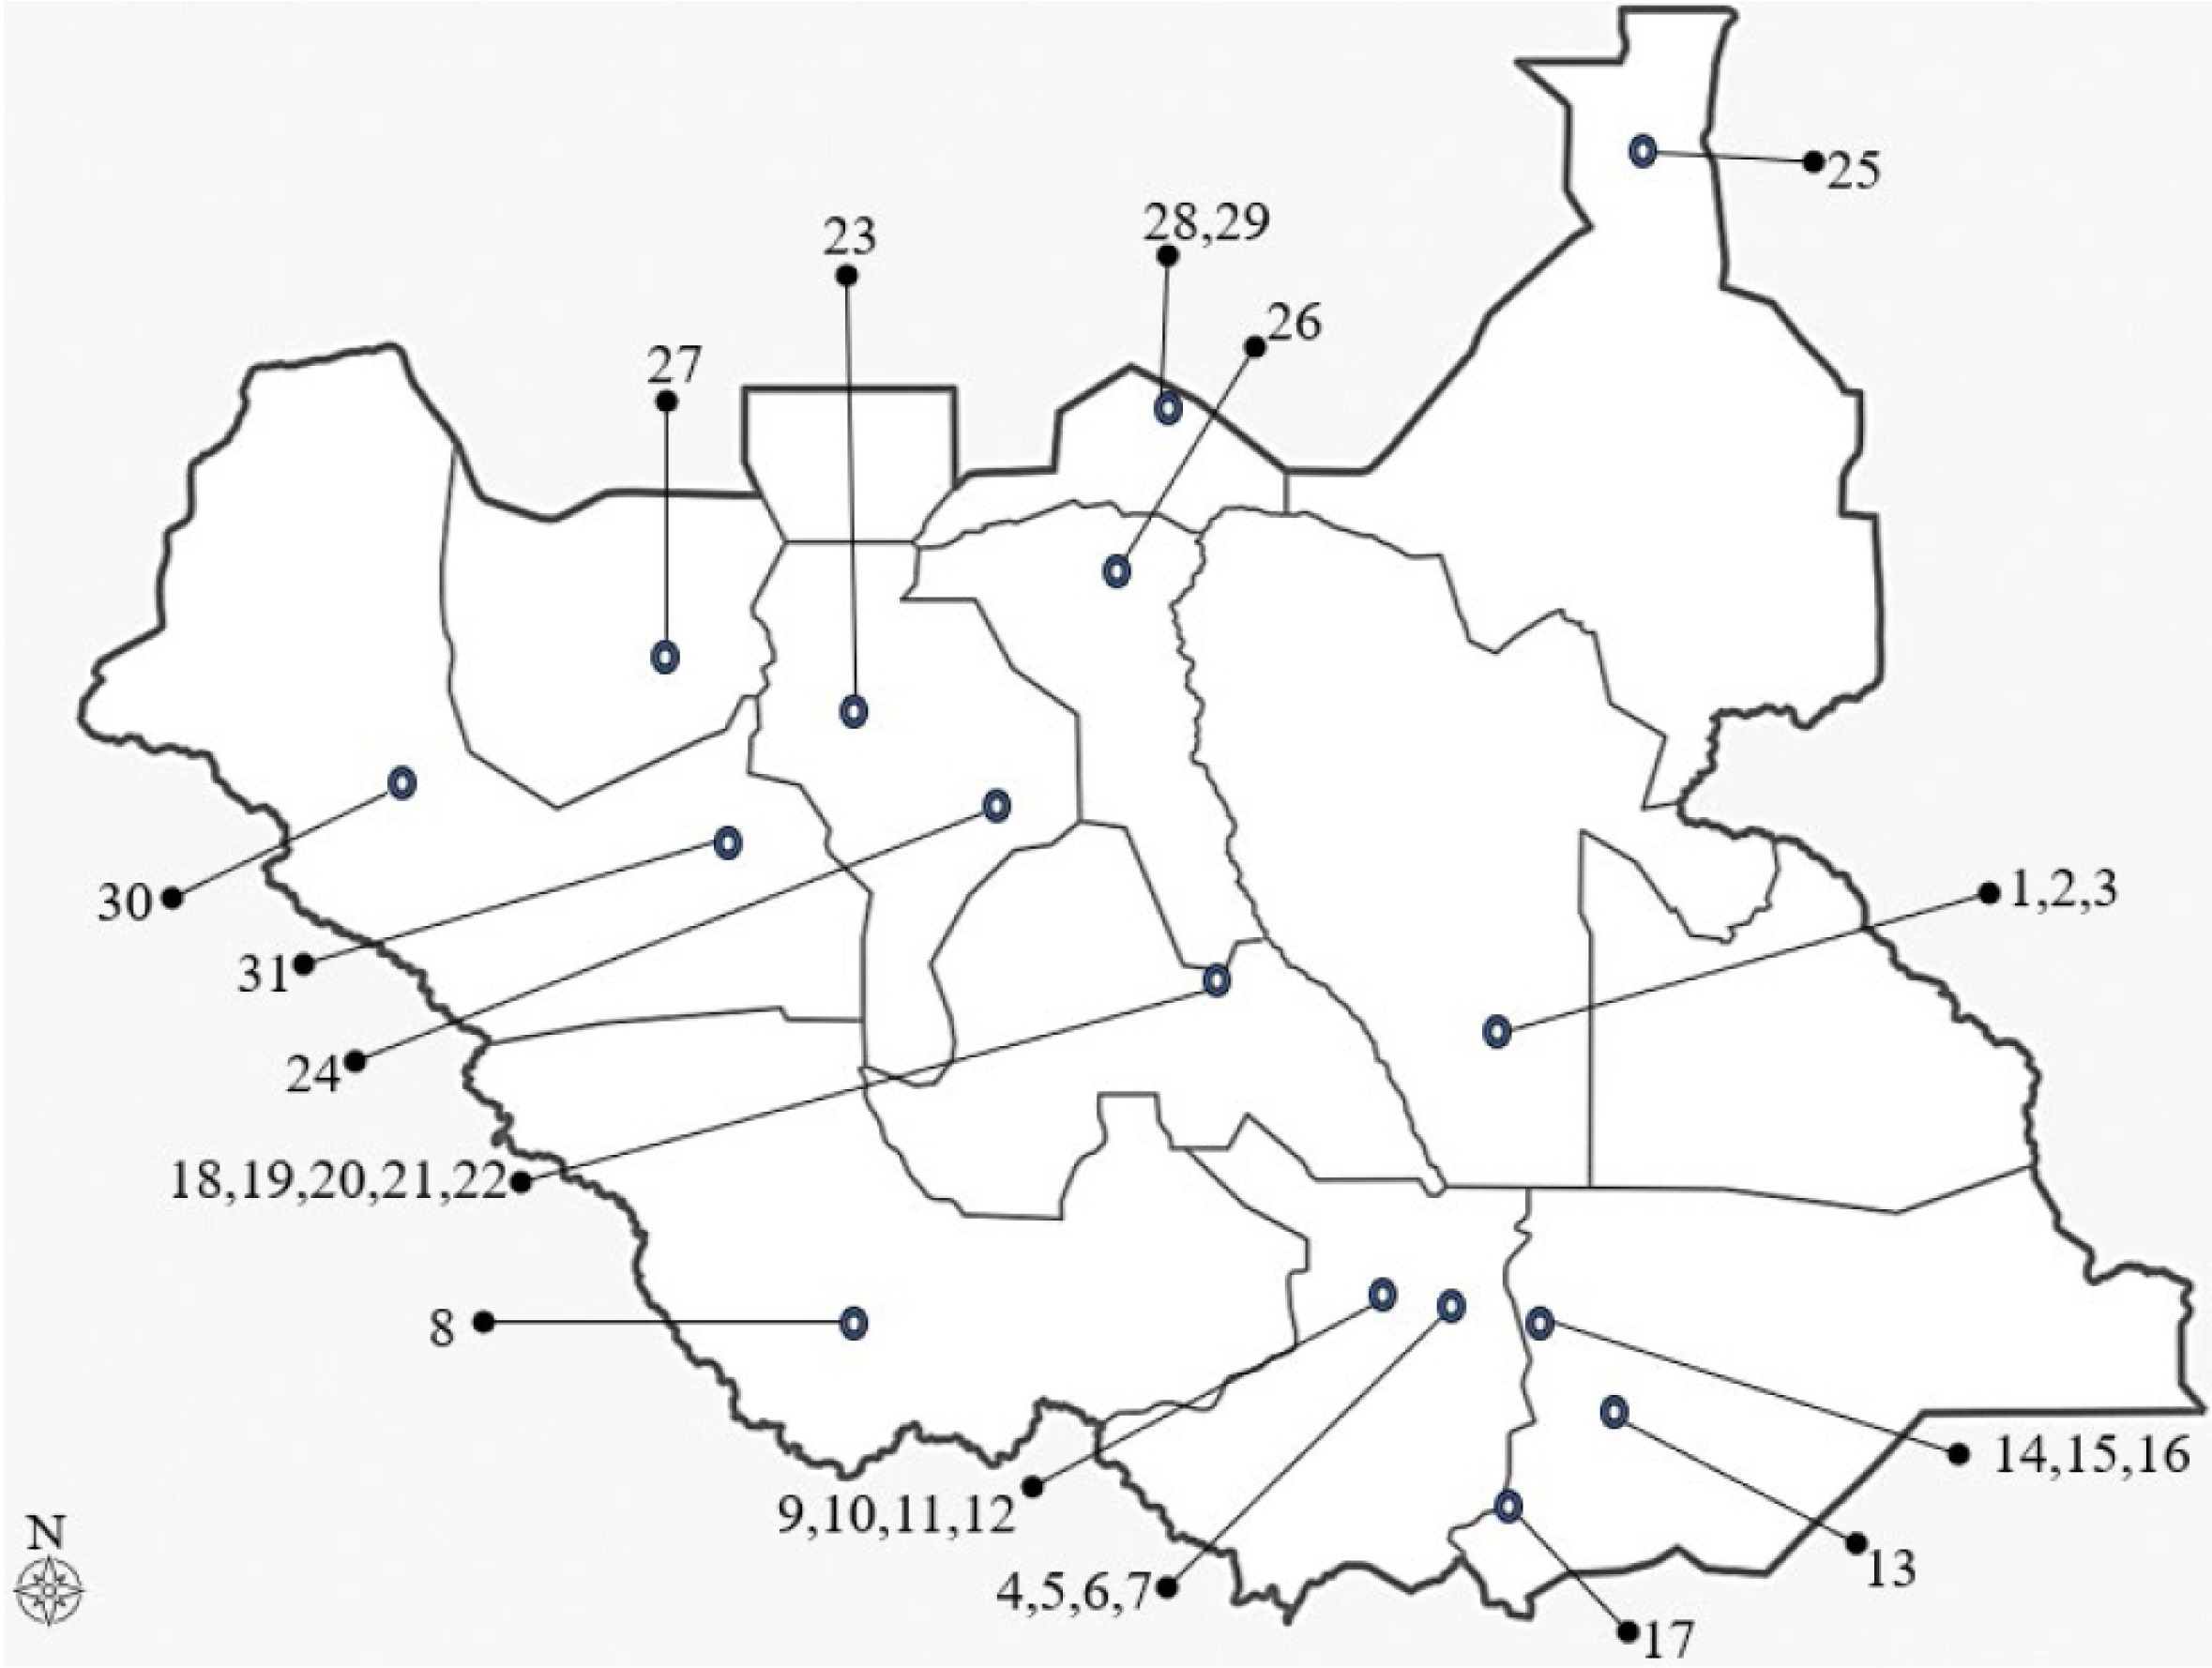
Fig. 2Scatter diagram of 31 maize landrace accessions based on first and second principal components. ◇: Southern region accessions, ▲: Central region accessions, ●: Northern region accessions.
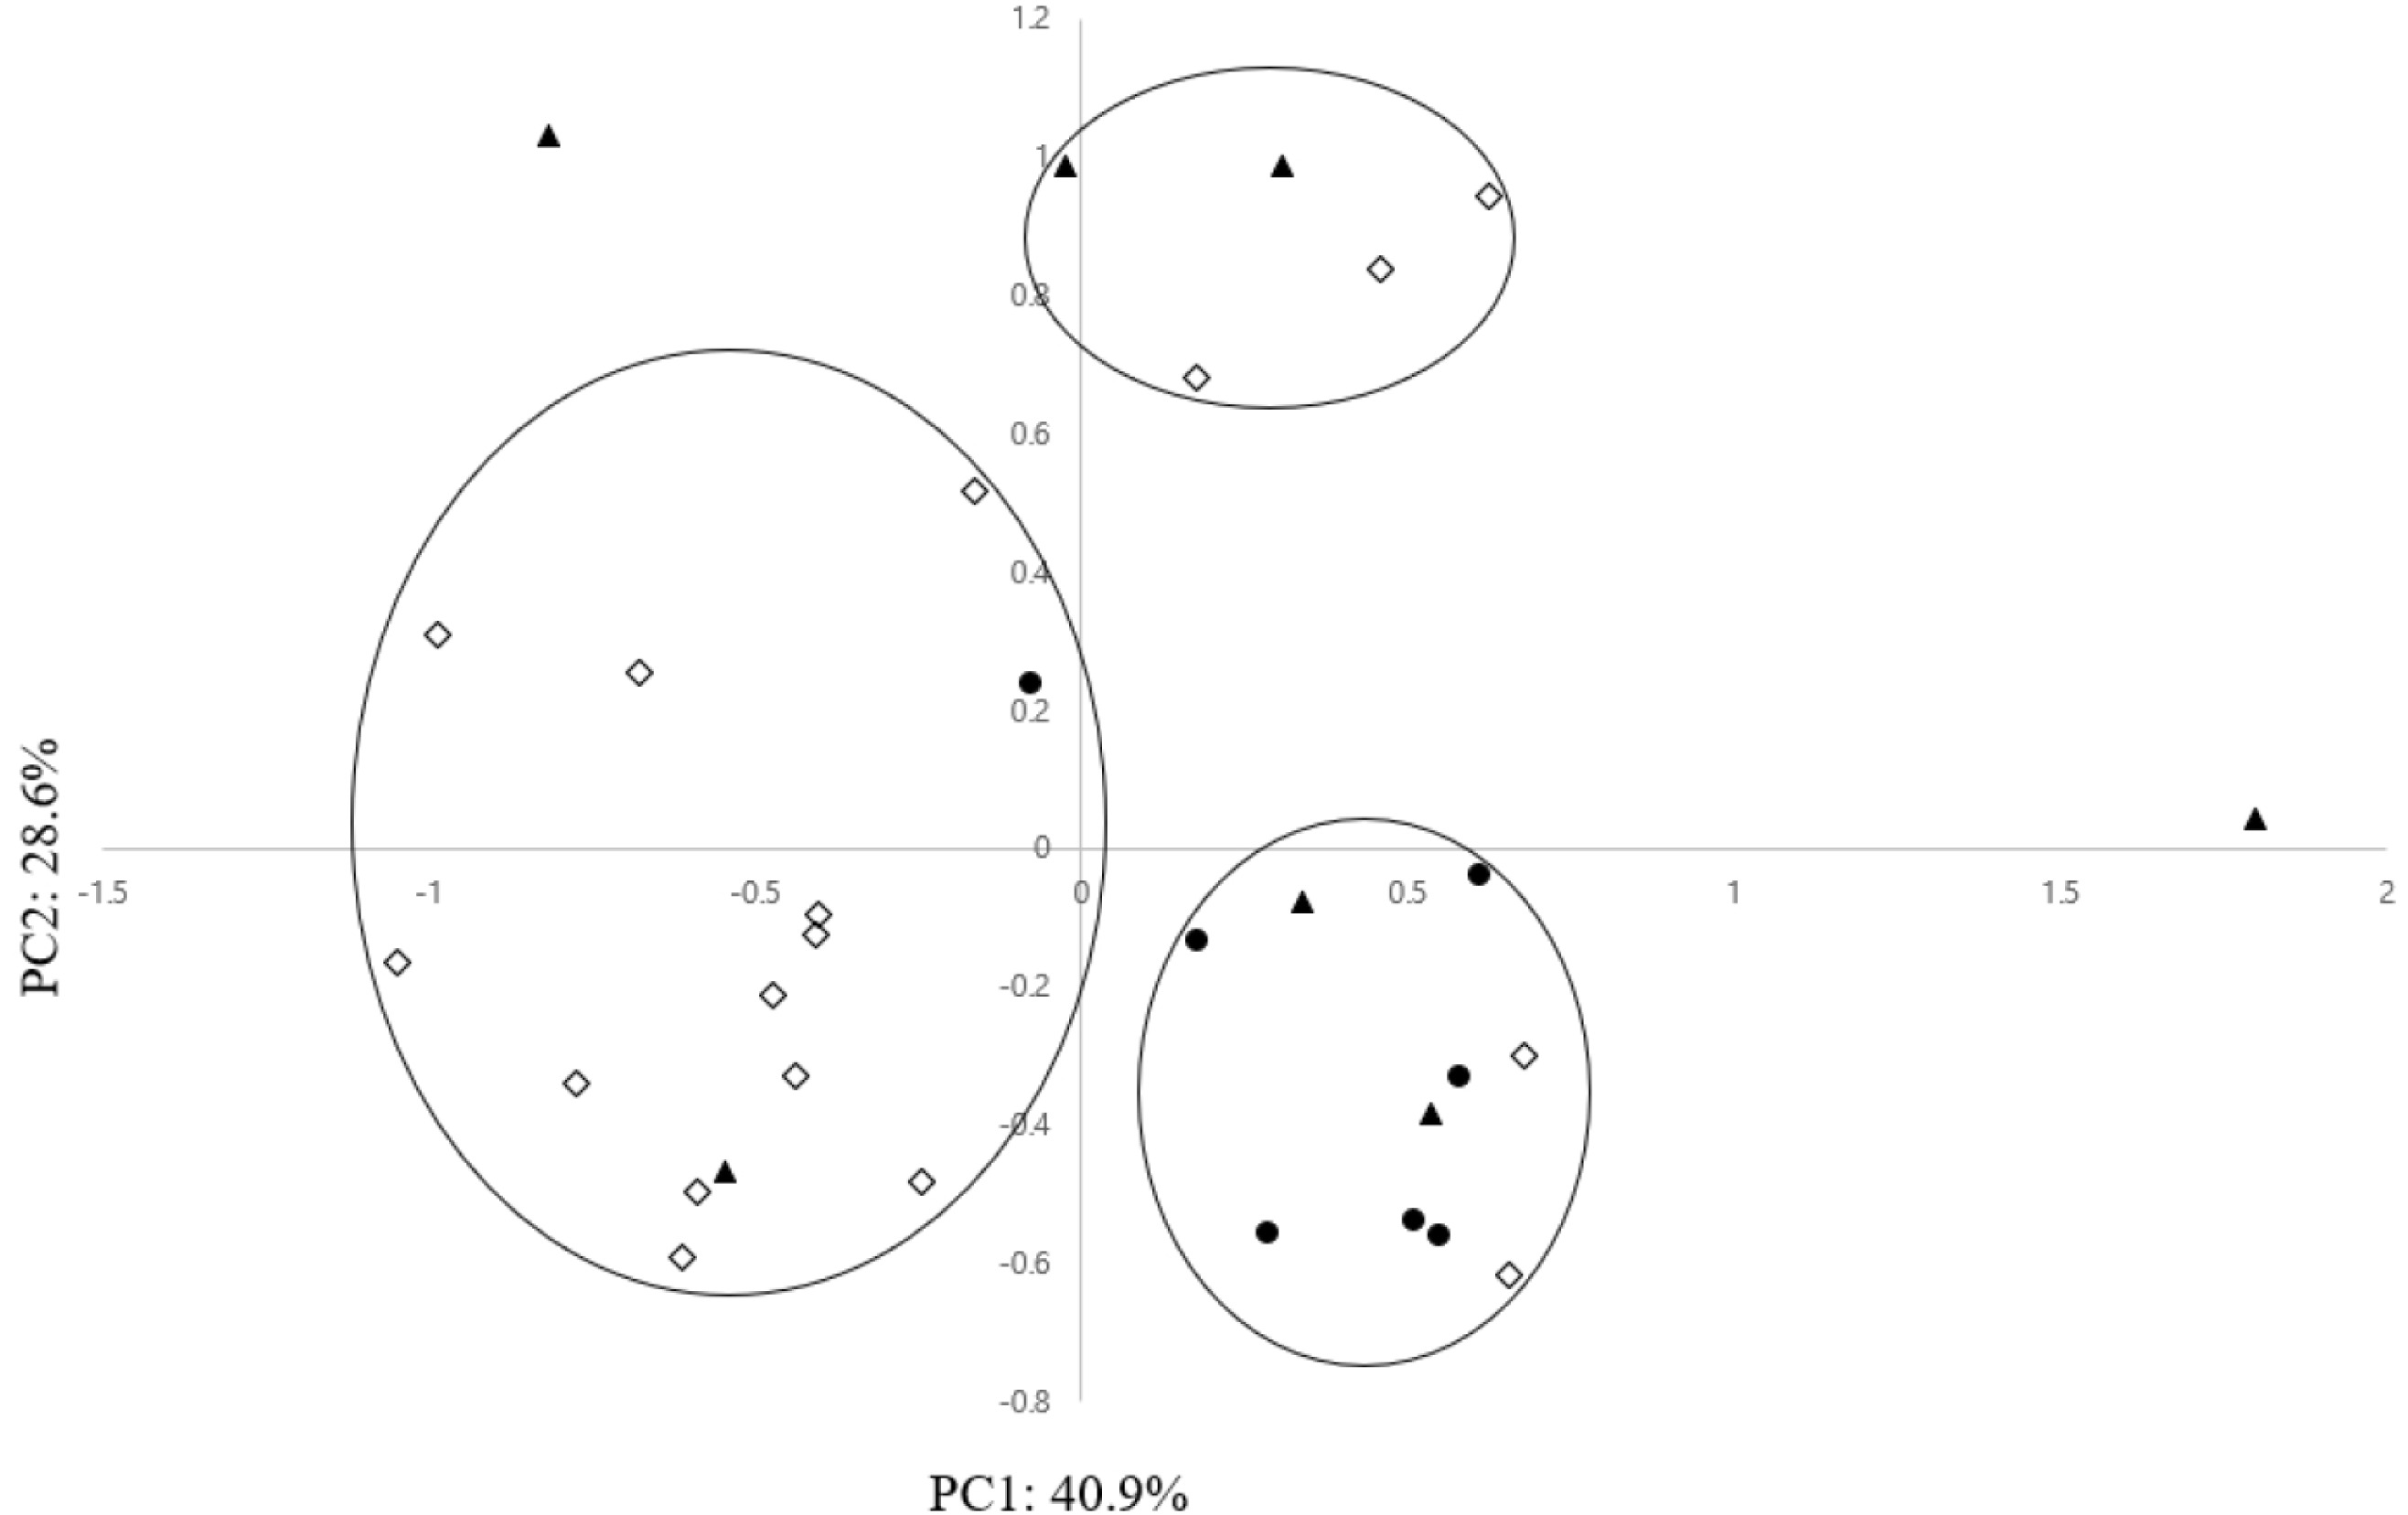
Table 1Summary of 31 maize landrace accessions of South Sudan used for morphological analysis.
Table 1
|
Regions |
No. |
Abbr. |
State, County, Payam or Village |
Country |
Type |
|
Southern accession |
1 |
BO1 |
Gonglei, Bor |
South Sudan |
Landrace |
|
2 |
BO2 |
Gonglei, Bor |
South Sudan |
Landrace |
|
3 |
BO3 |
Gonglei, Bor |
South Sudan |
Landrace |
|
4 |
GO1 |
Central Equatoria, Gondokoro |
South Sudan |
Landrace |
|
5 |
GO2 |
Central Equatoria, Gondokoro |
South Sudan |
Landrace |
|
6 |
GO3 |
Central Equatoria, Gondokoro |
South Sudan |
Landrace |
|
7 |
GO4 |
Central Equatoria, Gondokoro |
South Sudan |
Landrace |
|
8 |
YA |
Western Equatoria, Yambio |
South Sudan |
Landrace |
|
9 |
RJ1 |
Central Equatoria, Rajaf county |
South Sudan |
Landrace |
|
10 |
RJ2 |
Central Equatoria, Rajaf county |
South Sudan |
Landrace |
|
11 |
RJ3 |
Central Equatoria, Rajaf county |
South Sudan |
Landrace |
|
12 |
RJ4 |
Central Equatoria, Rajaf county |
South Sudan |
Landrace |
|
13 |
TO |
Torit, Eastern Equatoria |
South Sudan |
Landrace |
|
14 |
MN1 |
Eastern Equatoria, Mangala |
South Sudan |
Landrace |
|
15 |
MN2 |
Eastern Equatoria, Mangala |
South Sudan |
Landrace |
|
16 |
MN3 |
Eastern Equatoria, Mangala |
South Sudan |
Landrace |
|
17 |
MA |
Eastern Equatoria, Magwi |
South Sudan |
Landrace |
|
Central accession |
18 |
MD1 |
Lakes State, Madhok |
South Sudan |
Landrace |
|
19 |
MD2 |
Lakes State, Malok |
South Sudan |
Landrace |
|
20 |
AR |
Lakes State, Karic |
South Sudan |
Landrace |
|
21 |
AD1 |
Lakes State, Adull |
South Sudan |
Landrace |
|
22 |
AD2 |
Lakes State, Kolniet |
South Sudan |
Landrace |
|
23 |
KO |
Warrap State, Kuajok |
South Sudan |
Landrace |
|
24 |
TO |
Warrap State, Tonj |
South Sudan |
Landrace |
|
Northern accession |
25 |
RE |
Upper Nile, Renk |
South Sudan |
Landrace |
|
26 |
BE |
Unity State, Bentiu |
South Sudan |
Landrace |
|
27 |
AW |
Northern bahr el-ghazal, Awil |
South Sudan |
Landrace |
|
28 |
YD1 |
Ruweng Administrative Area, Yida |
South Sudan |
Landrace |
|
29 |
YD2 |
Ruweng Admistrative Area, Yida |
South Sudan |
Landrace |
|
30 |
RA |
Western bahr el-ghazal, Raja |
South Sudan |
Landrace |
|
31 |
WA |
Western bahr el-ghazal, Wau |
South Sudan |
Landrace |
Table 2Morphological characteristics used in morphological variation analysis of maize landrace accessions.
Table 2
|
Code |
Morphological characters |
Category |
Time of detecting |
Methods of detecting |
|
QN1 |
Days of tasseling (DT) |
days |
Flowering stage |
Days from seedling to tasseling |
|
QN2 |
Days of silking (DS) |
days |
Flowering stage |
Days from seedling to silking |
|
QN3 |
Plant height (PH) |
cm |
Flowering stage |
Length from the ground surface to under corn tassel |
|
QN4 |
Ear height (EH) |
cm |
Flowering stage |
Length from the surface to the second kernel |
|
QN5 |
Stem width (SW) |
cm |
Flowering stage |
Stem width near the kernel |
|
QN6 |
Leaf length (LL) |
cm |
Flowering stage |
Length of the leave near the kernel |
|
QN7 |
Leaf width (LW) |
cm |
Flowering stage |
Leafe width near the kernel |
Table 3Morphological characteristics of 7 quantitative characteristics among 31 maize landrace accessions of 3 regions of South Sudan.
Table 3
|
Code |
Morphological Characters |
Region |
Category/Unit |
Mean ± SD |
Min |
|
Max |
|
Values |
Genotype |
|
Values |
Genotype |
|
QN1 |
Days of tasseling (DT) |
SA |
Days |
83.0 ± 6.24 |
76 |
MN1 |
|
97 |
GO1 |
|
CA |
- |
91.9 ± 9.06 |
80 |
AD2 |
|
99 |
AR |
|
NA |
- |
83.6 ± 4.22 |
79 |
AW |
|
89 |
AW |
|
QN2 |
Days of silking (DS) |
SA |
Days |
86.1 ± 6.89 |
78 |
MN1 |
|
101 |
GO1 |
|
CA |
- |
93.1 ± 10.3 |
79 |
AD2 |
|
101 |
AR |
|
NA |
- |
82.3 ± 4.26 |
78 |
WA |
|
90 |
RE |
|
QN3 |
Plant height (PH) |
SA |
cm |
253.7 ± 34.7 |
210 |
GO3 |
|
350 |
TR |
|
CA |
- |
252.6 ± 19.8 |
214 |
MD1 |
|
273 |
AR |
|
NA |
- |
266.6 ± 12.8 |
250 |
RE |
|
281 |
BE |
|
QN4 |
Ear height (EH) |
SA |
cm |
137.6 ± 30.9 |
96 |
GO3 |
|
225 |
TR |
|
CA |
- |
141.3 ± 21.0 |
103 |
MD1 |
|
170 |
KO |
|
NA |
- |
156.5 ± 16.2 |
134 |
WA |
|
176 |
YD2 |
|
QN5 |
Stem width (SW) |
SA |
cm |
3.0 ± 0.86 |
2.1 |
GO4 |
|
5.4 |
RJ2 |
|
CA |
- |
3.5 ± 0.73 |
2.5 |
MD1 |
|
4.4 |
AD1 |
|
NA |
- |
3.8 ± 0.85 |
2.8 |
RE |
|
5.4 |
YD1 |
|
QN6 |
Leaf length (LL) |
SA |
cm |
98.6 ± 12.6 |
66.5 |
BO1 |
|
120 |
TR |
|
CA |
- |
96.3 ± 4.85 |
89.3 |
AD2 |
|
103 |
TO |
|
NA |
- |
107.1 ± 12.9 |
94.3 |
YD1 |
|
131 |
WA |
|
QN7 |
Leaf width (LW) |
SA |
cm |
9.7 ± 1.08 |
7.3 |
RJ3 |
|
11.7 |
GO1 |
|
CA |
- |
10.2 ± 1.64 |
7.2 |
AD2 |
|
11.8 |
KO |
|
NA |
- |
10.5 ± 1.06 |
8.5 |
RE |
|
12 |
AW |
Table 4Pearson correlation coefficient for 7 quantitative characteristics in 31 maize landrace accessions of South Sudan.
Table 4
|
Morphological characters |
QN1 |
QN2 |
QN3 |
QN4 |
QN5 |
QN6 |
QN7 |
|
QN1 |
|
0.960**
|
0.120 |
0.044 |
‒0.09 |
0.119 |
0.036 |
|
QN2 |
|
|
0.127 |
0.015 |
‒0.166 |
0.091 |
‒0.003 |
|
QN3 |
|
|
|
0.767**
|
0.518**
|
0.373*
|
0.440*
|
|
QN4 |
|
|
|
|
0.564**
|
0.496**
|
0.401*
|
|
QN5 |
|
|
|
|
|
0.403*
|
0.324 |
|
QN6 |
|
|
|
|
|
|
0.238 |
Table 5Cumulative variances of first and second principal components and loadings of 7 quantitative cha-racteristics on each principal component.
Table 5
|
Code |
Morphological characteristics |
Eigenvectors |
|
1 |
2 |
|
QN4 |
Ear height (EH) |
0.88 |
‒0.077 |
|
QN3 |
Plant height (PH) |
0.855 |
0.03 |
|
QN5 |
Stem width (SW) |
0.732 |
‒0.278 |
|
QN6 |
Leaf length (LL) |
0.654 |
0.051 |
|
QN7 |
Leaf width (LW) |
0.603 |
0.051 |
|
QN1 |
Days of tasseling (DT) |
0.149 |
0.971 |
|
QN2 |
Days of silking (DS) |
0.108 |
0.984 |
References
- African Development Bank (AfDB) 2019.South Sudan - national climate change profile. South Sudan - national climate change profile.
- Barth E, de Resende JTV, Mariguele KH, et al. 2022. Multivariate analysis methods improve the selection of strawberry genotypes with low cold requirement. Sci. Rep.. 12: 1-12.
- Belalia N, Lupini A, Djemel A, et al. 2019. Analysis of genetic diversity and population structure in Saharan maize (Zea mays L.) populations using phenotypic traits and SSR markers. Genet. Resour. Crop Evol.. 66: 243-257.
- Baloch FS, Kilian B, et al. Cömertpay G2012. Diversity assessment of Turkish Maize Landraces R Markers based on fluorescent labelled SS. Plant Mol. Biol. Report.. 30: 261-274.
- Darrudi R, Nazeri V, Soltani F, et al. 2018. Genetic diversity of Cucurbita pepo L. and Cucurbita moschata Duchesne accessions using fruit and seed quantitative traits. J. Appl. Res. Med. Aromat. Plants.. 8: 60-66.
- FAO.2022. Special Report - 2021 FAO/WFP Crop and Food Security Assessment Mission (CFSAM) to the Republic of Tajikistan.
- Ha YJ, Sa KJ, Lee JK. 2021. Morphological variation of accessions of Perilla crop (Perilla frutescens l.) and related weedy types collected from South Korea. Plant Breed. Biotech.. 9: 77-87.
- Hartings H, Berardo N, Mazzinelli GF, et al. 2008. Assessment of genetic diversity and relationships among maize (Zea mays L.) Italian landraces by morphological traits and AFLP profiling. Theor. Appl. Genet.. 117: 831-842.
- Iqbal J, Shinwari ZK, Rabbani MA. 2015. Maize (Zea mays L.) germplasm agro-morphological characterization based on descriptive, cluster and principal component analysis. Pakistan J. Bot.. 47: 255-264.
- Iwarsson M, Minina A. Jarić JKProdanović S2010. Diver-sity of maize (Zea mays L.) landraces in Eastern Serbia: Morphological and storage protein characterization. Maydica. 55: 231-238.
- Khavari S, Kh M, Zandipour E, Heidarian A. 2014. Multi-variate analysis of agronomic traits of new corn hybrids (Zea mays L.). Inter. J. of Agri. Sci.. 1: 314-322.
- Malik R, Sharma H, Sharma I, et al. 2014. Genetic diversity of agro-morphological characters in Indian wheat varieties using GT biplot. Aust. J. Crop Sci.. 8: 1266-1271.
- Mathiang EA, Sa KJ, Park H, et al. 2022. Genetic diversity and population structure of normal maize germplasm collected in South Sudan Revealed by SSR Markers. Plants. 11: 2787
- Corona-Torres T, Espinosa-Victoria D, et al. Mijangos-Cortés JO2007. Differentiation among Maize (Zea mays L.) landraces from the Tarasca Mountain Chain, Michoacan, Mexico and the Chalqueño complex. Genet. Resour. Crop Evol.. 54: 309-325.
- Park JY, Woo SY, Sa KJ, Lee JK. 2015. Genetic analyses for yield components and heterosis in maize elite inbred lines. Korean. J. Breed. Sci.. 47: 356-367.
- Rohini MR, Sankaran M, Rajkumar S, et al. 2020. Morpho-logical characterization and analysis of genetic diversity and population structure in Citrus × jambhiri Lush. using SSR markers. Genet. Resour. Crop Evol.. 67: 1259-1275.
- Rohlf FJ. 1998. NTSYS-pc: numerical taxonomy and multi-variate analysis system. Version: 2.02. Exter Software. Setauket, New York, U.S.A..
- Sa KJ, Park DH, Lim SE, et al. 2019. Geographic variation of morphological characters among cultivated types of Perilla crop and their weedy types in Korea and China. Plant Breed. Biotech.. 7: 313-325.
- Schlichting CD. 1986. The evolution of phenotypic plasticity in plants. Ann. Rev. Ecol. Syst.. 17: 667-693.
- Sharma L, Ramesh BMPB, Zea L. 2010. Am the North East Himalayan regionnalysis of phenotypic and microsatellite- based diversity of maize landraces in India. Especially Fro. 619-631..
- Shiferaw B, Prasanna BM, Hellin J. Bänziger M2011. Crops that feed the world 6. Past successes and future challenges to the role played by maize in global food security. Food Secur.. 3: 307-327.
- Smith OS, Smith JSC, Bowen SL, et al. 1990. Similarities among a group of elite maize inbreds as measured by peigree, F1 grain yield, grain yield, heterosis, and RFLPs. Theor. Appl. Genet.. 80: 833-840.
- Tanavar M, Bahrami E, Asadolahi AR, Askary AR. 2014. Genetic diversity of 13 maize (Zea mays L. ) hybrids based on multivariate analysis methods. Int. J. Farming Allied. Sci. 2012-2015..
- Thakur N, Prakash J, Thakur K, et al. 2017. Genetic diversity and structure of maize accessions of North Western Himalayas based on morphological and molecular markers. Proc. Natl. Acad. Sci. India. Sect. B- Biol. Sci.. 87: 1385-1398.
- Vathana Y, Sa KJ, Lim SE, Lee JK. 2019. Genetic diversity and association analyses of Chinese maize inbred lines using SSR markers. Plant Breed. Biotech.. 7: 186-199.
- Zhang Y, Li Y, Wang Y, et al. 2011.Correlations and QTL detection in maize family per se and testcross progenies for plant height and ear height. Correlations and QTL detection in maize family per se and testcross progenies for plant height and ear height.


