Abstract
Sorghum is the fifth most important grain crop worldwide. It is not only used as food and feed, but also as a resource for biofuel production. In addition, it has potential uses as a model plant for research on adaptation to environmental stress. In this study, mutant sorghum lines were generated by gammy ray irradiation. Ten of the M6 sorghum mutant lines were selected from 28 mutant lines on the basis of agronomic characteristics. These 10 lines, along with their original accessions/cultivar, were evaluated to determine the germination rate and the shoot and root length under salt treatment. Compared with their original accessions, three mutant lines (B5, SY6, and SY7) showed significant differentiation under saline conditions (150 mM NaCl), with increased shoot length (by 1.3-2.2 times) and root length (by 1.5-2.5 times). We determined the transcript levels of 20 abiotic stress-responsive genes in B5 (the most salt-tolerant mutant) and its original accession. These genes included those encoding heat shock proteins, aquaporins, ROS scavenging system, and transcription factors. In the B5 mutant, 15 genes showed differences in transcript levels between the control and the salt treatment. Salt treatment resulted in significant up-regulation of Sb03g045840 and down-regulation of Sb3g030750 in the B5 mutant. Here, we reported a simple method to identify genes related to salt tolerance in a sorghum mutant.
-
Key words: Sorghum, Radiation breeding, Salt tolerance, Gene expression
INTRODUCTION
Salinity is a major abiotic stress that inhibits the growth and productivity of various crop plants (Parida
et al. 2005). There are 831 million hectares of salinity-affected land worldwide (
Asfaw 2011). The area of reclaimed land in Korea is about 135,000 ha, including Saemangeum, which accounts for 9% of the total cultivated area in Korea (
Lee et al. 2015). The soil in reclaimed land is salinized, which is unfavorable for agriculture (
Chipanshi et al. 2003). Furthermore, the salinization process occurs continuously in dry and semi-dry areas due to high evaporation and insufficient precipitation (
Dai et al. 2011). In recent decades, various biological technologies have been applied to overcome salinity-related problems in agriculture. Progress in research on the molecular, physiological, biochemical, and metabolic aspects of salt tolerance will have a positive impact on the development of plant varieties in the future (
Roychoudhury and Chakraborty 2013;
Bafeel 2014).
Sorghum (
Sorghum bicolor L. Moench) is widely cultivated in Asia, Africa, and many developing countries. In the mid-80s, the sorghum cultivation area was 47.8M ha worldwide, with the largest production areas in Asia (20.8M ha) and Africa (15.3M ha) (
Smith and Bhaskaran 1986). It is not only a food and a resource for biofuel production, but also widely used as animal feed in tropical and subtropical regions. Sorghum is a C
4 crop and the fifth most important cereal in the world after rice, wheat, corn, and barley (
Ngara et al. 2012;
Tari et al. 2013). Sorghum is well adapted to semi-arid and arid regions because it is tolerant to abiotic stresses such as drought and salinity (
Almodares and Hadi 2009). The degree of salt tolerance varies among genotypes (
Krishnamurthy et al. 2007).
Plants under salt stress conditions show a series of physiological and chemical responses, including the synthesis of osmotic regulators and increased activity of antioxidant enzymes to maintain the normal physiological metabolism of cells (
Li et al. 2014;
You et al. 2019). Additionally, salt stress induces the expression of many genes encoding products with a range of functions. There are many protein families that respond to stress, such as heat shock proteins, aquaporins, and transcription factors (
Kamal et al. 2010).
Shingote et al. (2015) reported that transgenic tobacco expressing the
SoMYB18 gene, encoding a MYB transcription factor from sweet sorghum, showed improved salt and dehydration tolerance. Regulating the expression levels of genes encoding functional proteins is a key mechanism of the plant response to stress (
Song et al. 2020).
Mutation breeding is a useful tool for increasing the diversity of crop species (
Hong et al. 2019). Many previous studies have reported improvements in the nutritional and functional properties of the grain of mutants derived by irradiation with various doses of gamma rays (
Mukisa et al. 2012;
Hassan et al. 2013).
Mehlo et al. (2013) found that sorghum mutants generated using gamma rays showed increased concentrations of various compounds such as essential amino acids. Other studies on the functional properties of sorghum mutants generated using high doses of gamma rays have reported improved storage properties of sorghum grain as a result of significantly reduced mold growth and free fatty acid content (
Ahmed et al. 2018). As such, gamma rays are a suitable physical mutagen for mutation breeding and commercial breeding of sorghum.
Previously,
Kim et al. (2020) compared the salt tole-rance characteristics of 29 elite sorghum genetic resources. They determined a phenotypic index on the basis of the germination rate, leaf number, plant height, and root length as an indicator of early growth under various salt con-ditions. In this study, as follow-up research, 28 M
6 mutant lines derived from eight original accessions/cultivars were developed by gamma ray-induced mutation breeding, and the salt tolerance of the mutant lines was investigated. We found that, compared with the original accession C3 (IT124115), several mutants showed significantly increased salt tolerance. Then, quantitative real-time polymerase chain reaction (qRT-PCR) analyses of stress-inducible gene expression in the most salt-tolerant line, B5, revealed several genes that are likely involved in salt tolerance.
MATERIALS AND METHODS
Plant materials and analyses of morphological characteristics
The morphological characteristics of 36 sorghum original/mutant accessions (
Table 1) were assessed at Korea Atomic Energy Research Institute (Jeongeup-si Jeollabuk-do, Korea) from 2020 to 2021 using three replicates of each material. We measured plant height (cm), panicle length (cm), stalk diameter (mm), sugar content (brix), and fresh weight (kg). The mutant lines were generated by irradiation with gamma rays at doses of 100, 200, 300, and 400 Gy per line in 2016 and each line was advanced to the M
6 generation using the single seed descent method.
To evaluate salt tolerance, 10 seeds of each mutant and original accession/cultivar were sown in soil in a 50-hole seed tray (Hungnong, Pyeongteak, Korea). The salinity treatment consisted of 150 mM NaCl as sea salt (Shinan, Korea) in water, applied by irrigation once a week. The control group was similarly irrigated with water (0 mM NaCl). The germination rate was investigated at 7 days after the first salt treatment, and shoot and root length were determined after 2 weeks of seedling growth (two salt treatments). These analyses were conducted in triplicate.
RNA extraction and cDNA synthesis
To evaluate the transcript levels of genes involved in the abiotic stress response, RNA was isolated from sorghum leaves from the control (no salt) and the salt treatment (150 mM NaCl) at 10 days after sowing (DAS) as follows: the sample was ground in liquid nitrogen, and then Trizol was added (1 mL Trizol per 100 mg sample). After adding 200 mL chloroform, the mixture was shaken and then allowed to separate into phases. Next, 500 mL isopropanol was added and the mixture was centrifuged (15 minutes at 13,000 rpm). Then, the pellet was washed with 1 mL 75% ethanol, dissolved in 300 mL DEPC or ultrapure water, and then RNA was quantified using a NanoDrop ND-1000 spectrophotometer (Nanodrop Technologies, Wilmington, DE, USA). First-strand cDNA synthesis was performed using 1 mg total RNA as the template with SuperScript Ⅲ First-Strand synthesis SuperMix (Invitrogen, Carlsbad, CA, USA).
Analysis by quantitative real-time PCR
Gene transcript levels were determined using the Bio- Rad CFX96 Real-time PCR system (Bio-Rad, Hercules, CA, USA) with the SYBR Green SuperMix kit. The PCR program was as follows: 95℃ for 10 minutes, then 40 cycles of 95℃ for 10 seconds, 60℃ for 15 seconds, and 72℃ for 30 seconds. The reference gene was
CYP (
Sudhakar Reddy et al. 2016). Gene-specific primers were designed using Primer3 software (
https://www.bioinformatics.nl/ cgi-bin/primer3plus/primer3plus.cgi). The sequences of the gene-specific primers used for qRT-PCR and its references are listed in
Table 2. Gene expression levels, which were normalized against of the reference genes (
CYP), and were calculated based on the 2
‒ΔΔCt comparative threshold method (
Livak and Schmittgen 2001). Relative values of expression were determined against the average value of each normal condition. Statistical analysis was performed by two-tailed Student’s
t-test.
RESULTS
Morphological characteristics of gamma-irradiated sorghum mutants
The seven original accessions (IT100992, IT124065, IT124115, IT028269, IS8777, IS20740, IS27887), one original cultivar (Dansusu 2ho), and their 28 mutant lines were assessed to evaluate their agronomic traits.
The plant height, panicle length, stalk diameter, sugar content, and fresh weight were determined for all materials (
Table 1). The plant height ranged from 2.61 m (SY6) to 5.53 m (B8), and the panicle length ranged from 15.33 cm (C2) to 53 cm (B3). The minimum stalk diameter was 14.92 mm, the maximum diameter was 32.97 mm. The sugar content of stem was highest in C3 (17.3% brix) and lowest in SY6 (4.4% brix). The fresh weight per plant ranged from 1.00 kg (B10) to 3.77 kg (SY4).
Based on these agronomic traits, we selected 10 mutant lines showing phenotypic changes compared with their original materials for salt tolerance assessment (
Table 3).
Table 3 shows the degree of salt tolerance of 10 sorghum mutants (B2, SY3, B3, B5, SY6, SY7, SY8, SY9, B8, B9) and their original accessions (C1, C2, C3, C4, C7). Various phenotypes were observed with respect to growth characteristics. The germination rate of sorghum materials was significantly affected by salt treatment. The germination rate of all materials was 100% in the control (0 mM NaCl), but reduced to 55%-95% in the salt treatment (150 NaCl). The shoot length ranged from 3 cm (C7) to 29.2 cm (B8) in the control, and from 0.6 cm (C1) to 14.2 cm (B5) in the salt treatment. The root length ranged from 1.8 cm (C4) to 68.4 cm (B8) in the control and from 1.2 cm (C4) to 16 cm (B9) in the salt treatment.
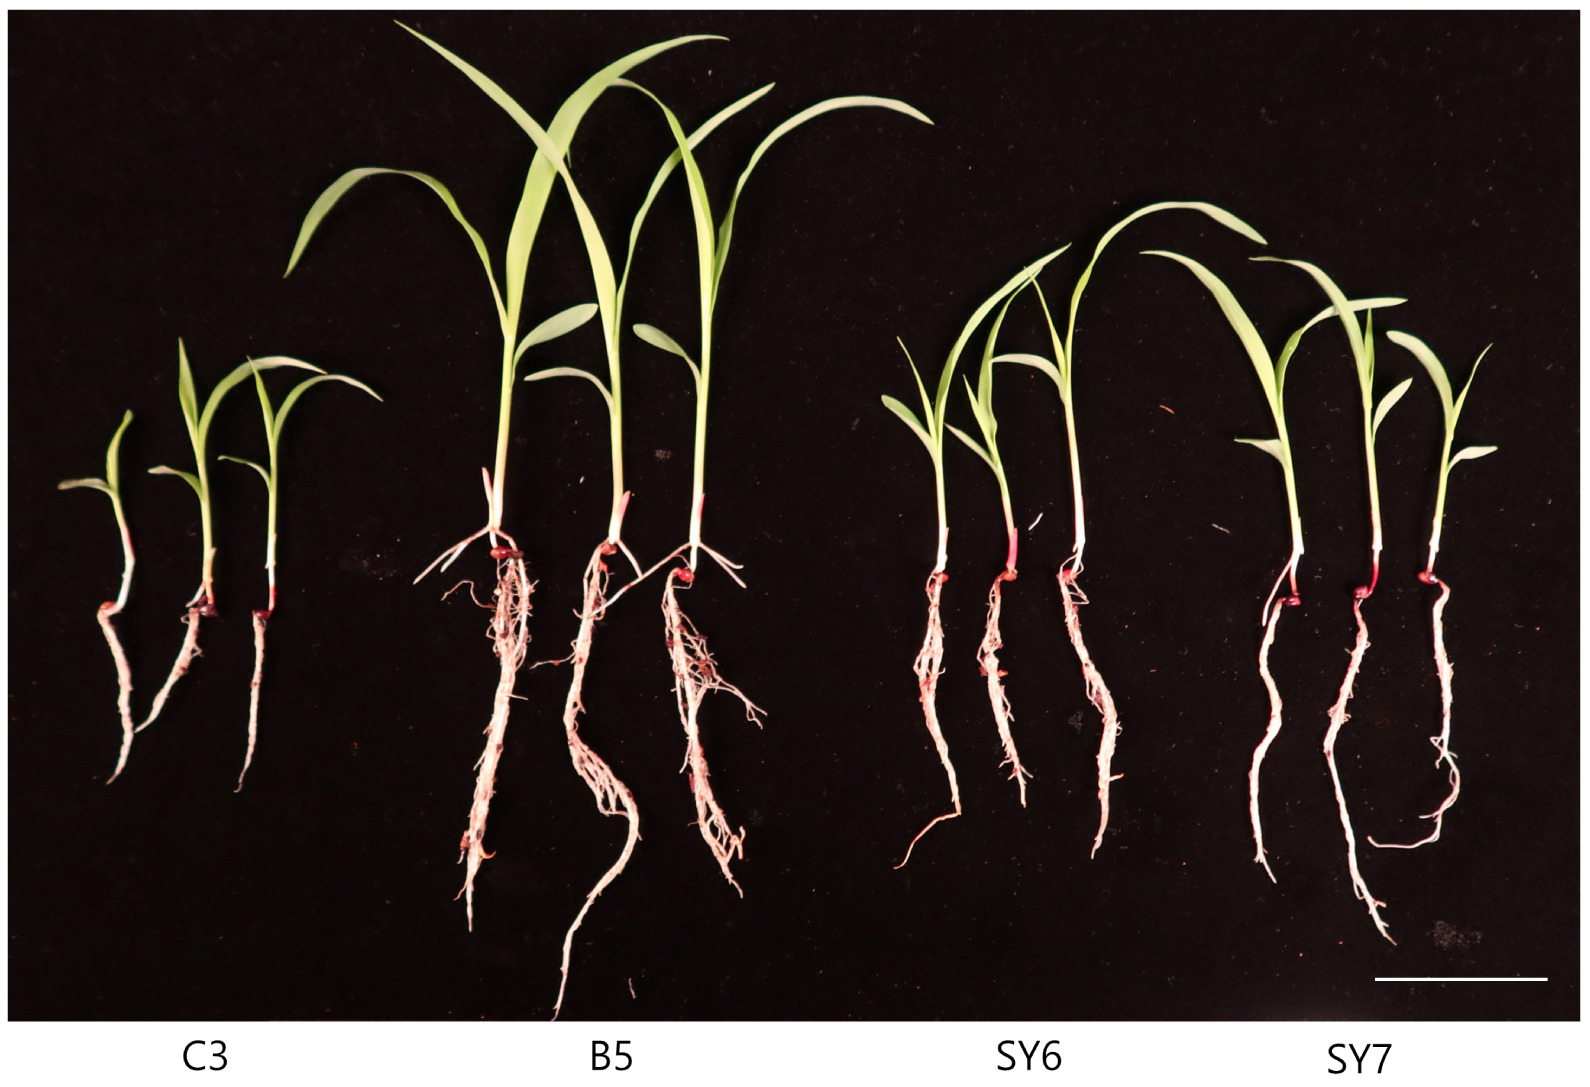
According to those results, IT124115 (C3) and three mutant lines (B5, SY6, SY7) showed greater shoot and root length compared with other mutant lines in the salt treatment (
Fig. 1). The shoot length was 1.3-2.2 times that of the other lines, and the root length was 1.5-2.5 times that of the other lines. Among the three mutant lines, B5 was the most salt tolerant, and was therefore selected for gene expression analysis by qRT-PCR.
To detect differences in gene expression between the mutant B5 and its original accession C3, we analyzed the transcript levels of genes encoding heat shock proteins (Sb07g028370, Sb01g040030, Sb04g006890, Sb04g035130, Sb01g021170), aquaporins (Sb04g032900, Sb04g037800, Sb0012s010440, Sb07g003270, Sb05g007520), ROS sca-venging system (Sb02g000490, Sb10g030840, Sb03g045 840, Sb04g030050, Sb03g010900), and transcription fac-tors (Sb01g044410, Sb03g030750, Sb03g005480, Sb10g 007090, Sb08g018580), all of which are known to be related to abiotic stress (
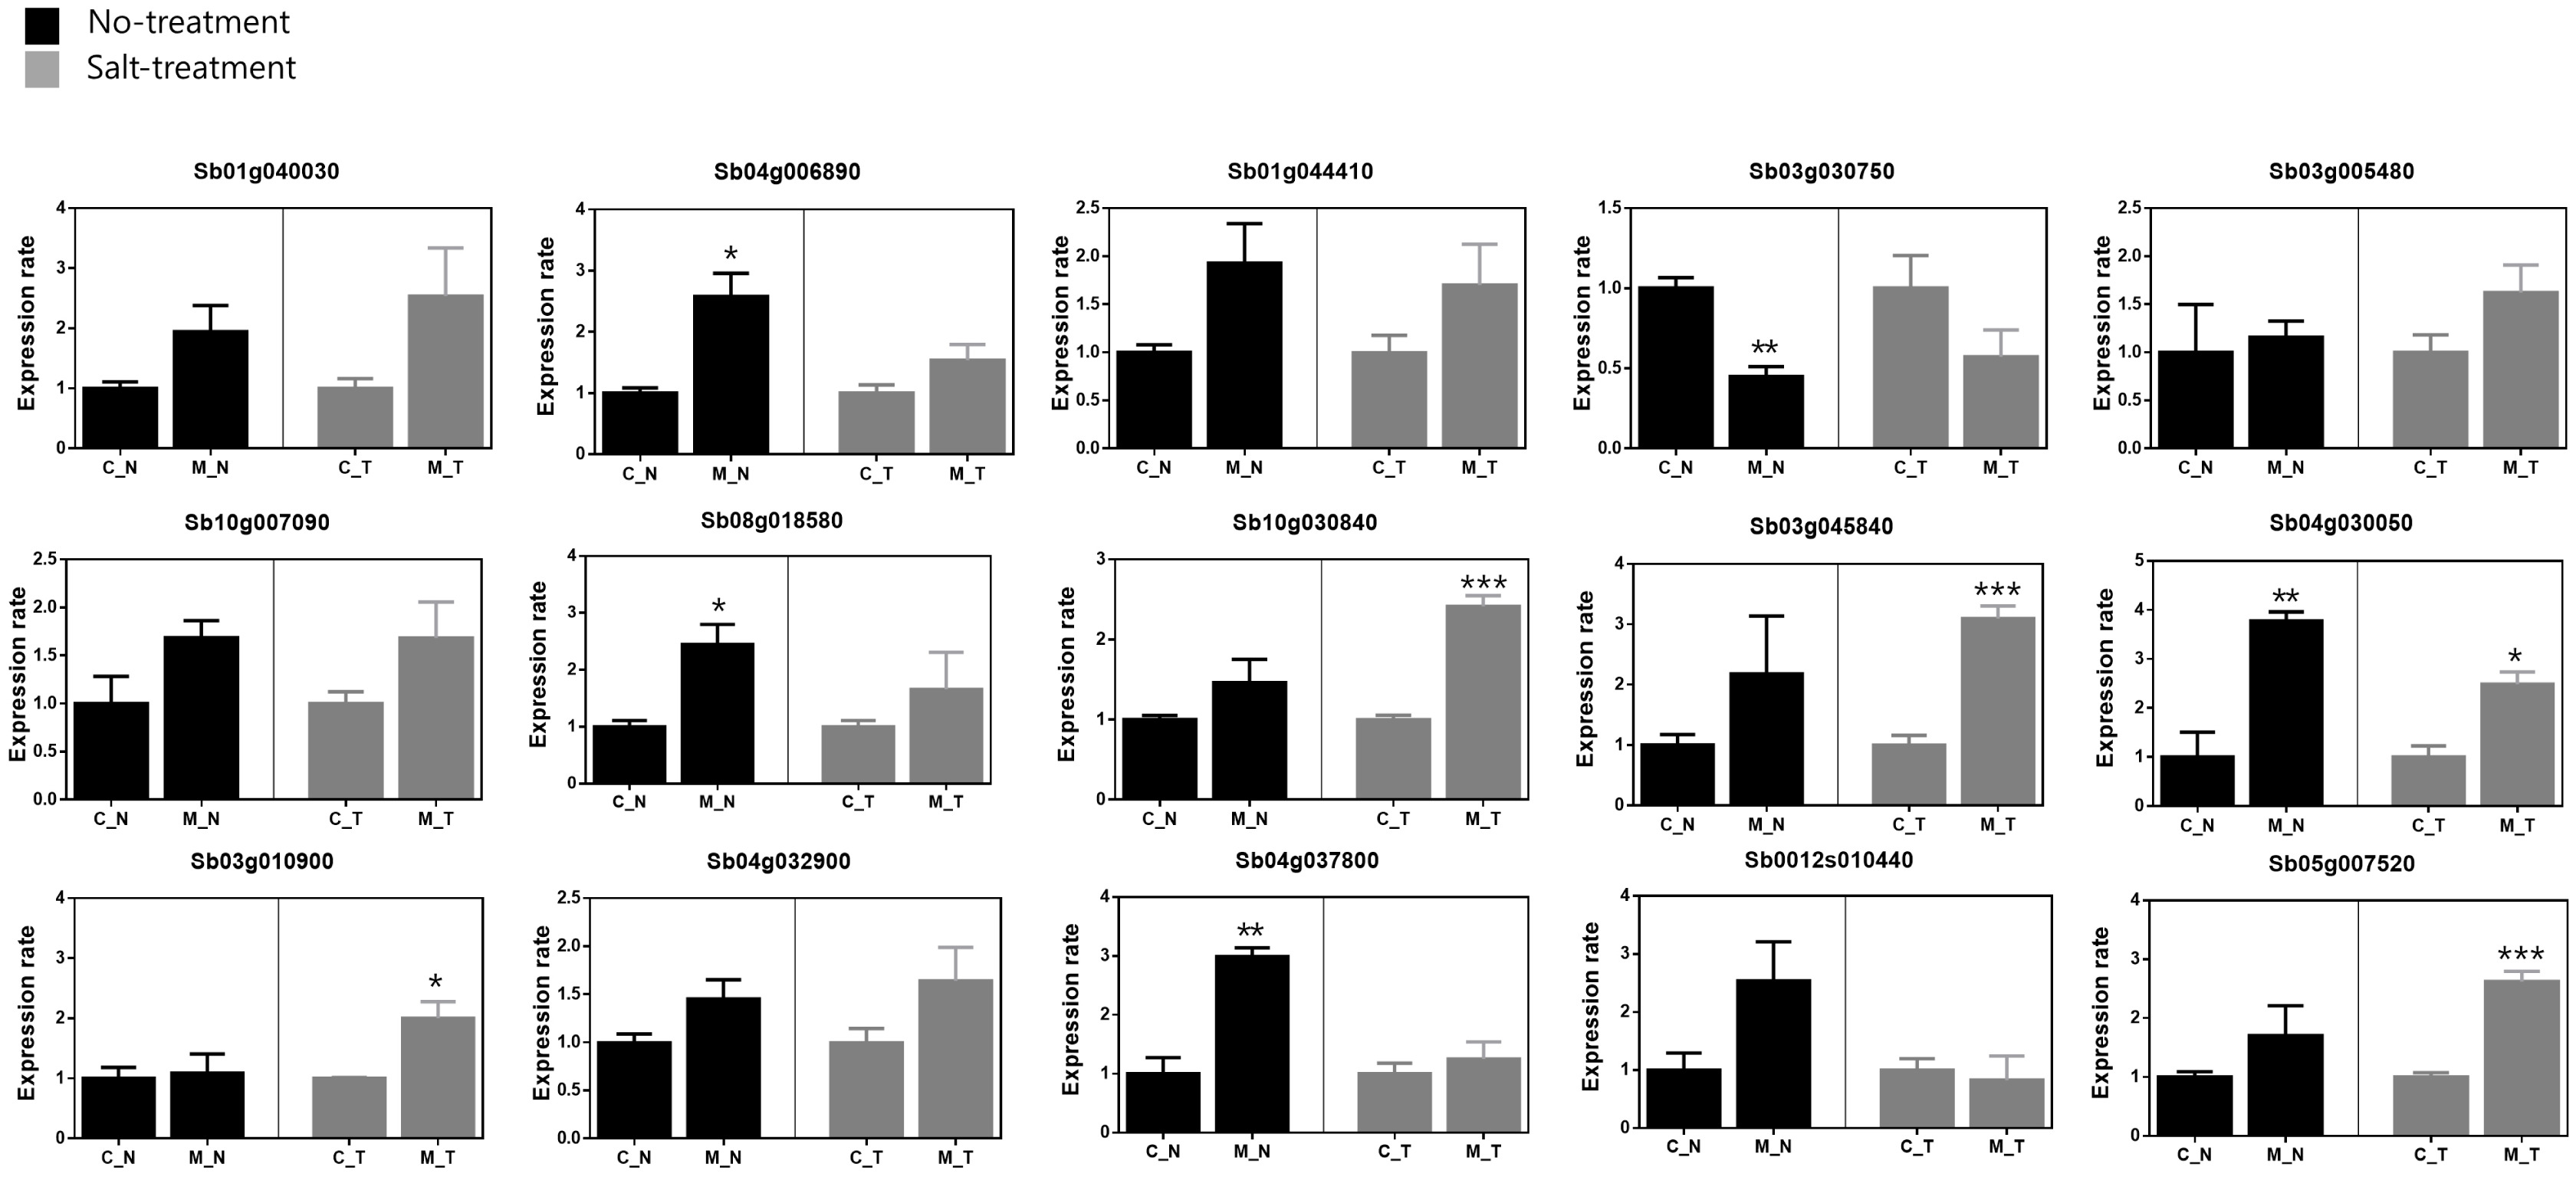
Table 2). A comparison of gene transcript levels under control (no salt) conditions revealed higher transcript levels of 14 genes in B5 than in C3: namely, Sb01g040030, Sb04g006890, Sb01g044410, Sb03g005480, Sb10g007090, Sb08g018580, Sb10g030840, Sb03g045840, Sb04g030050, Sb03g010900, Sb04g032900, Sb04g037800, Sb0012s010440, and Sb05g007520 (
Fig. 2). According to statistical significance, Sb04g006890, Sb08g018580, Sb04g030050 and Sb04g037800 were showed significantly increase in B5 (*:
P < 0.05, **:
P < 0.01). Otherwise, Sb3g030750 showed a significantly decreased transcript level approximately 0.55 times (**:
P < 0.01). In the salt treatment, 13 genes (Sb01g040030, Sb04g006890, Sb01g044410, Sb03g005480, Sb10g007090, Sb08g018580, Sb10g030840, Sb03g045840, Sb04g030050, Sb03g010900, Sb04g032900, Sb04g037800, and Sb05g 007520) showed higher transcript levels in B5 than in C3. Of them, Sb10g030840, Sb03g045840, Sb04g030050, Sb03g010900 and Sb05g007520 were revealed a statisti-cally significant increase in B5 (*:
P < 0.05, ***:
P < 0.01). Especially, Sb03g045840 was most highly expres-sed in B5 compare with C3 (approximately 3.1 times). While the transcript level of Sb3g030750 was also lower in B5 than in C3. Although most of the genes were up-regulated under salt stress in the B5 mutant, Sb0012s010440 was slightly down-regulated in B5 in the salt treatment (
Fig. 2). Transcripts of five genes (Sb07g028370, Sb04g035130, Sb01g021170, Sb07g003270, and Sb02g000490) were not detected in either C3 or B5.
DISCUSSION
In this study, we investigated the agronomic traits of 36 sorghum original accessions and mutants, focusing on the mutants showing increased salt tolerance. Among the 36 sorghum materials, 10 sorghum mutants generated by gamma irradiation showed significantly increased biomass compared with that of their original accessions.
Radiation breeding has been extensively used to generate new genetic diversity. It directly produces mutant varieties without the long and difficult process of traditional breeding (
Horn et al. 2016). For this reason, radiation breeding has been used to generate new genetic variants of diverse crops and ornamental plants. The use of gamma irradiation to improve sorghum has focused on improving grain yields under environmental stress and enhancing biomass for the bioenergy industry (
Human et al. 2011). In this study, compared with the original accessions, some mutants showed increased plant height (by up to 1.6 times in B2), panicle length (by up to 3.4 times in B3), stalk diameter (by up to 1.4 times in SY6), sugar content (by up to 1.5 times in SY8), and fresh weight (by up to 1.2 times in B5).
Bok et al. (2010) generated a sorghum mutant showing a 1.5-times increase in plant height and 5.8-times increase in dry weight compared with those of the control.
Kham et al. (2015) found that sorghum mutants showed increases in plant height, stem width, and seed yield of up to 1.2-times compared with those of their original materials, which is consistent with our results.
Increased biomass and plant growth are closely related to photosynthetic efficiency. Previous studies have shown that the enzymes and/or genes involved in photosynthesis confer tolerance to abiotic stress conditions including salinity (
Kandoi et al. 2018;
Mukherjee et al. 2021), drought (
Ding et al. 2015;
Yang et al. 2020), and high temperature (
Sharkey et al. 1998;
Feng et al. 2007). Therefore, we hypothesized that mutants showing increased biomass would also show enhanced salt tolerance and altered transcript levels of some stress-related genes under saline conditions. To test this hypothesis, we monitored seed germination and determined the shoot and root length of mutants and their original accessions under salt treatment (150 mM NaCl). Compared with their original accessions, the B5 and SY6 mutants showed 1.2-times higher seed germination, 2.2-times greater shoot length, and 2.5-times greater root length in the salt treatment. This degree of improvement in the germination rate, shoot length, and root length exceeds those reported in other studies on salt tolerance in sorghum (
Taylor et al. 1975;
Francois et al. 1984;
Kausar et al. 2012). In contrast, the SY8 and SY9 mutants derived from C6 showed severely decreased germination rates and shoot length in the 150 mM salt treatment. Further research is required to determine the mechanisms underlying the differences in salt tolerance among the mutants.
To determine which genes may be related to increased salt tolerance, we compared the transcript levels of 15 stress-responsive genes between the most salt-tolerant mutant, B5, and its original accession (C3). The 15 genes were selected on the basis of the results of other studies on stress-responsive gene expression, and encoded heat shock proteins, ROS scavenging system, aquaporins, and transcription factors. Analyses of gene transcript levels by qRT-PCR revealed increased transcript levels of Sb03g045840 (by 3.1 times) and Sb05g007520 (by 2.62 times) in B5 compared with C3 by salt treatment. In contrast, the transcript levels of Sb03g030750 and Sb0012s010440 were lower in B5 than in C3 (respectively, 0.43 and 0.17 that of their respective transcript levels in C3). Sb03g045840 encodes a protein involved in auxin synthesis and transport (
Johnson et al. 2015) and Sb05g007520 encodes an aquaporin (
Symanczik 2014). Sb03g030750 was down-regulated in the mutant in the salt treatment. Consistent with this result,
Puranik et al. (2013) detected decreased expression of the Sb03g030750 homolog in Foxtail millet (Setaria italica L.) under salt treatment. Sb0012s010440 encodes a protein involved in growth at the seedling stage that plays an important role in drought tolerance (
Woldesemayat et al. 2018). Changes in gene expression are an important part of the salinity response mechanism of sorghum. Information on stress-related genes and networks will be useful for the genetic improvement of sorghum varieties through biotechnology approaches. As mentioned above, there is a strong relationship between photosynthetic efficiency and tolerance to abiotic stress. The results of our gene expression analyses provide further evidence for this relationship. Indeed, out of the 15 genes analyzed, 14 showed higher transcript levels in the mutant in the absence of salt, and 13 showed higher transcript levels in the mutant than in the original accession in the salt treatment. The approach used in this study represents an easy and useful method to select salt-tolerant sorghum mutants and will be helpful for marker-assisted breeding and selection.
In conclusion, we selected biomass-increased lines from mutants generated by radiation breeding, and these lines were confirmed to show increased salt tolerance. Genes involved in salt stress were identified on the basis of their expression patterns in B5, the most salt-tolerant mutant. The information gained in this study will be useful for improving the functional value of sorghum in the future and shows that these newly developed lines are an important genetic resource for cultivation in high-stress environments.
ACKNOWLEDGEMENTS
This work was supported by the research program of KAERI, Republic of Korea (Project No. 523320-22).
Fig. 1Growth of original accession (C3) and mutant lines (B5, SY6, SY7) at 2 week after salt treatment. Scale bar = 5 cm.
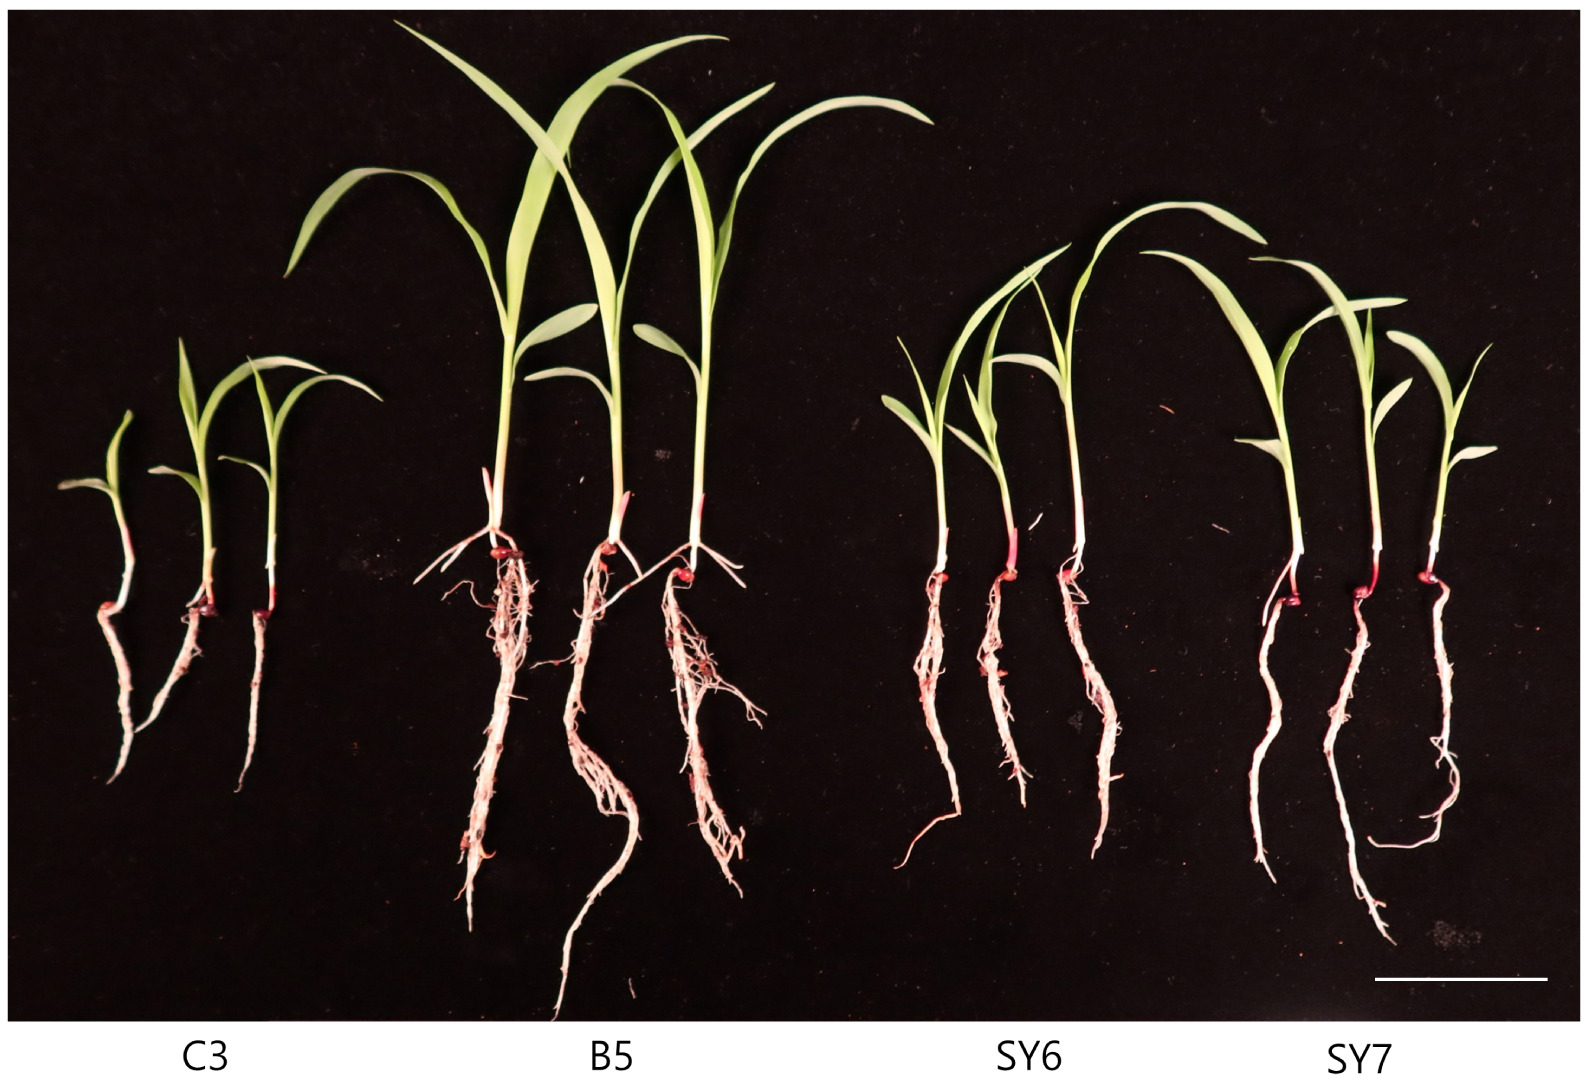
Fig. 2Relative transcript levels of 15 genes in the most salt-tolerant mutant (B5) and its original accession (C3). C_N: C3 no salt, C_T: C3 salt treatment, M_N: B5 no salt, M_T: B5 salt treatment.
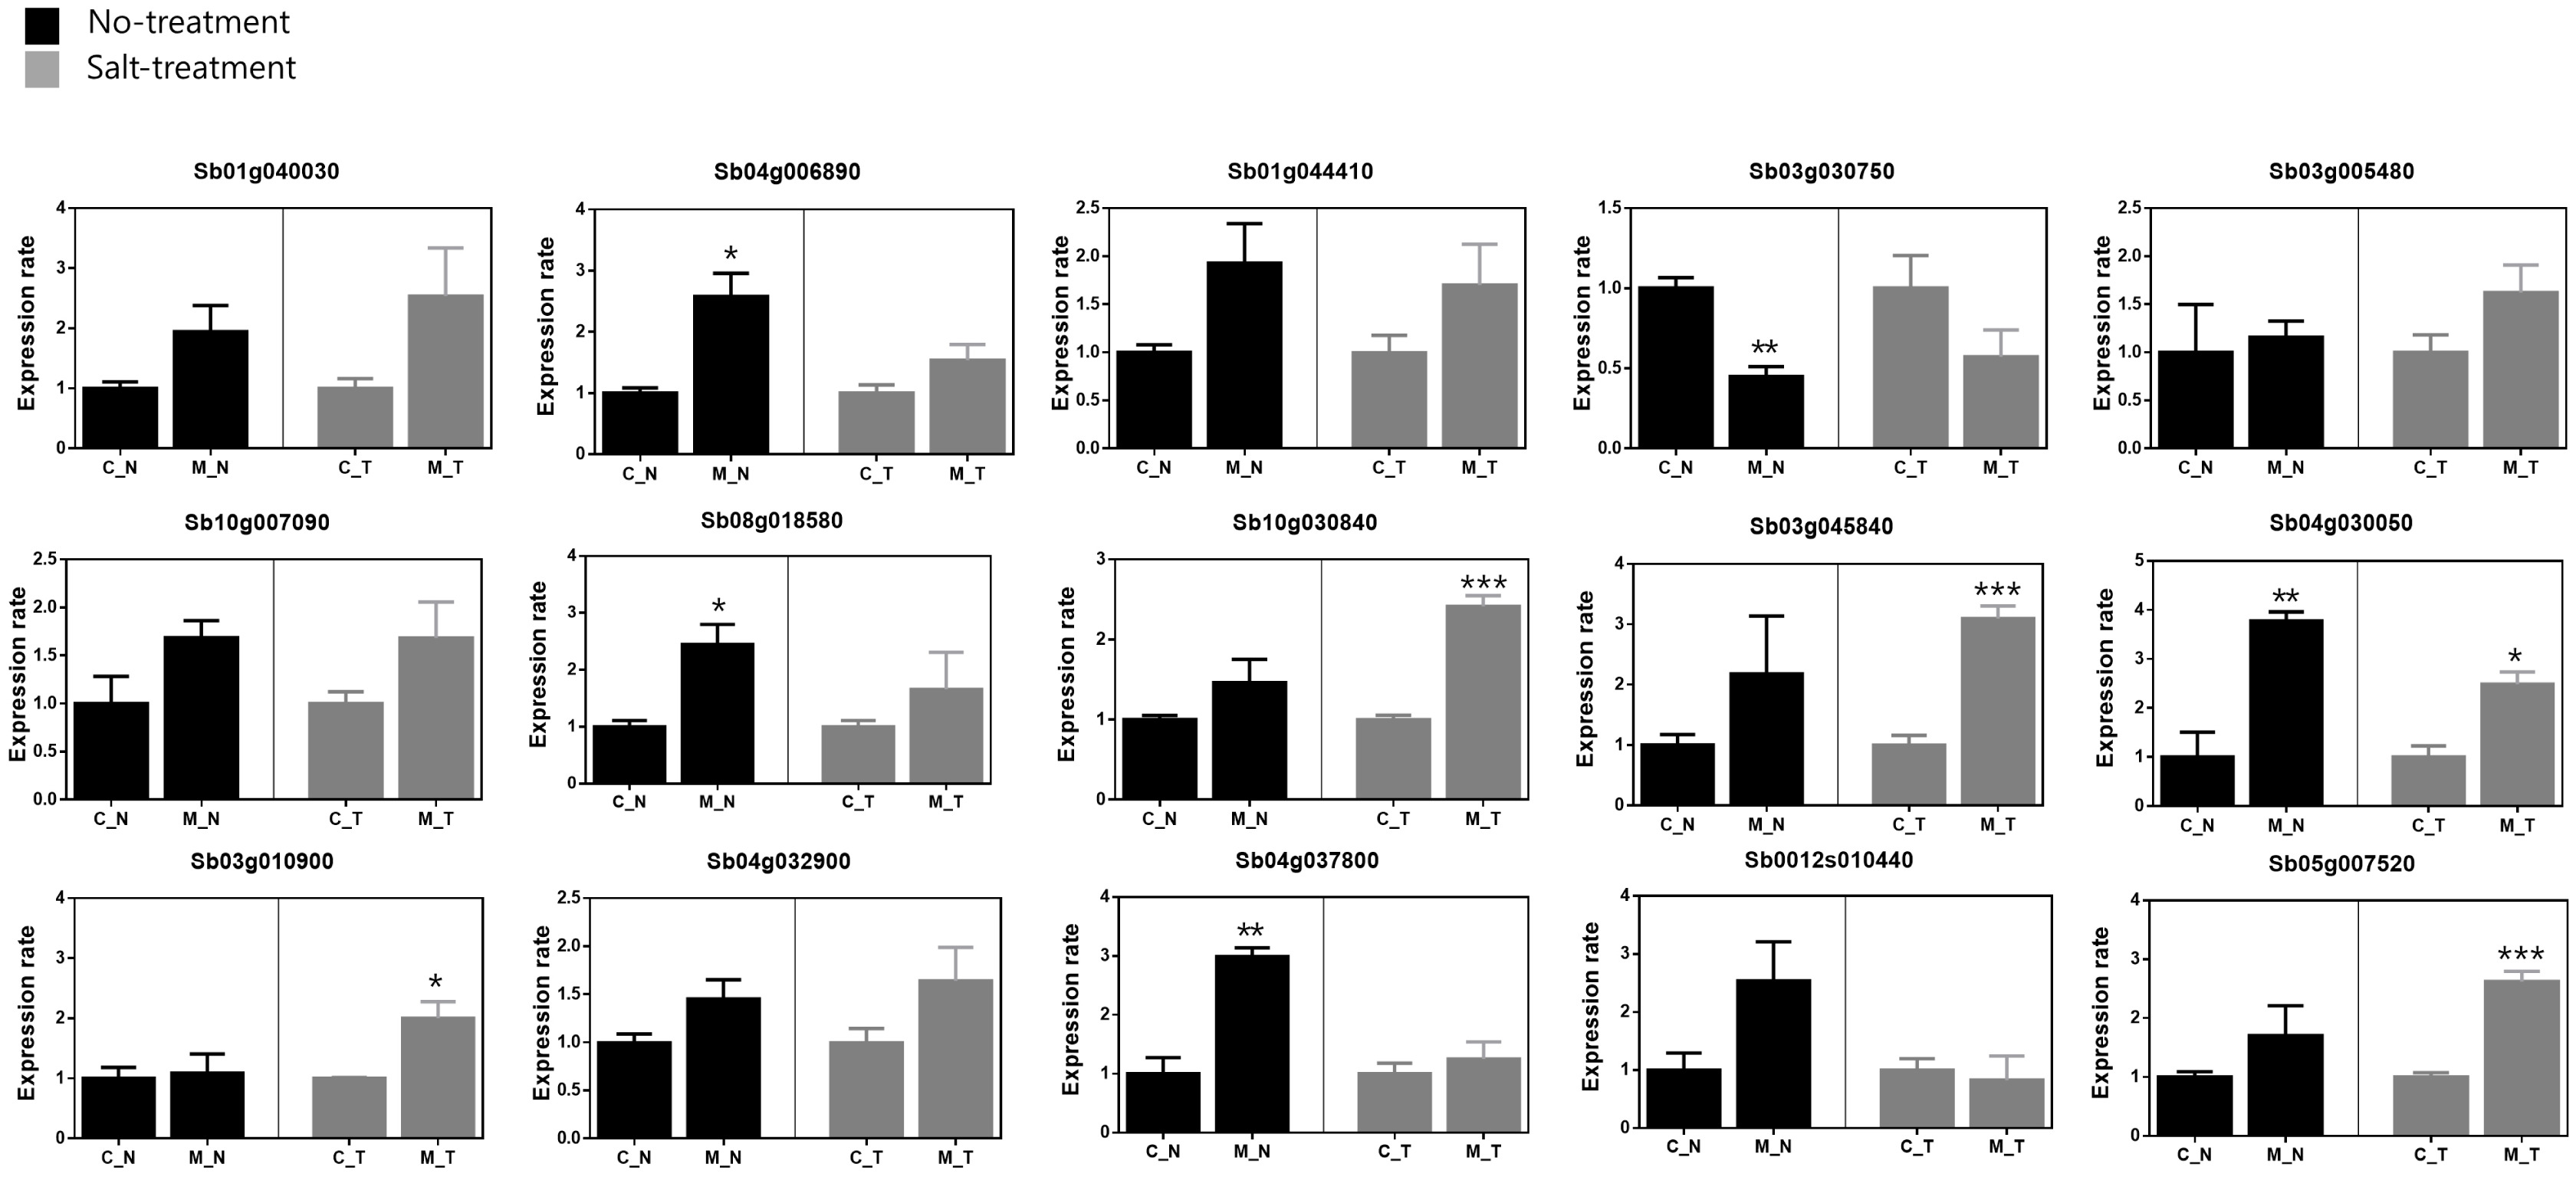
Table 1Agronomic characteristics of original materials (seven accessions and one cultivar) and 28 mutants.
Table 1
|
Symbol |
Accession no./sources |
Plant height (cm) |
Panicle length (cm) |
Stalks diameter (mm) |
Sugar content (brix) |
Fresh weight (kg) |
|
C1 |
IT100992 |
271.67e
|
21.33d
|
17.25ab
|
9.53ab
|
3.77a
|
|
B1 |
Irradiated 100 Gy |
373.33d
|
38bc
|
21.1ab
|
7.47bc
|
2.97a
|
|
B2 |
Irradiated 100 Gy |
443bc
|
44.33abc
|
23.32a
|
7.63bc
|
3.0a
|
|
SY1 |
Irradiated 100 Gy |
404cd
|
42.67abc
|
23.97a
|
11.73a
|
2.8a
|
|
SY2 |
Irradiated 100 Gy |
519.67a
|
46ab
|
17.97ab
|
7.57bc
|
2.83a
|
|
SY3 |
Irradiated 100 Gy |
419.33c
|
44.33abc
|
17.11ab
|
6c
|
2.47a
|
|
SY4 |
Irradiated 100 Gy |
369d
|
34.67c
|
14.92b
|
8.1bc
|
1.03a
|
|
SY5 |
Irradiated 100 Gy |
465.67b
|
52.67a
|
19.1ab
|
6.3bc
|
2.87a
|
|
C2 |
IT124065 |
281d
|
15.33c
|
15.59c
|
13.8a
|
3.1a
|
|
B3 |
Irradiated 100 Gy |
443.33a
|
53a
|
20.9b
|
10.43a
|
2.8ab
|
|
B4 |
Irradiated 200 Gy |
340b
|
19c
|
32.97a
|
12.6a
|
1.5c
|
|
E1 |
Irradiated 200 Gy |
311c
|
28b
|
18.19bc
|
12.47a
|
2.73b
|
|
C3 |
IT124115 |
290c
|
35a
|
21.89bc
|
17.3a
|
2.9bc
|
|
B5 |
Irradiated 400 Gy |
422.67a
|
32.33a
|
23.98b
|
8.87c
|
3.43a
|
|
B6 |
Irradiated 400 Gy |
332b
|
30.67a
|
22.07bc
|
9.13c
|
2.7c
|
|
SY6 |
Irradiated 300 Gy |
261c
|
31a
|
32.31a
|
12.8b
|
1.5d
|
|
SY7 |
Irradiated 400 Gy |
454.33a
|
36a
|
19.35c
|
7.23d
|
3b
|
|
C4 |
IT028269 |
369.33b
|
32.33b
|
18.92b
|
9.03b
|
3.2a
|
|
SY8 |
Irradiated 200 Gy |
437a
|
40.33ab
|
26.19a
|
13.43a
|
2.97a
|
|
SY9 |
Irradiated 200 Gy |
413.33ab
|
45.33a
|
24.87a
|
10.8b
|
2.9a
|
|
C7 |
IS8777 |
357c
|
25b
|
17.03a
|
15.73a
|
2.37c
|
|
B7 |
Irradiated 200 Gy |
442.67b
|
46a
|
19.1a
|
14.77a
|
2.73b
|
|
B8 |
Irradiated 200 Gy |
553.67a
|
44.33a
|
21.7a
|
7.9b
|
3.13a
|
|
B9 |
Irradiated 200 Gy |
387.33bc
|
25.33b
|
17.99a
|
14.57a
|
2.67bc
|
|
C10 |
IS20740 |
347.67bc
|
31.33a
|
16.69a
|
10.73b
|
2.53a
|
|
E4 |
Irradiated 300 Gy |
367.67b
|
35.67a
|
17.83a
|
12.63ab
|
2.53a
|
|
B10 |
Irradiated 100 Gy |
328c
|
31a
|
19.82a
|
16.5a
|
1b
|
|
B11 |
Irradiated 200 Gy |
424.33a
|
36.33a
|
19.34a
|
9.93b
|
2.6a
|
|
C12 |
IS27887 |
364b
|
33.67b
|
25.84a
|
11.2a
|
3.4a
|
|
B12 |
Irradiated 200 Gy |
375.33b
|
31b
|
17.09b
|
11.93a
|
2.5c
|
|
B13 |
Irradiated 400 Gy |
424a
|
49a
|
20.85b
|
13.6a
|
2.83b
|
|
C13 |
Dansusu2ho |
294.33b
|
25b
|
20.39a
|
14.67ab
|
2.5b
|
|
E2 |
Irradiated 100 Gy |
338.33ab
|
38a
|
18.77a
|
16.73a
|
2.53ab
|
|
E3 |
Irradiated 300 Gy |
333ab
|
26b
|
21.67a
|
15.7ab
|
2.7ab
|
|
SY10 |
Irradiated 100 Gy |
345.67ab
|
33.33ab
|
17.68a
|
16.43a
|
2.43b
|
|
SY11 |
Irradiated 200 Gy |
402.67a
|
32.67ab
|
22.3a
|
13.37b
|
2.83a
|
Table 2Sequences of gene primers used in this study, and information about the roles of encoded proteins in the salt tolerance of sorghum.
Table 2
|
Gene type |
Genes |
Forward (5’-3’) |
Reverse (5’-3’) |
Name/reported genes |
|
Heat shock protein |
Sb07g028370 |
TCTGCACTGATCACCGTCTC |
GAACGTACCCTTACCGACGA |
25.3 kDa heat shock protein, chloroplastic (Precursor) (Johnson et al. 2014) |
|
Sb01g040030 |
GACGGCAACATCCTTCAGAT |
GCTTCTTGACGTCCTCCTTG |
17.9 kDa class I heat shock protein (Johnson et al. 2014) |
|
Sb04g006890 |
ATGGCTTTAGCTCGCCTGT |
AAATCTGTCTCCGGGGCTAC |
23.6 kDa heat shock protein, mitochondrial (Zhang et al. 2019) |
|
Sb04g035130 |
ACCGTGTGCTGGTGATGAA |
CTGCACGGACTTGGTCTTCT |
18.6 kDa class III heat shock protein (Zhang et al. 2019) |
|
Sb01g021170 |
AGTGGTGCCACTTCACCAA |
GGCACCTGGATGTAGAGCAT |
16.6 kDa heat shock protein (Schnable et al. 2011) |
|
Aquaporin |
Sb04g032900 |
CAACAACCTCCGCTACAACA |
AAGGTGATGATGATCTCGAAC |
Aquaporin TIP2-1 (Zhang et al. 2019) |
|
Sb04g037800 |
CAACAACCTCCGCTACAACA |
AAGGTGATGATGATCTCGAAC |
Aquaporin PIP1-5 (Liu et al. 2014) |
|
Sb0012s010440 |
TTCCTCTACGTGACGGTGCT |
CAGTAGACGAGCGCGAAGAT |
Aquaporin PIP2-2 (Guo et al. 2016) |
|
Sb07g003270 |
ATCCCCATGCAGTGAAAGAG |
TTGCCACCATGTAGATCCAA |
Aquaporin NIP3-2 (Almodares and Hadi 2009) |
|
Sb05g007520 |
CGTCCATGAACCCAGCTAAT |
CCCTAAAAATCCATCCAGCA |
Aquaporin SIP1-1 (Almodares and Hadi 2009) |
|
ROS scavenging system |
Sb02g000490 |
CTTCCACGATTTCACCGTCT |
TGACGACGTTGCACTTTCTC |
Peroxidase 1 (Precursor) (Mizuno et al. 2018) |
|
Sb10g030840 |
ACCCAAAGACCAATTTGCAG |
CCCTCCATGTGCCTGTAGTT |
Catalase isozyme 1 (Li et al. 2020) |
|
Sb03g045840 |
CATTCTGGAGGACCTCTTCG |
CGGCTTGGTAAGCTTGTTCT |
Probable glutathione S-transferase (Bandara et al. 2019) |
|
Sb04g030050 |
TCTTCCGTAACAAGCCCATC |
CGGTGGATGATGTAGACGTG |
Thioredoxin reductase NTRB (Forghani et al. 2018) |
|
Sb03g010900 |
GCATTCTGGCAAACCTGATT |
TTCCCGAGACTTCTGAGCAT |
TPR repeat-containing thioredoxin TTL1 (Ndimba 2017) |
|
Transcription factor |
Sb01g044410 |
CGGCTACGACGATAGATTGG |
CTGCAGCTGGAGAATCTGTG |
Ethylene-responsive transcription factor RAP2-4 (Yan et al. 2013) |
|
Sb03g030750 |
CTAGCGACGACTGATCACCA |
GCCTGGTTGTAGCCGATTAG |
NAC domain-containing protein 8 (Handakumbura 2014) |
|
Sb03g005480 |
CTTGAGCAGCACCAGCATAG |
AAGCTCGATCGGTTCATCAT |
Transcription factor ASG4 (Saha et al. 2019) |
|
Sb10g007090 |
GAGGTGGCAAAACTCAAGGA |
CTTTGCCTTTGGTCCATGTT |
bZIP transcription factor TRAB1 (Yang et al. 2017) |
|
Sb08g018580 |
TGGAGGACACACATGAGGAA |
CCCTTGAGGATGCTTGTGAT |
MYB59 [Zea mays] (Muthamilarasan et al. 2014) |
Table 3Germination rate and shoot/root length of mutants and their original materials under control (0 mM NaCl) and salt treatment (150 mM NaCl) conditions.
Table 3
|
Symbol |
PI number |
Germination (%) |
Shoot length (cm) |
Root length (cm) |
|
0 mM |
150 mM |
0 mM |
150 mM |
P value |
0 mM |
150 mM |
P value |
|
C1 |
IT100992 |
100% |
90% |
17.80 |
1.20 |
**
|
48.80 |
8.00 |
*
|
|
B2 |
Irradiated 100 Gy |
100% |
100% |
14.20 |
1.20 |
*
|
46.40 |
2.00 |
**
|
|
SY3 |
Irradiated 100 Gy |
100% |
100% |
5.00 |
0.60 |
|
34.60 |
2.00 |
*
|
|
C2 |
IT124065 |
100% |
95% |
5.40 |
1.80 |
|
24.80 |
2.20 |
|
|
B3 |
Irradiated 100 Gy |
100% |
100% |
15.60 |
1.40 |
*
|
35.80 |
5.20 |
*
|
|
C3 |
IT124115 |
100% |
90% |
12.60 |
6.30 |
|
30.80 |
4.70 |
|
|
B5 |
Irradiated 400 Gy |
100% |
100% |
21.80 |
14.20 |
|
58.80 |
11.90 |
|
|
SY6 |
Irradiated 300 Gy |
100% |
85% |
14.40 |
10.30 |
|
18.20 |
7.20 |
|
|
SY7 |
Irradiated 400 Gy |
100% |
95% |
5.60 |
8.30 |
|
13.80 |
9.20 |
|
|
C4 |
IT028269 |
100% |
90% |
6.20 |
6.00 |
|
1.80 |
1.20 |
|
|
SY8 |
Irradiated 200 Gy |
100% |
55% |
13.60 |
1.60 |
*
|
26.40 |
6.80 |
|
|
SY9 |
Irradiated 200 Gy |
100% |
60% |
19.20 |
1.00 |
*
|
41.80 |
15.20 |
|
|
C7 |
IS8777 |
100% |
65% |
3.00 |
1.20 |
|
3.80 |
2.20 |
|
|
B8 |
Irradiated 200 Gy |
100% |
75% |
29.20 |
3.20 |
**
|
68.40 |
3.00 |
**
|
|
B9 |
Irradiated 200 Gy |
100% |
95% |
14.00 |
3.60 |
|
51.80 |
16.00 |
*
|
References
- Ahmed MM, Abdalla IG, Salih A, Hassan AB. 2018. Effect of gamma radiation on storability and functional properties of sorghum grains (Sorghum bicolor L.). Food Sci. Nutr.. 6(7): 1933-1939.
- Almodares A, Hadi M. 2009. Production of bioethanol from sweet sorghum: A review. Afr. J. Agric. Res.. 4(9): 772-780.
- Asfaw KG. 2011. Effects of salinity on seedling biomass production and relative water content of twenty sorghum (Sorghum biolor L. Moench) accessions. Asian J. Agric. Sci.. 3(3): 242-249.
- Bafeel SO. 2014. Physiological parameters of salt tolerance during germination and seedling growth of Sorghum bicolor cultivars of the same subtropical origin. Saudi J. Biol. Sci.. 21(4): 300-304.
- Bandara AY, Weerasooriya DK, Liu S, Little CR. 2019. Dynamics of host glutathione and glutathione related enzymes in Macrophomina phaseolina-sorghum bicolor interaction. BioRxiv 853986..
- Bok TG, Lee MS, Shin WS, Ryu JH, Lee HB. 2010. Major characters of the developed sweet sorghum lines induced by mutagene, gamma-ray. Korean J. Agric. Sci.. 37(3): 351-354.
- Chipanshi A, Chanda R, Totolo O. 2003. Vulnerability assessment of the maize and sorghum crops to climate change in Botswana. Clim. Change. 61(3): 339-360.
- Dai X, Huo Z, Wang H. 2011. Simulation for response of crop yield to soil moisture and salinity with artificial neural network. Field Crops Res.. 121(3): 441-449.
- Ding Z, Sun X, Huang S, Zhou B, Zhao M. 2015. Response of photosynthesis to short-term drought stress in rice seedlings overexpressing C4 phosphoenolpyruvate carboxylase from maize and millet. Photosynthetica. 53(4): 481-488.
- Feng L, Wang K, Li Y, Tan Y, Kong J, Li H, et al. 2007. Overexpression of SBPase enhances photosynthesis against high temperature stress in transgenic rice plants. Plant Cell Rep.. 26(9): 1635-1646.
- Forghani AH, Almodares A, Ehsanpour AA. 2018. Potential objectives for gibberellic acid and paclobutrazol under salt stress in sweet sorghum (Sorghum bicolor [L.] Moench cv. Sofra). Appl. Biol. Chem.. 61(1): 113-124.
- Francois L, Donovan T, Maas E. 1984. Salinity Effects on Seed Yield, Growth, and Germination of Grain Sorghum 1. Agron. J.. 76(5): 741-744.
- Guo M, Hayes K, Peterson-Burch B, Simmons C, Sivasankar S, Zou J. 2016. Genes for improving nutrient uptake and abiotic stress tolerance in plants. In: Google Patents.
- Handakumbura P. 2014. Understanding the transcriptional regulation of secondary cell wall biosynthesis in the model grass Brachypodium distachyon.
- Hassan AB, Diab EE, Mahmoud NS, Elagib RA, Rushdi MA, Osman GA. 2013. Effect of radiation processing on in vitro protein digestibility and availability of calcium, phosphorus and iron of peanut. Radiat. Phys. Chem.. 91: 200-202.
- Hong MJ, Kim DY, Nam BM, Ahn JW, Kwon SJ, Seo YW. et al2019. Characterization of novel mutants of hexaploid wheat (Triticum aestivum L.) with various depths of purple grain color and antioxidant capacity. J. Sci. Food Agric.. 99(1): 55-63.
- Horn LN, Ghebrehiwot HM, Shimelis HA. 2016. Selection of novel cowpea genotypes derived through gamma irradiation. Front. Plant Sci.. 7: 262
- Human S, Andreani S, Sihono S, Indriatama W. 2011. Stability test for sorghum mutant lines derived from induced mutations with gamma-ray irradiation. At. Indones.. 37(3): 102-106.
- Johnson SM, Lim FL, Finkler A, Fromm H, Slabas AR, Knight MR. 2014. Transcriptomic analysis of Sorghum bicolor responding to combined heat and drought stress. BMC Genomics. 15(1): 1-19.
- Johnson SM, Cummins I, Lim FL, Slabas AR, Knight MR. 2015. Transcriptomic analysis comparing stay-green and senescent Sorghum bicolor lines identifies a role for proline biosynthesis in the stay-green trait. J. Exp. Bot.. 66(22): 7061-7073.
- Kamal AHM, Kim KH, Shin KH, Choi JS, Baik BK, Tsujimoto H, et al. 2010. Abiotic stress responsive proteins of wheat grain determined using proteomics technique. Aust. J. Crop Sci.. 4(3): 196-208.
- Kandoi D, Mohanty S, Tripathy BC. 2018. Overexpression of plastidic maize NADP-malate dehydrogenase (ZmNADP- MDH) in Arabidopsis thaliana confers tolerance to salt stress. Protoplasma. 255(2): 547-563.
- Kausar A, Ashraf MY, Ali I, Niaz M, Abbass Q. 2012. Evaluation of sorghum varieties/lines for salt tolerance using physiological indices as screening tool. Pak. J. Bot.. 44(1): 47-52.
- Kham NH, Win NC, Minn M. 2015. Study on the variability of induced mutation for improvement of local cultivar sorghum (Shweni-15). Int. J. Tech. Res. and Appl.. 3(6): 139-144.
- Kim JM, Lyu JI, Ryu J, Kim DG, Lee MK, Kim JB, et al. 2020. Comparison of Salinity Tolerance Between Grain and Sweet Sorghum Germplasms [Sorghum Bicolor (L.) Moench]. Korean Society of Breeding Science. 52(1): 32-40.
- Krishnamurthy L, Serraj R, Hash CT, Dakheel AJ, Reddy BV. 2007. Screening sorghum genotypes for salinity tolerant biomass production. Euphytica. 156(1): 15-24.
- Lee S, Bae H, Lee S, Oh Y, Ryu J. 2015. The society of agricultural research on reclaimed lands. SARRL (Ed.). SARRL. Wanju, Korea..
- Li H, Li Y, Ke Q, Kwak SS, Zhang S, Deng X. 2020. Physiological and differential proteomic analyses of imitation drought stress response in Sorghum bicolor root at the seedling stage. Int. J. Mol. Sci.. 21(23): 9174
- Li J, Pu L, Han M, Zhu M, Zhang R, Xiang Y. 2014. Soil salinization research in China: advances and prospects. J. Geogr. Sci.. 24(5): 943-960.
- Liu P, Yin L, Deng X, Wang S, Tanaka K, Zhang S. 2014. Aquaporin-mediated increase in root hydraulic conductance is involved in silicon-induced improved root water uptake under osmotic stress in Sorghum bicolor L. J. Exp. Bot.. 65(17): 4747-4756.
- Livak KJ, Schmittgen TD. 2001. Analysis of relative gene expression data using real-time quantitative PCR and the 2− ΔΔCT method. methods. 25(4): 402-408.
- Mehlo L, Mbambo Z, Bado S, Lin J, Moagi SM, Buthelezi S, et al. 2013. Induced protein polymorphisms and nutritional quality of gamma irradiation mutants of sorghum. Mutat. Res. -Fundam. Mol. Mech. Mutagen.. 749: 66-72.
- Mizuno H, Kasuga S, Kawahigashi H. 2018. Root lodging is a physical stress that changes gene expression from sucrose accumulation to degradation in sorghum. BMC Plant Biol.. 18(1): 1-12.
- Mukherjee S, Mukherjee A, Das P, Bandyopadhyay S, Chattopadhyay D, Chatterjee J, et al. 2021. A salt‐tolerant chloroplastic FBPase from Oryza coarctata confers improved photosynthesis with higher yield and multi‐stress tolerance to indica rice. Plant Cell Tissue Organ Cult.. 145(3): 561-578.
- Mukisa IM, Muyanja CM, Byaruhanga YB, Langsrud T, Narvhus JA. Schüller RB2012. Gamma irradiation of sorghum flour: Effects on microbial inactivation, amylase activity, fermentability, viscosity and starch granule structure. Radiat. Phys. Chem.. 81(3): 345-351.
- Muthamilarasan M, Khandelwal R, Yadav CB, Bonthala VS, Khan Y, Prasad M. 2014. Identification and molecular characterization of MYB transcription factor superfamily in C4 model plant foxtail millet (Setaria italica L.). PLoS One. 9(10): e109920
- Ndimba RJ. 2017. Biophysical characterization of the mineral composition of seeds with varying genetic background including transgenic sorghum with reduced amounts of the storage protein kafirin. Stellenbosch: Stellenbosch University..
- Ngara R, Ndimba R, Borch-Jensen J, Jensen ON, Ndimba B. 2012. Identification and profiling of salinity stress- responsive proteins in Sorghum bicolor seedlings. J. Proteomics. 75(13): 4139-4150.
- Parida AK, Das AB. 2005. Salt tolerance and salinity effects on plants: a review. Ecotoxicol. Environ. Saf.. 60(3): 324-349.
- Puranik S, Sahu PP, Mandal SN, Parida SK, Prasad M. 2013. Comprehensive genome-wide survey, genomic constitution and expression profiling of the NAC transcription factor family in foxtail millet (Setaria italica L.). PLoS One. 8(5): e64594
- Roychoudhury A, Chakraborty M. 2013. Biochemical and molecular basis of varietal difference in plant salt tolerance. Annu. Res. Rev. Biol. 422-454..
- Saha D, Mukherjee P, Dutta S, Meena K, Sarkar SK, Mandal AB, et al. 2019. Genomic insights into HSFs as candidate genes for high-temperature stress adaptation and gene editing with minimal off-target effects in flax. Sci. Rep.. 9(1): 1-18.
- Schnable JC, Springer NM, Freeling M. 2011. Differentiation of the maize subgenomes by genome dominance and both ancient and ongoing gene loss. Proc. Natl. Acad. Sci. U.S.A.. 108(10): 4069-4074.
- Sharkey TD, Badger MR, Andrews TJ. Caemmerer Sv.1998. High temperature inhibition of photosynthesis requires RuBisCo activase for reversibility. In. Photosynthesis: mechanisms and effects: Springer. pp. 2465-2468..
- Shingote PR, Kawar PG, Pagariya MC, Kuhikar RS, Thorat AS, Babu K. 2015. SoMYB18, a sugarcane MYB transcription factor improves salt and dehydration tolerance in tobacco. Acta Physiol. Plant.. 37(10): 1-12.
- Smith R, Bhaskaran S. 1986. Sorghum [Sorghum bicolor (L. ) moench]. In. Crops I: Springer. pp. 220-233..
- Song Y, Li J, Sui Y, Han G, Zhang Y, Guo S, et al. 2020. The sweet sorghum SbWRKY50 is negatively involved in salt response by regulating ion homeostasis. Plant Mol. Biol.. 102(6): 603-614.
- Sudhakar Reddy P, Srinivas Reddy D, Sivasakthi K, Bhatnagar- Mathur P, Vadez V, Sharma KK. 2016. Evaluation of sorghum [Sorghum bicolor (L.)] reference genes in various tissues and under abiotic stress conditions for quantitative real-time PCR data normalization. Front. Plant Sci.. 7: 529
- Symanczik S. 2014. Arbuscular mycorrhizal (AM) fungal diversity of arid lands: From AM fungal species to AM fungal communities. University of Basel..
- Tari I, Laskay G. Takács ZPoór P2013. Response of sorghum to abiotic stresses: A review. J. Agron. Crop Sci.. 199(4): 264-274.
- Taylor R, Young E, Rivera R. 1975. Salt tolerance in cultivars of grain sorghum. Crop Sci.. 15(5): 734-735.
- Woldesemayat AA, Modise DM, Gemeildien J, Ndimba BK, Christoffels A. 2018. Cross-species multiple environmental stress responses: An integrated approach to identify candidate genes for multiple stress tolerance in sorghum (Sorghum bicolor (L.) Moench) and related model species. PLoS One.. 13(3): e0192678
- Yan H, Hong L, Zhou Y, Jiang H, Zhu S, Fan J, et al. 2013. A genome-wide analysis of the ERF gene family in sorghum. Genet. Mol. Res.. 12(2): 2038-2055.
- Yang Z, Chi X, Guo F, Jin X, Luo H, Hawar A, et al. 2020. SbWRKY30 enhances the drought tolerance of plants and regulates a drought stress-responsive gene, SbRD19, in sorghum. J. Plant Physiol.. 246: 153142
- Yang Z, Wang Y, Wei X, Zhao X, Wang B, Sui N. 2017. Transcription profiles of genes related to hormonal regulations under salt stress in sweet sorghum. Plant Mol. Biol. Report.. 35(6): 586-599.
- You L, Song Q, Wu Y, Li S, Jiang C, Chang L, et al. 2019. Accumulation of glycine betaine in transplastomic potato plants expressing choline oxidase confers improved drought tolerance. Planta. 249(6): 1963-1975.
- Zhang DF, Zeng TR, Liu XY, Gao CX, Li YX, Li CH, et al. 2019. Transcriptomic profiling of sorghum leaves and roots responsive to drought stress at the seedling stage. J. Integr. Agric.. 18(9): 1980-1995.