Abstract
Development of salt tolerance in rice through breeding program is mainly depends on the salinity responses of the potential rice germplasms. Coastal rice landraces of Bangladesh possess diverse morphological and physiological responses to salinity. Hence, our target is to identify candidate salt-tolerant coastal rice genotypes as a new source of salt tolerance (12 dS/m). Here, we annotated 20 Bangladeshi coastal Aus landrace rice regarding their phenotypic and genetic relatedness to salinity tolerance through multivariate analyses of five morpho-physiological traits namely, salt injury score (SIS), ion-leakage, chlorophyll concentration, root-shoot reduction percentage and profiling of DNA using simple sequence repeat (SSR). Based on the standard evaluation score (SES) the salt-induced coastal rice landraces were grouped into highly susceptible (HS), susceptible (S), moderately tolerant (MT), tolerant (T) and highly tolerant (HT). Besides, a canonical discrimination analysis of the mean trait values of five morpho-physiological parameters confirmed the above mentioned five categories of salinity tolerance. Based on all morpho-physiological parameters one genotype (Kalihytta) as highly tolerant (HT), two genotypes (Manikmuri and Monsur IRRI) as tolerant (T) and five genotypes (Nara, Iratom 27, Matichak, Abdul high IRRI and Parija) were identified as moderately tolerant (MT) against salinity. Finally, the molecular characterization using two SSR markers (RM493 and RM3412) revealed Kalihytta, Nara, Iratom 27, Parija, Lal jamaibabu and Fullbadam, as tolerant against salt stress. Our candidate salt tolerant Aus rice genotypes could be useful as novel sources of salt tolerance for thriving salt-tolerant high yielding varieties in the coastal ecosystem of Bangladesh.
-
Key words: Coastal rice, Morpho-physiological traits, Multivariate analyses, Seedling salinity tolerance, SSR markers
INTRODUCTION
Salinity, among all the abiotic stresses is a highly promi-nent issue that severely affects plant growth and develop-ment (
Nazar et al. 2011). Soil salinity is a global problem for producing crops, especially in coastal areas (
De Leon et al. 2015). Rice (
Oryza sativa) feeding almost 50% popula-tion of the world and considered one of the most important cereal crops. It is well-known as a model crop among the cereals (
Eckardt 2000). Rice is generally a salt-sensitive crop (USDA,
http://www.Ars.Usda.Gov/services/docs;,
Grover and Pental 2003). The reaction to the salt stress is variable among rice growth stages. For example, at seedling stage rice plants died at 10 dS/m (
Munns et al. 2006), and at reproductive stage, up to 90% yield loss has been observed against a relatively low level of salt stress (3.5 dS/m) (
Asch et al. 2000;
Rahman and Ahsan 2001). Salinity tolerance is a composite trait and plant’s reaction to salinity is largely depends on the environments (
Gregorio and Senadhira 1993;
Flowers 2004). Researchers already have shown much success in developing saline tolerant high yielding varieties (HYV) using several highly tolerant (HT) rice landraces (
Gregorio et al. 2002).
Rice is the major staple food crop in Bangladesh, which covers about 81% of total cropped area (BBS 2012). The country ranked 4
th position in 2014 both in area (11.77 million ha) and production (52.231 million MT) of rice, and 39
th in the yield per hectare (4.42 tha
-1) among the rice growing countries (FAOSTAT,
http://faostat.fao.org/site/ 291/default.aspx). In Bangladesh,
Aus,
Aman and
Boro, are the three rice growing seasons which are respectively cultivated in
Kharif-1 (April–July),
Kharif-2 (July–No-vember) and
Rabi (November–April). There is approximately 2.85 million hectares (Mha) of coastal areas in Bangladesh which is seriously influenced by varying degrees of salinity (SRDI, 2010). Cropping intensity of this region is far below than the national standard mainly due to dry season salinity of soil, tidal flood, heavy clay basin, scarcity of quality irrigation water, late rainfall, low fertility status etc. In last four decades the saline area has increased to about 1.056 Mha from 0.833 Mha (SRDI 2010). Inclusion of short duration and salt tolerant HYV rice may be a scholastic approach towards increasing productivity and cropping intensity in coastal ecosystem (
Hasan 2018).
However, development of salinity tolerance in crop plants through breeding programs largely depends on the good understanding of the tolerance mechanisms against salinity in the susceptible and tolerant genotypes (
Cha-um et al. 2009). In fact, the abundance of suitable donor genotypes, and adequate knowledge on the hereditary and physiological mechanisms regarding salinity tolerance for appropriate screening methods are pivotal for developing a targeted trait (
Negrão et al. 2011). For salinity tolerance study, the International Rice Research Institute (IRRI) proposed screening technique (
Gregorio et al. 1997) but the lack of suitable growth environments in different laboratories limits its reproducibility (
De Leon et al. 2015). Besides, several studies on screening techniques have already been reported (
Yeo et al. 1990;
Aslam et al. 1993;
Asch et al. 2000; Kanawapee
et al. 2012;
Mondal and Borromeo 2016). In most of the screening, salt-tolerant or susceptible rice genotypes have been identified either using visual salt injury scoring technique (
Gregorio et al. 1997) or measuring the ion toxicity (Na
+/K
+ content) levels in roots and shoots. Actually, salinity tolerance in plants is polygenic and in a study of
Yeo et al. (1990), proposed assembling of desired morpho-physiological attributes for enhancing salt tolerance in rice. In another study,
Zeng et al. (2002) employed cluster group ranking of rice genotypes using different agronomic and physiological parameters to assess the salt tolerance. Recently,
De Leon et al. (2015) proposed a much more efficient screening technique for salinity tolerance based on multiple morphological and physiological traits were used combining the cluster analysis and discriminant function analyses.
In our present study, we tested salt tolerance and classified 20 coastal Aus landrace rice through several multivariate analyses and canonical discriminant functions analyses for validating the divergence among genotypes against salinity. And, finally to study the genotypic variation among these 20 rice genotypes, we employed microsatellite markers (SSR) to screen potential salt tolerant landraces suitable for developing HYV targeting coastal region of Bangladesh.
MATERIALS AND METHODS
Plant materials
We screened 20 coastal
Aus landrace rice against salinity at their seedling stage (
Supplementary Table 1). These local rice genotypes are cultivated in the coastal areas (south and south-west) of Bangladesh. In our study, we included a salt tolerant check Binadhan-10 collected from Bangladesh Institute of Nuclear Agriculture (BINA) and a sensitive check BRRI dhan48 from Bangladesh Rice Research Institute (BRRI).
To screen the salt tolerant coastal Aus landrace rice at their early growing stage, the experiment was conducted at Stress Agronomy Laboratory and Genetic Engineering and Molecular Breeding Laboratory of Patuakhali Science and Technology University, during the period from January 2019 to May 2019. The phenotypic study was done in Stress Agronomy Laboratory maintaining semi-control environment. The genotypic screening of the collected germplasms was done in Genetic Engineering and Molecular Breeding Laboratory using simple sequence repeat (SSR) markers to find out salinity tolerant landraces.
Phenotypic assessment on seedling salinity tolerance of coastal Aus landrace rice
For studying the seedling salinity tolerance of coastal
Aus landrace rice the phenotypic screening was carried out following the protocol of International Rice Research Institute, in hydroponic culture medium (
Yoshida et al. 1976) maintaining salinity level 12 dS/m (
Gregorio et al. 1997). We germinated 10 seeds from each genotype in petri-dishes at 35℃ for 48 hours. Then, we transferred them into styrofoam seedling floats and grew the seedlings in the hydroponic nutrient solution for two weeks. At seedling stage, we maintained saline condition at 12 dS/m adding NaCl and non-saline condition (control) without adding NaCl. We maintained pH between 5.0-5.1 using 0.01N of HCl or 0.1N NaOH. We performed our study following randomized block design with three replications. For data collection, from the 10 seedlings, only 5 plants having uniform growth per genotype were considered and their mean value of the targeted trait was considered as one replicate.
Data were recorded on salt injury score (SIS), ion-leak percent, reduction percent on chlorophyll concentration, shoot length and root length from three individual plants per experiment.
Ion leakage
Ion leakage from the leaf tissue as an indicator of early response of rice genotypes against salinity was measured following
De Leon et al. (2015). The electrical conductance (using conductivity meter HI8733, HANNA, USA) for EC
initial and EC
final values of the solution was estimated before and after autoclaving, respectively. Finally, following
Flint et al. (1967) the ion-leak percent of the genotypes were calculated as an indicator of salt injury index: Ion-leakage = 100 (R
1 ‒ R
0) / (1 ‒ R
0); here, Ion-leak is SIS (salt injury score), R
0 is the quotient of initial and final values of EC of control plant, R
1 is the quotient of initial and final values of EC of the saline treated plant.
After 4 days post-salinization (DPS) the leaf yellowing was noticed. The comparative chlorophyll intensity (SPAD value) was estimated from the central part of the second youngest leaf both in control and salt-induced rice genotypes using chlorophyll meter (SPAD-502 Plus, Konica Minolta, Japan) to find out differences among rice genotypes. The reduction percent (% R) of chlorophyll content was calculated by the formula: Chl_R = 100 (Chl0 ‒ Chlt/Chl0); here Chl_R means the percent reduction of chlorophyll concentration; ‘Chl0’ denoted for the chloro-phyll content in control condition; ‘Chlt’ represent the chlorophyll content in saline treatment.
Growth parameters
We monitored root length and shoot length both in control and salt-induced rice genotypes at 7 DPS. All assessments were done with regard to the control plant to find genotypic differences. The percent (%) reduction in root length and shoot length were measured employing similar formula as in the case of chlorophyll percent reduction.
Salt injury score (SIS)
Symptoms of salt injury in plants started to appear from 7 DPS. Here, standard evaluation scoring (SES) method of IRRI was followed for visual scoring (
Gregorio et al. 1997). The plants were given score 1 when normal growth continued with no leaf symptoms. The score of 3 was given if it showed nearly usual growth along with few leaves of white tips and rolled. A score of 5 was given if plants’ growth severely retarded with rolled leaves with white tips. Plants viewing only green culm having desiccated leaves with complete cessation of growth were scored 7. Finally, the plants were scored 9 when all plants were dead. The average SIS score of a genotype was figured from the SIS values of 3 individual plants.
To test the treatment effects on genotypes, morpho- physiological data were statistically analyzed and mean trait values were compared at 0.05%, 0.01% and 0.001% level of significance. Correlation among traits was also computed based on the mean trait values of three repli-cations. To classify the salinity tolerant genotypes, the mean trait values of genotypes for five traits were em-ployed for multivariate cluster analysis using JMP8 soft-ware (JMPⓇ8, SAS Institute Inc., Cary, NC, 1989-2019). The clustering of genotypes were done as moder-ately tolerant (MT), tolerant (T), highly tolerant (HT), highly sensitive (HS) and sensitive (S) based on the scoring of the group average SIS. Classification of genotypes was confirmed using discriminant analyses for each genotype with the same data used for clustering. To figure out the variation among salinity groups, multivariate analysis of variance (MANOVA) was run in JMP8. Thus, we classified 20 Aus landrace rice for seedling salinity tolerance combining both clustering and discriminant analyses.
Genotyping of the rice genotypes using SSR marker
Genomic DNA isolation
We extracted genomic DNA from rice seedlings of 25-day-old using Promega A1120 DNA cleansing kit (Promega, USA) following the producer instructions. Extracted DNA was quantified using Nano-100 micro spectrophotometer (BOYN, China) and finally concentra-tion was adjusted to 25 ng/mL through dilution.
PCR amplification of SSR marker and evaluation of genotypes
A set of 10 SSR primer pairs were primarily selected for the analysis of genotypic variation to salinity tolerance among the collected 20 rice genotypes (
Supplementary Table 2). Based on banding patterns and potential for population discrimination two polymorphic SSR markers RM3412 and RM493 linked to
saltol QTL (quantitative trait loci) of chromosome 1 (
Ganie et al. 2014) were finally selected to screen coastal rice germplasm for salt tolerance.
PCR cocktail of 15 mL was prepared by mixing 1mL forward primer, 1 mL reverse primer, 7.5 mL Go TaqⓇ Green Master Mix (Promega, USA), 1.0 mL of extracted rice DNA (25 ng/mL), and 4.5 mL of nuclease free water. PCR (Applied Biosystems, USA) was done following the condition as follows: initialization for 5 minutes at 94℃ and 35 cycles of amplification for 45 secconds at 94℃, for 45 seconds at 55℃, for 1 minutes at 72℃ and final expansion at for 5 minutes at 72℃. To detect band, gel electrophoresis was done after PCR in 2% gel of agarose adding with ethidium bromide. Visualization of banding patterns was performed with UV transilluminator gel documentation unit. The banding patterns of 20 rice germplasm were genotyped comparing with tolerant and susceptible control variety. The genotypes having the same banding pattern to the salt tolerant check variety were considered as tolerant and similar to salt susceptible check variety were considered as salt susceptible. Thus, we genotyped 20 Aus rice varieties based on SSR genotyping to screen ideal tolerant genotypes.
RESULTS
Response against salt stress
Considering morpho- physiological responses of 20
Aus rice germplasms, significant genotypic differences were evident for many of the investigated attributes (
Table 1).
A highly significant genotypic differences (
P < 0.0001) were observed with regard to the scores of salt injury under salinity. Among the check genotypes, Binadhan-10 had a mean SIS of 3. Among the 20 coastal germplasms,
Kalihytta (SIS 1) was found as highly tolerant, two were recorded as salt tolerant namely,
Manikmuri, and
Monsur IRRI with SIS of 3, five were moderately tolerant
viz.
Nara,
Abdul high IRRI,
Iratom 27,
Parija,
Matichak,
Mohisur with SIS of 5, three were highly susceptible
viz.
Chawlmoni,
China,
Gota IRRI (
Mota),
Gota IRRI (
Chikon) with SIS of 9, and the rest were susceptible to salt stress having a SIS 7.0 (
Table 1).
A highly significant (
P < 0.0001) genotypic differences were noticed in case of ion-leakage. It ranged from 27.37 to 63.74%. Among the check cultivars, the susceptible check variety BRRI dhan48 showed high ion-leakage (50%) while the tolerant check, Binadhan-10 had 29.03%. Amongst the coastal genotypes, the highest ion-leak (%) found in
Gota IRRI (
mota) 63.73% and the lowest ion-leak was recorded in
Parija (26.89%), followed by
Kalihytta (27.37%),
Manikmuri (27.96%), and
Monsur IRRI (28.42%); hence, these genotypes were predicted to be salt-tolerant as they had lower percentages of ion-leak at 12 dS/m EC of the salinity level. Moderately salt-tolerant lines were
Abdul high IRRI,
Matichak,
Nara with ion leakage values of 30.93, 31.52, and 33.33%, respectively (
Table 1).
Highly significant (
P < 0.0001) %R of chlorophyll concentration (Chl-R) also indicate about the higher genotypic differences among coastal genotypes under salt stress. Among the check genotypes, susceptible check BRRI dhan48 had the highest chlorophyll reduction (50%) and tolerant check Binadhan-10 exhibited the lowest chlorophyll reduction (27.79%). Among the coastal geno-types,
Manikmuri (5.56%),
Parija (7.14%),
Monsur IRRI (10.53%),
Kalihytta (11.11%),
Abdul high IRRI (13.33%),
Mohishur (18.75%),
Matichak (20%),
Iratom 27 (25%) showed relatively greater tolerance against salinity with much lower %R of chlorophyll content than the susceptible check BRRI dhan48 (
Table 1).
Percent (%) root length reduction (RtL-R) and shoot length reduction (ShL-R) revealed the differences among genotypes (
P < 0.0001). Several coastal genotypes showed higher root length reduction such as
Parija (42.86%),
Gota IRRI (
Chikon) of 33.33%,
Gota IRRI (
Mota) (28.57%),
Nara (28.57%), indicating their susceptibility against salinity. On the other hand, some genotypes, such as
Monsur IRRI (11.11%),
Benamuri (11.11%) showed the lowest root length reduction indicating higher tolerance of these genotypes against salinity (
Table 1).
Among the check varieties, BRRI dhan48 showed highest shoot length reduction (37.5%), while Binadhan-10 showed lowest shoot length reduction (13.64%). Among the coastal genotypes,
Gota IRRI (
Chikon) showed highest shoot length reduction (63.63%) followed by
Gota IRRI (
Mota) (60%),
Chawlmoni (60%), suggesting the suscepti-bility of this genotypes to salt stress and the lowest shoot length reduction (4.35%) was found in
Abdul high IRRI, followed by
Monsur IRRI (5.26%),
Parija (8.69%) indicating their higher tolerance to salt stress (
Table 1).
From the individual relationship of physiological traits, a positive and high correlation in case of SIS was observed with %R of chlorophyll, ion-leak, and shoot length but negatively correlated with %R of root length (
Table 2). Ion-leak was positively correlated with percent reduction of chlorophyll, root length, shoot length, and SIS. Percent of chlorophyll reduction was negatively correlated with %R of root length and positively correlated with SIS, ion-leak, as well as %R of shoot length. Root length %R was positively linked with %R of shoot length, ion-leak but negatively correlated with SIS, chlorophyll %R.
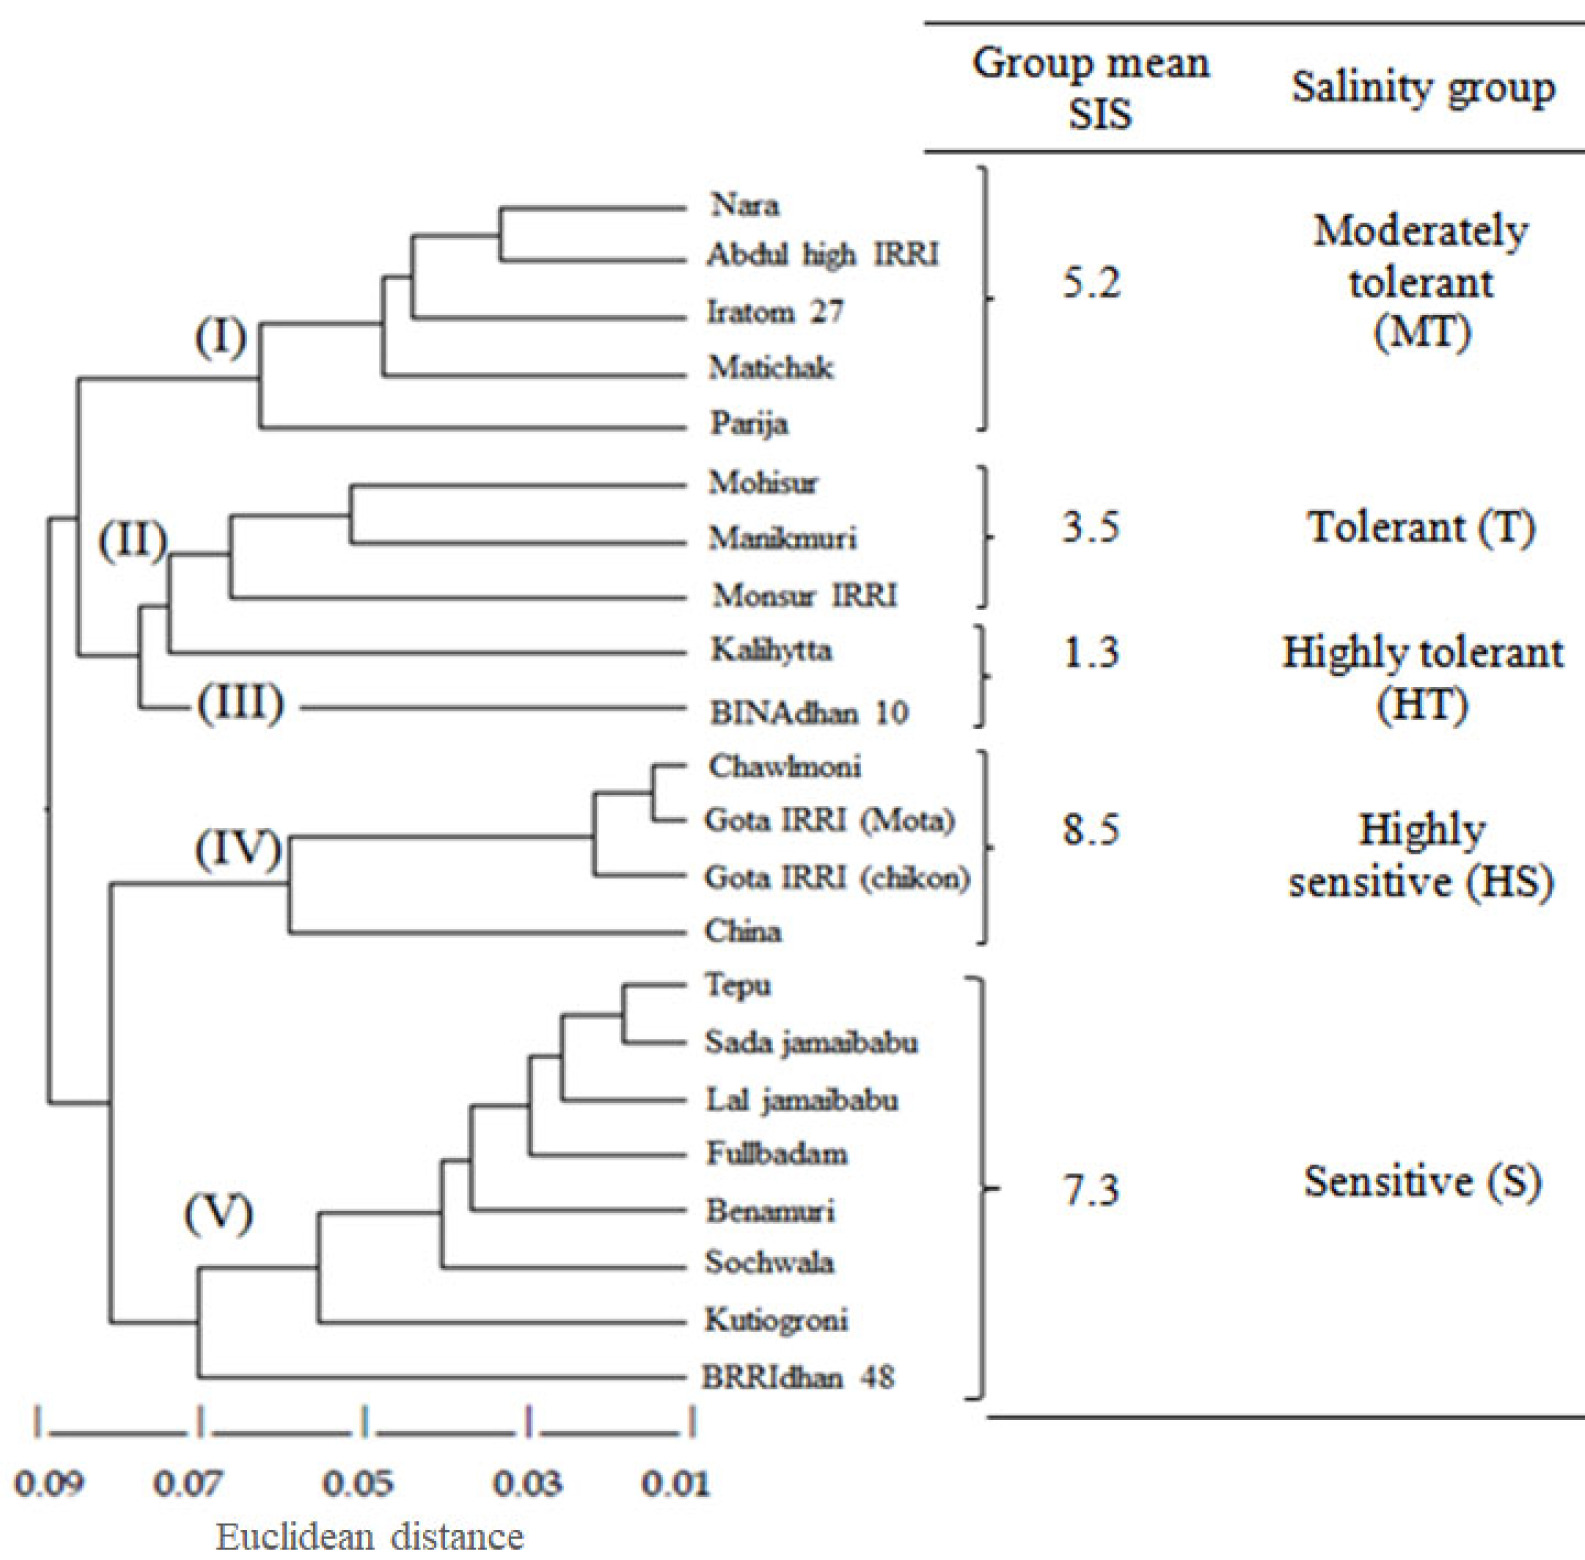
Clustering study through dendogram revealed 2 highly tolerant (HT) genotypes including one local genotype (Binadhan-10 and
Kalihytta), 4 tolerant (T) genotypes including 3 local genotypes
viz.
Mohishur,
Manikmuri and
Monsur IRRI; 4 moderately tolerant (MT)
viz.
Nara,
Abdul high IRRI,
Iratom 27 and
Matichak,
Parija; 8 susceptible (S) genotypes including eight local genotypes
viz.
Tepu,
Fullbadam,
Sada jamaibabu,
Lal jamaibabu,
Benamuri,
Sochwala,
Kutiogroni and BRRI dhan48 and 4 local highly susceptible (HS) genotypes
viz.
Chawlmoni,
Gota IRRI (
Mota),
Gota IRRI (
Chikon) and
China (
Fig. 1).
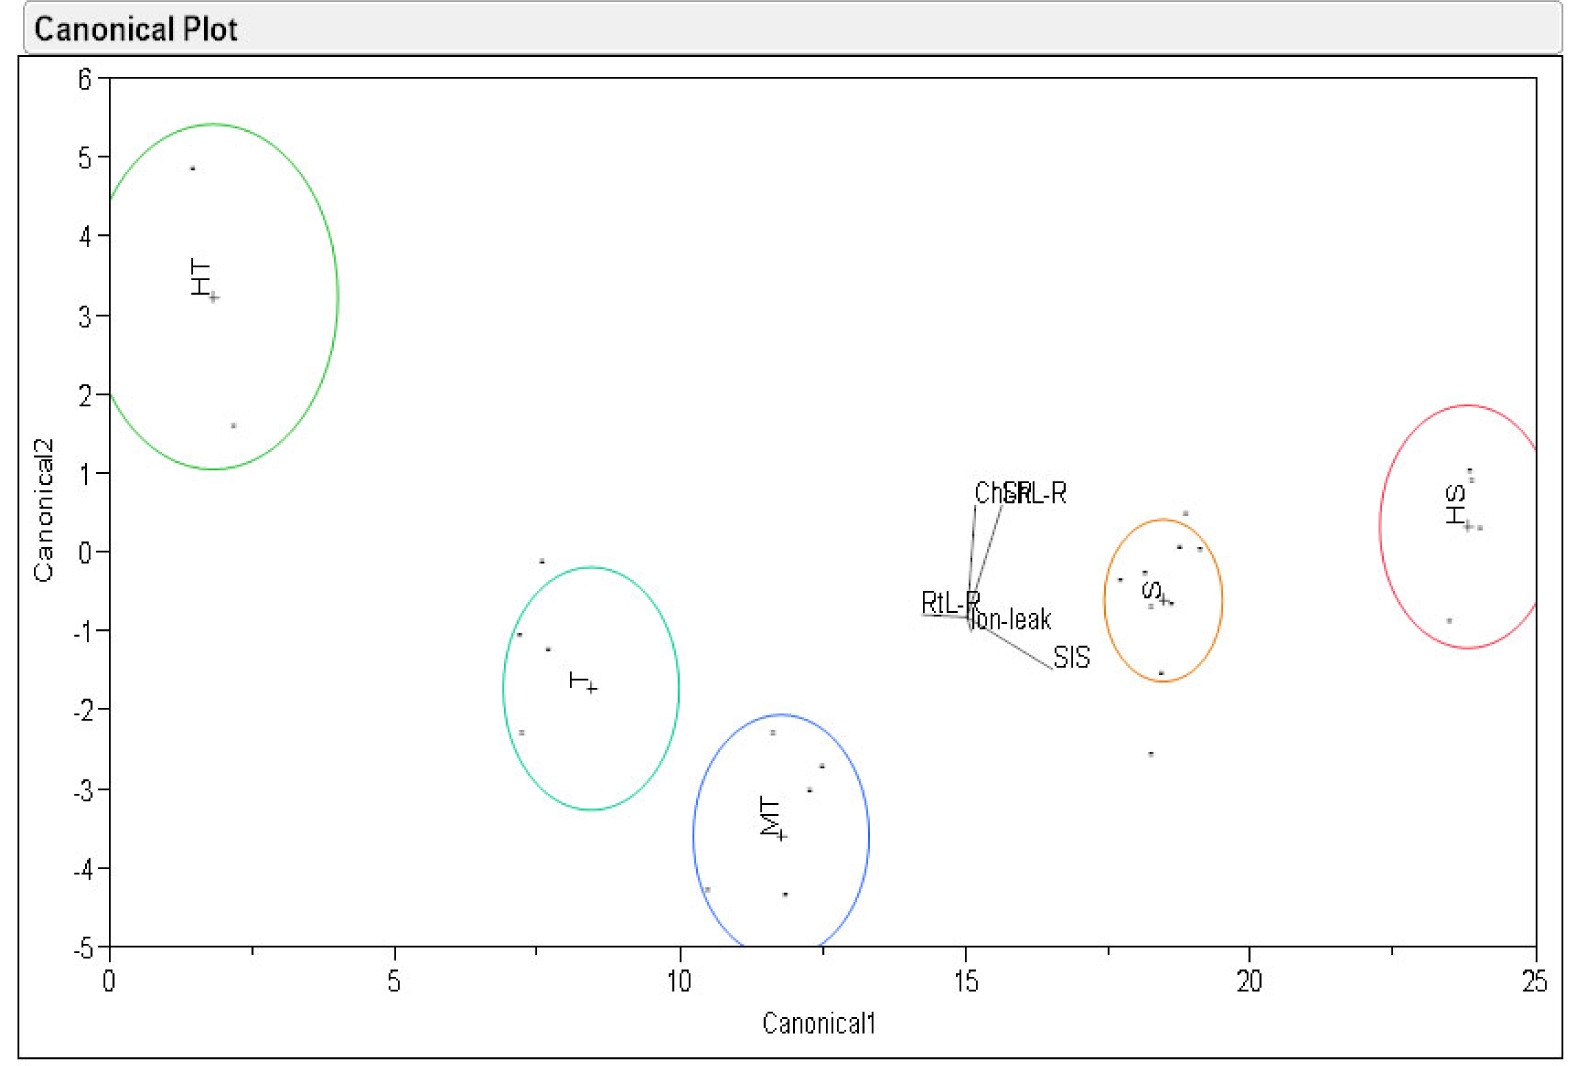
We performed canonical discriminant analysis to evalu-ate the level of diversity among salinity groups (
Fig. 2). We found two canonical discriminant functions. Canonical discriminant function 1 (Can 1) was positively correlated to SIS, Ion-leak, Chl-R, RtL-R, ShL-R. In contrast, a negative correlation with SIS, Ion-leak and RtL-R was evident in case of canonical discriminant function 2 (Can 2). Therefore, this result indicates Can 1, Can 2 differentiates genotypes based on their ion-leak (%), percent reduction of chloro-phyll concentrations, root length, and shoot length. In Can 1, the largest detachment of group means regarding HT and S (4.18 and 3.59) was observed, while mean separation between HS and T was 3.99 vs. 2.22 (
Fig. 2). Examination of Can 2 indicated the detachment of group HT from the T (4.18 vs. 2.22) and differences of MT from the S group (3.31 vs. 3.59). Four groups (T, MT, S and HS) except HT had negative mean values to Can 2. In contrast, positive mean sores were found for each of the group to Can 1. In canonical plot, MT group was located in the middle of the T and S groups (
Fig. 2). The HT group with positive value (+4.18) in both the case for Can1 and Can 2 indicating their low values in SIS, Chl-R, RtL-R, and ShL-R. The T group with positive mean value to Can 1 (+2.20) and negative mean value to Can 2 (‒2.20), suggesting their proximity to the HT group, but it has higher shoot length and chlorophyll reduction as opposed to HT categories. For the T and MT, a positive and negative mean values for T group were observed, respectively in the Can 1 and Can 2. Finally, a positive mean value to Can 1 (+3.59) and negative mean value to Can 2 (‒3.59) were found in case of the sensitive (S) group.
From a multivariate analysis of variance (MANOVA), significant differences were evident for salinity tolerance groups (HS, HT, MT, S and T) against five variable parameters (ion-leak, SIS, Chl-R, Rtl-R and Shl-R). Moreover, comparison study for each of the trait between groups through LS mean values indicated significant variations between HT vs. S & HS groups in all the cases (
Table 3). Similarly, a significant difference was evident for the group T from HT in case of RtL-R, ShL-R and from MT in ion-leak, Chl-R, RtL-R. Besides, the group S and MT were significantly different due to having significantly different values for ShL-R, SIS, Chl-R and the group S differed with HS only for the significant difference in ShL-R. Thus, the whole pairwise comparison is highly significant indicating complete partitioning among groups based on the five important quantitative parameters.
From the morpho-physiological and genotypic perfor-mance, we considered Binadhan-10 as tolerant and BRRI dhan48 as susceptible. Coastal genotypes were identified as tolerant having banding pattern similar to Binadhan-10 and as salt susceptible alike to banding pattern of BRRI dhan48 (
Supplementary Figs. 1, 2 and Table 4). In respect to primer RM493, we found 3 coastal genotypes
viz.
Kalihytta,
Iratom 27,
Sochwala as tolerant, and 11 geno-types
viz.
Matichak,
Kutiogroni,
Monsur IRRI,
Gota IRRI (
Chikon),
Benamuri,
Manikmuri,
China,
Sada jamaibabu,
Tepu,
Gota IRRI (
Mota),
Chawlmoni as susceptible with compared to the salt-tolerant check Binadhan-10 and susceptible check BRRI dhan48. Additionally, 5 genotypes
viz.
Abdul high IRRI,
Fullbadam,
Lal jamaibabu,
Nara,
Parija had similar banding patterns to both tolerant check Binadhan-10 and susceptible check BRRI dhan48 (Supple-mentary Fig. 1). Besides, with the reaction with RM412, 6 coastal genotypes
viz.
Kalihytta,
Fullbadam,
Lal jamaibabu were detected as tolerant, 7 genotypes
viz.
Gota IRRI (
Chikon),
Kutiogroni,
Monsur IRRI,
Sochwala,
Benamuri,
Abdul high IRRI,
Sada jamaibabu showed susceptibility comparing with tolerant and susceptible check Binadhan-10 and BRRI dhan48, respectively. And, 5 genotypes
viz.
Matichak,
Parija,
Iratom 27,
Manikmuri,
china,
Nara,
Chawlmoni appeared with banding patterns of both the tolerant and susceptible check (
Supplementary Fig. 2).
In a nutshell as represented in
Table 4, 7 genotypes
viz.
Nara,
Lal jamaibabu,
Fullbadam,
Iratom 27,
Kalihytta,
Parija including tolerant check Binadhan-10 were found as tolerant and 7 genotypes
viz.
Sada jamaibabu,
Monsur IRRI,
Kutiogroni,
Benamuri,
Gota IRRI (
Chikon) including susceptible check BRRI dhan48 were found as sensitive against both the markers. However, 8 genotypes
viz.
Abdul high IRRI,
Matichak,
Manikmuri,
Chawlmoni,
Gota IRRI (
Mota),
China,
Tepu and
Sochwala were evident to have both tolerant and susceptible banding patterns (as Binadhan-10 and BRRI dhan48) in reaction with RM3412 and RM49.
DISCUSSION
Here, we have done genotypic diversity analysis of 20
Aus rice genotypes against salinity based on morpho- physiological responses. Screening of potential germplasm is making efforts for enhancing their utility in the develop-ment of HYV with desired trait (
Ismail et al. 2007). Coastal landraces having salt tolerance ability may be considered as important resources of salt tolerance in the breeding of salt tolerant HYV. To characterize salt-tolerant rice geno-types, several attempts have been made based on morpho- physiological parameters against salinity (
Caldo et al. 1996; Zeng
et al. 2005;
Sanni et al. 2012). For identifying potential coastal genotypes, we used visual salt injury scoring technique in our study as it represents the overall plant’s reaction to salinity (
Gregorio et al. 1997). We used five quantitative traits for genotypic classification and to determine their salinity tolerance levels. As reported by many researchers, here we also observed different injuries induced by salt stress for example, yellowing and drying of leaves, reduction of shoot and root length, stunted growth and drying of seedlings (
Bonilla et al. 2002;
Islam 2004;
Niones 2004;
Bhuiyan 2005). Different agronomic traits like chlorophyll content, root length, and shoot length of tolerant genotypes had lesser reduction percentages than sensitive genotypes (
Table 1). No salt injury symptoms were observed in case of highly tolerant genotypes. Based on visual salt injury we used 1-9 scale for grading the genotypes (
Gregorio et al. 1997). Primarily, in our pheno-typic assessment following the modified SES system the ion-leak (%) values were used to categorize 20 coastal genotypes where 3 genotypes namely,
Kalihytta,
Manikmuri, and
Monsur IRRI were found tolerant under salt stress. And, at the same salinity level, 6 genotypes
viz.
Nara,
Abdul high IRRI,
Iratom 27,
Parija,
Matichak,
Mohisur were evident as moderately tolerant (
Table 1). The above results suggest low ion-leak and low SIS in these genotypes increased tolerance under salt stress.
We observed that genotypes were significantly different in case of shoot parameters than that of roots (
Table 1), indicating about greater role of shoots in salt tolerance. This might be the fact that shoots confronted higher levels of salinity provoked DNA methylation compared with roots in many of the tested rice varieties under salt stress (
Karan et al. 2012). We also observed highest shoot growth reductions from salt sensitive groups, which corroborate the findings of
Apse et al. 1999;
Lin et al, 2004 and
Munns and Tester 2008. In our present study, the highest shoot length reduction (63.63%) was found in
Gota IRRI (
Chikon), followed by
Gota IRRI (
Mota) (60%),
Chawlmoni (60%), that revealed the susceptibility of these genotypes to salt stress and the lowest shoot length reduction (4.35%) was found in
Abdul high IRRI, followed by
Monsur IRRI (5.26%),
Parija (8.69%), indicating about higher tolerance ability of these genotypes against salt stress. We used Pearson correlation matrix to identify associations among five traits that represents salinity tolerance. And, three traits e.g., ShL-R, ChL-R, Ion-leak were found significant having positive correlation with SIS (
Table 2). This pheno-menon suggests about decreased photosynthetic ability of salt-sensitive plants under salinity which is symptoma-tically represented by chlorosis and reduced shoot growth.
We employed cluster analysis to identify the HT, T, MT, S and HS salinity group (
Fig. 1). Discriminant analyses along with multivariate analysis of the target traits were also conducted in investigating the phenotypic and genetic diversity of the salt induced coastal genotypes. From the discriminant analysis and multivariate analysis of traits at seedling stage, highly significant genotypic differences and correlations among ion-leakage, SIS, chlorophyll content, shoot length and root length reduction were observed and thus, delineated the differences in salt tole-rance among 20 coastal genotypes which coincides the results of
Yeo et al. (1990). Tolerant genotypes apparently had lower salt injury value, chlorophyll reduction, ion-leakage, root length and shoot length reduction thus providing a clue on salt tolerance potential of a genotype. Actually, genetic diversity and salt responsiveness of the adapted donor rice germplasm are prerequisite for successful rice breeding program in developing salt-tolerant HYV (
De Leon et al. 2015). In our present study, we found that tolerant group was superior to moderately tolerant with regard to their significant variation in chlorophyll reduction. The highly tolerant group was statistically higher up to the sensitive and highly sensitive groups with respect to all traits, whereas the tolerant and moderately tolerant groups were statistically superior to sensitive and highly sensitive groups with regard to visual salt injury score and chlorophyll concentration. Except in the case of shoot length reduc-tions, all trait responses between sensitive and highly sensitive groups were not significantly different and pre-sumably the sensitive and highly sensitive group could be considered as one group (
Table 3). The tabulated results indicated that highly tolerant group showed lowest ion-leakage indicating lowest leaf injury, while the highly sensitive group had highest leaf injury mainly induced by highest ion-leakage.
De Leon et al. (2015) also reported different salinity tolerance groups based on six important quantitative traits which also corroborate our findings in this study.
In the final validation study, we used SSR marker for determining any genetic variation and unraveling cultivars’ identity (
Ni et al. 2002;
Samal et al. 2019). SSR screening technique is considered very useful for their robustness and higher potentials to differentiate individual germplasm accessions (
Xu et al. 1996;
Jeung et al. 2005) and additionally, they have higher coverage for rice genome (
McCouch et al. 2002).
For final molecular validation two polymorphic SSR markers
viz. RM3412 and RM493 linked to
saltol QTL in the chromosome 1 of rice (
Ganie et al. 2014) were used here. These two SSRs showed higher polymorphisms through different banding patterns and successfully discri-minated tolerant genotypes from susceptible with relation to the tolerant check Binadhan-10 and sensitive check BRRI dhan48 (
Supplementary Figs. 1 and 2).
Krishnamurthy et al. (2014) also used these two SSR markers in screening 94 rice genotypes and reported different combinations of alleles (haplotypes) for efficient genotyping of those rice genotypes. RM3412 and RM493 were also employed by
Mohammadi-Nejad et al. (2008) and
Ganie et al. (2014), where they stated higher number of allelic variations for successfully discriminating the rice genotypes.
Further,
Babu et al. (2014) and
Thomson et al. (2010) reported about RM493 and RM3412 for their discerning efficiency against salt stress. And, recently
Islam et al. (2020) performed an extensive screening of 46 Bangladeshi rice landraces using RM3412 and RM493 for profiling salt tolerance of these genotypes. In our present study, in consideration of banding profiles of both RM3412 and RM493 we found 6 genotypes
viz.
Nara,
Lal jamaibabu,
Fullbadam,
Iratom 27,
Kalihytta,
Parija and Binadhan-10 were found as tolerant, and 5 genotypes
viz.
Sada jamaibabu,
Benamuri,
Monsur IRRI,
Kutiogroni,
Gota IRRI (
Chikon) and BRRI dhan48 were found as susceptible.
To compare the data on multivariate analyses of several morpho-physiological traits regarding seedling salinity tolerance of coastal rice with their subsequent validation using RM3412 and RM493 reveals 4 genotype
viz.
Nara,
Iratom 27,
Parija and
Kalihytta consistently showed varying levels of tolerance (moderately to highly tolerant) against salt stress (
Fig. 1 and
Table 4). While,
Monsur IRRI, a coastal rice genotype was evident as tolerant in the morpho-physiological salinity screening and subsequently it’s DNA profiling using both the SSRs designated it as susceptible to salt stress. On the contrary,
Lal jamaibabu and
Fullbadam were identified as sensitive to salinity at seedling stage screening but their SSR based screening using RM3412 and RM493 grouped them into the tolerant category. These inconsistent data between the two studies might be related with the fact that RM493 and RM3412 may not strongly linked with QTL or the genes which are associated with salt tolerance.
CONCLUSIONS
Here we successfully identified the diversity among 20 Bangladeshi coastal Aus rice genotypes for salinity tole-rance through several multivariate analyses. In a morpho- physiological study we monitored responses of multiple traits of these coastal genotypes against salinity and based on their cumulative tolerance values effectively screened potential genotypes for salt tolerance. We also performed molecular validation of their salt tolerance by two SSRs. In a nutshell, our coastal genotypes viz. Nara, Lal jamaibabu, Fullbadam, Iratom 27, Kalihytta, Parija could be the new sources of seedling salinity tolerance and also be used in marker-assisted backcrossing in developing salt-tolerant high-yielding rice varieties for the coastal ecosystem of Bangladesh.
Supplemental Materials
ACKNOWLEDGEMENTS
We thank Research and Training Centre (Grant# 4829: Ag-19; 2018-2019); Patuakhali Science and Technology University, Bangladesh for providing the fund for this research work.
-
AUTHOR CONTRIBUTIONS
GS, SCS and AKC conceived the concept. HS carried out research work under supervision of GS, SCS and AKC. HS and US analyzed data and drafted the manuscript. GS, SCS and AKC critically edited the manuscript. All authors read and approved the final version of the manuscript.
-
CONFLICT OF INTEREST
The authors declare that there is no potential conflict of interest relevant to this article.
Fig. 1Clustering of 20 Aus rice genotypes by UPGMA based on Euclidean distance of five morphological and physiological trait responses against salinity.

Fig. 2Canonical discriminant analysis showing population structure of 20 Aus rice genotypes in consideration of the morphological and physiological traits res-ponses to salinity, where genotypes grouped as HT: highly tolerant, T: tolerant, MT: moderately tolerant, S: susceptible, HS: highly susceptible.

Table 1Mean trait values of coastal Aus rice genotypes against salinity.
Table 1
|
Genotype |
SIS |
Ion-leakge
(uS/cm) |
Ion-leak
(%) |
Chlo-rophyll content (SPAD unit) |
Chl-R
(%) |
Root length (cm) |
RtL-R
(%) |
Shoot length (cm) |
StL-R
(%) |
|
Ro |
Rt |
Ctr |
Sal |
Ctr |
Sal |
Ctr |
Sal |
|
Nara
|
5*
|
0.04 |
0.36 |
33.33**
|
17 |
12 |
29.41**
|
7 |
5 |
28.57 |
32 |
28 |
12.5 |
|
Chawlmoni
|
9 |
0.6 |
0.73 |
32.5**
|
12 |
4 |
66.67 |
8 |
6 |
25 |
30 |
12 |
60+++ |
|
Gota IRRI (Mota) |
9 |
0.09 |
0.67 |
63.74 |
19 |
5 |
73.68 |
7 |
5 |
28.57 |
25 |
10 |
60+++ |
|
Tepu
|
7 |
0.05 |
0.38 |
34.74**
|
15 |
8 |
46.67 |
6 |
5 |
16.67**
|
26 |
13 |
50+++ |
|
Sada jamaibabu
|
7 |
0.06 |
0.37 |
32.98**
|
14 |
9 |
35.71*
|
7 |
6 |
14.29**
|
29 |
18 |
37.93+ |
|
China
|
9 |
0.09 |
0.58 |
53.85 |
18 |
4 |
77.78 |
6 |
5 |
16.67**
|
27 |
14 |
48.15++ |
|
Lal jamaibabu
|
7 |
0.09 |
0.39 |
32.97**
|
12 |
5 |
58.33 |
7 |
7 |
0***
|
21 |
19 |
9.52 |
|
Fullbadam
|
7 |
0.05 |
0.57 |
54.74 |
18 |
7 |
61.11 |
8 |
7 |
12.5**
|
27 |
17 |
37.04+ |
|
Manikmuri
|
3***
|
0.07 |
0.33 |
27.96***
|
18 |
|
5.56***
|
8 |
7 |
12.5**
|
30 |
24 |
20 |
|
Benamuri
|
7 |
0.04 |
0.55 |
53.13 |
14 |
6 |
57.14 |
9 |
8 |
11.11**
|
30 |
22 |
26.67 |
|
Sochwala
|
7 |
0.04 |
0.53 |
51.04 |
18 |
517 |
72.22 |
9 |
7 |
22.22 |
26 |
20 |
23.07 |
|
Iratom 27
|
5*
|
0.61 |
0.75 |
35.90**
|
20 |
15 |
25**
|
7 |
6 |
14.29*
|
21 |
19 |
9.53 |
|
Kalihytta
|
1***
|
0.05 |
0.31 |
27.37***
|
18 |
16 |
11.11***
|
8 |
6 |
25 |
32 |
25 |
21.88 |
|
Parija
|
5*
|
0.07 |
0.32 |
26.89***
|
14 |
13 |
7.14***
|
7 |
4 |
42.86 |
23 |
21 |
8.69 |
|
Abdul high IRRI
|
5*
|
0.03 |
0.33 |
30.93**
|
15 |
13 |
13.34**
|
6 |
5 |
16.67*
|
23 |
22 |
4.35 |
|
Monsur IRRI
|
3**
|
0.05 |
0.32 |
28.42***
|
19 |
17 |
10.53***
|
9 |
8 |
11.11**
|
19 |
18 |
5.26 |
|
Kutiogroni
|
7 |
0.06 |
0.49 |
45.74*
|
14 |
8 |
42.86 |
8 |
7 |
12.5**
|
32 |
16 |
50+++ |
|
Gota IRRI (Chikon) |
9 |
0.07 |
0.61 |
58.06 |
16 |
9 |
43.75 |
6 |
4 |
33.33 |
33 |
12 |
63.63+++ |
|
Matichak
|
5*
|
0.08 |
0.37 |
31.52**
|
15 |
12 |
20**
|
7 |
6 |
14.29*
|
25 |
21 |
16 |
|
Mohishur
|
3**
|
0.04 |
0.32 |
29.17***
|
16 |
13 |
18.75***
|
6 |
5 |
16.67*
|
27 |
24 |
11.11 |
|
BRRI dhan48 |
7 |
0.11 |
0.56 |
50.56 |
22 |
11 |
50 |
5 |
4 |
20 |
16 |
10 |
37.5+ |
|
Binadhan-10 |
3**
|
0.07 |
0.34 |
29.03***
|
25.9 |
18.7 |
27.79**
|
8 |
7 |
12.5**
|
22 |
19 |
13.64 |
|
Genotypic effect (Pr > F) |
< .0001 |
|
|
< .0001 |
|
|
< .0001 |
|
|
< .0001 |
|
|
< .0001 |
Table 2Pearson correlation matrix of five seedling traits against salinity (12 dS/m) in 20 Aus rice genotypes.
Table 2
|
Traits |
SIS |
Ion-leak |
Chl-R |
RtL-R |
ShL-R |
|
SIS |
1 |
|
|
|
|
|
Ion-leak |
0.6968***
|
1 |
|
|
|
|
Chl-R |
0.7721***
|
0.7048***
|
1 |
|
|
|
RtL-R |
‒0.1606 |
0.0273 |
‒0.0927 |
1 |
|
|
ShL-R |
0.6586***
|
0.6521***
|
0.6385***
|
0.2289 |
1 |
Table 3Least square (LS) means of salinity groups in five parameters.
Table 3
|
Group |
SIS |
Ion-leak(%) |
Chl-R(%) |
RtL-R(%) |
ShL-R(%) |
|
HS |
9 |
52.04 |
65.47 |
25.89 |
57.95 |
|
HT |
1 |
27.37 |
11.11 |
25.00 |
21.88 |
|
MT |
5 |
33.37 |
22.05 |
26.19 |
13.81 |
|
S |
7 |
43.08 |
54.50 |
13.73 |
33.07 |
|
T |
3 |
28.47 |
14.63 |
12.04 |
12.97 |
Table 4Genotypic profiles of 19 coastal Aus rice geno-types using SSR markers.
Table 4
|
Sl No. |
Genotype |
Predicted salt tolerance levels using SSR |
|
RM 493 |
RM3412 |
|
1 |
Nara
|
T |
T |
|
2 |
Chawlmoni
|
S |
T |
|
3 |
Gota IRRI (Mota) |
S |
T |
|
4 |
Tepu
|
S |
T |
|
5 |
Sada jamaibabu
|
S |
S |
|
6 |
China
|
S |
T |
|
7 |
Lal jamaibabu
|
T |
T |
|
8 |
Fulbadam
|
T |
T |
|
9 |
Abdul high IRRI
|
T |
S |
|
10 |
Manikmuri
|
S |
T |
|
11 |
Benamuri
|
S |
S |
|
12 |
Sochwala
|
T |
S |
|
13 |
Iratom 27
|
T |
T |
|
14 |
Kalihytta
|
T |
T |
|
15 |
Parija
|
T |
T |
|
16 |
Monsur IRRI
|
S |
S |
|
17 |
Kutiogroni
|
S |
S |
|
18 |
Gota IRRI (Chikon) |
S |
S |
|
19 |
Matichak
|
S |
T |
|
20 |
BRRI dhan48 |
S |
S |
|
21 |
Binadhan-10 |
T |
T |
References
- Apse MP, Aharon GS, Snedden WA, Blumwald E. 1999. Salt tolerance conferred by overexpression of a vacuolar Na+/H+ antiport in Arabidopsis. Sci.. 285(5431): 1256-1258.
- Asch F, Dingkuhn M, Dorffling K, Miezan K. 2000. Leaf K/Na ratio predicts salinity induced yield loss inirrigated rice. Euphytica. 113(2): 109-118.
- Aslam M, Qureshi RH. AhmedN1993. A rapid screening technique for salt tolerance in rice (Oryza sativa L.). Plant Soil. 150(1): 99-107.
- Babu NN, Vinod KK, Krishnan SG, Bhowmick PK, Vanaja T, Krishnamurthy SL, et al. 2014. Marker based haplotype diversity of saltolQTL in relation to seedling stage salinity tolerance in selected genotypes of rice. Indian J. Genet. Plant Breed.. 74(1): 16-25.
- Bangladesh Bureau of Statistics.2012. Statistical Year Book of Bangladesh. 32nd Edition. Statistics and Informatics Division. Ministry of Planning, Government of the People's Republic of Bangladesh, Dhaka. pp. 33-36..
- Bhuiyan MAR. 2005. Efficiency in evaluating salt tolerance in rice using phenotypic and marker assisted selection. M.S. Thesis. Department of Genetics and Plant Breeding, Bangladesh Agricultural University, Mymensingh, Ban-gladesh. pp. 96..
- Bonilla P, Dvorak DJ, Gregorio G. 2002. RFLP and SSLP maping of salinity tolerance genes in chromosome 1 of rice (Oryza sativa L.) using recombinant inbred lines. Philipp. Agric. Sci.. 85(1): 68-76.
- Caldo RA, Hernadez LS, Sebastian JE. 1996. Morphology- based genetic diversity analysis of ancestral lines of Philippine rice cultivars. Philipp. J. Crop Sci.. 21(3): 86-92.
- Cha-um S, Boriboonkaset T, Pichakum A, Kirdmanee C. 2009. Multivariate physiological indices for salt tolerant classification in indica rice (Oryza sativa L. ). Gen. Appl. Plant Physiol. 35(1/2): 75-87..
- De Leon TB, Linscombe S, Gregorio G, Subudhi PK. 2015. Genetic variation in Southern USA rice genotypes for seedling salinity tolerance. Front. Plant Sci.. 6: 374
- Eckardt NA. 2000. Sequencing the Rice Genome. Plant Cell.. 12(11): 2011-201.
- Flint HL, Boyce BR, Beattie DJ. 1967. Index of injury - A useful expression of freezing injury to plant tissues as determined by the electrolytic method. Can. J. Plant Sci.. 47(2): 229-230.
- Flowers TJ. 2004. Improving crop salt tolerance. J. Exp. Bot.. 55(369): 307-319.
- Ganie SA, Karmakar J, Roychowdhury R, Mondal TK, Dey N. 2014. Assessment of genetic diversity in salt-tolerant rice and its wild relatives for ten SSR loci and one allele mining primer of salT gene located on 1st chromosome. Plant Syst. Evol.. 300(7): 1741-1747.
- Gregorio GB, Senadhira D, Mendoza RD, Manigbas NL, Roxas JP, Cuerta CQ. 2002. Progress in breeding for salinity tolerance and associated abiotic stresses in rice. Field Crops Res.. 76: 91-101.
- Gregorio GB, Senadhira D, Mendoza RD. 1997. Screening Rice for Salinity Tolerance. IRRI Discussion Paper Series No. 2169-2019-1605. IRRI. Los Baños..
- Gregorio GB, Senadhira D. 1993. Genetic analysis of salinity tolerance in rice. Theor. Appl. Genet.. 86(2): 333-338.
- Gregorio GB. 1997. Tagging salinity tolerant genes in rice using Amplified Fragment Length Polymorphism (AFLP). Ph. D. dissertation. University of the Philippines at Los Baños. College, Laguna..
- Grover A, Pental D. 2003. Breeding objectives and require-ments for producing transgenic for the major field crops of India. Curr. Sci.. 84(3): 310-320.
- Hasan R. 2018. Evaluation of cropping pattern under mul-ching condition of rabi crops in saline ecosystem. M.S. thesis. Department of Agronomy, Patuakhali Science and Technology University, Patuakhali, Bangladesh-8602..
- Islam MF, Ahmed NU, Saha G. 2020. Phenotypic and molecular marker based screening of coastal rice land-races under salt stress. Plant Breed. Biotech.. 8(3): 238-251.
- Islam MM. 2004. Mapping salinity tolerance genes in rice (Oryza sativa L. ) at reproductive stage. Ph.D. disser-tation. University of the Philippines at Los Baños, College Laguna, Philippines. pp. 1-149..
- Ismail AM, Heuer S, Thomson MJ, Wissuwa M. 2007. Genetic and genomic approaches to develop rice germplasm for problem soils. Plant Mol. Biol.. 65(4): 547-570.
- Jeung JU, Hwang HG, Moon HP, Jena KK. 2005. Finger-printing temperate japónica and tropical indica rice genotypes by comparative analysis of DNA markers. Euphytica. 146(3): 239-251.
- Kanawapee N, Sanitchon J, Lontom W, Threerakulpisut P. 2012. Evaluation of salt tolerance at the seedling stage in rice genotypes by growth performance, ion accumulation, proline and chlorophyll content. Plant and Soil. 358(1): 235-249.
- Karan R, De Leon T, Biradar H, Subudhi PK. 2012. Salt stress induced variation in DNA methylation pattern and its influence on gene expression in contrasting rice genotypes. PLoS One.. 7(6): e40203
- Krishnamurthy SL, Sharma SK, Kumar V, Tiwari S, Batra V, Singh NK. 2014. Assessment of genetic diversity in rice genotypes for salinity tolerance using saltol markers of chromosome 1. Indian J. Genet. Plant Breed.. 74(2): 243-247.
- Lin HX, Zhu MZ, Yano M, Gao JP, Liang ZW, Su WA, et al. 2004. QTLs for Na+ and K+ uptake of the shoots and roots controlling rice salt tolerance. Theor. Appl. Genet.. 108(2): 253-260.
- McCouch SR, Teytelman L, Xu Y, Lobos KB, Clare K, Waltol M, et al. 2002. Development of mapping of 2240 new SSR markers for rice (Oryza sativa L.). DNA Res.. 9(6): 199-207.
- Mohammadi-Nejad G, Arzani A, Rezai AM, Singh RK, Gregorio GB. 2008. Assessment of rice genotypes for salt tolerance using microsatellite markers associated with the saltol QTL. Afr. J. Biotechnol.. 7(6): 730-736.
- Munns R, James RA, Lauchli A. 2006. Approaches to increasing the salt tolerance of wheat and other cereals. J. Exp. Bot.. 57(5): 1025-1043.
- Munns R, Tester M. 2008. Mechanism of salinity tolerance. Annu. Rev. Plant Biol.. 59: 651-681.
- Mondal S, Borromeo TH. 2016. Screening of salinity tolerance of rice at early seedling stage. J. Biosci. Agric. Res.. 10(1): 843-847.
- Nazar R, Iqbal N, Masood A, Syeed S, Khan NA. 2011. Understanding the significance of sulfur in improving salinity tolerance in plants. Environ. Exp. Bot.. 70: 80-87.
- Courtois B, Ahmadi N, Abreu I, Saibo N, Oliveira MM. Negrão S2011. Recent updates on salinity stress in rice: from physiological to molecular responses. Crit. Rev. Plant Sci.. 30(4): 329-377.
- Ni J, Colowit PM, Mackill DJ. 2002. Evaluation of genetic diversity in rice subspecies using micro satellite markers. Crop Sci.. 42(2): 601-607.
- Niones JM. 2004. Fine mapping of the salinity tolerance gene on chromosome 1 of rice (Oryza sativa L. ) using near-isogenic lines. M.S. Dissertation. University of the Philippines Los Baños College. Laguna, Philippines. 78p..
- Rahman M, Ahsan M. 2001. Salinity constraints and agri-cultural productivity in coastal saline area of Bangladesh. In: Soil Resources in Bangladesh: Assessment and Utili-zation. Proceedings of the Annual Workshop on Soil Resources. Soil Resource Development Institute, Dhaka, Bangladesh. pp. 1-14.
- Samal R, Roy PS, Kar MK, Patra BC, Patnaik SSC, Reddy JN. 2019. Molecular characterization and identification of new sources of tolerance to submergence and salinity from rice landraces of coastal India. Plant Genet. Res.. 17(3): 221-231.
- Sanni KA, Fawole I, Ogunbayo A, Tia D, Somado EA, Futakuchi K. 2012. Multivariate analysis of diversity of landrace rice germplasm. Crop Sci.. 52(2): 494-504.
- Soil Resource Development Institute.2010. Land and Soil Statistical Appraisal Book of Bangladesh. SRDI. Ministry of Agriculture, pp 15..
- Thomson MJ, Ismail AM, McCouch SR, Mackill MJ. 2010. Marker assisted breeding. In: Abiotic stress adaptation in plants: physiological, molecular and genomic foundation. (Pareek, A., Sopory, S.K., Bohnert, H.J. and Govindjee, Eds.). Springer, New York. pp. 451-469.
- Xu D, Duan X, Wang B. 1996. Expression of a late embryogenesis abundant protein gene, HVA1, from barley confers tolerance to water deficit and salt stress in transgenic rice. Plant Physiol.. 110(1): 249-257.
- Yeo AR, Yeo ME, Flowers SA, Flowers TJ. 1990. Screening of rice (Oryza sativa L.) genotypes for physiological characters contributing to salinity resistance, and their relationship to overall performance. Theor. Appl. Genet.. 79(3): 377-384.
- Yoshida S, Forno DA, Cook JH, Gomez KA. 1976. Labo-ratory manual for physiological studies of rice. 3rd Edition. IRRI. Los Baños, Laguna, Philippines. pp. 61-66..
- Zeng L, Shannon MC, Grieve CM. 2002. Evaluation of salt tolerance in rice genotypes by multiple agronomic parameters. Euphytica. 127(2): 235-245.
- Zeng L. 2005. Exploration of relationships between physiolo-gical parameters and growth performance of rice (Oryza sativa L.) seedlings under salinity stress using multivari-ate analysis. Plant and Soil. 268(1): 51-59.