Abstract
Seedling vigor in drought stress conditions is an important characteristic of the dry direct-seeded rice system. The drought stress in the seedling stage disrupts seed germination and delays the establishment of seedlings. However, little is known about the genetic mechanism of seedling vigor in drought conditions. The identification of quantitative trait loci (QTL) was conducted using 162 recombinant inbred lines (RILs) derived from a cross between two rice varieties—a Tongil-type Milyang23 and a temperate japonica Tong88-7. The seedling vigor of these RILs was characterized by measuring 10 morphological traits of the seedlings grown under drought conditions. The Tong88-7 seedlings showed significantly higher values than the Milyang23 seedlings for all traits. The genotyping-by-sequencing method was used to construct a map of 6140 single nucleotide polymorphisms. Six main-effect QTLs (M-QTLs) associated with seedling vigor traits under drought stress were identified on chromosomes 9 and 11. In particular, five out of these six QTLs were located on chromosome 11, explaining the phenotypic variances of 4.3% through 10.1%. In addition, 21 epistatic QTLs (E-QTLs) were detected, and the 27 loci involved in this interaction were distributed on 11 chromosomes. Both M-QTLs and E-QTLs detected in this study would be useful in breeding programs to develop elite rice varieties especially adapted to dry direct-seeded rice system.
-
Key words: QTL, Vigorous root, Drought conditions, GBS, Rice
INTRODUCTION
Rice (
Oryza sativa L.) is one of the most important food crops, as it is a staple food for more than half of the world’s population. However, the increasing temperature, water scarcity, and costs of fertilizer and irrigation limit the maximum yield potential of rice (
Navea et al. 2017). Almost 90% of the world’s rice is produced in Asia, wherein approximately 50% of the rice-growing areas is affected by drought stress (
Khan et al. 2013;
Navea et al. 2017). Drought is a major abiotic stress that gives rise to the loss of yield and quality, and rice is highly sensitive to drought stress (
Angus et al. 1983).
To efficiently deal with drought stress, plants adopt diverse strategies: reduce their water loss through leaf rolling and rapid stomatal closure; enhance their water uptake ability by developing their root system (such as by increasing deep rooting, root density, and root/shoot ratio); improve their water-storage ability in specific organs; and accelerate or decelerate the conversion from vegetative to reproductive stage to avoid complete abortion in severe drought stress conditions (
Levitt 1972;
O’Toole and Chang 1979).
Root is the primary site to perceive drought stress and to initiate a signaling cascade at the molecular level. Thus, root system development is one of the most promising strategies to improve stress tolerance in crops (
Agrawal et al. 2016;
Mai et al. 2014). An ideal root architecture and extensive root system are desirable as they contribute to an increase in drought tolerance by maximizing water capture and allowing root access to soil moisture, thereby supporting shoot growth under drought conditions (
Yoshida and Hasegawa 1982;
Cui et al. 2002;
Gowda et al. 2011;
Khan et al. 2013). Therefore, elucidation of the mechanisms of interactions between root system architecture and drought stress in rice would have a noticeable impact on overcoming drought stress (
Gowda et al. 2011;
Wu and Cheng 2014).
Some quantitative trait loci (QTLs) underlying the root traits related to drought tolerance have been identified in rice (
Champoux et al. 1995;
Khan et al. 2013).
Dro1, a QTL controlling the ratio of deep rooting (RDR) has been reported in rice (
Uga et al. 2013).
Courtois et al. (2009) summarized and databased the QTLs related to 29 root traits, including root number, maximum root length, root thickness, root/shoot ratio, and root penetration index.
Li et al. (2017) analyzed the genetic components of 21 root traits using a genome-wide association study (GWAS) of a natural population and identified 110 significant association loci containing several reported and unknown candidate genes for root development.
Identifying genes and QTLs for root development, especially in the seedling stage, would contribute to the improvement of the direct-seeded rice system (
Sandhu et al. 2014). In addition to the deficiency of water uptake under drought stress, the reduction in nutrient uptake-especially of nitrogen and phosphorus- is another critical factor involved in decreasing the yield of the direct-seeded rice (
Kumar and Ladha 2011). It has been emphasized that root system improvement is a promising strategy to capture nutrients more efficiently (
Sandhu et al. 2014). However, the QTLs and candidate genes associated with early root development under water-deficiency conditions have not been well elucidated.
In this study, the seedling vigor of rice was investigated under drought stress conditions, and a QTL analysis was performed using the genotyping-by-sequencing (GBS) method. A total of 162 recombinant inbred lines (RILs) of rice derived from the cross of two varieties, Milyang23 and Tong88-7, were grown in drought stress conditions for two weeks and subjected to seedling vigor evaluations. A total of 6 main-effect QTLs (M-QTLs) and 21 epistatic QTLs (E-QTLs) associated with root morphological traits were identified on all chromosomes. The QTLs identified in this study would provide useful genetic information for the molecular breeding of drought-tolerant rice varieties with enhanced seedling vigor.
MATERIALS AND METHODS
Plant materials and growth conditions
A total of 162 F
12 RILs, derived from a cross between Milyang23 (a Korean Tongil-type rice variety derived from an
indica ×
japonica cross and similar to
indica in its genetic make-up) and Tong88-7 (originated from the Jilin province of China) (MT-RILs) were developed by using the single-seed descent method at Seoul National University in Korea (
Jiang et al. 2008). The rice seeds were sterilized in 2% (v/v) sodium hypochlorite for 10 minutes, rinsed thoroughly twice with deionized water for 10 minutes, and germinated for 3 days at 30°C in darkness. The pots (5.5 cm × 5.5 cm × 11.5 cm) used for seedling growth were filled with sterile beach sand (autoclaved at 121°C under 20 psi for at least 30 minutes) and a nonwoven fabric on the bottom inside of the pot. The germinated rice seeds were sown, one in each pot, and the pots were kept in a growth chamber (30°C/25°C, day/night) with a long-day photoperiod (14-hour light/10-hour dark) and 60% relative humidity for two weeks. The plants were grown under semi-drought conditions in which the water amount of the pots filled with beach sand were maintained at 70% field capacity for the entire growth period.
The two-week-old rice seedlings of the 162 F
12 RILs grown in semi-drought conditions were removed from the pots. After carefully washing excess sand and water from the roots, the lengths and fresh weights of the roots and shoots were measured, respectively. Subsequently, all shoots and roots were dried at room temperature for one week, and their dry weights were measured. The seedling quality was determined as the value of the shoot dry weight divided by the shoot length of a plant (mg/cm) (
Park et al. 2013). The seedling vigor of these plants was evaluated using nine morphological traits: shoot length (SL), shoot fresh weight (SFW), shoot dry weight (SDW), root length (RL), root fresh weight (RFW), root dry weight (RDW), ratio of root to shoot length (RRSL), ratio of root to shoot fresh weight (RRSFW), ratio of root to shoot dry weight (RRSDW), and seedling quality (SQ).
Total genomic DNA of all RILs and their corresponding parents were isolated from leaf tissues using the CTAB extraction method (
Murray and Thompson, 1980). The quality and quantity of DNA were measured using PicoGreen
® (Invitrogen, Carlsbad, CA) before diluting it to a concentration of 10 ng/μL for GBS. A GBS library was prepared as described by
Elshire et al. (2011). The quantity and quality of the GBS library were determined using the Bioanalyzer Kit (Agilent Genomics, Santa Clara, CA). For library sequencing, a paired-end of 384-plex library per flowcell channel was sequenced using the HiSeq4000 platform (Illumina, Inc., San Diego, CA).
The GBS libraries consisting of 162 RILs and two parental lines were generated as described by
Elshire et al. (2011) using the restriction enzyme ApeKI (
Spindel et al. 2013). TASSEL-GBS was used to produce the unique sequence tags from the sequence reads (
Glaubitz et al. 2014). The Burrows-Wheeler Aligner tool (
Li and Durbin 2010) was used to align the sequence tags to the Nipponbare rice reference genome IRGSP1.0. The removal of PCR duplicates and read grouping were performed using Picard (
http://picard.sourceforge.net). The Genome Analysis Toolkit (GATK) was used to correct the misalignments caused by the presence of INDELs, and the UnifiedGenotyper (
McKenna et al. 2010) was used to detect single nucleotide polymorphisms (SNPs) and to call SNP genotypes. The additional filtering and genotyping processes were performed with user-friendly option changes in the web-interfaced GBS genotyping pipeline, and the final genotype data were visually displayed using the GBS browser developed by Phyzen Genomics Institute, Korea (
http://www.phyzen-lab.com/oleracea).
The linkage map construction and QTL analysis were carried out using the software QTL ICIMapping 4.1 (
Meng et al. 2015). The linkage map was constructed using the SNP markers polymorphic between the two parents. The ordering of the markers within each chromosome was based on the recombination events between the markers, and the recombination distance was calculated using the Kosambi mapping function (
Kosambi 1943). An inclusive composite interval mapping (ICIM) method was used to detect the main-effect (M-QTLs) and epistatic QTLs (E-QTLs). The logarithm of odds (LOD) values greater than 3 and 4 were used to declare significant M- and E-QTLs, respectively. The permutation tests were performed using 1,000 iterations to determine significant LOD thresholds. Furthermore, the additive effects and percentage variations explained (PVE) for each M- and E-QTL were obtained by performing an ICIM analysis.
RESULTS
Evaluation of seedling vigor difference between Milyang23 and Tong88-7
To assess seedling vigor, the two parental varieties (Milyang23 and Tong88-7) and RIL populations were grown in semi-drought conditions for two weeks. The phenotypic values of the seedling-vigor-related traits studied are given in
Table 1. Tong88-7 exhibited significantly better performance than Milyang23 in most of the traits; it showed relatively high values of the traits RFW, SL, SFW, SDW, RRSFW, RRSDW, and SQ (
Table 1,
Fig. 1). However, no significant difference was observed between the two parents in the RL, RDW, and RRSL traits. The phenotypic data indicated that the overall seedling vigor was much higher in Tong88-7 than in Milyang23 under the drought-prone conditions.
The RIL populations were used to identify the genetic basis of seedling vigor in Tong88-7. The RILs showed largely normal distributions in all traits, except SFW and RRSFW, in which the distributions were skewed to the left (
Fig. 2). In addition, a transgressive segregation was observed in both positive and negative directions for all seedling-vigor traits in RILs (
Fig. 2).
To determine the existence of correlations among the seedling-vigor-associated traits under semi-drought conditions, the Pearson’s correlation coefficient (r) values were estimated among all 10 morphological traits (
Table 2). Significant positive and negative correlations were observed among these traits. The traits SDW and RDW were positively correlated (r = 0.55), indicating that an increase in RDW is necessary for shoot development. Similarly, the traits SQ and SDW were positively correlated (r = 0.58). Therefore, it is necessary to increase root development in order to enhance shoot development and seedling quality.
Genotyping-by-sequencing was performed on the two parental lines and 162 MT-RILs used for seedling-vigor trait evaluation. After the completion of the filtering process, 6140 SNPs were used to construct the molecular linkage map, covering 326 Mb of the rice genome with a total genetic length of 1276.13 cM (
Table 3). The average length of chromosome was 196 cM with 4.35 markers per cM. A QTL analysis was performed with 162 MT-RILs and 6140 SNP markers. The numbers of SNP markers located on rice chromosomes 1 to 12 were 402, 1243, 441, 561, 43, 262, 1387, 443, 103, 593, 560, and 102, respectively. The percentage of total genotype was 82.84, and the genotypic composition of Milyang23 and Tong88-7 alleles were 41.53 and 41.31%, respectively (
Table 3).
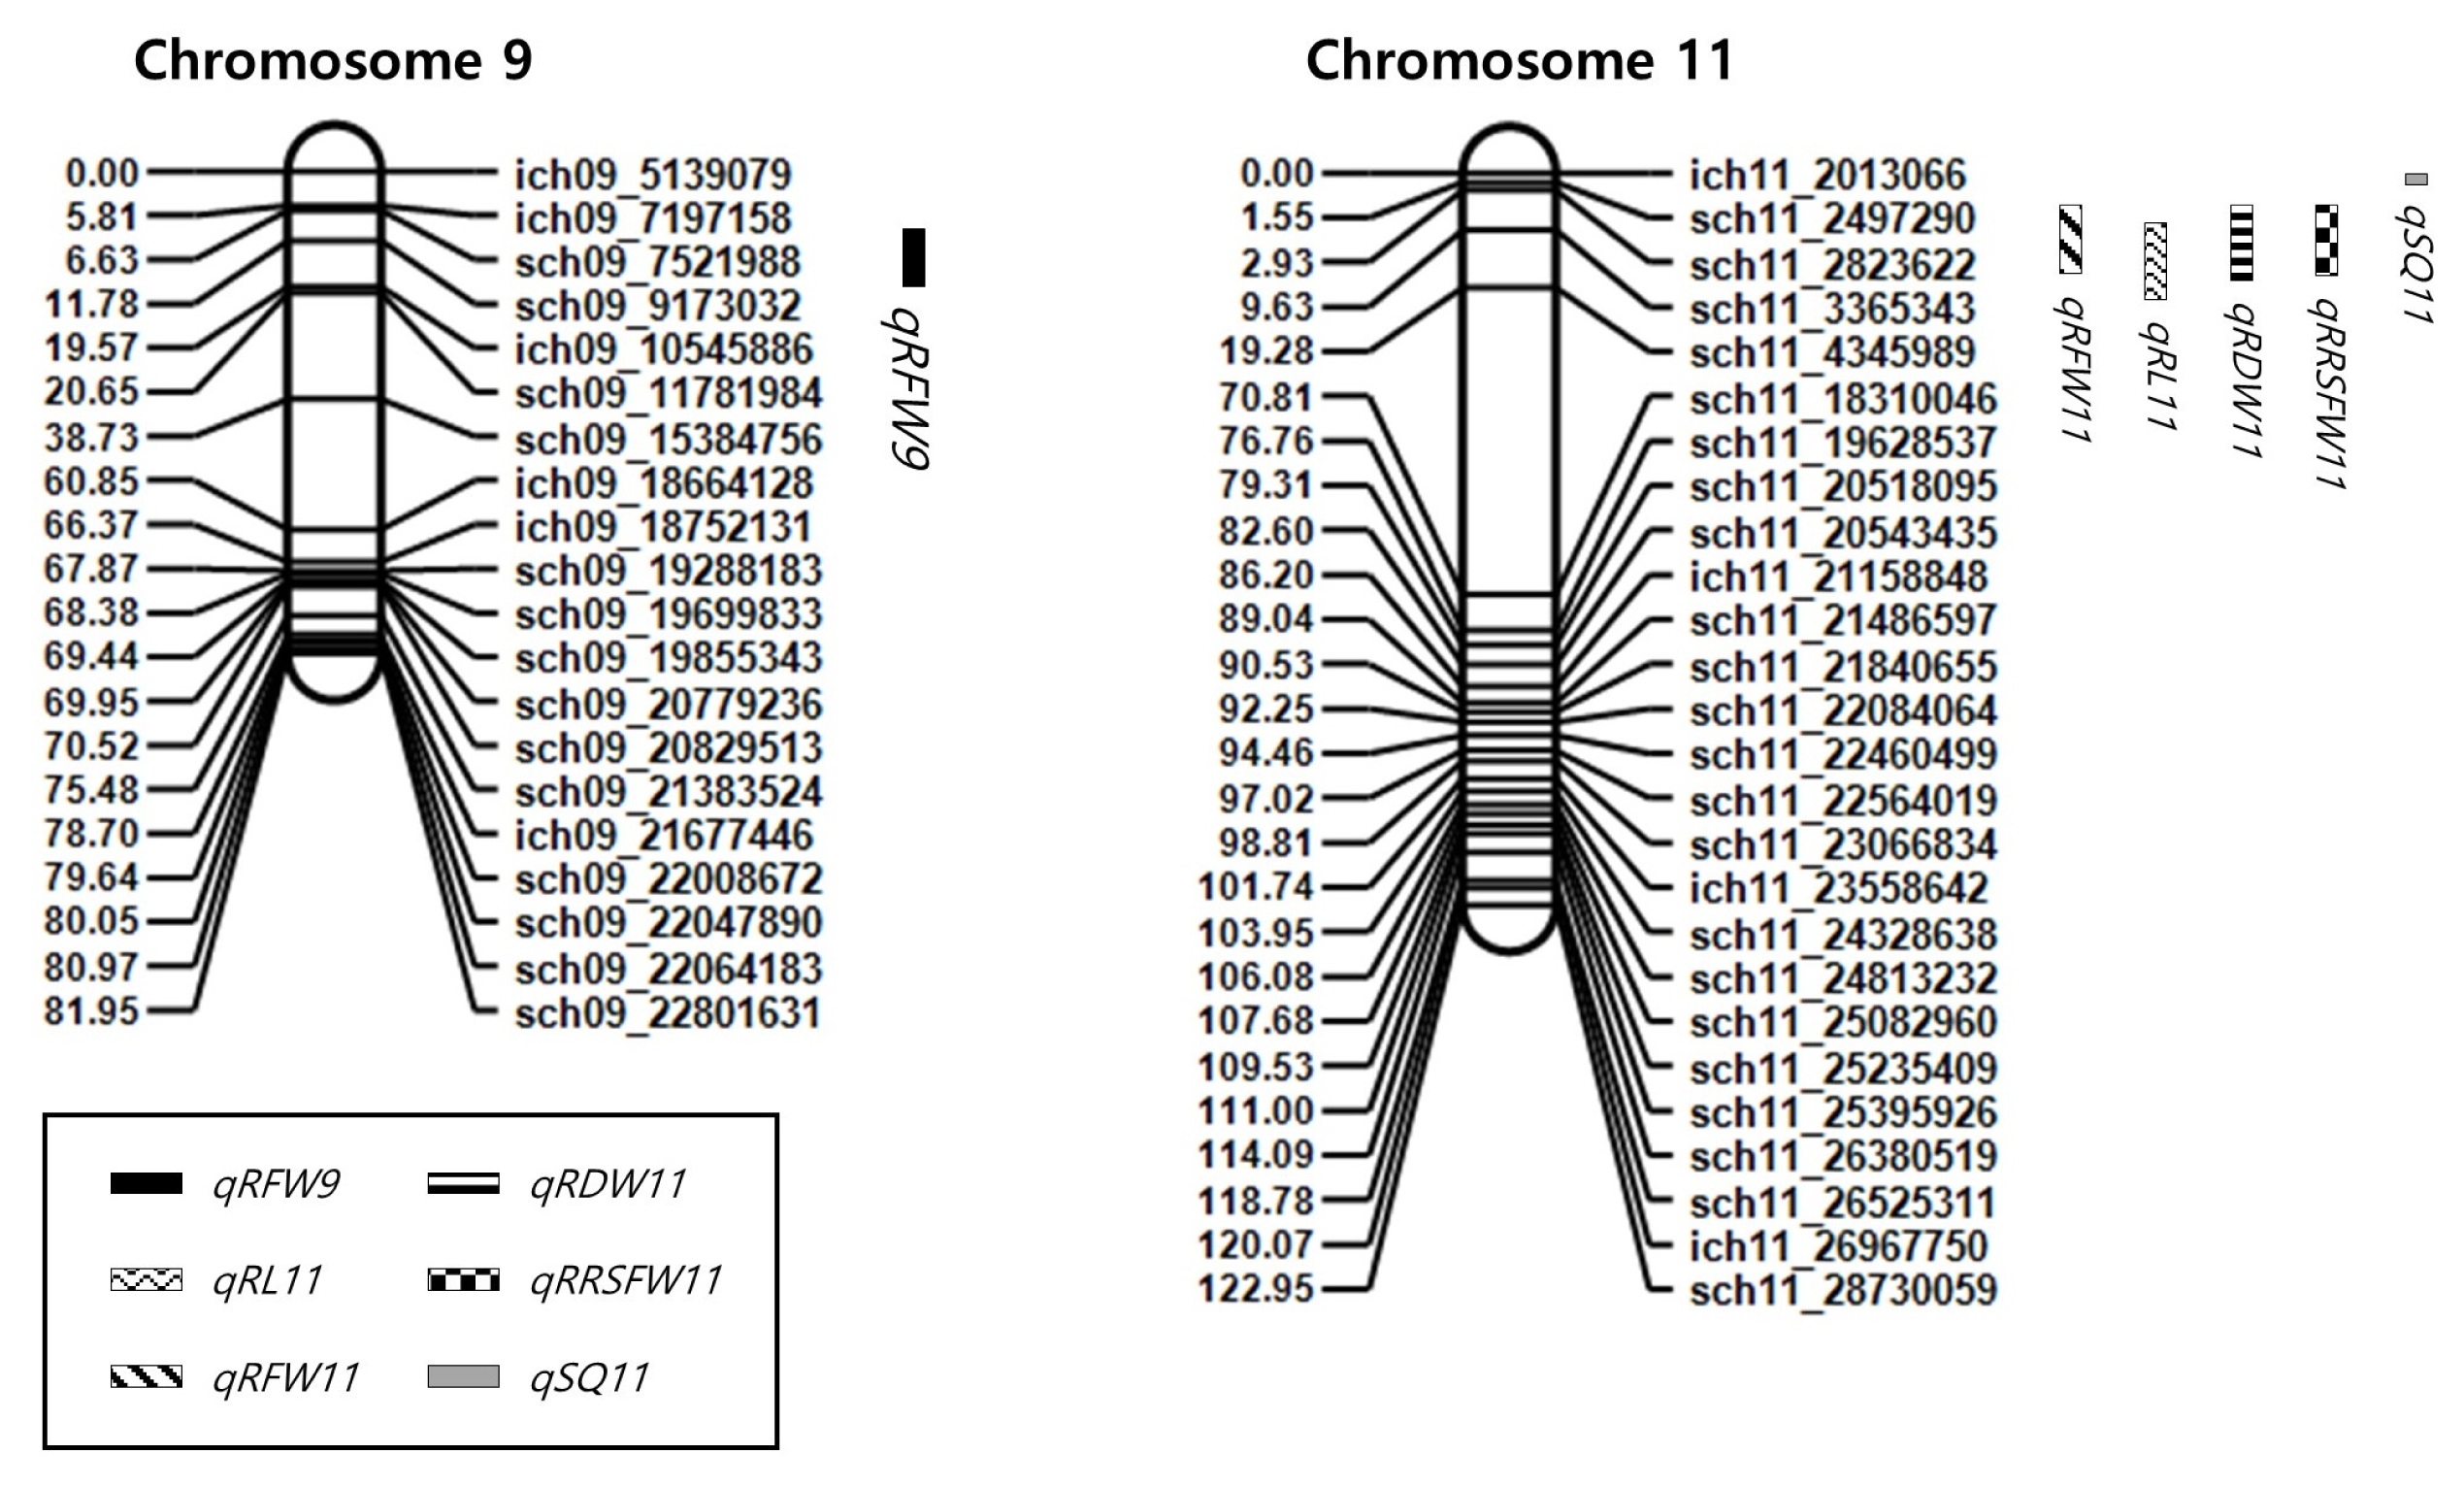
An inclusive composite interval mapping (ICIM) was performed with 6140 informative SNPs, leading to the identification of six main-effect QTLs (M-QTLs; LOD >3.0) for various root and shoot traits under semi-drought conditions (
Table 4,
Fig. 3). The phenotypic variances explained (PVE) by individual QTLs ranged from 4.32 to 10.06% (
Table 4). Five of these six QTLs were detected on chromosome 11. Among these, three QTLs (
qRL11,
qRDW11, and
qRRSFW11) were co-localized in the same interval (between sch11_3365343 and sch11_4345989). Although
qRRSFW11 exhibited a relatively higher heritability, explaining 10.06% of the phenotypic variation with an LOD value of 3.68, these three QTLs displayed a similar limit of detection (LOD 3.0–3.7) plot in this interval (
Table 4). It could be assumed that a common QTL exhibited a pleiotropic effect on the values of these traits, accounting for 8.97, 8.35, and 10.06% of the phenotypic variation for RL, RDW, and RRSFW, respectively. Only one QTL,
qRFW9, for the trait RFW was detected on chromosome 9, explaining 10.06% of the phenotypic variation with an LOD value of 3.21. The alleles of all QTLs, except for
qRRSFW11, contributing to increasing values of these traits came from the parental line Tong88-7.
A total of 21 E-QTLs were identified for seven traits by an inclusive composite interval mapping with an LOD value of at least 4.0, but no interaction existed for the other three traits (
Table 5). A total of 21 E-QTL pairs were detected for the RFW, RDW, SFW, SDW, RRSL, RRSFW, and SQ traits involving 27 loci distributed on 11 chromosomes (
Table 5). One digenic interaction was identified for RRSL and SQ, explaining 14.06 and 13.41% of the total phenotypic variation, respectively. Two digenic interactions were identified for RFW and RDW, explaining 19.49 and 25.87% of the total phenotypic variation, respectively. Five digenic interactions were identified for RRSFW, explaining 25.63% of the total phenotypic variation. Interestingly, nine digenic interactions were identified for SFW, explaining 5.56% of the total phenotypic variation with relatively low individual phenotypic variation values ranging from 0.44 to 0.79%. Among these interactions, only one M-QTL located in the sch11_3365343–sch11_4345989 interval was involved in epistatic interactions, but the other M-QTL was not involved in any digenic interaction.
DISCUSSION
Nearly half of the world’s rice is grown in aerobic upland and rainfed lowland systems, where the water supply depends on rain and plants are frequently exposed to unpredictable periods of drought (
Singh and Chinnusamy 2008). One of the strategic ways to cope with drought stress during the seedling stage is to enhance seedling vigor, which is mainly determined by genetic inheritance and the environments of germination and early seedling stages (
Qun et al. 2007;
Yang et al. 2015). Seedling vigor is considered to be one of the important traits that determine successful crop establishment, especially under the dry direct-seeded rice system (
Zhang et al. 2004), in which the rapid and uniform emergence and development are critically hampered due to the lack of timely water supply. Although seedling vigor enhancement is a promising strategy to overcome this negative effect on plant growth under drought stress conditions (
Rebolledo et al. 2013), the genetic basis for the seedling vigor under drought stress has not been fully elucidated.
In this study, we conducted a QTL analysis with GBS-based genotyping and phenotyping of 162 RILs at the seedling stage under semi-drought conditions, and thereby identified six M-QTLs and 21 E-QTLs for 10 root and shoot-related traits representing seedling vigor. One of the noticeable results of this study was that some of the M-QTLs detected were co-localized within the genome; three out of six QTLs (
qRL11,
qRDW11, and
qRRSFW11) were detected in the same interval (between sch11_3365343 and sch11_4345989). A QTL cluster is a valuable genetic resource to simultaneously introduce useful gene(s) underlying several promising traits into a recipient variety. In correlation analysis, the traits RL and RDW were found to positively correlate each other with an r-value of 0.48, whereas RL showed no significant correlation with RRSFW (
Table 2). This suggests that the QTLs for RL and RRSFW might not be the same but located in the adjacent region consisting of a QTL cluster.
This QTL cluster that regulates several root and shoot traits would be a valuable target for the improvement of seedling vigor in rice. The QTLs identified in this study were compared with the previously reported QTLs, which were obtained from the QTL Annotation Rice Online (Q-TARO) database (
http://qtaro.abr.affrc.go.jp/). The QTL
qRFW9 detected for RFW was located in the regions adjacent to the two previously reported QTLs,
MRL for maximum root length (
Xu et al. 2001) and
RWC for leaf relative water content, which were mapped on chromosome 9 under drought stress conditions (
Price et al. 2002). Unlike
MRL, which was previously identified for maximum root length on chromosome 9,
qRFW9 for RFW was detected only on chromosome 11 in the genetic background of the rice varieties used in this study. This suggests that
qRFW9 might be a novel QTL. As MRL, RWC, and RFW are important traits for drought tolerance, the QTL cluster located on chromosome 9 would be a promising target to develop molecular markers for drought-tolerant rice breeding. In addition, the location of
qRFW11 overlapped with the previously identified
qGY11a located in the interval RM20B-RM332 on chromosome 11 (
Xu et al. 2005). The QTL
qGY11a affecting grain yield was identified in normal irrigated conditions, but not in drought-stress conditions. However, in this study
qRFW11 underlying RFW was identified in semi-drought conditions. Although a QTL underlying RFW could contribute to grain yield, this discrepancy in the environmental conditions, in which QTLs were identified, suggests that these two QTLs might not be genetically associated. Meanwhile, the location of the remaining four QTLs did not overlap with any of the previously known QTLs, indicating that these QTLs are novel.
Quite a few studies have elucidated the genetic basis of shoot biomass contributing to seedling vigor. The following shoot biomass traits were reported to be associated with seedling vigor: SL and SDW (
Redona and Mackill 1996;
Zhang et al. 2004;
Zhou et al. 2007), mesocotyl and coleoptile elongation (
Lee et al. 2012 and
2017;
Wu et al. 2015;
Lu et al. 2016), and shoot biomass under drought response (
Rebolledo et al. 2012a,
b). However, not only shoot biomass, but also root biomass and architecture, are critical traits contributing to seedling vigor under drought conditions (
Nass and Zuber 1971;
Sanguineti et al. 1998). As direct observation of the intact root phenotypes belowground is technically difficult, not many studies have identified the root-associated QTLs under drought stress conditions (
Uga et al. 2013;
Li et al. 2017). In this study, we investigated the root traits of the seedlings under drought stress conditions and found five M-QTLs (of a total of six QTLs) associated with the root traits, including RL, RFW, and RDW. In Tong88-7, the alleles for these QTLs contributed to the increasing values of these traits, and Tong88-7 showed significantly higher values of all traits compared to Milyang23. These observations indicate that the root-trait M-QTLs detected in this study are useful genetic resources to enhance root architecture, and thereby help roots to acquire more soil water by increasing the root surface contacting soil particles.
In addition to the six M-QTLs, we identified a total of 21 additive × additive interactions for seven root and shoot-related traits on the 11 chromosomes with LOD values of at least 4.0. Interestingly, some QTLs such as SFW, SDW and RRSL, were detected only in E-QTL (
Tables 4 and
5), and the E-QTLs detected collectively explained a larger portion of the total phenotypic variation than the M-QTLs, indicating that epistasis also plays an important role in controlling the development of seedling-vigor related traits. Thus, these epistatic effects need to be considered when these QTLs are used in breeding programs. Conclusively, as the seedling-vigor traits contribute to the improvement of field emergence in plants and their ability to compete with weeds, especially in the dry direct-seeded rice system, and it is becoming more important in this climate change era, these QTLs, both M-QTLs and E-QTLs, would provide valuable genetic information to breeders for the breeding of drought-tolerant rice varieties with enhanced seedling vigor under drought stress conditions.
ACKNOWLEDGEMENTS
This work was supported by the National Research Foundation of Korea (NRF) grant funded by the Korean government (MSIP) (NRF-2015R1A2A2A01007507) and a grant from the Next-Generation BioGreen 21 Program (Plant Molecular Breeding Center, No. PJ PJ01319603), Rural Development Administration, Republic of Korea.
Fig. 1Comparison between root fresh weight of two-weeks old Milyang23 and Tong88-7 grown in beach sand under semi-drought condition. Dotted red box region was magnified for better observation of root architecture.
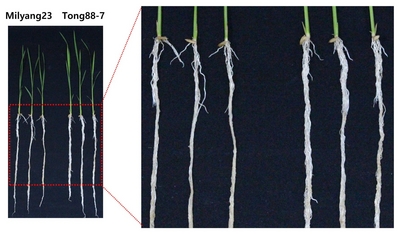
Fig. 2Frequency distributions of the early seedling-vigor associated traits in RIL population grown under semi-drought condition. The grey bars represent number of individual RILs. Black arrows indicate mean values of parents in early seedling-vigor associated traits. M and T represent Milyang23 and Tong88-7, respectively.
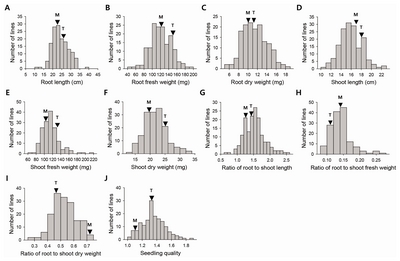
Fig. 3Physical map of SNP markers derived from GBS of MT-RILs and the locations of seedling-vigor associated QTLs identified in this study. White solid bars indicate chromosomes. Black, grey and patterned solid bars on the right of each chromosome represent QTLs indicated by a bar corresponding to the length of their confidence interval.

Table 1Phenotypic values of early seedling-vigor related traits among the parents and RIL population in two-weeks old plants grown under semi-drought condition.
Table 1
|
Traitz)
|
Milyang23 |
Tong88-7 |
RIL population |
|
|
Mean ± SDy)
|
Min |
Max |
|
RL (cm) |
23.3 ± 0.70 |
25.15 ± 3.15 |
24.20 ± 4.53 |
10.50 |
39.07 |
|
RFW (mg) |
123.5 ± 13.50 |
151.00 ± 19.50*
|
120.42 ± 25.35 |
47.00 |
190.50 |
|
RDW (mg) |
10.30 ± 3.11 |
11.63 ± 5.59 |
11.40 ± 2.53 |
5.30 |
18.15 |
|
SL (cm) |
16.70 ± 1.31 |
17.93 ± 0.89*
|
15.94 ± 2.12 |
10.93 |
22.60 |
|
SFW (mg) |
106.00 ± 2.00 |
133.60 ± 9.10***
|
115.12 ± 21.45 |
64.00 |
215.00 |
|
SDW (mg) |
19.25 ± 0.75 |
23.85 ± 2.55*
|
21.81 ± 3.81 |
12.63 |
33.36 |
|
RRSL |
1.32 ± 0.06 |
1.43 ± 0.26 |
1.53 ± 0.31 |
0.69 |
2.52 |
|
RRSFW |
0.14 ± 0.02 |
0.11 ± 0.01***
|
0.14 ± 0.03 |
0.08 |
0.27 |
|
RRSDW |
0.71 ± 0.13 |
0.47 ± 0.08**
|
0.53 ± 0.09 |
0.27 |
0.73 |
|
SQ |
1.03 ± 0.06 |
1.18 ± 0.03***
|
1.35 ± 0.15 |
1.04 |
1.86 |
Table 2Correlations coefficients among seedling-vigor associated traits in 162 RIL lines.
Table 2
|
Traits |
RL |
SL |
RFW |
SFW |
RDW |
SDW |
RRSL |
RRSFW |
RRSDW |
SQ |
|
RL |
1.00 |
|
|
|
|
|
|
|
|
|
|
SL |
0.13 |
1.00 |
|
|
|
|
|
|
|
|
|
RFW |
0.33***
|
0.39***
|
1.00 |
|
|
|
|
|
|
|
|
SFW |
0.18*
|
0.66***
|
0.33***
|
1.00 |
|
|
|
|
|
|
|
RDW |
0.48***
|
0.39***
|
0.73***
|
0.41***
|
1.00 |
|
|
|
|
|
|
SDW |
0.23**
|
0.65***
|
0.47***
|
0.74***
|
0.55***
|
1.00 |
|
|
|
|
|
RRSL |
0.67***
|
−0.45***
|
0.04 |
−0.22***
|
0.19*
|
−0.18*
|
1.00 |
|
|
|
|
RRSFW |
−0.21*
|
0.15 |
−0.60***
|
0.02 |
−0.45***
|
−0.11 |
−0.28***
|
1.00 |
|
|
|
RRSDW |
0.18*
|
−0.07 |
0.31***
|
−0.2**
|
0.49***
|
−0.24**
|
0.27***
|
−0.38 |
1.00 |
|
|
SQ |
0.23**
|
−0.10 |
0.23**
|
0.35***
|
0.34***
|
0.58***
|
0.30***
|
−0.27***
|
−0.25**
|
1.00 |
Table 3Summary of the markers distribution and genome coverage in the linkage map of the RIL population.
Table 3
|
Chr. |
No. of markers |
Chr. length coverage (bp)z)
|
Genetic length (cM)y)
|
No. of markers/cM |
Minimum interval (cM) |
Maximum interval (cM) |
Average interval (cM) |
No. of gaps >5 cM |
Percentage of genotype (%) |
|
|
Milyang23 |
Tong88-7 |
Missing |
|
1 |
402 |
40,128,771 |
144.85 |
2.78 |
0.37 |
18.2 |
0.36 |
9 |
46.36 |
37.26 |
16.37 |
|
2 |
1243 |
33,188,669 |
148.6 |
8.36 |
0.33 |
23.18 |
0.12 |
3 |
46.16 |
36.76 |
17.09 |
|
3 |
441 |
35,141,671 |
110.53 |
3.99 |
0.36 |
68.18 |
0.25 |
1 |
39.50 |
43.85 |
16.64 |
|
4 |
561 |
28,502,996 |
120.76 |
4.65 |
0.34 |
22.69 |
0.21 |
3 |
36.01 |
46.58 |
17.41 |
|
5 |
43 |
22,871,791 |
56.97 |
0.75 |
0.42 |
26.98 |
1.35 |
2 |
43.76 |
39.94 |
16.31 |
|
6 |
262 |
27,162,759 |
93.09 |
2.81 |
0.33 |
22.91 |
0.35 |
3 |
35.86 |
45.41 |
18.74 |
|
7 |
1387 |
29,462,612 |
120.64 |
11.5 |
0.33 |
15.36 |
0.08 |
2 |
44.63 |
38.60 |
16.78 |
|
8 |
443 |
28,154,081 |
117.23 |
3.78 |
0.36 |
30.29 |
0.26 |
5 |
42.98 |
39.14 |
17.88 |
|
9 |
103 |
17,797,835 |
81.95 |
1.26 |
0.41 |
22.12 |
0.8 |
6 |
34.52 |
45.17 |
20.31 |
|
10 |
593 |
23,129,467 |
98.56 |
6.02 |
0.34 |
14.14 |
0.16 |
1 |
35.07 |
47.42 |
17.51 |
|
11 |
560 |
26,975,688 |
123.4 |
4.54 |
0.32 |
51.53 |
0.22 |
3 |
36.98 |
46.04 |
16.98 |
|
12 |
102 |
13,793,654 |
59.55 |
1.71 |
0.32 |
32.93 |
0.59 |
2 |
39.81 |
43.89 |
16.29 |
|
Total |
6140 |
326,309,994 |
1276.13 |
52.15 |
4.23 |
348.51 |
4.75 |
40 |
41.53 |
41.31 |
17.16 |
|
Mean |
511.7 |
27,192,500 |
196.3 |
4.35 |
0.35 |
29.04 |
0.4 |
3.33 |
40.14 |
42.50 |
17.36 |
Table 4Identification of QTLs associated with seedling vigor traits evaluated in MT-RILs.
Table 4
|
TraitNamez)
|
Chr. |
Positiony)
|
LeftMarkerx)
|
RightMarkerx)
|
LOD |
PVE (%)w)
|
Addv)
|
|
qRL11
|
11 |
16 |
sch11_3365343 |
sch11_4345989 |
3.14 |
8.97 |
−1.55 |
|
qRFW9
|
9 |
14 |
sch09_9173032 |
ich09_10545886 |
3.21 |
10.06 |
−12.01 |
|
qRFW11
|
11 |
9 |
sch11_2823622 |
sch11_3365343 |
3.50 |
4.32 |
−7.87 |
|
qRDW11
|
11 |
13 |
sch11_3365343 |
sch11_4345989 |
3.04 |
8.35 |
−0.86 |
|
qRRSFW11
|
11 |
10 |
sch11_3365343 |
sch11_4345989 |
3.68 |
10.06 |
0.01 |
|
qSQ11
|
11 |
1 |
ich11_2013066 |
sch11_2497290 |
3.17 |
8.69 |
−0.05 |
Table 5Identification of epistatic QTLs (E-QTLs) for traits.
Table 5
|
Traits |
Chr. 1 |
Position 1 |
LeftMarker1 |
RightMarker1 |
Chr. 2 |
Position 2 |
LeftMarker2 |
RightMarker2 |
LODz)
|
PVE (%) |
Add1y)
|
Add2 |
AddbyAddx)
|
|
RFW |
2 |
20 |
ich02_5196733 |
sch02_5230872 |
4 |
30 |
sch04_18763820 |
sch04_19992451 |
4.22 |
10.92 |
0.45 |
1.92 |
−9.11 |
|
RFW |
2 |
70 |
ich02_19764482 |
sch02_19818373 |
10 |
80 |
sch10_19609978 |
sch10_19757727 |
4.21 |
8.57 |
−1.69 |
0.37 |
−8.31 |
|
RDW |
2 |
70 |
ich02_19764482 |
sch02_19818373 |
10 |
75 |
sch10_18226263 |
ich10_19479764 |
5.53 |
9.94 |
−0.16 |
0.20 |
−1.13 |
|
RDW |
2 |
120 |
sch02_33032852 |
sch02_33602428 |
12 |
40 |
sch12_19891678 |
sch12_27094002 |
4.40 |
15.83 |
−0.47 |
0.20 |
−1.36 |
|
SFW |
1 |
25 |
sch01_5087361 |
sch01_6734940 |
1 |
30 |
ich01_6767989 |
sch01_10939343 |
6.39 |
0.71 |
−11.02 |
12.24 |
−32.42 |
|
SFW |
4 |
40 |
sch04_18763820 |
sch04_19992451 |
4 |
45 |
sch04_20020347 |
sch04_22463546 |
4.52 |
0.49 |
−17.54 |
19.31 |
−18.71 |
|
SFW |
5 |
20 |
sch05_3074371 |
sch05_20462142 |
5 |
35 |
sch05_20462142 |
sch05_25097135 |
7.48 |
0.77 |
10.14 |
−10.71 |
−17.04 |
|
SFW |
6 |
25 |
ich06_777450 |
sch06_2942192 |
6 |
30 |
sch06_3456779 |
sch06_5164475 |
7.04 |
0.50 |
15.40 |
−14.90 |
−20.97 |
|
SFW |
8 |
45 |
sch08_4748893 |
sch08_6095179 |
8 |
50 |
sch08_6095179 |
sch08_6313336 |
4.95 |
0.44 |
−21.33 |
21.15 |
−19.45 |
|
SFW |
9 |
20 |
ich09_10545886 |
sch09_11781984 |
9 |
25 |
sch09_11800572 |
sch09_15384756 |
5.10 |
0.64 |
−10.99 |
7.81 |
−33.60 |
|
SFW |
10 |
60 |
sch10_17683106 |
ich10_17849231 |
10 |
70 |
sch10_18226263 |
ich10_19479764 |
4.80 |
0.50 |
16.83 |
−19.02 |
−15.18 |
|
SFW |
11 |
25 |
sch11_4345989 |
sch11_18310046 |
11 |
30 |
sch11_4345989 |
sch11_18310046 |
5.69 |
0.79 |
−14.54 |
18.72 |
−10.95 |
|
SFW |
12 |
30 |
sch12_19891678 |
sch12_27094002 |
12 |
35 |
sch12_19891678 |
sch12_27094002 |
5.35 |
0.73 |
12.47 |
−14.04 |
−12.70 |
|
SDW |
5 |
5 |
sch05_3074371 |
sch05_20462142 |
5 |
15 |
sch05_3074371 |
sch05_20462142 |
4.92 |
3.32 |
1.00 |
−1.62 |
−2.70 |
|
RRSL |
2 |
55 |
ich02_17191191 |
ich02_17223018 |
6 |
50 |
ich06_6355863 |
ich06_7106892 |
4.16 |
14.06 |
−0.02 |
−0.02 |
−0.11 |
|
RRSFW |
3 |
5 |
sch03_1827167 |
sch03_28123567 |
3 |
10 |
sch03_1827167 |
sch03_28123567 |
4.56 |
3.07 |
−0.01 |
0.01 |
−0.04 |
|
RRSFW |
4 |
25 |
sch04_18651090 |
sch04_18763820 |
4 |
30 |
sch04_18763820 |
sch04_19992451 |
4.53 |
2.72 |
0.01 |
−0.01 |
−0.04 |
|
RRSFW |
6 |
25 |
ich06_777450 |
sch06_2942192 |
6 |
30 |
sch06_3456779 |
sch06_5164475 |
4.88 |
2.63 |
0.01 |
−0.02 |
−0.03 |
|
RRSFW |
9 |
60 |
sch09_15384756 |
ich09_18664128 |
9 |
65 |
ich09_18664128 |
ich09_18752131 |
6.03 |
2.42 |
−0.02 |
0.02 |
−0.03 |
|
RRSFW |
11 |
15 |
sch11_3365343 |
sch11_4345989 |
11 |
20 |
sch11_4345989 |
sch11_18310046 |
5.63 |
3.31 |
0.03 |
−0.03 |
−0.02 |
|
SQ |
1 |
115 |
ich01_32634671 |
sch01_33219737 |
12 |
15 |
sch12_18954369 |
sch12_19106499 |
4.15 |
13.41 |
0.01 |
−0.01 |
−0.05 |
References
- Agrawal L, Gupta S, Mishra SK, Pandey G, Kumar S, Chauhan PS, et al. 2016. Elucidation of complex nature of PEG induced drought-stress response in rice root using comparative proteomics approach. Front Plant Sci. 7: 1466
- Angus JF, Hasegawat S, Hsiao TC, Liboon SP, Zandstra HG. 1983. The water balance of post-monsoonal dryland crops. J Agr Sci. 101: 699-710.
- Champoux MC, Wang G, Sarkarung S, Mackill DJ, O’Toole JC, Huang N, et al. 1995. Locating genes associated with root morphology and drought avoidance in rice via linkage to molecular markers. Theor Appl Genet. 90: 969-981.
- Courtois B, Ahmadi N, Khowaja F, Price AH, Rami JF, Frouin J, et al. 2009. Rice root genetic architecture: meta-analysis from a drought QTL database. Rice. 2: 115
- Cui K, Peng S, Xing Y, Xu C, Yu S, Zhang Q. 2002. Molecular dissection of seedling-vigor and associated physiological traits in rice. Theor Appl Genet. 105: 745-753.
- Elshire RJ, Glaubitz JC, Sun Q, Poland JA, Kawamoto K, Buckler ES, et al. 2011. A robust, simple genotyping-by-sequencing (GBS) approach for high diversity species. PLoS One. 6: e19379
- Glaubitz JC, Casstevens TM, Lu F, Harriman J, Elshire RJ, et al. 2014. TASSEL-GBS: a high capacity genotyping by sequencing analysis pipeline. PLoS One. 9: e90346
- Gowda VR, Henry A, Yamauchi A, Shashidhar HE, Serraj R. 2011. Root biology and genetic improvement for drought avoidance in rice. Field Crop Res. 122: 1-13.
- Jiang W, Chu SH, Piao R, Chin JH, Jin YM, Lee J, et al. 2008. Fine mapping and candidate gene analysis of hwh1 and hwh2, a set of complementary genes controlling hybrid breakdown in rice. Theor Appl Genet. 116: 1117-1127.
- Khan MA, Iqbal M, Akram M, Ahmad M, Hassan MW, Jamil M. 2013. Recent advances in molecular tool development for drought tolerance breeding in cereal crops: a review. Zemdirbyste-Agriculture. 100: 325-334.
- Kosambi DD. 1943. The estimation of map distances from recombination values. Ann Hum Genet. 12: 172-175.
- Kumar V, Ladha JK. 2011. Direct seeding of rice: recent developments and future research needs. Advan Agron. 111: 297-413.
- Lee HS, Sasaki K, Higashitani A, Ahn SN, Sato T. 2012. Mapping and characterization of quantitative trait loci for mesocotyl elongation in rice (Oryza sativa L.). Rice. 5: 13
- Lee HS, Sasaki K, Kang JW, Sato T, Song WY, Ahn SN. 2017. Mesocotyl elongation is essential for seedling emergence under deep-seeding condition in rice. Rice. 10: 32
- Levitt T. 1972. Production-line approach to service. Harvard Business Review. 50: 41-52.
- Li H, Durbin R. 2010. Fast and accurate long-read alignment with Burrows–Wheeler transform. Bioinformatics. 26: 589-595.
- Li X, Guo Z, Lv Y, Cen X, Ding X, Wu H, et al. 2017. Genetic control of the root system in rice under normal and drought stress conditions by genome-wide association study. PLoS Genet. 13: e1006889
- Lu Q, Zhang M, Niu X, Wang C, Xu Q, Feng Y, et al. 2016. Uncovering novel loci for mesocotyl elongation and shoot length in indica rice through genome-wide association mapping. Planta. 243: 645-657.
- Mai CD, Phung NT, To HT, Gonin M, Hoang GT, Nguyen KL, et al. 2014. Genes controlling root development in rice. Rice. 7: 30
- McKenna A, Hanna M, Banks E, Sivachenko A, Cibulskis K, Kernytsky A, et al. 2010. The Genome Analysis Toolkit: a MapReduce framework for analyzing next-generation DNA sequencing data. Genome Res. 20: 1297-1303.
- Meng L, Li H, Zhang L, Wang J. 2015. QTL ICIMapping: integrated software for genetic linkage map construction and quantitative trait locus mapping in biparental populations. Crop J. 3: 269-283.
- Murray MG, Thompson WF. 1980. Rapid isolation of high molecular weight plant DNA. Nucleic Acids Res. 8: 4321-4325.
- Navea IP, Dwiyanti MS, Park J, Kim B, Lee S, Huang X, et al. 2017. Identification of quantitative trait loci for panicle length and yield related traits under different water and P application conditions in tropical region in rice (Oryza sativa L.). Euphytica. 213: 37
- Nass HG, Zuber MS. 1971. Correlation of corn (Zea mays L.) roots early in development to mature root development. Crop Sci. 11: 655-658.
- O’Toole JC, Chang TT. 1979. Drought resistance in cereals: rice, a case study. Wiley. New York.
- Park ST, Kim WJ, Shin WC, Park HG, Kim SY. 2013. Effect of seedling raising shelf size on seedling growth of rice. J Korean Society Int Agri. 25: 165-171.
- Price AH, Townend J, Jones MP, Audebert A, Courtois B. 2002. Mapping QTLs associated with drought avoidance in upland rice grown in the Philippines and West Africa. Plant Mol Biol. 48: 683-695.
- Qun S, Wang JH, Sun BQ. 2007. Advances on seed vigor physiological and genetic mechanisms. Agric Sci China. 6: 1060-1066.
- Rebolledo MC, Dingkuhn M, Péré P, McNally KL, Luquet D. 2012a. Developmental dynamics and early growth vigour in rice. I. Relationship between development rate (1/phyllochron) and growth. J Agro Crop Sci. 198: 374-384.
- Rebolledo MC, Dingkuhn M, Clément-Vidal A, Rouan L, Luquet D. 2012b. Phenomics of rice early vigour and drought response: are sugar related and morphogenetic traits relevant? Rice. 5: 22
- Rebolledo MC, Luquet D, Courtois B, Henry A, Soulié JC, Rouan L, et al. 2013. Can early vigour occur in combination with drought tolerance and efficient water use in rice genotypes? Funct Plant Biol. 40: 582-594.
- Redona ED, Mackill DJ. 1996. Mapping quantitative trait loci for seedling vigor in rice using RFLPs. Theor Appl Genet. 92: 395-402.
- Sandhu N, Singh A, Dixit S, Cruz MTS, Maturan PC, Jain RK, et al. 2014. Identification and mapping of stable QTL with main and epistasis effect on rice grain yield under upland drought stress. BMC Genet. 15: 63
- Sanguineti MC, Giuliani MM, Govi G, Tuberosa R, Landi P. 1998. Root and shoot traits of maize inbred lines grown in the field and in hydroponic culture and their relationships with root lodging. Maydica. 43: 211-216.
- Singh AK, Chinnusamy V. 2008. Enhancing rice productivity in water stressed environments: perspectives for genetic improvement and management. pp. 233-257. Serraj R, Bennett J, Hardy B, editors. Drought frontiers in rice: crop improvement for increased rainfed production. International Rice Research Institute. Manila, Philippines.
- Spindel J, Wright M, Chen C, Cobb J, Gage J, Harrington S, et al. 2013. Bridging the genotyping gap: using genotyping by sequencing (GBS) to add high-density SNP markers and new value to traditional bi-parental mapping and breeding populations. Theor Appl Genet. 126: 2699-2716.
- Uga Y, Sugimoto K, Ogawa S, Rane J, Ishitani M, Hara N, et al. 2013. Control of root system architecture by DEEPER ROOTING 1 increases rice yield under drought conditions. Nature Genet. 45: 1097-1102.
- Wu J, Feng F, Lian X, Teng X, Wei H, Yu H, et al. 2015. Genome-wide association study (GWAS) of mesocotyl elongation based on re-sequencing approach in rice. BMC Plant Biol. 15: 218
- Wu W, Cheng S. 2014. Root genetic research, an opportunity and challenge to rice improvement. Field Crop Res. 165: 111-124.
- Xu JC, Li JZ, Zheng XW, Zou LX, Zhu LH. 2001. QTL mapping of the root traits in rice seedling. Yi Chuan Xue Bao (Acta Genetica Sinica). 28: 433-438.
- Xu JL, Lafitte HR, Gao YM, Fu BY, Torres R, Li ZK. 2005. QTLs for drought escape and tolerance identified in a set of random introgression lines of rice. Theor Appl Genet. 111: 1642-1650.
- Yang P, Chen CL, Zou GX, Peng ZQ, Wu YS, Huang YP, et al. 2015. Research progress in relevant theories of increasing breeding level of direct-seeding rice. Acta Agriculturae Jiangxi. 27: 33-35.
- Yoshida S, Hasegawa S. 1982. The rice root system: its development and function. pp. 97-114. International Rice Research Institute (ed.).Drought resistance in crops with emphasis on rice. International Rice Research Institute. Los Banos, Laguna, Philippines.
- Zhang ZH, Qu XS, Wan S, Chen LH, Zhu YG. 2004. Comparison of QTL controlling seedling vigour under different temperature conditions using recombinant inbred lines in rice (Oryza sativa). Annal Bot. 95: 423-429.
- Zhou L, Wang JK, Yi Q, Wang YZ, Zhu YG, Zhang ZH. 2007. Quantitative trait loci for seedling vigor in rice under field conditions. Field Crop Res. 100: 294-301.