

Department of Agronomy, College of Crop and Soil Sciences, Michael Okpara University of Agriculture, Umudike, Abia State, Nigeria
Copyright © 2018 The Korean Society of Breeding Science
This is an Open-Access article distributed under the terms of the Creative Commons Attribution Non-Commercial License (http://creativecommons.org/licenses/by-nc/4.0) which permits unrestricted non-commercial use, distribution, and reproduction in any medium, provided the original work is properly cited.
| Source of variance | Response variables | |||||||||
|---|---|---|---|---|---|---|---|---|---|---|
|
|
||||||||||
| Plant height (cm) | No. leaves/plant | No. Branches/plant | Shoot biomass (g) | Total dry matter/plant (g) | Number of nodules/plant | Pod weight (g) | Number of seeds/pod | Seed weight/pod (g) | Grain yield (kg/ha) | |
| 2014 | ||||||||||
| Planting date (PD) | 0.163ns | 0.181ns | 0.192ns | 0.002** | 0.081* | 0.186ns | 0.051* | 0.062* | 0.095* | 0.045* |
| Genotype (G) | < 0.001*** | < 0.001*** | 0.087* | 0.363ns | 0.753ns | < 0.001*** | < 0.001*** | < 0.001*** | < 0.001*** | < 0.001*** |
| PD × G | 0.242ns | 0.229ns | 0.165ns | 0.968ns | 0.893ns | 0.474ns | 0.165ns | 0.254ns | 0.192ns | 0.01** |
| 2015 | ||||||||||
| Planting date (PD) | 0.242ns | 0.183ns | < 0.001*** | 0.061* | 0.074* | 0.004** | 0.077* | 0.068* | 0.002** | 0.195ns |
| Genotype (G) | < 0.001*** | < 0.001*** | < 0.001*** | 0.319ns | 0.061* | 0.777ns | < 0.001*** | < 0.001*** | < 0.001*** | < 0.001*** |
| PD × G | 0.090* | 0.176ns | 0.159ns | 0.864ns | 0.323ns | 0.175ns | 0.408ns | 0.262ns | 0.192ns | 0.063* |
| Treatment | Plant height (cm) | No. leaves/plant | No. branches/plant | Plant height (cm) | No. leaves/plant | No. branches/plant |
|---|---|---|---|---|---|---|
|
|
|
|||||
| 2014 | 2015 | |||||
| Planting date (PD) | ||||||
| July | 47.40 | 35.85 | 3.80 | 100.30 | 41.20 | 3.34 |
| Aug | 74.80 | 46.61 | 3.50 | 107.60 | 41.30 | 3.17 |
| Sept | 47.00 | 40.13 | 3.81 | 99.00 | 52.30 | 4.07 |
| Mean | 56.40 | 40.86 | 3.70 | 102.30 | 44.93 | 3.53 |
| LSD(0.05) | ns | ns | ns | ns | ns | 0.3285** |
| Genotype (G) | ||||||
| IT07K-299-6 | 44.30 | 34.23 | 3.17 | 78.70 | 33.30 | 2.78 |
| IT10K-843 | 77.30 | 48.42 | 3.55 | 138.20 | 46.00 | 3.22 |
| IT11K-61-82 | 72.00 | 37.36 | 3.30 | 136.70 | 35.30 | 2.74 |
| IT10K-837-1 | 28.30 | 31.16 | 3.96 | 59.70 | 33.00 | 3.07 |
| IT10K-832-3 | 45.70 | 46.31 | 3.78 | 120.20 | 50.50 | 3.89 |
| IT10K-836-4 | 32.30 | 30.83 | 3.70 | 83.60 | 43.00 | 3.33 |
| IT08K-125-107 | 66.50 | 46.00 | 3.63 | 97.30 | 32.80 | 2.71 |
| IT04K-227-4 | 22.80 | 32.88 | 3.63 | 44.20 | 31.40 | 3.55 |
| IT10K-866-1 | 42.10 | 34.32 | 3.56 | 93.30 | 40.40 | 3.22 |
| IT10K-836-2 | 33.40 | 27.74 | 3.78 | 56.70 | 38.90 | 4.00 |
| IT07K-243-1-2 | 90.70 | 39.10 | 4.18 | 101.50 | 43.40 | 4.19 |
| IFE BPC | 91.70 | 49.75 | 3.37 | 151.20 | 67.70 | 3.59 |
| IT89KD-288 | 86.00 | 78.80 | 4.22 | 136.70 | 63.90 | 4.00 |
| IT08K-126-19 | 57.60 | 38.48 | 3.56 | 117.60 | 54.30 | 3.81 |
| IT04K-332-1 | 41.00 | 42.58 | 3.52 | 108.60 | 58.60 | 3.85 |
| IT96D-610 | 27.60 | 29.48 | 3.33 | 34.60 | 25.40 | 3.00 |
| IT07K-297-13 | 73.20 | 42.82 | 4.11 | 129.10 | 57.90 | 3.78 |
| IT97K-568-18 | 73.30 | 44.10 | 4.00 | 94.10 | 43.40 | 3.89 |
| IT06K-141 | 27.00 | 45.59 | 4.37 | 68.10 | 51.10 | 4.52 |
| IT99K-573-1-1 | 94.70 | 37.30 | 3.31 | 195.50 | 48.50 | 3.37 |
| Mean | 56.40 | 40.86 | 3.70 | 47.11 | 44.93 | 3.53 |
| LSD(0.05) | 25.06*** | 10.482*** | 0.7178* | 25.00*** | 14.17*** | 0.7828*** |
| PD × G | ns | ns | ns | 50.32* | ns | ns |
| Treatment | Shoot biomass (g) | Total dry matter/plant (g) | Number of nodules/plant | ||||||
|---|---|---|---|---|---|---|---|---|---|
|
|
|
|
|||||||
| 2014 | 2015 | Mean | 2014 | 2015 | Mean | 2014 | 2015 | Mean | |
| Planting date (PD) | |||||||||
| July | 38.30 | 29.50 | 33.90 | 4.83 | 3.14 | 3.99 | 16.07 | 4.69 | 10.38 |
| August | 69.10 | 71.00 | 70.05 | 9.41 | 9.46 | 9.44 | 15.88 | 7.76 | 11.82 |
| September | 117.90 | 119.80 | 118.85 | 12.16 | 11.14 | 11.65 | 22.91 | 3.47 | 13.19 |
| Mean | 75.10 | 73.43 | 8.8 | 7.91 | 18.29 | 5.31 | |||
| LSD(0.05) | 31.80** | 53.01* | 3.702* | 5.264* | ns | 1.860** | |||
| Genotype (G) | |||||||||
| IT07K-299-6 | 64.20 | 58.40 | 61.30 | 8.95 | 6.58 | 7.77 | 14.83 | 6.94 | 10.89 |
| IT10K-843 | 70.00 | 66.60 | 68.30 | 7.59 | 8.73 | 8.16 | 13.61 | 5.87 | 9.74 |
| IT11K-61-82 | 69.90 | 99.60 | 84.75 | 8.53 | 11.41 | 9.97 | 24.89 | 5.28 | 15.09 |
| IT10K-837-1 | 69.80 | 77.60 | 73.70 | 8.18 | 9.17 | 8.68 | 10.89 | 5.88 | 8.39 |
| IT10K-832-3 | 70.00 | 54.40 | 62.20 | 7.72 | 4.77 | 6.25 | 14.33 | 4.02 | 9.18 |
| IT10K-836-4 | 62.50 | 54.80 | 58.65 | 7.95 | 6.09 | 7.02 | 21.89 | 4.67 | 13.28 |
| IT08K-125-107 | 58.80 | 68.70 | 63.75 | 8.67 | 8.04 | 8.36 | 13.23 | 4.98 | 9.11 |
| IT04K-227-4 | 61.30 | 72.30 | 66.80 | 8.45 | 8.17 | 8.31 | 16.06 | 4.89 | 10.48 |
| IT10K-866-1 | 95.00 | 70.50 | 82.75 | 9.03 | 6.77 | 7.90 | 20.17 | 4.94 | 12.56 |
| IT10K-836-2 | 86.80 | 73.40 | 80.10 | 9.41 | 8.68 | 9.05 | 23.56 | 3.51 | 13.54 |
| IT07K-243-1-2 | 60.00 | 69.80 | 64.90 | 7.93 | 8.21 | 8.07 | 14.61 | 3.78 | 9.20 |
| IFE BPC | 65.60 | 68.00 | 66.80 | 8.09 | 7.90 | 8.00 | 20.50 | 6.25 | 13.38 |
| IT89KD-288 | 67.70 | 53.10 | 60.40 | 7.61 | 7.28 | 7.45 | 20.28 | 6.78 | 13.53 |
| IT08K-126-19 | 69.80 | 86.20 | 78.00 | 10.13 | 10.66 | 10.40 | 15.89 | 4.17 | 10.03 |
| IT04K-332-1 | 78.80 | 80.90 | 79.85 | 8.29 | 8.08 | 8.19 | 19.50 | 6.61 | 13.06 |
| IT96D-610 | 74.20 | 79.10 | 76.65 | 9.48 | 6.98 | 8.23 | 20.00 | 4.67 | 12.34 |
| IT07K-297-13 | 98.40 | 83.10 | 90.75 | 9.05 | 7.65 | 8.35 | 12.61 | 6.28 | 9.45 |
| IT97K-568-18 | 86.70 | 43.40 | 65.05 | 10.18 | 4.98 | 7.58 | 22.22 | 5.36 | 13.79 |
| IT06K-141 | 120.70 | 89.90 | 105.30 | 11.07 | 11.03 | 11.05 | 35.53 | 4.91 | 20.22 |
| IT99K-573-1-1 | 71.80 | 119.20 | 95.50 | 9.67 | 7.07 | 8.37 | 11.11 | 6.33 | 8.72 |
| Mean | 75.1 | 73.43 | 8.8 | 7.91 | 18.29 | 5.31 | |||
| LSD(0.05) | ns | ns | ns | 3.472* | 8.122*** | ns | |||
| PD × G | ns | ns | ns | ns | ns | ns | |||
| Treatments | Pod weight (g) | Number of seeds/pod | Seed weight/pod (g) | ||||||
|---|---|---|---|---|---|---|---|---|---|
|
|
|
|
|||||||
| 2014 | 2015 | Mean | 2014 | 2015 | Mean | 2014 | 2015 | Mean | |
| Planting date (PD) | |||||||||
| July | 1.92 | 2.22 | 2.07 | 9.97 | 11.39 | 10.68 | 1.56 | 1.84 | 1.70 |
| August | 2.24 | 2.37 | 2.31 | 11.22 | 12.16 | 11.69 | 1.85 | 1.95 | 1.90 |
| September | 2.10 | 2.12 | 2.11 | 11.19 | 11.16 | 11.17 | 1.76 | 1.65 | 1.71 |
| Mean | 2.087 | 2.234 | 10.79 | 11.569 | 1.72 | 1.813 | |||
| LSD(0.05) | 0.2301* | 0.1829* | 0.7203* | 0.6764* | 0.1581* | 0.1315** | |||
| Genotype (G) | |||||||||
| IT07K-299-6 | 2.17 | 2.38 | 2.27 | 11.04 | 12.41 | 11.73 | 1.75 | 1.88 | 1.81 |
| IT10K-843 | 2.10 | 2.25 | 2.18 | 12.04 | 12.09 | 12.07 | 1.71 | 1.75 | 1.73 |
| IT11K-61-82 | 2.28 | 2.64 | 2.46 | 14.20 | 15.47 | 14.84 | 1.94 | 2.16 | 2.05 |
| IT10K-837-1 | 2.27 | 2.27 | 2.27 | 9.91 | 10.66 | 10.29 | 1.95 | 1.89 | 1.92 |
| IT10K-832-3 | 2.02 | 2.18 | 2.10 | 11.84 | 12.53 | 12.19 | 1.72 | 1.78 | 1.75 |
| IT10K-836-4 | 1.96 | 2.06 | 2.01 | 9.66 | 10.32 | 9.99 | 1.63 | 1.72 | 1.68 |
| IT08K-125-107 | 2.39 | 2.40 | 2.40 | 12.18 | 12.11 | 12.15 | 1.96 | 2.00 | 1.98 |
| IT04K-227-4 | 2.05 | 2.27 | 2.16 | 11.63 | 12.71 | 12.17 | 1.68 | 1.86 | 1.77 |
| IT10K-866-1 | 1.78 | 2.17 | 1.97 | 11.58 | 12.68 | 12.13 | 1.51 | 1.73 | 1.62 |
| IT10K-836-2 | 2.10 | 2.36 | 2.23 | 9.69 | 11.06 | 10.37 | 1.70 | 1.88 | 1.79 |
| IT07K-243-1-2 | 2.10 | 2.37 | 2.23 | 10.37 | 11.33 | 10.85 | 1.73 | 1.92 | 1.82 |
| IFE BPC | 1.64 | 1.71 | 1.67 | 9.98 | 11.01 | 10.49 | 1.39 | 1.44 | 1.41 |
| IT89KD-288 | 2.13 | 2.06 | 2.10 | 10.82 | 10.82 | 10.82 | 1.78 | 1.68 | 1.73 |
| IT08K-126-19 | 2.36 | 2.28 | 2.32 | 11.62 | 11.35 | 11.48 | 1.92 | 1.78 | 1.85 |
| IT04K-332-1 | 1.96 | 2.02 | 1.99 | 10.99 | 11.17 | 11.08 | 1.65 | 1.61 | 1.63 |
| IT96D-610 | 1.74 | 1.89 | 1.81 | 9.39 | 10.88 | 10.14 | 1.38 | 1.52 | 1.45 |
| IT07K-297-13 | 2.15 | 2.31 | 2.23 | 9.29 | 11.07 | 10.18 | 1.70 | 2.01 | 1.85 |
| IT97K-568-18 | 1.84 | 1.96 | 1.90 | 10.23 | 10.96 | 10.59 | 1.56 | 1.54 | 1.55 |
| IT06K-141 | 2.19 | 2.32 | 2.26 | 8.44 | 9.34 | 8.89 | 1.79 | 1.87 | 1.83 |
| IT99K-573-1-1 | 2.51 | 2.78 | 2.65 | 10.86 | 11.40 | 11.13 | 2.06 | 2.23 | 2.15 |
| Mean | 2.087 | 2.23 | 10.79 | 11.57 | 1.72 | 1.81 | |||
| LSD(0.05) | 0.2289*** | 0.2255*** | 0.9907*** | 1.0689*** | 0.1725*** | 0.2117*** | |||
| PD × G | ns | ns | ns | ns | ns | ns | |||
| Treatments | 2014 | 2015 | ||||||
|---|---|---|---|---|---|---|---|---|
|
|
|
|||||||
| Planting date (PD) | Planting date (PD) | |||||||
| Genotype (G) | × July | Aug. | Sept. | Mean | × July | Aug. | Sept. | Mean |
| IT07K-299-6 | 265 | 1028 | 533 | 608 | 680 | 596 | 441 | 572 |
| IT10K-843 | 513 | 1150 | 838 | 833 | 438 | 350 | 337 | 375 |
| IT11K-61-82 | 779 | 909 | 1307 | 998 | 1264 | 1011 | 728 | 1001 |
| IT10K-837-1 | 629 | 637 | 900 | 722 | 407 | 421 | 437 | 422 |
| IT10K-832-3 | 495 | 1074 | 648 | 739 | 460 | 618 | 722 | 600 |
| IT10K-836-4 | 422 | 745 | 605 | 591 | 276 | 202 | 364 | 281 |
| IT08K-125-107 | 566 | 976 | 751 | 764 | 835 | 729 | 476 | 680 |
| IT04K-227-4 | 368 | 706 | 974 | 681 | 453 | 299 | 591 | 448 |
| IT10K-866-1 | 452 | 839 | 373 | 555 | 609 | 436 | 534 | 526 |
| IT10K-836-2 | 371 | 1117 | 598 | 695 | 654 | 249 | 482 | 462 |
| IT07K-243-1-2 | 507 | 1176 | 765 | 816 | 914 | 555 | 606 | 692 |
| IFE BPC | 581 | 914 | 679 | 725 | 477 | 676 | 217 | 457 |
| IT89KD-288 | 125 | 368 | 150 | 214 | 459 | 475 | 407 | 447 |
| IT08K-126-19 | 521 | 999 | 671 | 731 | 618 | 463 | 555 | 545 |
| IT04K-332-1 | 570 | 1200 | 955 | 909 | 966 | 420 | 442 | 609 |
| IT96D-610 | 675 | 1511 | 935 | 1040 | 412 | 632 | 688 | 577 |
| IT07K-297-13 | 404 | 670 | 678 | 584 | 441 | 331 | 447 | 406 |
| IT97K-568-18 | 508 | 587 | 928 | 674 | 601 | 649 | 571 | 607 |
| IT06K-141 | 497 | 1290 | 963 | 917 | 1326 | 1033 | 699 | 1019 |
| IT99K-573-1-1 | 373 | 1273 | 672 | 773 | 725 | 644 | 193 | 520 |
| Mean | 481 | 958 | 746 | 728 | 651 | 539 | 497 | 562 |
| LSD(0.05) Planting date | 334.70* | ns | ||||||
| LSD(0.05) Genotype | 207.00*** | 209.2*** | ||||||
| LSD(0.05) PD × G | 434.20** | 378.5* | ||||||
| 100 seed weight (g) | Seed weight/pod (g) | No. seeds/pod | Pod weight (g) | Days to flowering | Days to Pod filling | Days to maturity | No. branches/plant | Grain yield (kg/ha) | |
|---|---|---|---|---|---|---|---|---|---|
| 100 seed weight (g) | 1.00 | 0.441** | −0.331** | 0.445** | 0.023ns | 0.138** | 0.093ns | 0.118* | 0.019ns |
| Seed weight/pod (g) | 1.00 | 0.549** | 0.911** | 0.021ns | −0.036ns | 0.022ns | −0.074ns | 0.135* | |
| No. seeds/pod | 1.00 | 0.547** | 0.004ns | −0.189** | −0.063ns | −0.148** | 0.132* | ||
| Pod weight (g) | 1.00 | 0.032ns | −0.019ns | 0.049ns | −0.038ns | 0.128* | |||
| Days to flowering | 1.00 | −0.121* | 0.822** | −0.162** | −0.302** | ||||
| Days to pod filling | 1.00 | 0.270** | 0.117* | −0.131* | |||||
| Days to maturity | 1.00 | −0.138** | −0.332** | ||||||
| No. branches/plant | 1.00 | 0.168** | |||||||
| Grain yield (kg/ha) | 1.00 |
| Plant traits | 100 seed weight (g) | Seed weight/pod (g) | No. seeds/pod | Pod weight (g) | Days to flowering | Days to Pod filling | Days to maturity | No. branches/plant | Grain yield (kg/ha) Correlation coefficients (r2) |
|---|---|---|---|---|---|---|---|---|---|
| 100 seed weight (g) | 0.054 | 0.148 | −0.029 | −0.114 | −0.004 | −0.019 | −0.012 | 0.011 | 0.019ns |
| Seed weight/pod (g) | 0.024 | 0.336 | 0.048 | −0.233 | −0.004 | 0.005 | −0.003 | −0.007 | 0.135* |
| No. seeds/pod | −0.018 | 0.185 | 0.088 | −0.139 | −0.001 | 0.026 | 0.008 | −0.013 | 0.132* |
| Pod weight (g) | 0.024 | 0.306 | 0.048 | −0.255 | −0.006 | 0.003 | −0.006 | −0.003 | 0.128* |
| Days to flowering | 0.001 | 0.007 | 0.000 | −0.008 | −0.195 | 0.017 | −0.105 | −0.014 | −0.302** |
| Days to pod filling | 0.007 | −0.012 | −0.017 | 0.005 | 0.024 | −0.137 | −0.035 | 0.010 | −0.131* |
| Days to maturity | 0.005 | 0.007 | −0.006 | −0.012 | −0.160 | −0.037 | −0.128 | −0.012 | −0.332** |
| No. branches/plant | 0.007 | −0.025 | −0.013 | 0.010 | 0.032 | −0.016 | 0.018 | 0.089 | 0.168** |
| Residual | 0.7987 |

Cumulative rainfall days, rainfall amount, sunshine hours and mean air temperature, every two months during the growing period of the crops in sole and intercrop for 2014 and 2015 cropping seasons and the mean of 10 years of agro-meteorological data of the experimental site (Umudike, Nigeria).
| Month | 2014 | 2015 | ||||||||
|---|---|---|---|---|---|---|---|---|---|---|
|
|
| |||||||||
| Cumulative | Mean air temp. | Relative humidity 1500 hours | Cumulative | Mean air temp. | Relative humidity 1500 hours | |||||
|
|
| |||||||||
| Rainfall | Sunshine | Rainfall | Sunshine | |||||||
|
|
|
|
|
|
|
|
| |||
| Days | Amount (mm) | (Hours) | (°C) | (%) | Days | Amount (mm) | (Hours) | (°C) | (%) | |
| May–June | 28 | 531.0 | 10.7 | 30.5 | 71.5 | 36 | 593.0 | 4.4 | 33.5 | 69.5 |
| July–August | 34 | 559.1 | 5.9 | 30.5 | 78.5 | 29 | 495.4 | 5.2 | 29.6 | 80.5 |
| September–October | 34 | 570.4 | 7.0 | 31.0 | 75 | 29 | 656.2 | 6.4 | 29 | 76.0 |
| November–December | 11 | 147.4 | 9.1 | 32.7 | 56.5 | 33 | 49.7 | 12.2 | 33 | 47.0 |
| Total | 107 | 1807.9 | 32.7 | - | - | 127 | 1794.3 | 28.2 | - | - |
| Mean monthly | 13.4 | 225.99 | 4.09 | 31.2 | 70.4 | 15.9 | 224.29 | 3.5 | 31.3 | 68.25 |
Source: Agro-meteorological unit, National Root Crops Research Institute, Umudike, Nigeria.
Analysis of variance showing significance (F pr.) of the main and interaction effects of planting date (PD) and cowpea genotype (G) on the ten response measurements examined.
| Source of variance | Response variables | |||||||||
|---|---|---|---|---|---|---|---|---|---|---|
|
| ||||||||||
| Plant height (cm) | No. leaves/plant | No. Branches/plant | Shoot biomass (g) | Total dry matter/plant (g) | Number of nodules/plant | Pod weight (g) | Number of seeds/pod | Seed weight/pod (g) | Grain yield (kg/ha) | |
| 2014 | ||||||||||
| Planting date (PD) | 0.163ns | 0.181ns | 0.192ns | 0.002** | 0.081* | 0.186ns | 0.051* | 0.062* | 0.095* | 0.045* |
| Genotype (G) | < 0.001*** | < 0.001*** | 0.087* | 0.363ns | 0.753ns | < 0.001*** | < 0.001*** | < 0.001*** | < 0.001*** | < 0.001*** |
| PD × G | 0.242ns | 0.229ns | 0.165ns | 0.968ns | 0.893ns | 0.474ns | 0.165ns | 0.254ns | 0.192ns | 0.01** |
| 2015 | ||||||||||
| Planting date (PD) | 0.242ns | 0.183ns | < 0.001*** | 0.061* | 0.074* | 0.004** | 0.077* | 0.068* | 0.002** | 0.195ns |
| Genotype (G) | < 0.001*** | < 0.001*** | < 0.001*** | 0.319ns | 0.061* | 0.777ns | < 0.001*** | < 0.001*** | < 0.001*** | < 0.001*** |
| PD × G | 0.090* | 0.176ns | 0.159ns | 0.864ns | 0.323ns | 0.175ns | 0.408ns | 0.262ns | 0.192ns | 0.063* |
ns, *, ** and ***stand for not significant at the 0.05 probability level, significant at the 0.05, 0.01 and 0.001 probability level, respectively.
Effect of planting date and cowpea genotype on plant height, number of leaves/plant and number branches/plant in 2014 and 2015.
| Treatment | Plant height (cm) | No. leaves/plant | No. branches/plant | Plant height (cm) | No. leaves/plant | No. branches/plant |
|---|---|---|---|---|---|---|
|
|
| |||||
| 2014 | 2015 | |||||
| Planting date (PD) | ||||||
| July | 47.40 | 35.85 | 3.80 | 100.30 | 41.20 | 3.34 |
| Aug | 74.80 | 46.61 | 3.50 | 107.60 | 41.30 | 3.17 |
| Sept | 47.00 | 40.13 | 3.81 | 99.00 | 52.30 | 4.07 |
| Mean | 56.40 | 40.86 | 3.70 | 102.30 | 44.93 | 3.53 |
| LSD(0.05) | ns | ns | ns | ns | ns | 0.3285** |
| Genotype (G) | ||||||
| IT07K-299-6 | 44.30 | 34.23 | 3.17 | 78.70 | 33.30 | 2.78 |
| IT10K-843 | 77.30 | 48.42 | 3.55 | 138.20 | 46.00 | 3.22 |
| IT11K-61-82 | 72.00 | 37.36 | 3.30 | 136.70 | 35.30 | 2.74 |
| IT10K-837-1 | 28.30 | 31.16 | 3.96 | 59.70 | 33.00 | 3.07 |
| IT10K-832-3 | 45.70 | 46.31 | 3.78 | 120.20 | 50.50 | 3.89 |
| IT10K-836-4 | 32.30 | 30.83 | 3.70 | 83.60 | 43.00 | 3.33 |
| IT08K-125-107 | 66.50 | 46.00 | 3.63 | 97.30 | 32.80 | 2.71 |
| IT04K-227-4 | 22.80 | 32.88 | 3.63 | 44.20 | 31.40 | 3.55 |
| IT10K-866-1 | 42.10 | 34.32 | 3.56 | 93.30 | 40.40 | 3.22 |
| IT10K-836-2 | 33.40 | 27.74 | 3.78 | 56.70 | 38.90 | 4.00 |
| IT07K-243-1-2 | 90.70 | 39.10 | 4.18 | 101.50 | 43.40 | 4.19 |
| IFE BPC | 91.70 | 49.75 | 3.37 | 151.20 | 67.70 | 3.59 |
| IT89KD-288 | 86.00 | 78.80 | 4.22 | 136.70 | 63.90 | 4.00 |
| IT08K-126-19 | 57.60 | 38.48 | 3.56 | 117.60 | 54.30 | 3.81 |
| IT04K-332-1 | 41.00 | 42.58 | 3.52 | 108.60 | 58.60 | 3.85 |
| IT96D-610 | 27.60 | 29.48 | 3.33 | 34.60 | 25.40 | 3.00 |
| IT07K-297-13 | 73.20 | 42.82 | 4.11 | 129.10 | 57.90 | 3.78 |
| IT97K-568-18 | 73.30 | 44.10 | 4.00 | 94.10 | 43.40 | 3.89 |
| IT06K-141 | 27.00 | 45.59 | 4.37 | 68.10 | 51.10 | 4.52 |
| IT99K-573-1-1 | 94.70 | 37.30 | 3.31 | 195.50 | 48.50 | 3.37 |
| Mean | 56.40 | 40.86 | 3.70 | 47.11 | 44.93 | 3.53 |
| LSD(0.05) | 25.06*** | 10.482*** | 0.7178* | 25.00*** | 14.17*** | 0.7828*** |
| PD × G | ns | ns | ns | 50.32* | ns | ns |
Data analyzed with Least Squares Means and means separated with LSD.
ns, *, ** and ***stand for not significant at the 0.05 probability level, significant at the 0.05, 0.01 and 0.001 probability level, respectively.
Interaction of planting date and cowpea genotype on plant height (cm) in 2015.
| Genotype × | Planting date | |||
|---|---|---|---|---|
|
| ||||
| July | August | September | Mean | |
| IT07K-299-6 | 87.10 | 75.30 | 73.90 | 78.70 |
| IT10K-843 | 124.80 | 126.70 | 163.10 | 138.20 |
| IT11K-61-82 | 140.20 | 142.00 | 128.00 | 136.70 |
| IT10K-837-1 | 19.70 | 96.80 | 62.70 | 59.70 |
| IT10K-832-3 | 143.80 | 143.90 | 72.90 | 120.20 |
| IT10K-836-4 | 94.50 | 84.10 | 72.10 | 83.60 |
| IT08K-125-107 | 97.50 | 128.80 | 65.50 | 97.30 |
| IT04K-227-4 | 46.70 | 54.50 | 31.40 | 44.20 |
| IT10K-866-1 | 121.70 | 79.70 | 78.40 | 93.30 |
| IT10K-836-2 | 54.50 | 60.30 | 55.30 | 56.70 |
| IT07K-243-1-2 | 78.60 | 116.90 | 109.10 | 101.50 |
| IFE BPC | 150.10 | 175.30 | 128.10 | 151.20 |
| IT89KD-288 | 137.60 | 129.60 | 143.00 | 136.70 |
| IT08K-126-19 | 112.20 | 101.20 | 139.40 | 117.60 |
| IT04K-332-1 | 105.40 | 103.10 | 117.40 | 108.60 |
| IT96D-610 | 37.90 | 36.90 | 28.90 | 34.60 |
| IT07K-297-13 | 123.20 | 130.10 | 134.00 | 129.10 |
| IT97K-568-18 | 107.70 | 83.10 | 91.60 | 94.10 |
| IT06K-141 | 57.00 | 71.20 | 76.10 | 68.10 |
| IT99K-573-1-1 | 165.40 | 212.00 | 209.20 | 195.50 |
| Mean | 100.30 | 107.60 | 99.00 | |
| LSD(0.05) | 50.32* | |||
Data in interaction analyzed with Least Squares Means and means separated with LSD (P < 0.05).
Effect of planting date and cowpea genotype on shoot biomass, total dry matter/plant and number of nodules/plant in 2014 and 2015.
| Treatment | Shoot biomass (g) | Total dry matter/plant (g) | Number of nodules/plant | ||||||
|---|---|---|---|---|---|---|---|---|---|
|
|
|
| |||||||
| 2014 | 2015 | Mean | 2014 | 2015 | Mean | 2014 | 2015 | Mean | |
| Planting date (PD) | |||||||||
| July | 38.30 | 29.50 | 33.90 | 4.83 | 3.14 | 3.99 | 16.07 | 4.69 | 10.38 |
| August | 69.10 | 71.00 | 70.05 | 9.41 | 9.46 | 9.44 | 15.88 | 7.76 | 11.82 |
| September | 117.90 | 119.80 | 118.85 | 12.16 | 11.14 | 11.65 | 22.91 | 3.47 | 13.19 |
| Mean | 75.10 | 73.43 | 8.8 | 7.91 | 18.29 | 5.31 | |||
| LSD(0.05) | 31.80** | 53.01* | 3.702* | 5.264* | ns | 1.860** | |||
| Genotype (G) | |||||||||
| IT07K-299-6 | 64.20 | 58.40 | 61.30 | 8.95 | 6.58 | 7.77 | 14.83 | 6.94 | 10.89 |
| IT10K-843 | 70.00 | 66.60 | 68.30 | 7.59 | 8.73 | 8.16 | 13.61 | 5.87 | 9.74 |
| IT11K-61-82 | 69.90 | 99.60 | 84.75 | 8.53 | 11.41 | 9.97 | 24.89 | 5.28 | 15.09 |
| IT10K-837-1 | 69.80 | 77.60 | 73.70 | 8.18 | 9.17 | 8.68 | 10.89 | 5.88 | 8.39 |
| IT10K-832-3 | 70.00 | 54.40 | 62.20 | 7.72 | 4.77 | 6.25 | 14.33 | 4.02 | 9.18 |
| IT10K-836-4 | 62.50 | 54.80 | 58.65 | 7.95 | 6.09 | 7.02 | 21.89 | 4.67 | 13.28 |
| IT08K-125-107 | 58.80 | 68.70 | 63.75 | 8.67 | 8.04 | 8.36 | 13.23 | 4.98 | 9.11 |
| IT04K-227-4 | 61.30 | 72.30 | 66.80 | 8.45 | 8.17 | 8.31 | 16.06 | 4.89 | 10.48 |
| IT10K-866-1 | 95.00 | 70.50 | 82.75 | 9.03 | 6.77 | 7.90 | 20.17 | 4.94 | 12.56 |
| IT10K-836-2 | 86.80 | 73.40 | 80.10 | 9.41 | 8.68 | 9.05 | 23.56 | 3.51 | 13.54 |
| IT07K-243-1-2 | 60.00 | 69.80 | 64.90 | 7.93 | 8.21 | 8.07 | 14.61 | 3.78 | 9.20 |
| IFE BPC | 65.60 | 68.00 | 66.80 | 8.09 | 7.90 | 8.00 | 20.50 | 6.25 | 13.38 |
| IT89KD-288 | 67.70 | 53.10 | 60.40 | 7.61 | 7.28 | 7.45 | 20.28 | 6.78 | 13.53 |
| IT08K-126-19 | 69.80 | 86.20 | 78.00 | 10.13 | 10.66 | 10.40 | 15.89 | 4.17 | 10.03 |
| IT04K-332-1 | 78.80 | 80.90 | 79.85 | 8.29 | 8.08 | 8.19 | 19.50 | 6.61 | 13.06 |
| IT96D-610 | 74.20 | 79.10 | 76.65 | 9.48 | 6.98 | 8.23 | 20.00 | 4.67 | 12.34 |
| IT07K-297-13 | 98.40 | 83.10 | 90.75 | 9.05 | 7.65 | 8.35 | 12.61 | 6.28 | 9.45 |
| IT97K-568-18 | 86.70 | 43.40 | 65.05 | 10.18 | 4.98 | 7.58 | 22.22 | 5.36 | 13.79 |
| IT06K-141 | 120.70 | 89.90 | 105.30 | 11.07 | 11.03 | 11.05 | 35.53 | 4.91 | 20.22 |
| IT99K-573-1-1 | 71.80 | 119.20 | 95.50 | 9.67 | 7.07 | 8.37 | 11.11 | 6.33 | 8.72 |
| Mean | 75.1 | 73.43 | 8.8 | 7.91 | 18.29 | 5.31 | |||
| LSD(0.05) | ns | ns | ns | 3.472* | 8.122*** | ns | |||
| PD × G | ns | ns | ns | ns | ns | ns | |||
Data analyzed with Least Squares Means and means separated with LSD.
ns, *, ** and ***stand for not significant at the 0.05 probability level, significant at the 0.05, 0.01 and 0.001 probability level, respectively.
Effect of planting date and cowpea genotype on pod weight, number of seeds/pod and seed weight/pod in 2014 and 2015.
| Treatments | Pod weight (g) | Number of seeds/pod | Seed weight/pod (g) | ||||||
|---|---|---|---|---|---|---|---|---|---|
|
|
|
| |||||||
| 2014 | 2015 | Mean | 2014 | 2015 | Mean | 2014 | 2015 | Mean | |
| Planting date (PD) | |||||||||
| July | 1.92 | 2.22 | 2.07 | 9.97 | 11.39 | 10.68 | 1.56 | 1.84 | 1.70 |
| August | 2.24 | 2.37 | 2.31 | 11.22 | 12.16 | 11.69 | 1.85 | 1.95 | 1.90 |
| September | 2.10 | 2.12 | 2.11 | 11.19 | 11.16 | 11.17 | 1.76 | 1.65 | 1.71 |
| Mean | 2.087 | 2.234 | 10.79 | 11.569 | 1.72 | 1.813 | |||
| LSD(0.05) | 0.2301* | 0.1829* | 0.7203* | 0.6764* | 0.1581* | 0.1315** | |||
| Genotype (G) | |||||||||
| IT07K-299-6 | 2.17 | 2.38 | 2.27 | 11.04 | 12.41 | 11.73 | 1.75 | 1.88 | 1.81 |
| IT10K-843 | 2.10 | 2.25 | 2.18 | 12.04 | 12.09 | 12.07 | 1.71 | 1.75 | 1.73 |
| IT11K-61-82 | 2.28 | 2.64 | 2.46 | 14.20 | 15.47 | 14.84 | 1.94 | 2.16 | 2.05 |
| IT10K-837-1 | 2.27 | 2.27 | 2.27 | 9.91 | 10.66 | 10.29 | 1.95 | 1.89 | 1.92 |
| IT10K-832-3 | 2.02 | 2.18 | 2.10 | 11.84 | 12.53 | 12.19 | 1.72 | 1.78 | 1.75 |
| IT10K-836-4 | 1.96 | 2.06 | 2.01 | 9.66 | 10.32 | 9.99 | 1.63 | 1.72 | 1.68 |
| IT08K-125-107 | 2.39 | 2.40 | 2.40 | 12.18 | 12.11 | 12.15 | 1.96 | 2.00 | 1.98 |
| IT04K-227-4 | 2.05 | 2.27 | 2.16 | 11.63 | 12.71 | 12.17 | 1.68 | 1.86 | 1.77 |
| IT10K-866-1 | 1.78 | 2.17 | 1.97 | 11.58 | 12.68 | 12.13 | 1.51 | 1.73 | 1.62 |
| IT10K-836-2 | 2.10 | 2.36 | 2.23 | 9.69 | 11.06 | 10.37 | 1.70 | 1.88 | 1.79 |
| IT07K-243-1-2 | 2.10 | 2.37 | 2.23 | 10.37 | 11.33 | 10.85 | 1.73 | 1.92 | 1.82 |
| IFE BPC | 1.64 | 1.71 | 1.67 | 9.98 | 11.01 | 10.49 | 1.39 | 1.44 | 1.41 |
| IT89KD-288 | 2.13 | 2.06 | 2.10 | 10.82 | 10.82 | 10.82 | 1.78 | 1.68 | 1.73 |
| IT08K-126-19 | 2.36 | 2.28 | 2.32 | 11.62 | 11.35 | 11.48 | 1.92 | 1.78 | 1.85 |
| IT04K-332-1 | 1.96 | 2.02 | 1.99 | 10.99 | 11.17 | 11.08 | 1.65 | 1.61 | 1.63 |
| IT96D-610 | 1.74 | 1.89 | 1.81 | 9.39 | 10.88 | 10.14 | 1.38 | 1.52 | 1.45 |
| IT07K-297-13 | 2.15 | 2.31 | 2.23 | 9.29 | 11.07 | 10.18 | 1.70 | 2.01 | 1.85 |
| IT97K-568-18 | 1.84 | 1.96 | 1.90 | 10.23 | 10.96 | 10.59 | 1.56 | 1.54 | 1.55 |
| IT06K-141 | 2.19 | 2.32 | 2.26 | 8.44 | 9.34 | 8.89 | 1.79 | 1.87 | 1.83 |
| IT99K-573-1-1 | 2.51 | 2.78 | 2.65 | 10.86 | 11.40 | 11.13 | 2.06 | 2.23 | 2.15 |
| Mean | 2.087 | 2.23 | 10.79 | 11.57 | 1.72 | 1.81 | |||
| LSD(0.05) | 0.2289*** | 0.2255*** | 0.9907*** | 1.0689*** | 0.1725*** | 0.2117*** | |||
| PD × G | ns | ns | ns | ns | ns | ns | |||
Data analyzed with Least Squares Means and means separated with LSD.
ns, *, ** and ***stand for not significant at the 0.05 probability level, significant at the 0.05, 0.01 and 0.001 probability level, respectively.
Interaction of planting date and cowpea genotype on grain yield (kg/ha) in 2014 and 2015.
| Treatments | 2014 | 2015 | ||||||
|---|---|---|---|---|---|---|---|---|
|
|
| |||||||
| Planting date (PD) | Planting date (PD) | |||||||
| Genotype (G) | × July | Aug. | Sept. | Mean | × July | Aug. | Sept. | Mean |
| IT07K-299-6 | 265 | 1028 | 533 | 608 | 680 | 596 | 441 | 572 |
| IT10K-843 | 513 | 1150 | 838 | 833 | 438 | 350 | 337 | 375 |
| IT11K-61-82 | 779 | 909 | 1307 | 998 | 1264 | 1011 | 728 | 1001 |
| IT10K-837-1 | 629 | 637 | 900 | 722 | 407 | 421 | 437 | 422 |
| IT10K-832-3 | 495 | 1074 | 648 | 739 | 460 | 618 | 722 | 600 |
| IT10K-836-4 | 422 | 745 | 605 | 591 | 276 | 202 | 364 | 281 |
| IT08K-125-107 | 566 | 976 | 751 | 764 | 835 | 729 | 476 | 680 |
| IT04K-227-4 | 368 | 706 | 974 | 681 | 453 | 299 | 591 | 448 |
| IT10K-866-1 | 452 | 839 | 373 | 555 | 609 | 436 | 534 | 526 |
| IT10K-836-2 | 371 | 1117 | 598 | 695 | 654 | 249 | 482 | 462 |
| IT07K-243-1-2 | 507 | 1176 | 765 | 816 | 914 | 555 | 606 | 692 |
| IFE BPC | 581 | 914 | 679 | 725 | 477 | 676 | 217 | 457 |
| IT89KD-288 | 125 | 368 | 150 | 214 | 459 | 475 | 407 | 447 |
| IT08K-126-19 | 521 | 999 | 671 | 731 | 618 | 463 | 555 | 545 |
| IT04K-332-1 | 570 | 1200 | 955 | 909 | 966 | 420 | 442 | 609 |
| IT96D-610 | 675 | 1511 | 935 | 1040 | 412 | 632 | 688 | 577 |
| IT07K-297-13 | 404 | 670 | 678 | 584 | 441 | 331 | 447 | 406 |
| IT97K-568-18 | 508 | 587 | 928 | 674 | 601 | 649 | 571 | 607 |
| IT06K-141 | 497 | 1290 | 963 | 917 | 1326 | 1033 | 699 | 1019 |
| IT99K-573-1-1 | 373 | 1273 | 672 | 773 | 725 | 644 | 193 | 520 |
| Mean | 481 | 958 | 746 | 728 | 651 | 539 | 497 | 562 |
| LSD(0.05) Planting date | 334.70* | ns | ||||||
| LSD(0.05) Genotype | 207.00*** | 209.2*** | ||||||
| LSD(0.05) PD × G | 434.20** | 378.5* | ||||||
Data analyzed with Least Squares Means and means separated with LSD.
ns, *, ** and ***stand for not significant at the 0.05 probability level, significant at the 0.05, 0.01 and 0.001 probability level, respectively.
Averaged over two cropping years linear correlation matrix between agronomic attributes and grain yield of cowpea.
| 100 seed weight (g) | Seed weight/pod (g) | No. seeds/pod | Pod weight (g) | Days to flowering | Days to Pod filling | Days to maturity | No. branches/plant | Grain yield (kg/ha) | |
|---|---|---|---|---|---|---|---|---|---|
| 100 seed weight (g) | 1.00 | 0.441** | −0.331** | 0.445** | 0.023ns | 0.138** | 0.093ns | 0.118* | 0.019ns |
| Seed weight/pod (g) | 1.00 | 0.549** | 0.911** | 0.021ns | −0.036ns | 0.022ns | −0.074ns | 0.135* | |
| No. seeds/pod | 1.00 | 0.547** | 0.004ns | −0.189** | −0.063ns | −0.148** | 0.132* | ||
| Pod weight (g) | 1.00 | 0.032ns | −0.019ns | 0.049ns | −0.038ns | 0.128* | |||
| Days to flowering | 1.00 | −0.121* | 0.822** | −0.162** | −0.302** | ||||
| Days to pod filling | 1.00 | 0.270** | 0.117* | −0.131* | |||||
| Days to maturity | 1.00 | −0.138** | −0.332** | ||||||
| No. branches/plant | 1.00 | 0.168** | |||||||
| Grain yield (kg/ha) | 1.00 |
ns, *, ** and ***stand for not significant at the 0.05 probability level, significant at the 0.05, 0.01 and 0.001 probability level, respectively.
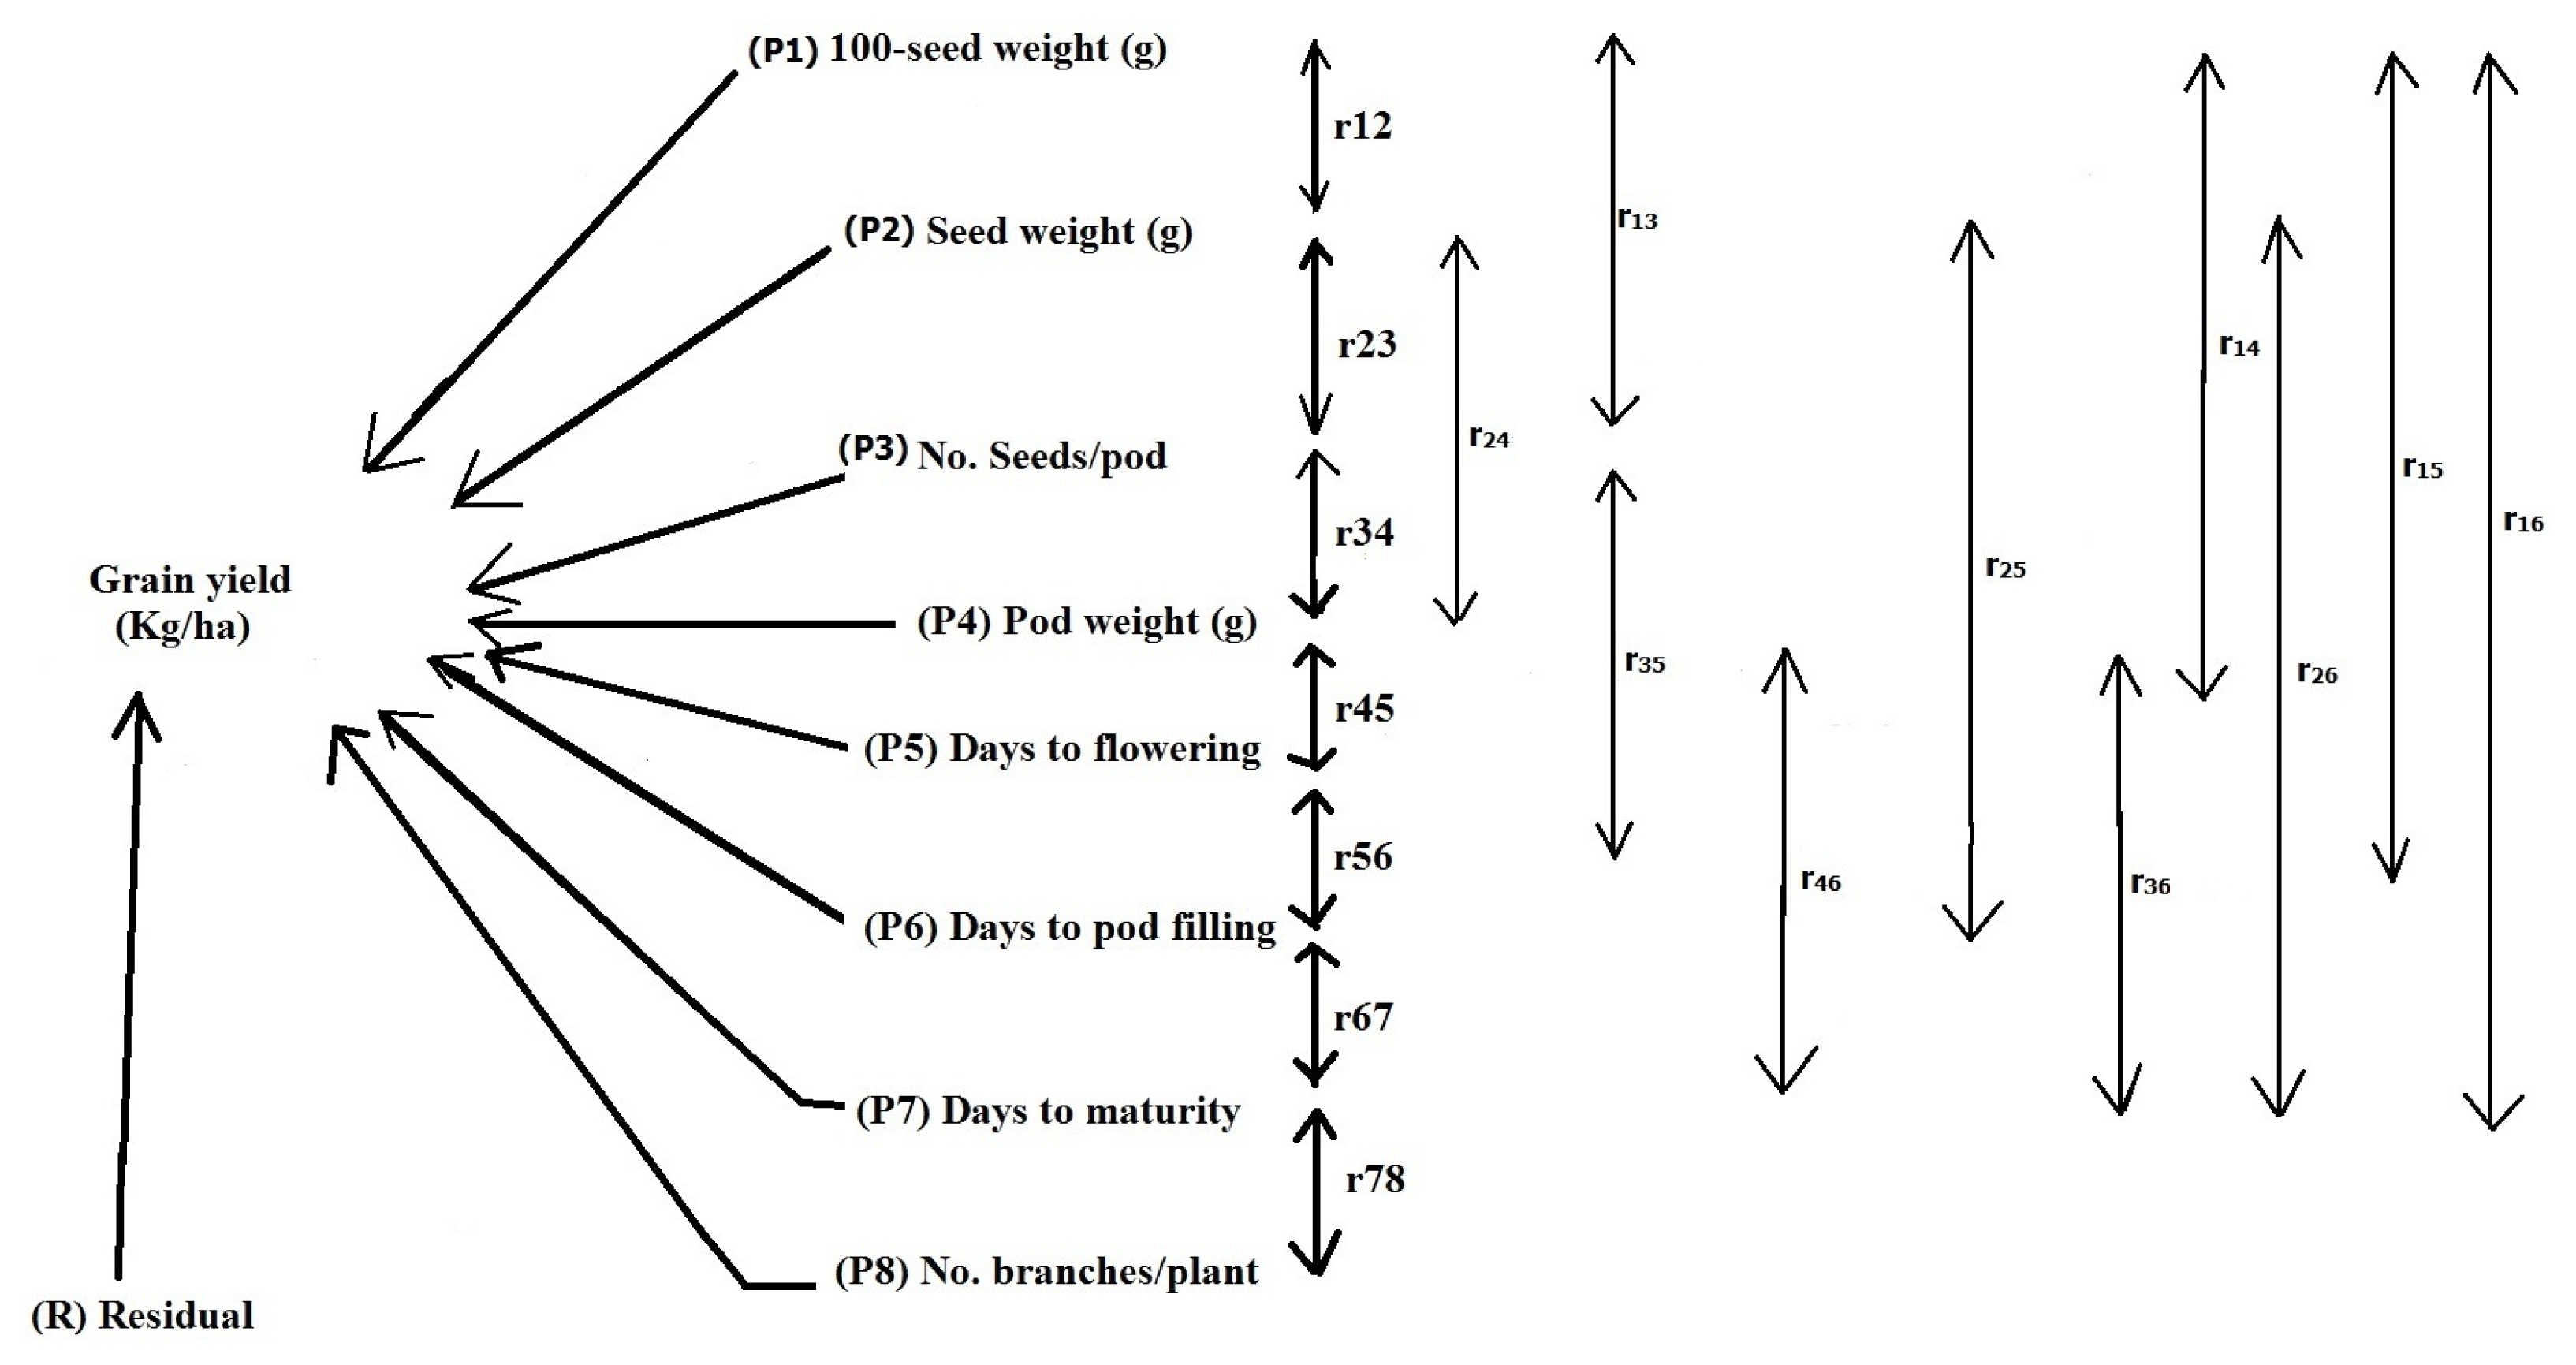
Path coefficients analysis of eight variables of cowpea averaged over two cropping years showing direct (diagonal) and indirect (off-diagonal) effects through the specific paths of plant traits on grain yield (kg/ha) of cowpea genotypes.
| Plant traits | 100 seed weight (g) | Seed weight/pod (g) | No. seeds/pod | Pod weight (g) | Days to flowering | Days to Pod filling | Days to maturity | No. branches/plant | Grain yield (kg/ha) Correlation coefficients (r2) |
|---|---|---|---|---|---|---|---|---|---|
| 100 seed weight (g) | 0.054 | 0.148 | −0.029 | −0.114 | −0.004 | −0.019 | −0.012 | 0.011 | 0.019ns |
| Seed weight/pod (g) | 0.024 | 0.336 | 0.048 | −0.233 | −0.004 | 0.005 | −0.003 | −0.007 | 0.135* |
| No. seeds/pod | −0.018 | 0.185 | 0.088 | −0.139 | −0.001 | 0.026 | 0.008 | −0.013 | 0.132* |
| Pod weight (g) | 0.024 | 0.306 | 0.048 | −0.255 | −0.006 | 0.003 | −0.006 | −0.003 | 0.128* |
| Days to flowering | 0.001 | 0.007 | 0.000 | −0.008 | −0.195 | 0.017 | −0.105 | −0.014 | −0.302** |
| Days to pod filling | 0.007 | −0.012 | −0.017 | 0.005 | 0.024 | −0.137 | −0.035 | 0.010 | −0.131* |
| Days to maturity | 0.005 | 0.007 | −0.006 | −0.012 | −0.160 | −0.037 | −0.128 | −0.012 | −0.332** |
| No. branches/plant | 0.007 | −0.025 | −0.013 | 0.010 | 0.032 | −0.016 | 0.018 | 0.089 | 0.168** |
| Residual | 0.7987 |
ns, *, ** and ***stand for not significant at the 0.05 probability level, significant at the 0.05, 0.01 and 0.001 probability level, respectively.
Source: Agro-meteorological unit, National Root Crops Research Institute, Umudike, Nigeria.
stand for not significant at the 0.05 probability level, significant at the 0.05, 0.01 and 0.001 probability level, respectively.
Data analyzed with Least Squares Means and means separated with LSD.
stand for not significant at the 0.05 probability level, significant at the 0.05, 0.01 and 0.001 probability level, respectively.
Data in interaction analyzed with Least Squares Means and means separated with LSD (P < 0.05).
Data analyzed with Least Squares Means and means separated with LSD.
stand for not significant at the 0.05 probability level, significant at the 0.05, 0.01 and 0.001 probability level, respectively.
Data analyzed with Least Squares Means and means separated with LSD.
stand for not significant at the 0.05 probability level, significant at the 0.05, 0.01 and 0.001 probability level, respectively.
Data analyzed with Least Squares Means and means separated with LSD.
stand for not significant at the 0.05 probability level, significant at the 0.05, 0.01 and 0.001 probability level, respectively.
stand for not significant at the 0.05 probability level, significant at the 0.05, 0.01 and 0.001 probability level, respectively.
stand for not significant at the 0.05 probability level, significant at the 0.05, 0.01 and 0.001 probability level, respectively.
