Abstract
Supplying sufficient rice to growing populations is a global challenge. Hybrid indica rice varieties exploiting heterosis have increased yields, but inter-subspecific crosses between indica and japonica varieties are hampered by sterility. Examination and genetic understanding of yield heterosis in indica/japonica crosses addressing yield barriers are basic requirements. In this study, QTLs for heterosis of yield traits were identified in indica-japonica recombinant inbred lines (RILs) using a total of 178 RILs originating from Dasanbyeo (indica) × TR22183 (japonica) (DT-RILs) and their backcrossed populations. Nine of sixty-six major quantitative trait loci (QTLs) identified in DT-RILs exhibited heterosis. Heterosis QTLs clustered with other traits on chromosomes 1, 4, and 8, and clusters were conserved between different RILs. The clusters contained several known yield enhancement genes/QTLs. Specific heterotic allele combinations contributed to four major heterosis QTLs, particularly for panicle and spikelet number traits. Heterosis for yield and yield-related traits was explained by the harmonized effects of overdominance, dominance, and epistatic interactions in inter-subspecific breeding populations.
-
Key words: Rice, Heterosis, Yield, QTL
INTRODUCTION
Rice is one of the most important staple foods worldwide. Yearly global rice consumption is estimated to reach 500 million tonnes by 2050 (
Abdullah et al. 2008). Arable land area per capita has declined substantially in recent decades, from 0.37 ha in 1961 to 0.196 ha in 2014 (
http://data.worldbank.org/indicator/%20AG.LND.ARBL.HA.PC), and supplying sufficient food to a growing population is a major challenge for future human development. Utilization of high yield potential traits will be needed to facilitate the development of high yield rice production systems to overcome the global rice deficit. One of the most effective approaches was used in China, where hybrid rice programs utilizing heterosis contributed to increased yields of up to 13.5 tonnes/ha in 2012 (
FAORAP and APSA 2014).
Heterosis, also known as hybrid vigor, is observed in plants, animals, and fungi and is characterized by the superior phenotypic performance of a hybrid compared with its parents. Hybrid vigor is observed in a range of environmental conditions, and phenotypic performance is stably observed. Despite substantial research on heterosis, the genetic underpinnings of the phenomenon are not yet fully understood. Dominance, overdominance, and epistasis (or digenic interactions) are three major genetic components involved in heterosis (
Li et al. 2001;
Luo et al. 2001;
Li et al. 2008;
Shen et al. 2014). Dominance and overdominance are interactions of different alleles at the same locus, and epistasis describes interactions between different loci.
Currently available commercial rice hybrids utilizing heterosis optimize the yield potential of crosses between
indica varieties. Several recent studies investigated the potential of
indica-japonica hybrids (
Chin et al. 2011;
Xin et al. 2011;
Chu et al. 2012;
Dan et al. 2014); however, severe hybrid sterility was observed, creating a major barrier to developing super high-yielding hybrid rice (
Chu et al. 2012;
Dan et al. 2014). The relationship between hybrid sterility and heterosis is unclear, but yield decreases in F
1 plants of inter-subspecific crosses were attributed to severely low seed set. A method of yield adjustment, namely, presupposition yield, was suggested as a means of experimentally minimizing the effect of hybrid sterility (
Chu et al. 2012).
Broad-sense heritability of yield-related traits was 21.47–79.85% for seven yield-related traits of testcross populations derived from
indica-japonica chromosome segment substitution lines (
Tao et al. 2016). The contribution of additive effects (narrow sense heritability) to heterosis was particularly large for grain yield and thousand grain weight (TGW). Dominant effects for spikelet and panicle number also had a major impact on heterosis.
In this study, two recombinant inbred lines (RILs) derived from indica (Korean Tongil type) / japonica crosses were used to investigate the genetic contributions of dominance, overdominance, and epistasis to yield and yield-related traits. Major quantitative trait loci (MQTLs) and EpQTLs (epistatic QTLs or digenic interactions) were identified for each RIL. Comparisons of QTLs/genes in two RILs allowed identification of putative heterosis QTL hotspots. MQTL analysis used average values for the three heterotic allele types (AiAi/AiAj, AiAj/AiAi, and AiAj/AiAj) present in a BC1F1 population. The genetic effects of each allele type were then analyzed separately to understand which heterotic allele types were the major contributors to yield and yield-related traits. Lastly, the direct effects of yield-related traits on yield heterosis QTLs were determined.
MATERIALS AND METHODS
Plant materials
A total of 179 F
8 RILs derived using the single-seed descendant method from a cross between Dasanbyeo (Tongil type,
indica) and TR22183 (temperate
japonica) developed by Seoul National University in Korea (DT-RILs) were used in this study (
Chin et al. 2011;
Jiang et al. 2011). Each RIL was crossed with Dasanbyeo as the female parent, and 178 BC
1F
1 lines (except for line 40) were produced (BC
1F
1 line). F
1 plants of Dasanbyeo and TR22183 were generated and cultivated alongside the BC
1F
1 line to allow identification of specific heterosis traits.
All plant materials were grown at Seoul National University Experimental Farm. Field preparation and crop cultivation were as described previously (
Chu et al. 2012). Nine traits were measured and scored: culm length (CL, cm), days to heading (DTH, days), panicle number per plant (PN), panicle length (PL, cm), spikelet number per panicle (SN), spikelet fertility (SF, %), TGW (g), grain yield per plant (GYP), and presupposition yield per plant (PYP). Of these, PN, SN, SF, and TGW were regarded as yield-component traits. To remove the effect of hybrid sterility, PYP was estimated and applied where substantial hybrid sterility was observed in BC
1F
1 lines (
Chu et al. 2012). PYP was calculated if the specific BC
1F
1 line exhibited fertility <90%. As SF had a proportional effect on GYP, an adjustment for grain yield value was used (
Supplementary Fig. S1). The equation used was PYP = GYP × 90 / SF. Phenotyping results of RILs and BC
1F
1s and calculated mid-parent heterosis (MPH) values are described as the ‘RIL’, ‘BCF1’, and ‘MPH’ datasets, respectively.
Genomic DNA was extracted from 2 cm fresh leaves from seedlings at the three-leaf stage using cetyl-trimethylammonium-bromide (CTAB) as previously described (
Rogers and Bendich 1988). Across the 12 chromosomes, 162 SSR and subspecies-specific STS markers (
Chin et al. 2007) that showed polymorphisms between Dasanbyeo and TR22183 were used to construct a linkage map with JoinMap version 3.0 software (
Stam 1993). Only markers with LOD scores >3.0 were used.
MPH values were calculated for each RIL using the following equation, as given in
Chu et al. (2012): (value of MPH) = (average value of the corresponding BC
1F
1) – (average value of RIL and Dasanbyeo). All datasets were analyzed using QTLmapper version 1.6 for the identification of MQTLs and QTLmapper version 2.0 for EpQTLs (
Wang et al. 1999). For MQTL analysis, interval mapping using a mixed model approach was applied. For EpQTLs (digenic interactions), only significant two-locus interactions below
P < 0.001 were used for further analysis.
Raw genotyping and phenotyping data from another set of
indica-japonica RILs, MT-RILs (Milyang 23 × Tong 88-7) (
Chu et al. 2012), were re-analyzed using the same software and options to allow comparative analysis with DT-RILs.
The genetic components of heterosis were suggested to be overdominance, dominance, and epistasis (
Li et al. 2008). Different types of dominance (overdominance, partial-to-complete dominance, and underdominance) can be determined by estimating additive effect (a) and dominance effect (d) in RIL and MPH datasets, respectively (
Supplementary Fig. S1). Theoretically, sum of dominance and additive effects (a + d) estimated from hetero alleles of linked loci can act as another indicator of heterosis QTLs in the BCF1 dataset. The QTLs detected in both the BCF1 and MPH datasets were regarded as candidates for heterosis QTLs. QTLs detected only in RILs and/or the BC
1F
1 population were classified as additive QTLs (‘A’ type). Dominant QTLs (‘D’ type) and overdominant QTLs (‘OD’ type) were determined using the values of d/a and a + d. QTLs with 0 < d/a < 1 or (a + d) ≥ 2d were designated as ‘D’ type QTLs. QTLs with d/a > 1, or 2d > a + d, or those detected only in MPH datasets, were designated as ‘OD’ type QTLs (
Mei et al. 2005;
Chu et al. 2012). QTLs detected in MPH datasets but showing negative ‘d’ values were defined as underdominance QTLs (‘UD’ type). Of the detected QTLs, only ‘D’, ‘OD’, and ‘UD’ type QTLs were used for subsequent comparative studies and direct effect analysis.
The allele types that contributed to heterosis in the three heterotic combinations (homo/hetero, hetero/homo, and hetero/hetero) were identified for MQTLs for GYP and PYP. The additive values of yield and yield-related traits (PN, SN, SF, and TGW) of the three heterotic allele types in BC1F1 populations were calculated and compared. All statistical analyses were conducted using Minitab version 14.
Comparative mapping study and direct effect analysis
Re-analyzed QTL results and the map of MT-RILs reported by
Chu et al. (2012) were compared with those of DT-RILs. Primer sequences of linked markers for all the identified heterosis QTLs were searched using GRAMENE Blast tools (
http://ensembl.gramene.org, December 15, 2015) to identify their physical positions in the Nipponbare genome. QTLs anchored in those regions were compared with the heterosis QTLs from this study using the QTARO database (
http://qtaro.abr.affrc.go.jp/).
SPSS-AMOS version 21 was used to estimate the standardized direct and indirect effects of yield-related traits (PN, SN, SF, and TGW). The contribution fractions of MQTLs and EpQTLs for each trait were calculated and analyzed together with the standardized direct effects of the yield-related trait components. For each GYP and PYP QTL in two RILs, the traits with the strongest positive effects were proposed if the standardized direct effect value was >0.5.
RESULTS
Trait performance with respect to yield and yield-related traits
Significant differences were observed between Dasanbyeo (P1) and TR22183 (P2) for four traits (DTH, CL, PN, and SN), with no significant differences seen for the remaining traits (PL, SF, TGW, GYP, and PYP) (
Table 1). TR22183 exhibited earlier heading (88 days after transplanting) than Dasanbyeo but maintained the same productivity. Values of CL, PL, SN, TGW, GYP, and PYP were significantly elevated in F
1 plants, but very low fertility was observed. In DT-RILs, transgressive segregation was observed in CL, PL, SN, SF, TGW, GYP, and PYP. With the exception of PN and SF, the trait value distributions differed between the BC
1F
1 and RIL populations (
Fig. 1). The median panicle trait values were smaller for BC
1F
1 than for F
1 plants in SN, PL, TGW, and PYP. After fertility recovery by backcrossing, median SF and GYP values were larger in BC
1F
1 than in F
1 plants.
A total of 66 QTLs (15 QTLs for yield traits and 51 QTLs for the other traits) were identified in the RIL, BCF1, or MPH datasets for the traits used in this study (
Table 2). Of these, 19 and 14 QTLs were identified in the BCF1 and MPH datasets, respectively.
Eight QTLs in RIL, four QTLs in BCF1, and one QTL in MPH explained 81.4%, 36.4%, and 21.6% of total variance, respectively. No common QTLs were identified across all datasets, but two QTLs of BCF1 (qCL1.5 and qCL4.3) were adjacent to RIL QTLs (qCL1.4 and qCL4.2). One overdominance (‘OD’ type) QTL, which had the effect of extending CL by 2.11 cm, was detected on chromosome 9 (qCL9.1). All other QTLs were classified as additive (‘A’ type) QTLs.
Days to heading (DTH)
Four QTLs in RIL and one QTL in BCF1 explained 42.3% and 12.4% of total variance, respectively. No QTLs showing the effects of heterotic alleles were identified.
Panicle number per plant (PN)
Three QTLs in RIL and one QTL in BCF1 explained 23.5% and 16.3% of total variance, respectively. No heterosis QTLs were identified for this trait.
Panicle length (PL)
Three QTLs in RIL, two QTLs in BCF1, and two QTLs in MPH were responsible for 59.1%, 16.4%, and 24.8% of total variance, respectively. Two heterosis QTLs were identified in MPH. One dominance (‘D’ type) QTL with relatively large additive (36.8% phenotypic variance explained; PVE) and dominance effects (15.4% PVE) was identified in RIL on chromosome 8 (qPL8.1). Another overdominance QTL (qPL4.1), which had a smaller dominance effect (9.4% PVE) than qPL8.1, was identified in MPH.
Spikelet number per panicle (SN)
Five QTLs in RIL, two QTLs in BCF1, and one QTL in MPH explained 43.9%, 17.9%, and 10.2% of total phenotypic variance, respectively. One overdominance heterosis QTL (qSN9.1), which resulted in a 6.2% increase in SN, was identified on chromosome 9 in MPH.
Spikelet fertility (SF)
Two QTLs in RIL and two QTLs in BCF1 were responsible for 13.7% and 27.6% of total phenotypic variance, respectively. For SF, examination of hybrid sterility in BCF1 is more meaningful than consideration of heterosis QTL. Two QTLs in BCF1 (qSF4.1 and qSF6.1) contributed to 7.86% and 19.69% reductions in SF, respectively.
Thousand grain weight (TGW)
Eight QTLs in RIL, two QTLs in BCF1, and six QTLs in MPH explained 50.4%, 22.4%, and 43.9% of total phenotypic variance, respectively. Three overdominance heterosis QTLs (qTGW3.3, qTGW4.1, and qTGW10.1) and two dominance heterosis QTLs (qTGW1.1 and qTGW7.1) were identified. One underdominance QTL (qTGW4.2) with a negative dominance effect (−0.41) was identified on chromosome 4, adjacent to qSF4.1. Excepting qTGW4.2, the total PVE of the five heterosis QTLs was 41.7%.
Grain yield per plant (GYP)
Three QTLs in RIL, three QTLs in BCF1, and one QTL in MPH were responsible for 30.7%, 34.4%, and 16.0% of total phenotypic variance, respectively. No heterosis QTLs were identified for GYP in DT-RIL. One identified QTL on chromosome 5 (qGYP5.1) showed a negative dominance effect (−2.72%).
Presupposition yield per plant (PYP)
Three QTLs in RIL, two QTLs in BCF1, and three QTLs in MPH explained 27.3%, 15.1%, and 23.4% of total phenotypic variance. Two QTLs (qPYP8.1 and qPYP9.1) were also QTLs for GYP (qGYP8.1 and qGYP9.1). One QTL for GYP on chromosome 11 (qGYP11.1), which showed a negative additive effect (−0.9), was not detected in the PYP dataset, as expected. One QTL on chromosome 2 (qPYP2.1) was not found for GYP. Three overdominance heterosis QTLs were identified on chromosomes 1, 7, and 8. The removal of hybrid sterility effects allowed possible QTLs for GYP to be identified.
The QTLs identified only in the BCF1 population were not classified as heterosis QTLs in this study. However, many of these QTLs showed positive values of combined additive and dominant effects: all four QTLs for CL; one QTL for DTH; one QTL for PN; one of two QTLs for PL (qPL9.1); one of two QTLs for SN (qSN4.2); one of two QTLs for TGW (qTGW1.2), and both QTLs for PYP.
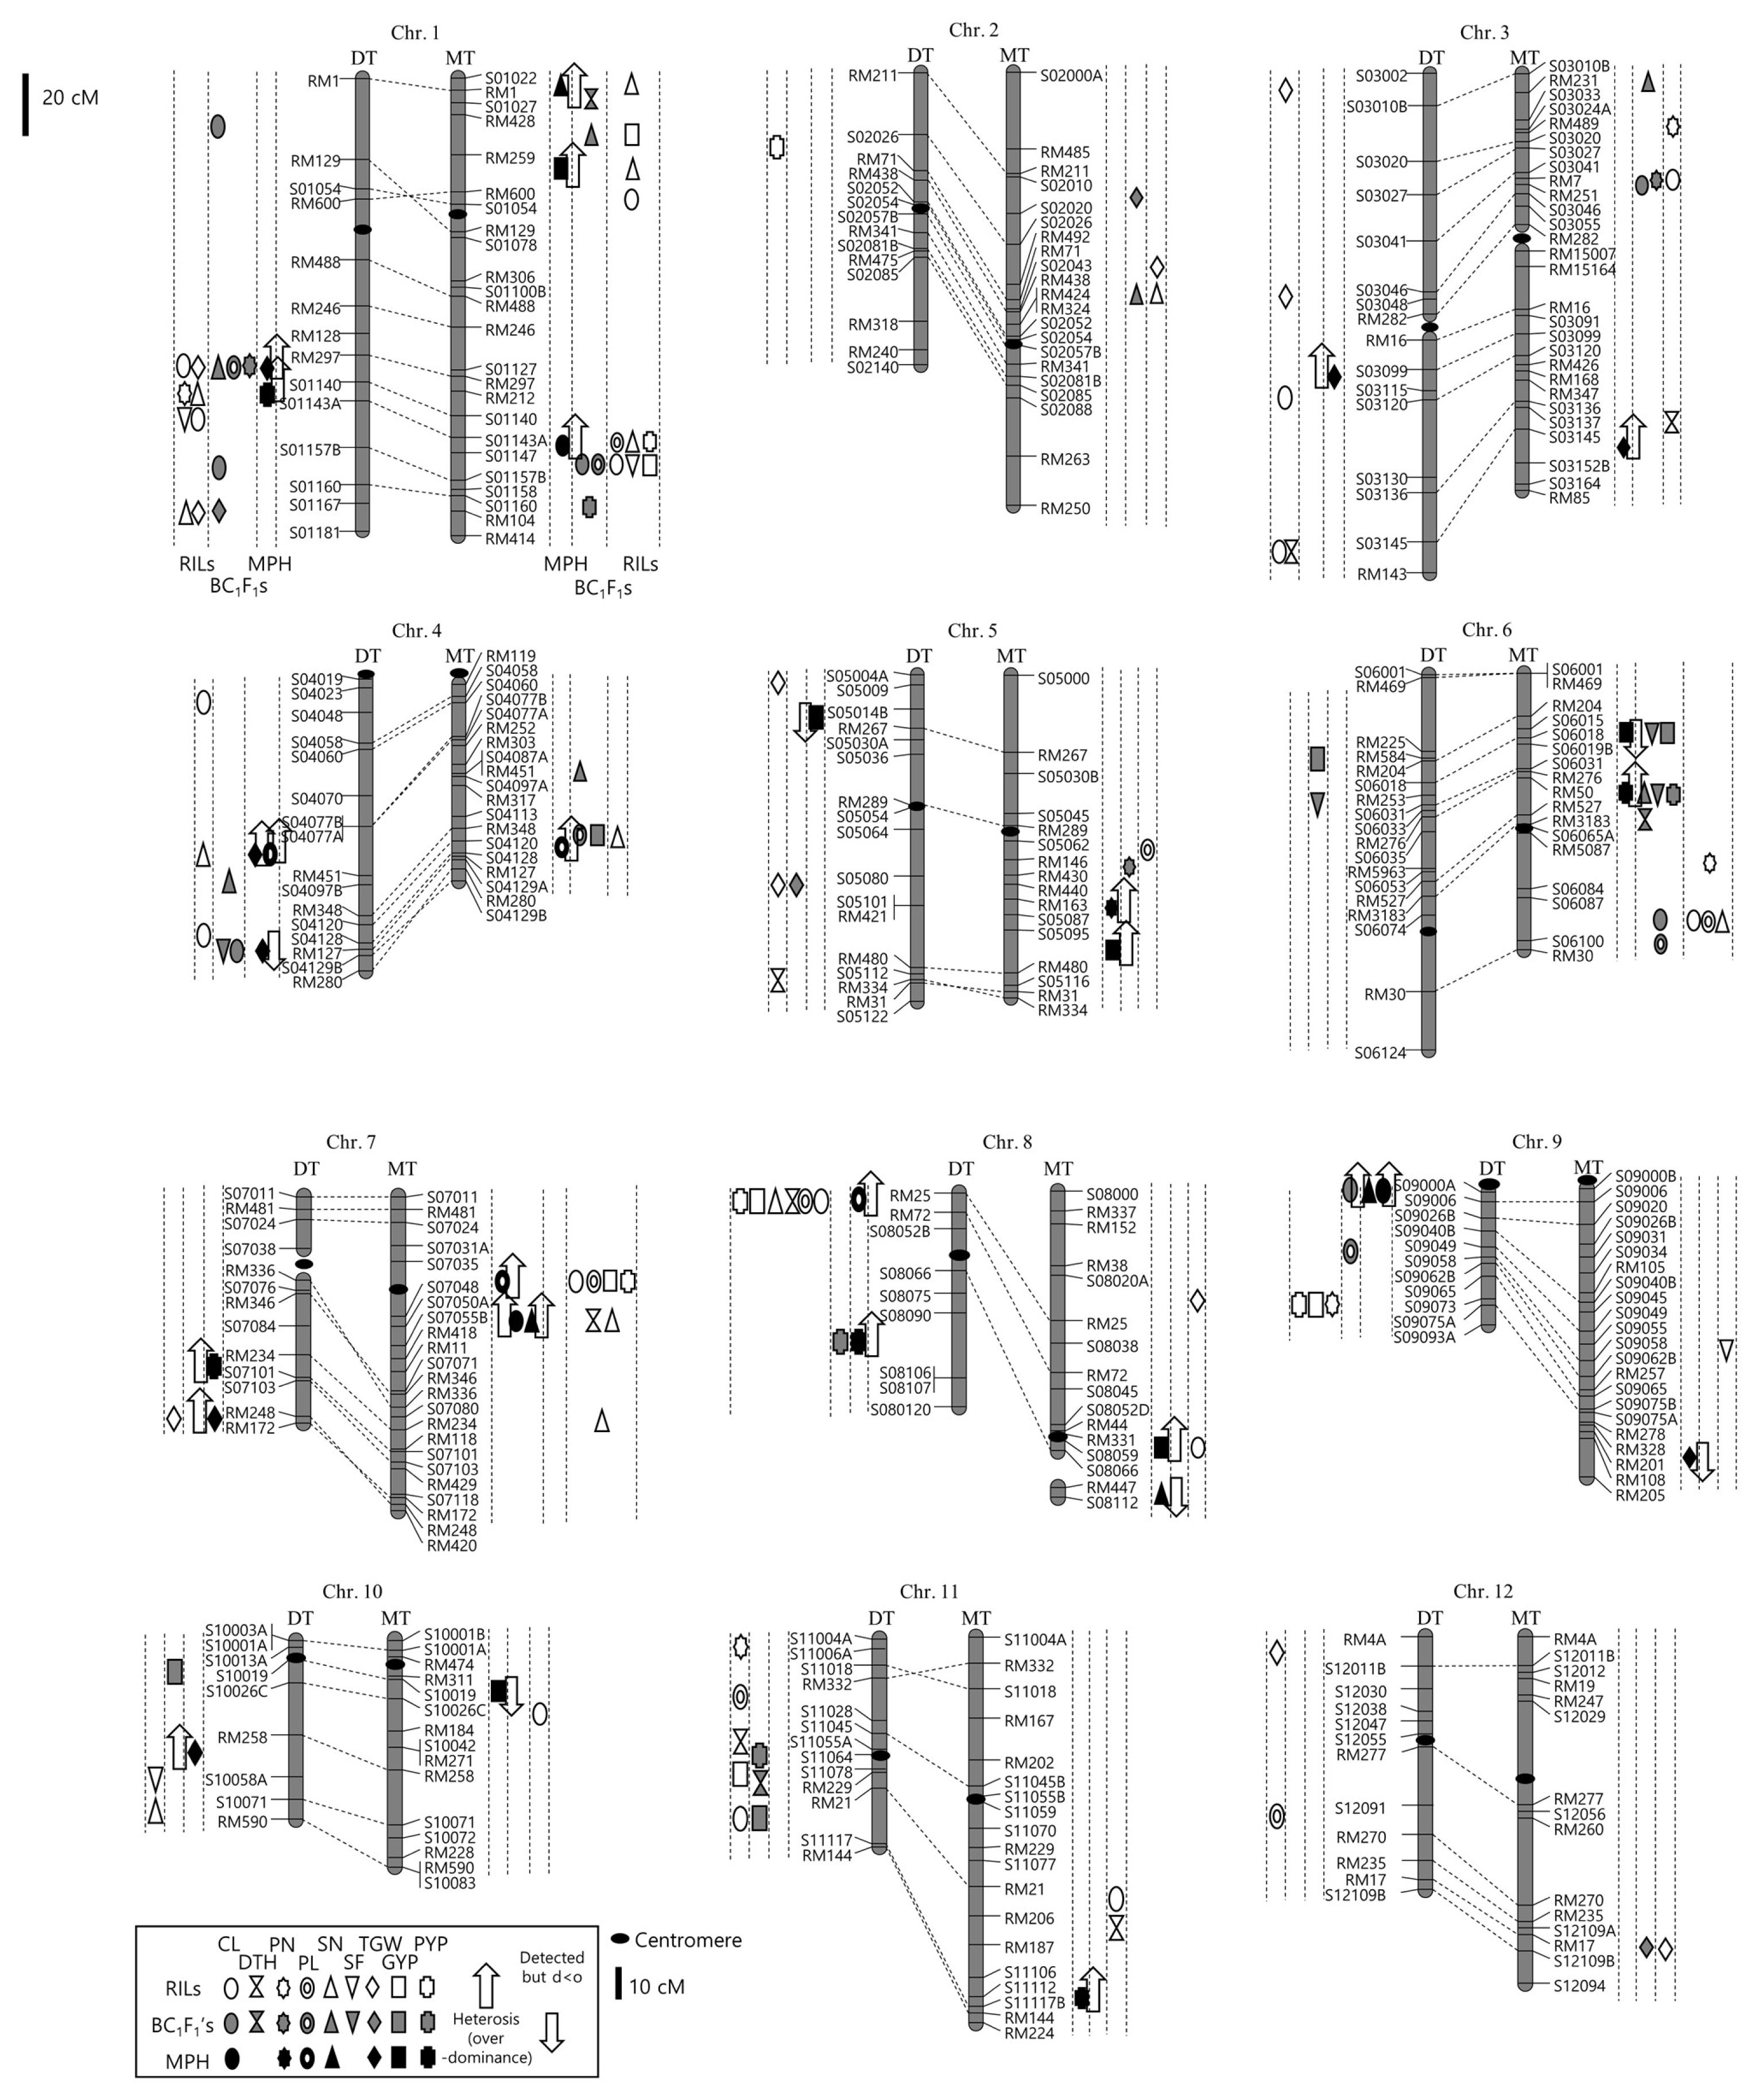
Many of the QTLs were clustered within specific regions on chromosome 1 (RM297-S01143A), chromosome 4 (S04120-S04129B), and chromosome 8 (RM25-RM72) (
Fig. 2, left chromosome shown).
When all traits were considered, 23 EpQTLs in RIL, 15 EpQTLs in BCF1, and two EpQTLs in MPH were identified in this study (
Table 3). The total PVE of EpQTLs for each trait was 10.7–27.5% for RIL, 11.2–26.8% for BCF1, and 7.9–22.0% for MPH. No EpQTLs were identified for SN and PYP in RIL or for PN and TGW in BCF1.
For grain yield traits, different EpQTLs for GYP were identified in RIL and BCF1. Only one EpQTL, between chromosome 1 (S01143A-S01157B, qSF1.1 of RIL) and chromosome 8 (RM72-S08052B, qGYP8.1 of RIL), contributed positively to higher grain yield (1.75 g/plant). For PYP, one EpQTL between chromosome 3 (S03010B-S03020) and chromosome 10 (S10071-RM590, qSN10.1 of RIL) had positive additive effects.
One EpQTL for PL and one for SN were identified in the MPH dataset. No MQTLs were identified within the chromosomal regions linked with EpQTLs for PL. However, for SN, qPL12.1 in RIL interacted with the region on chromosome 4.
Trait contribution to heterosis QTLs for grain yield
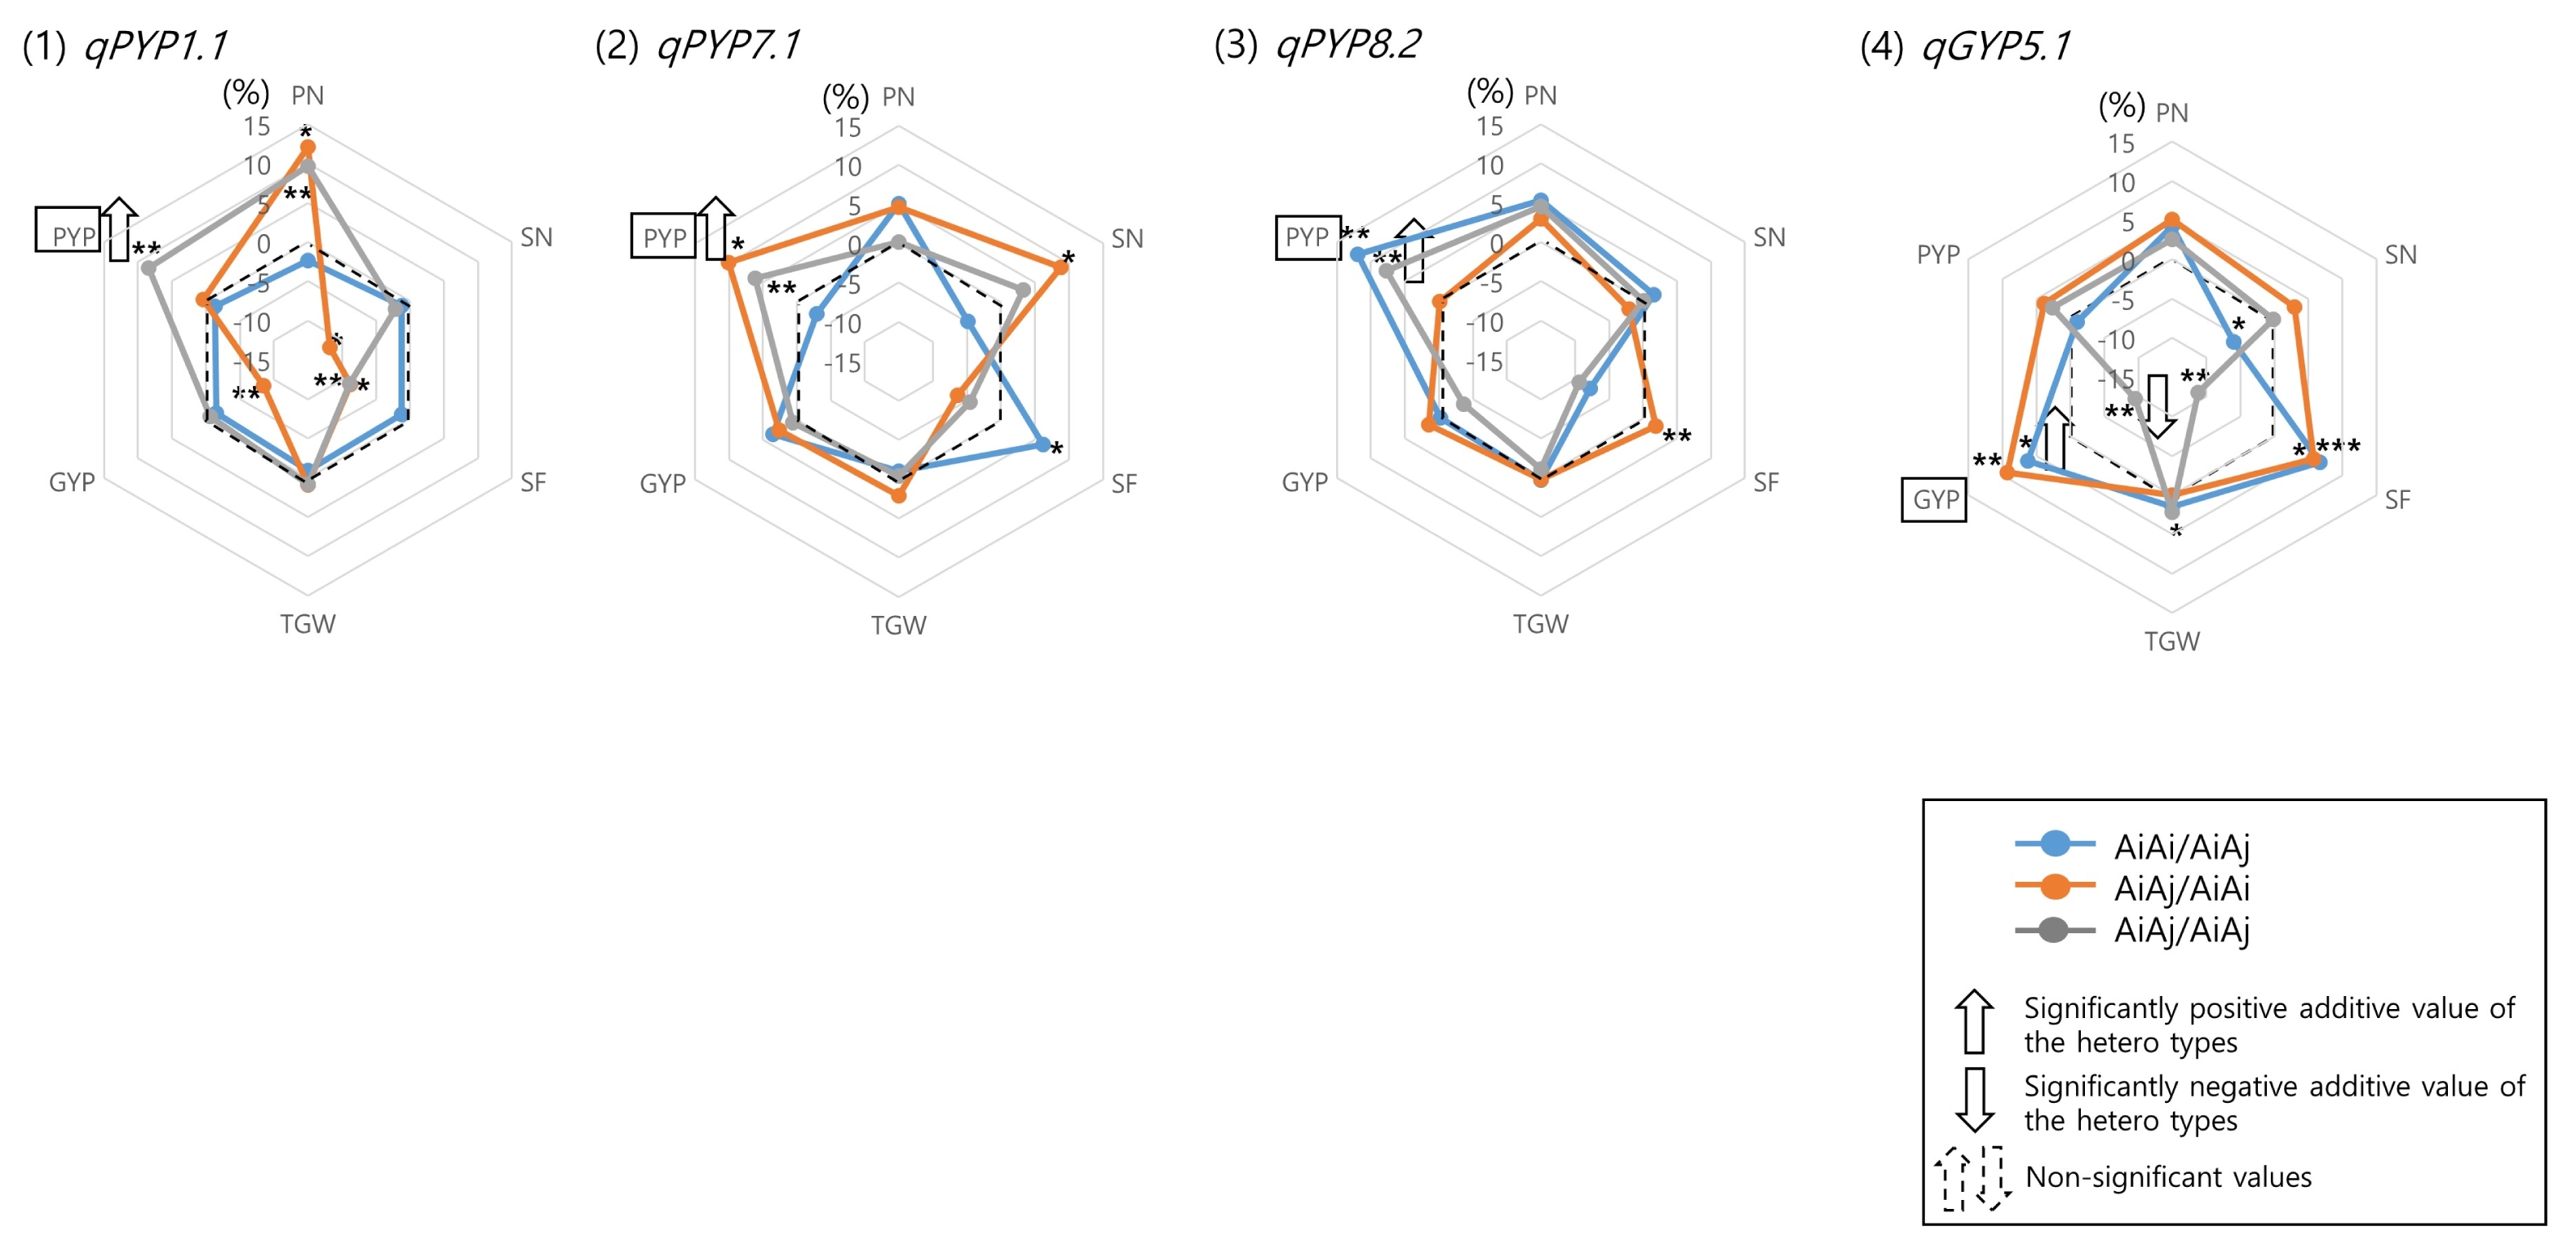
First, to identify the yield-component traits contributing substantially to the three overdominance heterosis QTLs and one underdominance QTL for grain yield in DT-RIL, the additive effects of each yield-component trait on the QTLs were presented in radar charts (
Fig. 3). Interval mapping through backcrossing was used to identify QTLs between markers. There were three types of heterotic allele combination for each marker (AiAi/AiAj, AiAj/AiAi, or AiAj/AiAj), and the additive effects of each allele type were calculated by dividing the value of the corresponding allele type with that of the AiAi/AiAi (homo) allele genotype. Additive effects identified in this study were in the −15–15% range (
Table 4).
For qPYP1.1, the AiAi/AiAj (S01140/S01143A) genotypes did not contribute to heterosis. However, AiAj/AiAi genotypes had a significantly larger PN, and significantly or highly significantly smaller SN, SF, and GYP, than homoallele genotypes. Likewise, AiAj/AiAj genotypes had significantly higher PN and PYP values than homoallele genotypes. This suggested that the PN of AiAj/AiAj genotypes might be the major factor explaining the significant heterotic effect on PYP.
For qPYP7.1, AiAi/AiAj (RM234/S07101) genotypes showed negative additive effects on PYP. The AiAj/AiAi and AiAj/AiAj genotypes had significantly higher PYP values than homoallele genotypes. The additive effect of AiAj/AiAi on SN might explain the significantly positive additive effect of PYP. Although a significant positive additive effect of SF was found for AiAi/AiAj, the PYP values of the genotypes were negative, thus demonstrating that SF alone could not be a factor of heterosis.
For qPYP8.2, AiAi/AiAj (S08090/S08106) and AiAj/AiAj showed significant additive effects for PYP, which may have been caused by low hybrid fertility. AiAj/AiAj genotypes showed a positive effect of SF, but PYP did not show additive effects.
Unlike the PYP cases, no heterosis QTLs were identified in GYP. However, one underdominance GYP QTL (qGYP5.1) was analyzed to see which allele types were contributory. Only AiAj/AiAj (S05014B/RM267) showed a significant negative effect on SF and GYP. Two other heterotic allele genotypes of linked markers (AiAj/AiAi and AiAi/AiAj) contributed to significantly higher SF and GYP values. This result indicates the importance of studying different heterotic allele combinations of linked markers for underdominance QTLs.
Second, the direct effects of each trait on grain yield were analyzed using the path analysis module of SPSS-AMOS software (
Table 5). Only DTH, PN, SN, SF, and TGW were considered as yield-related traits for this analysis, because CL was a vegetative trait and PL was highly correlated with SN. In each heterosis QTL for grain yield, the standardized direct effects of each trait >0.5 or <−0.5 were considered as positive effect QTLs. As expected from the radial chart analysis, PN and SN were the most important traits explaining heterosis of
qPYP1.1. Likewise, PN, SN, and TGW variously contributed to
qPYP7.1 for each allele combination.
qPYP8.2 was related to PN and SN for the AiAj/AiAi type only. PN, SN, and SF showed direct effects on GYP via the contribution of the AiAj/AiAi and AiAi/AiAj genotypes at
qGYP5.1. SF was a negatively effective trait in all heterosis QTLs for PYP.
DISCUSSION
Heterosis QTLs of intra- and inter-locus interactions
Heterosis is governed by various genetic effects including overdominance effects, dominance effects, additive effects, and their interactions. In this study,
indica-japonica RILs were used to identify heterosis QTLs for grain yield and its related traits. Theoretically, heterotic effects (inter-locus heterosis) should be explained solely by the genetic interactions between different recombinant blocks originating from different parents. However, two-QTL interactions (or digenic interactions) are difficult for plant breeders to utilize due to their complexity and the difficulties in dealing with the large numbers of samples in breeding programs. Accessing heterosis through intralocus interactions between different alleles (dominance and overdominance) may thus be more amenable. Intra-and inter-locus heterosis can be assessed using BC
1F
1 populations, which were used to study overdominance and dominance effects in this study. Inter-locus heterogeneity is more prevalent in RIL rather than BC
1F
1 populations, and estimation of intra-locus heterosis may be improved using BCF1 and MPH datasets. The heterotic effects on inter-locus and intra-locus interactions governing grain yield may not be identified at the same loci in different populations. For example, two EpQTLs for GYP in RIL were unidentified in the BCF1 and MPH datasets (
Tables 2 and
3). On the other hand, two EpQTLs for GYP and two EpQTLs for PYP in MT-RILs (RILs derived from Milyang 23 and Tong 88-7;
Chu et al. 2012) were not identified in heterosis MQTL analysis using BCF1 and MPH datasets in DT-RILs (
Supplementary Tables S1 and S2).
In DT-RIL, there were nine heterosis MQTLs for all traits and one underdominance heterosis MQTL for GYP (
Table 2). EpQTLs for heterosis are rarely detected if the population size is small, because the effects of multi-locus allele combinations require a large number of samples and meaningful statistical analysis for detection. Thus, the subsequent heterosis QTL analyses in this study were conducted using only MQTL results. Nevertheless, there were clearly no EpQTLs for GYP or PYP found using MPH datasets in DT-RIL. Conversely, in MPH datasets of MT-RIL, three overdominance MQTLs for GYP and two for PYP were identified (
Supplementary Table S1).
MQTLs for different traits were co-located at some chromosomal regions (
Fig. 2), and several QTL clusters were observed in MT-RILs, on chromosome 1 (S01143A-S01157B), chromosome 4 (RM348-S04128), chromosome 6 (S06015-S06019B, RM50-RM527, and S06087-S06100), and chromosome 7 (S07035-S07055B). In both RILs, QTL clusters included QTLs identified in RIL, BCF1, and MPH datasets for several yield-related traits. Thus, an additive effect of preferred alleles in RILs would be expected in marker-assisted breeding programs that utilized the heterosis QTLs in the QTL clusters. This may explain the plant growth vigor seen in recombinant plants generated through introgression of donor QTLs in some generations of breeding programs.
Heterosis QTLs for each trait were compared between the two RILs (
Supplementary Table S3), and no common heterosis QTLs were found. However, the QTL clusters may represent common loci for heterosis (
Fig. 2). QTL clusters in DT-RIL (RM297-S01143A) and MT-RIL (S01143A-S01157B) were at adjacent regions on chromosome 1, and might share common genetic elements for heterosis. This was also observed for S04120-S04129B (CL, SF, and TGW) in DT-RIL and RM348-S04128 (PL, GYP, and SN) in MT-RIL on chromosome 4. Three QTL regions linked to grain yield traits are close in comparative linkage maps and should be studied further to see whether common regions for heterosis are shared between the RILs (
Fig. 2): RM584-RM204 in DT-RIL and S06015-S06018 in MT-RIL on chromosome 6, RM253-S06031 (SF in DT-RIL) and RM50-RM527 (PYP in MT-RIL) on chromosome 6, and RM21-S11117 (GYP in DT-RIL) and S11112-S11117B (PYP in MT-RIL) on chromosome 11.
Previously reported QTLs that are linked to the identified heterosis QTLs in DT and MT-RILs and are linked to a range of agronomic traits are listed in
Supplementary Table S4. QTL locations were compared between the physical map locations of the markers in this study and the linked markers from various mapping populations. In DT- and MT-RILs,
qTGW4.2,
qGYP8.1,
qSN8.1, and
qCL9.1/qSN9.1 were not previously reported as yield or yield-related QTLs. With the exception of these, all the QTL regions in this study were previously linked to yield or yield-related traits. For example,
qSN1.1 of MT-RIL was co-located with
gp1a in F
2 (grains per panicle,
Shen et al. 2003),
qPN1 in BC
4F
4 (panicles per plant,
Tian et al. 2006), and others. Thus, some previously identified QTLs linked to different traits may be co-located with or the same as QTLs identified in this study. This may explain the significant positive correlations observed between some yield traits. For example, with respect to the linked QTLs given above, grain number (
gp1a) is correlated with spikelet number (
qSN1.1) and panicle number (
qPN1.1).
Previous studies of RILs rarely discussed whether these genes/QTLs exhibited heterosis. Some previously reported QTLs/genes were co-located with the heterosis QTLs identified in this study, and further analysis is needed to determine whether heterosis is seen in heterotic alleles. For DT-RIL, these were as follows:
qTGW3.3 (
gw3a, grain weight,
Yu et al. 1997);
qGYP5.1 (
S31, hybrid sterility,
Li et al. 2005;
qSF5.2, hybrid sterility,
Reflinur et al. 2012);
qPYP7.1 (
qPLLN7, pollen fertility,
Yan et al. 2003;
hd7a, heading date,
Yu et al. 2002);
qTGW7.1 (
S23, hybrid sterility,
Sobrizal et al. 2000);
qPL8.1 (RH8, heading date,
Li et al. 2016;
qPL8,
Hd5, heading date,
Lin et al. 2003; PL,
Miyata et al. 2007); and
qPYP8.2 (
WFP, panicle branching and yield,
Miura et al. 2010). For MT-RIL, these were
qCL1.2 (
sd1, plant height,
Li et al. 2003);
qGYP6.1 (
DPL2, sterility,
Mizuta et al. 2010;
qSPTF6, SF,
Yan et al. 2003);
qPYP6.1 (
spf6, SF,
Song et al. 2005;
S5, SF,
Yan et al. 2000);
qCL7.2 (
Hd4, DTH,
Lin et al. 2003); and
qPYP11.1 (FON3, floral organ number,
Jiang et al. 2007). These QTLs/genes were reported in various population types as well as in backcrossed populations, implying that QTLs showing additive effects in homozygous alleles may give heterotic effects.
Comparative analysis indicated that the negative additive values of some QTLs of DT- and MT-RILs could be partially explained by hybrid sterility QTLs/genes.
qGYP5.1,
qGYP6.1, and
qGYP10.1 were co-located with known sterility QTLs (
qSF5.2 and
S31) and QTLs for pollen fertility (
Doi et al. 1998;
Tan et al. 1998). However, there were no known hybrid sterility QTLs/genes for
qTGW4.2,
qSN8.1,
qTGW9.1, and
qGYP10.1. Conversely,
qPYP6.1 in MT-RIL did not show negative additive values, indicating a lack of allele-induced hybrid sterility between Milyang 23 and Tong 88-7.
Tao et al. (2016) also reported some heterosis QTLs from testcrossed CSSLs (Chromosome Segment Substitution Lines). The QTL hotspots on chromosomes 1, 6, and 8 identified in this study were also identified by
Tao et al. (2016).
Three heterotic allele genotypes on heterosis QTLs of MT-RILs
For QTL determination, the effects of three heterotic allele combinations (AiAi/AiAj, AiAj/AiAi, and AiAj/AjAj) were combined, hampering the identification of the allele types that had the most substantial impact on phenotypic values (
Fig. 3 and
Supplementary Fig. S2).
The range of additive values was larger for MT-RILs than for DT-RILs, indicating that the effect of MQTLs was larger for MT-RILs than for DT-RILs. Five QTLs for GYP and two QTLs for PYP were investigated in this study (
Supplementary Fig. S2 and
Supplementary Table S5). For
qGYP1.2 (RM259/RM600), the heterotic allele of RM259 contributed to the additive effect of SF and heterosis of GYP. The heterotic alleles linked to both the markers contributed to the increase of PN. A QTL for panicle number (
ppp1.1) was reported on
qGYP1.2 (
Cho et al. 2007). This was not significant (
P = 0.051), but a significant positive effect was seen for heterotic allele type for SF contribution to
qGYP5.1. On
qPYP6.1 (S06015/S06018), all three heterotic allele types exhibited similar contributions to heterosis of PYP. SN was the most important contributory trait for PYP increase, though SF was significantly low for all three types. A QTL for SN was identified on
qPYP6.1 (
Zhuang et al. 2001). At
qGYP8.1 (S08059/S08066), heterotic allele effects of S08059 and S08066 gave contrasting effects for SF and GYP. S08059 heterotic allele type positively impacted the additive effect of GYP. On
qPYP11.1 (S11112/S11117B), the AiAi/AiAj and AiAj/AiAj types showed significantly low SF but high PYP. The presupposition yield calculation was influenced by S11117B heterotic allele type.
FON3 (
Jiang et al. 2007) reported a QTL for floral organ numbers in the F
2 population on the same region. However, it was unclear which trait contributed to the PYP increase of
qPYP11.1 in this population. Low SF on
qGYP6.1 (RM50/RM527) was impacted by RM527 heterotic allele type, giving significant positive additive effects of PYP and significant negative effects of GYP. Likewise,
qGYP10.1 (S10019/S10026C) also showed an underdominance heterosis type.
It is desirable to identify the yield-related traits or yield-component traits that are most influential on yield. In this study, to simplify the complicated mediation networks, only the standardized direct effect of each yield-related trait on PYP and GYP was estimated by path analysis (
Table 5).
The direct effect of each trait was estimated for each different allele type. One homoallele type (AiAi/AiAi) in RIL and three heterotic allele types (AiAi/AiAj, AiAj/AiAi, and AiAj/AiAj) in BCF1 populations were analyzed separately. PN and SN were the yield-related traits with most direct impact on heterosis QTLs in DT-RILs. For
qPYP1.1, the strongest trait, with an estimated direct effect >0.5, was SN, particularly for AiAj/AiAi and AiAj/AiAj types (62 of 179 RILs; 34.6% (
Table 4). However, for the same locus, PN was the most effective trait for
qPYP1.1 with respect to the homoallele (AiAi/AiAi) and complete heterotic allele (AiAj/AiAj) types. The same approach could be applied to other heterosis yield QTLs. Different combinations of yield-related traits provided direct effects for each
qPYP7.1 allele type. Only the AiAj/AiAi allele type of
qPYP8.2 was linked with PN and SN in BCF1. Conversely, for
qGYP5.1, only the AiAi/AiAj type was directly impacted by PN, without the negative effect of SF.
A similar approach was used for MT-RILs (
Supplementary Table S6). Unlike with DT-RILs, the positive direct effect on SF was apparent across many QTLs. A direct negative effect of SF was found only for
qPYP6.1 in all allele types.
qGYP1.2,
qGYP5.1, and
qGYP10.1 all positively impacted SF. Conversely, SN had the most positive effect in AiAj/AiAj of
qGYP1.2, AiAj/AiAj of
qPYP6.1, AiAj/AiAi of
qGYP6.1, and AiAj/AiAj of
qGYP10.1. TGW was influenced by AiAi/AiAj of
qPYP6.1 and AiAj/AiAi of
qGYP6.1. PN and DTH directly affected
qPYP6.1 in partial heterotic allele types (AiAi/AiAj or AiAj/AiAi).
In brief, the standardized direct effects of different heterotic allele types on yield-related traits differed between two
indica-japonica RILs. Heterosis effects were identified using the accumulated additive effects of PN, SN, SF, and TGW (
Dan et al. 2015). For each QTL, the yield-related trait with the most positive impact could be identified by this analysis. Followed by the development of near-isogenic lines (NILs) for each QTL, the most important yield-related traits could next be studied to estimate the consequent yield heterosis.
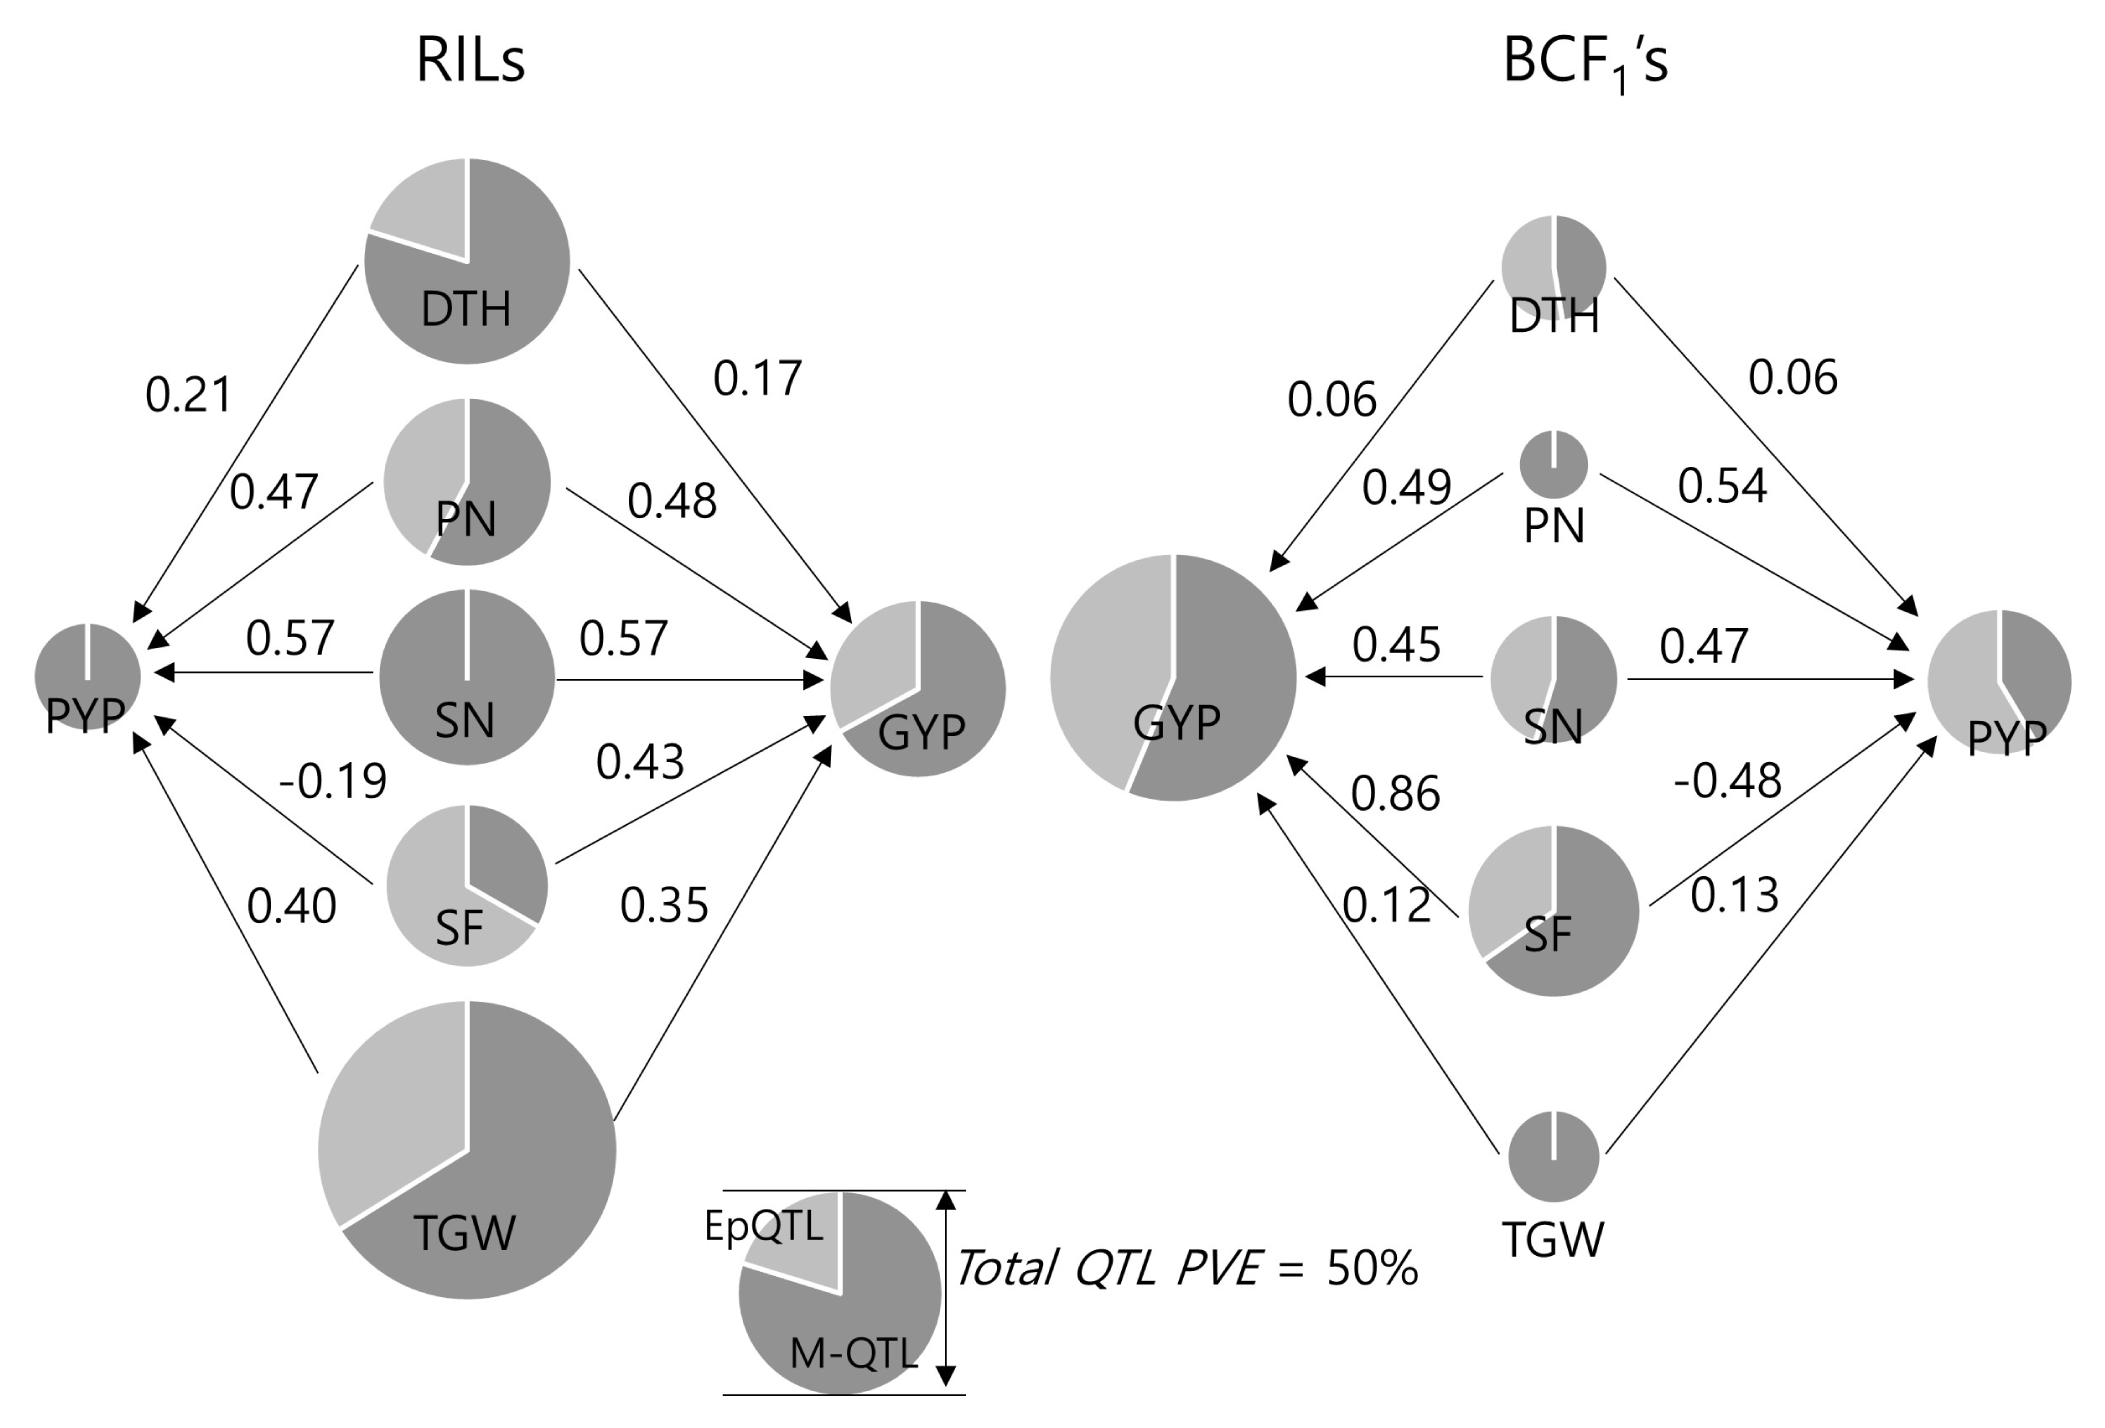
The contribution of MQTLs and EpQTLs to heterosis can be estimated by the sum of total PVEs for the identified QTLs.
Fig. 4 shows the total effects of PVE of each yield-related trait (center), PYP (outer sides), and GYP (inner sides) connected by arrows representing the direct effects. The total PVEs of yield-related traits were larger in DT-RILs than in the BCF1 population. However, total PVEs of GYP and PYP were larger in the BCF1 population than in RILs. In the DT-BCF1 population, contributions of EpQTLs for GYP (61.2%) and PYP (36.4%) were large, and consequently, the heritability (total PVE) of yield heterosis was larger than GYP (45.8%) and PYP (27.3%) in RILs. This differed for MT-RILs (
Supplementary Fig. S3), where heritability of yield heterosis was smaller than in RILs. This implies that the contribution of the dominance effect was larger than that of epistasis between Dasanbyeo (
indica) and TR22183 (
japonica).
Heterosis QTLs identified by current software provide average values for different allele types of heterotic alleles. The additive values of different heterotic allele combinations could be calculated from the identified QTLs to identify the allele type that contributed to the preferable yield heterosis. Hybrid sterility, which is common in indica-japonica crosses in rice, hampers the interpretation of heterotic effects of yield traits in specific heterotic allele types at those loci. The breakdown of allele types may help resolve this.
The heterosis QTLs identified in the two RILs in this study mostly coincided with previously reported yield and yield-related traits. This similarity was also noted when specifically expressed genes of F
1 plants were compared to the linkage map of Nipponbare/93-11 (
Venu et al. 2014). This also showed that heterosis could be explained by certain specific yield-related traits associated with specific loci. These loci might be detected as MQTLs in conventional QTL studies.
The identified EpQTLs explained the presence of epistatic interactions between loci for heterosis. To utilize EpQTLs for plant breeding, marker-assisted recurrent selection or genomic selection strategies would be more effective rather than the simple marker-assisted backcrossing strategies used for MQTLs.
Common heterosis QTLs identified across different populations and studies would be highly valuable for heterosis breeding programs; however, further quantitation of the complex genetic networks for each yield-related trait is needed to design breeding programs with high predictability.
Supplementary Information
ACKNOWLEDGEMENTS
This study was supported by a grant from the Next-Generation BioGreen 21 Program (no. PJ01102401) of the Rural Development Administration, Korea. This research was also supported by the Basic Science Research Program through the National Research Foundation of Korea (NRF) funded by the Ministry of Education (no. 2017R1D1A1B04034862).
Fig. 1Phenotypic distribution of yield and yield-related traits of Dasanbyeo (P1), TR22183 (P2), their respective F1 values, and their recombinant inbred lines (RILs). (a) Culm length, (b) days to heading, (c) panicle number, (d) panicle length, (e) spikelet number per panicle, (f) spikelet fertility, (g) thousand grain weight, (h) grain yield per plant, and (i) presupposition yield per plant.
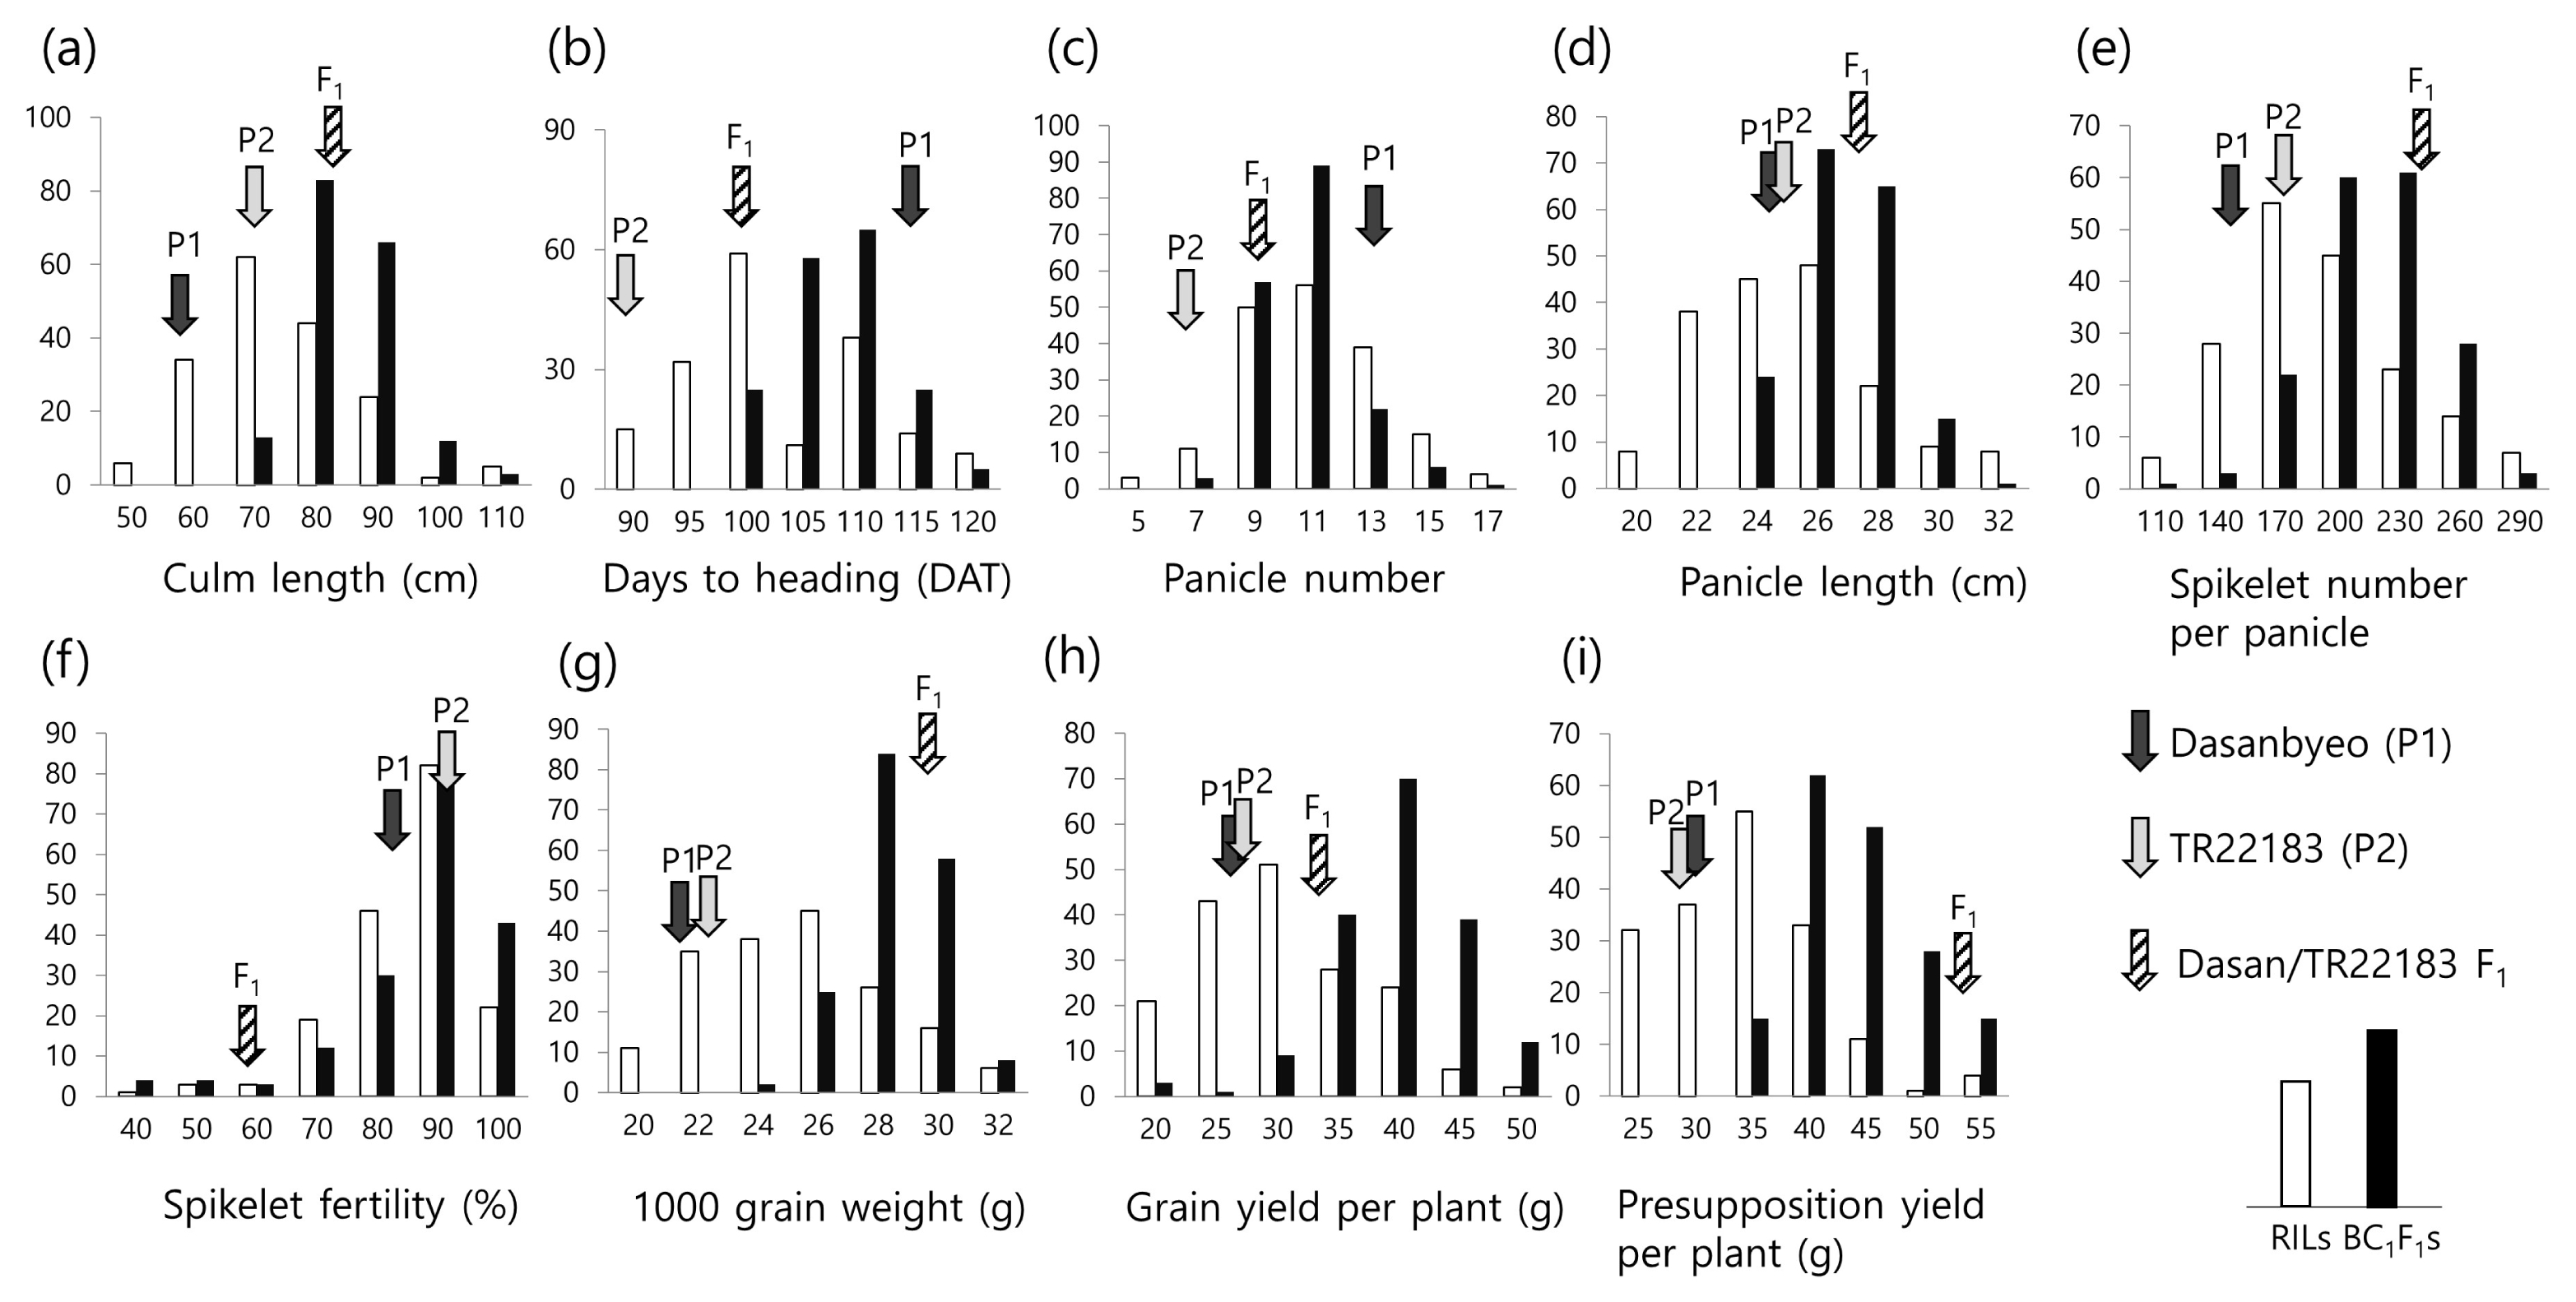
Fig. 2Comparative linkage maps of DT-RILs (left, DT) and MT-RILs (right, MT) for the 12 rice chromosomes. Vertical gray bars represent chromosomes. Black dots on each chromosome represent the estimated position of the centromere. QTLs for each trait identified in this study are located next to the linked markers on each chromosome. The legend box below the chromosomes indicates the symbols corresponding to each trait. Vertical dotted lines divide the QTL groups identified in different populations (RILs, BCF1, and MPH). QTLs with black symbols were identified in MPH, gray in BCF1, and blank in RILs. Upward or downward arrows next to QTLs designate the QTLs as overdominant or underdominant, respectively. Dotted lines connect the same markers used in the two RILs.

Fig. 3Phenotypic additive performance (%) of three different heterotic allele types on yield heterosis QTLs identified in DT-RILs. The radial charts for each yield heterosis QTL show two yield (GYP and PYP) and four yield-related traits (PN, SN, SF, and TGW). Blue (AiAi/AiAj), orange (AiAj/AiAi), and gray (AiAj/AiAj) lines indicate the additive value in percentage over the value AiAi/AiAi (Dasanbyeo) type (dotted closed hexagonal line). Asterisks represent the statistical significance level (*** for P < 0.001; ** for 0.001 < P < 0.01; and * for 0.01 < P < 0.05). The upward/downward arrows indicate the significant additive values of the corresponding heterotic allele types.

Fig. 4Contribution of MQTL and EpQTL for each trait to yield in DT-RILs. Pie chart size for each trait represents the sum of total PVE of MQTL (dark gray) and EpQTL (light gray) identified in this study. Five yield-related traits were connected by arrows with numbers (standardized direct effect) to GYP (inner side) and PYP (outer side). The direct effects of each trait were shown in two populations: RIL (left) and BCF1 (right).

Table 1Phenotypic performance and heterosis of traits in parents: F1s, RILs, and BCF1 populations of DT-RIL.
Table 1
|
DTHz)
|
CL |
PL |
PN |
SN |
SF |
TGW |
GYP |
PYP |
|
P1 (Dasanbyeo) |
113.0 ± 0.7 a |
58.2 ± 2.6 a |
24.9 ± 1.1 a |
13.4 ± 1.8 a |
156.6 ± 10.4 a |
82.0 ± 7.5 a |
21.8 ± 0.7 a |
27.6 ± 2.0 a |
30.3 a |
|
P2 (TR22183) |
88.0 ± 1.0 b |
71.4 ± 4.1 b |
25.4 ± 1.5 a |
6.8 ± 1.1 b |
179.3 ± 16.2 b |
89.0 ± 7.6 a |
22.2 ± 0.7 a |
28.7 ± 4.8 a |
29.0 a |
|
MP = (P1 + P2) / 2 |
100.5 a |
64.8 a |
25.2 a |
10.1 a |
168.0 a |
85.5 a |
22.0 a |
28.2 a |
29.7 a |
|
F1
|
100.0 ± 1.0 a |
81.7 ± 3.3 b |
27.4 ± 0.9 b |
8.9 ± 2.6 b |
236.3 ± 12.6 b |
47.3 ± 9.0 b |
30.5 ± 0.2 b |
33.0 ± 2.3 b |
54.1 b |
|
MPHy) = F1 – MP |
−0.5 |
16.9 |
2.3 |
−1.2 |
65.9 |
−28.0 |
6.6 |
5.5 |
82.5 |
|
RILs |
101.3 ± 8.3 (88.0–130.0) |
69.1 ± 12.0 (44.2–113.8) |
24.2 ± 2.8 (18.2–32.3) |
10.3 ± 2.4 (6.0–16.6) |
175.3 ± 41.8 (68.0–313.8) |
80.3 ± 11.1 (37.4–96.8) |
24.2 ± 3.1 (16.8–31.8) |
27.9 ± 6.8 (15.1–48) |
31.8 ± 6.8 (19.2–56.1) |
|
BCF1s (P1 × RILs) |
106.6 ± 6.1 (97.0–127.0) |
80.0 ± 7.2 (65.0–107.9) |
25.9 ± 1.6 (22.4–30.3) |
9.8 ± 1.6 (7.0–15.4) |
201.0 ± 29.3 (94.0–266.8) |
81.9 ± 14.8 (24.8–96.0) |
27.7 ± 1.6 (23.5–31.8) |
37.6 ± 6.2 (16.5–52.3) |
41.9 ± 6.0 (30.9–70.0) |
|
BC MPHy) = BCF1 – (RIL + P1) / 2 |
−0.2 ± 6.0 (−18.5–28.5) |
16.4 ± 5.2 (−3.3–38.5) |
1.3 ± 1.5 (−1.7–5.7) |
−2.0 ± 1.3 (−4.7–2.6) |
35.0 ± 24.9 (−53.6–91.3) |
−0.1 ± 15.1 (−84.7–24.0) |
4.7 ± 1.4 (0.2–9.1) |
9.5 ± 6.8 (−26.8–26.0) |
11.1 ± 5.7 (−1.2–34.9) |
Table 2Major QTLs identified in DT-RIL, BCF1, and MPH datasets.
Table 2
|
Trait |
Name |
Chr.z)
|
Interval |
RIL |
BCF1
|
MPH |
QTL typeu)
|
|d / a| |2d > a + d| |
|
|
|
|
LODy)
|
ax)
|
R2 (%) |
PVEw) (%) |
LOD |
a + d |
R2 (%) |
PVE (%) |
LOD |
dv)
|
R2 (%) |
PVE (%) |
|
CL |
qCL1.1
|
1 |
RM1-RM129 |
|
|
|
81.4 |
3.62 |
1.92 |
6.58 |
36.4 |
|
|
|
21.6 |
A |
|
|
qCL1.3
|
1 |
RM297-S01140 |
8.42 |
4.24 |
11.5 |
|
|
|
|
|
|
|
|
|
A |
|
|
qCL1.4
|
1 |
S01143A-S01157B |
3.65 |
−3.10 |
6.1 |
|
|
|
|
|
|
|
|
|
A |
|
|
qCL1.5
|
1 |
S01157B-S01160 |
|
|
|
|
5.13 |
2.04 |
7.46 |
|
|
|
|
|
A |
|
|
qCL3.1
|
3 |
S03115-S03120 |
6.68 |
−3.56 |
8.1 |
|
|
|
|
|
|
|
|
|
A |
|
|
qCL3.2
|
3 |
S03145-RM143 |
6.58 |
−3.15 |
6.4 |
|
|
|
|
|
|
|
|
|
A |
|
|
qCL4.1
|
4 |
S04023-S04048 |
7.55 |
−3.65 |
8.5 |
|
|
|
|
|
|
|
|
|
A |
|
|
qCL4.2
|
4 |
S04120-S04128 |
7.93 |
−3.35 |
7.2 |
|
|
|
|
|
|
|
|
|
A |
|
|
qCL4.3
|
4 |
S04128-RM127 |
|
|
|
|
10.1 |
2.73 |
13.34 |
|
|
|
|
|
A |
|
|
qCL8.1
|
8 |
RM25-RM72 |
27.16 |
6.84 |
29.9 |
|
|
|
|
|
|
|
|
|
A |
|
|
qCL9.1
|
9 |
S09000A-S09006 |
|
|
|
|
5.03 |
2.22 |
8.81 |
|
4.71 |
2.11 |
15.1 |
|
OD |
1.902 |
|
qCL11.1
|
11 |
RM21-S11117 |
6.68 |
−3.68 |
8.7 |
|
|
|
|
|
|
|
|
|
A |
|
|
DTH |
qDTH3.1
|
3 |
S03145-RM143 |
4.4 |
2.01 |
5.6 |
42.3 |
|
|
|
12.4 |
|
|
|
No analysis |
A |
|
|
qDTH5.1
|
5 |
RM334-RM31 |
3.09 |
1.75 |
4.2 |
|
|
|
|
|
|
|
|
|
A |
|
|
qDTH8.1
|
8 |
RM25-RM72 |
17.3 |
4.55 |
28.5 |
|
|
|
|
|
|
|
|
|
A |
|
|
qDTH11.1
|
11 |
S11045-S11055A |
2.66 |
−1.71 |
4.0 |
|
|
|
|
|
|
|
|
|
A |
|
|
qDTH11.2
|
11 |
RM229-RM21 |
|
|
|
|
4.79 |
2.21 |
12.37 |
|
|
|
|
|
A |
|
|
PN |
qPN1.1
|
1 |
RM297-S01140 |
|
|
|
23.5 |
6.28 |
0.60 |
16.25 |
16.3 |
|
|
|
|
A |
|
|
qPN1.2
|
1 |
S01140-S01143A |
2.24 |
−0.51 |
4.4 |
|
|
|
|
|
|
|
|
|
A |
|
|
qPN9.1
|
9 |
S09073-S09075A |
6.07 |
0.80 |
10.6 |
|
|
|
|
|
|
|
|
|
A |
|
|
qPN11.1
|
11 |
S11004A-S11006A |
4.23 |
−0.71 |
8.5 |
|
|
|
|
|
|
|
|
|
A |
|
|
PL |
qPL1.1
|
1 |
RM297-S01140 |
|
|
|
59.1 |
2.35 |
−0.43 |
6.87 |
16.4 |
|
|
|
24.8 |
A |
|
|
qPL4.1
|
4 |
S04077A-RM451 |
|
|
|
|
|
|
|
|
5.38 |
0.45 |
9.4 |
|
OD |
|
|
qPL8.1
|
8 |
RM25-RM72 |
19.86 |
1.72 |
36.8 |
|
|
|
|
|
7.83 |
0.58 |
15.4 |
|
D |
0.337 |
|
qPL9.1
|
9 |
S09049-S09058 |
|
|
|
|
3.16 |
0.50 |
9.48 |
|
|
|
|
|
A |
|
|
qPL11.1
|
11 |
RM332-S11028 |
7.55 |
−0.87 |
8.5 |
|
|
|
|
|
|
|
|
|
A |
|
|
qPL12.1
|
12 |
S12091-RM270 |
12.56 |
1.06 |
13.8 |
|
|
|
|
|
|
|
|
|
A |
|
|
SN |
qSN1.1
|
1 |
RM297-S01140 |
|
|
|
43.9 |
2.8 |
−7.39 |
6.24 |
17.9 |
|
|
|
10.2 |
A |
|
|
qSN1.2
|
1 |
S01140-S01143A |
7.54 |
−15.51 |
13.1 |
|
|
|
|
|
|
|
|
|
A |
|
|
qSN1.3
|
1 |
S01167-S01181 |
4.41 |
9.84 |
5.3 |
|
|
|
|
|
|
|
|
|
A |
|
|
qSN4.1
|
4 |
S04077A-RM451 |
4.32 |
−10.24 |
5.7 |
|
|
|
|
|
|
|
|
|
A |
|
|
qSN4.2
|
4 |
RM451-S04097B |
|
|
|
|
6.28 |
10.10 |
11.66 |
|
|
|
|
|
A |
|
|
qSN8.1
|
8 |
RM25-RM72 |
9.23 |
16.41 |
14.7 |
|
|
|
|
|
|
|
|
|
A |
|
|
qSN9.1
|
9 |
S09000A-S09006 |
|
|
|
|
|
|
|
|
2.56 |
6.38 |
6.2 |
|
OD |
|
|
qSN10.1
|
10 |
S10071-RM590 |
6.67 |
13.13 |
9.4 |
|
|
|
|
|
|
|
|
|
A |
|
|
SF |
qSF1.1
|
1 |
S01143A-S01157B |
4.39 |
2.32 |
4.8 |
13.7 |
|
|
|
27.6 |
|
|
|
No analysis |
A |
|
|
qSF4.1
|
4 |
S04128-RM127 |
|
|
|
|
4.98 |
−4.17 |
7.86 |
|
|
|
|
|
A |
|
|
qSF6.1
|
6 |
RM253-S06031 |
|
|
|
|
9.14 |
−6.60 |
19.69 |
|
|
|
|
|
A |
|
|
qSF10.1
|
10 |
S10058A-S10071 |
7.25 |
3.16 |
8.9 |
|
|
|
|
|
|
|
|
|
A |
|
|
TGW |
qTGW1.1
|
1 |
RM297-S01140 |
13.6 |
0.92 |
8.8 |
50.4 |
|
|
|
22.4 |
6.12 |
0.53 |
13.4 |
43.9 |
D |
0.576 |
|
qTGW1.2
|
1 |
S01167-S01181 |
4.72 |
−0.56 |
3.3 |
|
5.46 |
0.44 |
8.39 |
|
|
|
|
|
A |
|
|
qTGW3.1
|
3 |
S03002-S03010B |
5.42 |
0.59 |
3.6 |
|
|
|
|
|
|
|
|
|
A |
|
|
qTGW3.2
|
3 |
S03046-S03048 |
11.11 |
−1.00 |
10.5 |
|
|
|
|
|
|
|
|
|
A |
|
|
qTGW3.3
|
3 |
S03099-S03115 |
|
|
|
|
|
|
|
|
2.8 |
0.47 |
10.4 |
|
OD |
|
|
qTGW4.1
|
4 |
S04077A-RM451 |
|
|
|
|
|
|
|
|
3.02 |
0.39 |
7.2 |
|
OD |
|
|
qTGW4.2
|
4 |
RM127-S04129B |
|
|
|
|
|
|
|
|
3.44 |
0.41 |
7.9 |
|
UD |
|
|
qTGW5.1
|
5 |
S05004A-S05009 |
4.66 |
−0.59 |
3.7 |
|
|
|
|
|
|
|
|
|
A |
|
|
qTGW5.2
|
5 |
S05080-S05101 |
13.63 |
0.99 |
10.3 |
|
7.89 |
−0.57 |
13.96 |
|
|
|
|
|
A |
|
|
qTGW7.1
|
7 |
RM248-RM172 |
7.13 |
0.69 |
4.9 |
|
|
|
|
|
2.41 |
0.30 |
4.3 |
|
D |
0.436 |
|
qTGW10.1
|
10 |
RM258-S10058A |
|
|
|
|
|
|
|
|
3.02 |
0.36 |
6.4 |
|
OD |
|
|
qTGW12.1
|
12 |
RM4A-S12011B |
11.14 |
0.91 |
8.7 |
|
|
|
|
|
|
|
|
|
A |
|
|
GYP |
qGYP5.1
|
5 |
S05014B-RM267 |
|
|
|
30.7 |
|
|
|
34.4 |
7.74 |
2.72 |
16.0 |
16 |
UD |
|
|
qGYP6.1
|
6 |
RM584-RM204 |
|
|
|
|
2.56 |
−1.63 |
6.67 |
|
|
|
|
|
A |
|
|
qGYP8.1
|
8 |
RM25-RM72 |
20.8 |
3.18 |
22.4 |
|
|
|
|
|
|
|
|
|
A |
|
|
qGYP9.1
|
9 |
S09073-S09075A |
8.21 |
1.71 |
6.5 |
|
|
|
|
|
|
|
|
|
A |
|
|
qGYP10.1
|
10 |
S10019-S10026C |
|
|
|
|
6.71 |
−2.88 |
20.67 |
|
|
|
|
|
A |
|
|
qGYP11.1
|
11 |
S11078-RM229 |
2.17 |
−0.90 |
1.8 |
|
|
|
|
|
|
|
|
|
A |
|
|
qGYP11.2
|
11 |
RM21-S11117 |
|
|
|
|
2.29 |
−1.68 |
7.06 |
|
|
|
|
|
A |
|
|
PYP |
qPYP1.1
|
1 |
S01140-S01143A |
|
|
|
27.3 |
|
|
|
15.1 |
3.06 |
1.50 |
6.5 |
23.4 |
OD |
|
|
qPYP2.1
|
2 |
S02026-RM71 |
2.92 |
1.47 |
4.5 |
|
|
|
|
|
|
|
|
|
A |
|
|
qPYP7.1
|
7 |
RM234-S07101 |
|
|
|
|
|
|
|
|
3.97 |
1.69 |
8.3 |
|
OD |
|
|
qPYP8.1
|
8 |
RM25-RM72 |
9.44 |
2.84 |
16.7 |
|
|
|
|
|
|
|
|
|
A |
|
|
qPYP8.2
|
8 |
S08090-S08106 |
|
|
|
|
|
|
|
|
2.97 |
1.71 |
8.5 |
|
OD |
|
|
qPYP8.3
|
8 |
S08106-S08107 |
|
|
|
|
4.18 |
1.69 |
7.96 |
|
|
|
|
|
A |
|
|
qPYP9.1
|
9 |
S09075A-S09093A |
5.27 |
1.72 |
6.1 |
|
|
|
|
|
|
|
|
|
A |
|
|
qPYP11.1
|
11 |
S11055A-S11064 |
|
|
|
|
2.48 |
1.60 |
7.14 |
|
|
|
|
|
A |
|
Table 3EpQTLs of DT-RIL and BCF1 populations and MPH datasets.
Table 3
|
Traitz)
|
Chr. |
Interval i |
Chr. |
Interval j |
LOD |
Aiy)
|
Aj |
AAij |
H^2(Ai) |
H^2(Aj) |
H^2(AAij) |
PVEx) (%) |
|
RIL |
CL |
3 |
S03002-S03010B |
9 |
S09000A-S09006 |
9.92 |
1.33**
|
|
2.48 |
0.007 |
|
0.026 |
15.8 |
|
4 |
S04048-S04058 |
4 |
S04097B-RM348 |
4.79 |
|
|
2.34 |
|
|
0.023 |
|
|
5 |
S05036-RM289 |
12 |
RM235-RM17 |
7.12 |
|
|
2.96 |
|
|
0.037 |
|
|
7 |
RM336-S07076 |
11 |
S11028-S11045 |
10.96 |
1.9***
|
|
2.14 |
0.015 |
|
0.019 |
|
|
7 |
RM248-RM172 |
9 |
S09065-S09073 |
11.51 |
1.03*
|
|
−3.57 |
0.004 |
|
0.054 |
|
|
DTH |
8 |
S08107-S080120 |
10 |
S10071-RM590 |
6.42 |
|
|
2.95 |
|
|
0.107 |
10.7 |
|
PN |
6 |
S06035-RM5963 |
8 |
S08075-S08090 |
7.21 |
|
|
−0.78 |
|
|
0.096 |
17.1 |
|
8 |
S08052B-S08066 |
8 |
S08090-S08106 |
4.8 |
|
|
−0.72 |
|
|
0.075 |
|
|
PL |
1 |
S01167-S01181 |
9 |
S09065-S09073 |
5.61 |
|
|
0.67 |
|
|
0.033 |
16.8 |
|
3 |
S03099-S03115 |
10 |
S10058A-S10071 |
4.66 |
|
|
0.62 |
|
|
0.028 |
|
|
5 |
S05009-S05014B |
6 |
RM469-RM225 |
5.08 |
|
|
0.63 |
|
|
0.029 |
|
|
6 |
S06074-RM30 |
7 |
RM336-S07076 |
8.63 |
|
0.78***
|
−0.76 |
|
0.045 |
0.043 |
|
|
7 |
RM346-S07084 |
8 |
S08107-S080120 |
6.02 |
0.87*
|
|
−0.69 |
0.056 |
|
0.035 |
|
|
SF |
1 |
RM488-RM246 |
2 |
S02085-RM318 |
5.21 |
|
|
3.38 |
|
|
0.076 |
27.5 |
|
6 |
RM469-RM225 |
9 |
S09075A-S09093A |
9.75 |
|
|
4.58 |
|
|
0.140 |
|
|
8 |
RM25-RM72 |
8 |
S08090-S08106 |
7.37 |
1.91**
|
|
2.99 |
0.024 |
|
0.059 |
|
|
TGW |
2 |
RM71-RM438 |
2 |
S02085-RM318 |
7.07 |
−0.5***
|
|
−0.56 |
0.021 |
|
0.023 |
25.8 |
|
3 |
S03120-S03130 |
8 |
S08090-S08106 |
11.5 |
|
|
1.02 |
|
|
0.085 |
|
|
6 |
RM3183-S06074 |
8 |
S08075-S08090 |
10.25 |
|
|
0.89 |
|
|
0.065 |
|
|
8 |
RM25-RM72 |
10 |
S10026C-RM258 |
13.43 |
0.37**
|
0.99***
|
0.61 |
0.011 |
0.080 |
0.031 |
|
|
11 |
S11028-S11045 |
12 |
S12091-RM270 |
7.42 |
|
|
−0.81 |
|
|
0.054 |
|
|
GYP |
5 |
S05054-S05064 |
8 |
RM25-RM72 |
16.63 |
|
2.96***
|
1.52 |
|
0.155 |
0.041 |
15.1 |
|
6 |
RM527-RM3183 |
11 |
RM229-RM21 |
8.15 |
|
|
2.49 |
|
|
0.110 |
|
|
BCF1
|
CL |
1 |
S01157B-S01160 |
12 |
RM277-S12091 |
8.45 |
−1.93***
|
|
−1.88 |
0.048 |
|
0.046 |
11.2 |
|
5 |
S05009-S05014B |
9 |
S09000A-S09006 |
8.27 |
|
−2.47***
|
2.27 |
|
0.079 |
0.067 |
|
|
DTH |
2 |
RM475-S02085 |
11 |
S11018-RM332 |
4.77 |
−1*
|
|
2.01 |
0.017 |
|
0.068 |
13.7 |
|
6 |
S06053-RM527 |
11 |
RM229-RM21 |
6.98 |
|
−1.99***
|
2.04 |
|
0.066 |
0.070 |
|
|
PL |
1 |
RM128-RM297 |
8 |
RM25-RM72 |
5.46 |
0.44***
|
|
0.53 |
0.055 |
|
0.080 |
22.8 |
|
3 |
S03099-S03115 |
4 |
RM348-S04120 |
6.53 |
|
|
−0.72 |
|
|
0.148 |
|
|
SN |
1 |
S01143A-S01157B |
8 |
S08052B-S08066 |
5.43 |
|
|
10.93 |
|
|
0.148 |
14.8 |
|
SF |
1 |
RM128-RM297 |
11 |
RM21-S11117 |
4.62 |
3.32**
|
3.04*
|
−5.62 |
0.021 |
0.017 |
0.059 |
14.7 |
|
1 |
RM297-S01140 |
11 |
RM21-S11117 |
5.92 |
4.47***
|
3.58**
|
−6.01 |
0.037 |
0.024 |
0.068 |
|
|
4 |
S04128-RM127 |
11 |
S11045-S11055A |
5.95 |
4.05***
|
|
−3.25 |
0.031 |
|
0.020 |
|
|
GYP |
1 |
S01143A-S01157B |
8 |
RM72-S08052B |
4.75 |
−0.84*
|
|
1.75 |
0.013 |
|
0.056 |
26.8 |
|
2 |
RM475-S02085 |
3 |
S03120-S03130 |
5.46 |
1.22**
|
|
−2.22 |
0.027 |
|
0.089 |
|
|
5 |
S05036-RM289 |
6 |
RM469-RM225 |
4.77 |
|
|
−2.6 |
|
|
0.123 |
|
|
PYP |
3 |
S03010B-S03020 |
10 |
S10071-RM590 |
4.79 |
|
|
2 |
|
|
0.114 |
21.3 |
|
4 |
RM348-S04120 |
9 |
S09062B-S09065 |
4.87 |
|
|
−1.86 |
|
|
0.099 |
|
|
MPH |
PL |
1 |
RM128-RM297 |
7 |
S07024-S07038 |
4.8 |
|
|
0.39 |
|
|
0.079 |
7.9 |
|
SN |
4 |
S04048-S04058 |
12 |
S12091-RM270 |
5.62 |
|
|
12.94 |
|
|
0.220 |
22.0 |
Table 4Percent additive effect of each yield-related trait to its parent haplotype (AiAi) and yield traits in BCF1 of DT-RIL.
Table 4
|
QTL |
Marker |
Haplotype |
|
|
n |
PN |
SN |
SF |
TGW |
GYP |
PYP |
|
|
|
|
|
|
|
Az) (%) |
Py) (T < t) |
A (%) |
P (T < t) |
A (%) |
P (T < t) |
A (%) |
P (T < t) |
A (%) |
P (T < t) |
A (%) |
P (T < t) |
|
qPYP1.1
|
S01140 |
AiAi |
S01143A |
AiAj |
9 |
−2.34 |
0.170 |
−1.24 |
0.358 |
−1.20 |
0.394 |
−0.89 |
0.368 |
−1.52 |
0.391 |
−1.32 |
0.463 |
|
AiAj |
|
AiAi |
12 |
12.13 |
0.021 |
−11.75 |
0.046 |
−8.75 |
0.048 |
0.92 |
0.180 |
−8.44 |
0.004 |
0.41 |
0.459 |
|
AiAj |
|
AiAj |
50 |
9.69 |
0.001 |
−2.13 |
0.188 |
−8.87 |
0.008 |
0.78 |
0.220 |
−0.63 |
0.430 |
8.39 |
0.002 |
|
qGYP5.1
|
S05014B |
AiAi |
RM267 |
AiAj |
22 |
4.24 |
0.170 |
−5.95 |
0.022 |
6.65 |
0.000 |
1.49 |
0.145 |
6.27 |
0.043 |
−0.97 |
0.386 |
|
AiAj |
|
AiAi |
9 |
5.08 |
0.193 |
2.97 |
0.277 |
5.76 |
0.032 |
−0.04 |
0.493 |
9.32 |
0.005 |
3.82 |
0.207 |
|
AiAj |
|
AiAj |
46 |
2.59 |
0.195 |
−0.20 |
0.471 |
−11.18 |
0.004 |
2.16 |
0.013 |
−9.55 |
0.004 |
2.69 |
0.177 |
|
qPYP7.1
|
RM234 |
AiAi |
S07101 |
AiAj |
11 |
5.04 |
0.197 |
−4.87 |
0.092 |
6.17 |
0.013 |
−1.01 |
0.352 |
3.51 |
0.180 |
−2.90 |
0.180 |
|
AiAj |
|
AiAi |
10 |
4.62 |
0.199 |
8.82 |
0.042 |
−6.38 |
0.165 |
2.12 |
0.233 |
2.59 |
0.338 |
10.10 |
0.029 |
|
AiAj |
|
AiAj |
72 |
0.16 |
0.476 |
3.24 |
0.098 |
−4.57 |
0.069 |
−0.37 |
0.324 |
0.65 |
0.413 |
6.17 |
0.006 |
|
qPYP8.2
|
S08090 |
AiAi |
S08106 |
AiAj |
20 |
5.29 |
0.056 |
1.56 |
0.349 |
−7.72 |
0.068 |
0.31 |
0.405 |
−0.17 |
0.483 |
11.92 |
0.011 |
|
AiAj |
|
AiAi |
35 |
2.95 |
0.202 |
−1.99 |
0.270 |
1.91 |
0.163 |
0.18 |
0.440 |
1.53 |
0.281 |
−0.15 |
0.475 |
|
AiAj |
|
AiAj |
57 |
4.49 |
0.078 |
0.03 |
0.496 |
−9.38 |
0.004 |
−1.12 |
0.147 |
−3.65 |
0.145 |
7.70 |
0.002 |
Table 5Standardized direct effect of yield-related traits to yield in DT-RILs.
Table 5
|
QTL |
Allele type |
DTHz)
|
PN |
SN |
SF |
TGW |
Most positively effective trait (>0.5 or <−0.5) |
|
qPYP1.1
|
AiAi/AiAi |
0.083 |
0.512 |
0.413 |
−0.436 |
0.108 |
PN |
|
AiAi/AiAj |
−0.287 |
0.241 |
0.242 |
−0.686 |
0.149 |
(SF)a
|
|
AiAj/AiAi |
−0.345 |
0.048 |
0.548 |
−0.499 |
0.124 |
SN |
|
AiAj/AiAj |
0.114 |
0.523 |
0.505 |
−0.542 |
0.191 |
PN and SN |
|
qPYP7.1
|
AiAi/AiAi |
−0.059 |
0.506 |
0.681 |
−0.275 |
0.14 |
PN and SN |
|
AiAi/AiAj |
0.324 |
1.633 |
1.051 |
0.258 |
0.538 |
PN, SN and TGW |
|
AiAj/AiAi |
−0.046 |
0.357 |
0.631 |
−0.272 |
0.047 |
SN |
|
AiAj/AiAj |
−0.005 |
0.551 |
0.281 |
−0.68 |
0.191 |
PN, (SF) |
|
qPYP8.2
|
AiAi/AiAi |
−0.225 |
0.719 |
0.574 |
−0.058 |
0.212 |
PN and SN |
|
AiAi/AiAj |
−0.333 |
0.219 |
0.246 |
−0.828 |
0.131 |
(SF) |
|
AiAj/AiAi |
0.126 |
0.852 |
0.831 |
−0.068 |
0.146 |
PN and SN |
|
AiAj/AiAj |
0.289 |
0.486 |
0.317 |
−0.5 |
0.168 |
(SF) |
|
qGYP5.1
|
AiAi/AiAi |
0.03 |
0.592 |
0.51 |
0.682 |
0.161 |
PN, SN and SF |
|
AiAi/AiAj |
0.24 |
0.759 |
0.266 |
0.199 |
0.256 |
PN |
|
AiAj/AiAi |
−0.264 |
0.842 |
1.042 |
0.623 |
0.252 |
PN, SN and SF |
|
AiAj/AiAj |
−0.074 |
0.331 |
0.344 |
0.961 |
0.095 |
SF |
References
- Abdullah A, Kobayashi H, Matsumura I, Itoh S. 2008. World rice demand towards 2050: Impact of decreasing demand of per capita rice consumption for China and India. pp. 1-17. Hassan A, Nasrudin M, Akhir M, editors. Japan and East Asian Regionalism. Kuala Lumpur: East Asian Studies Department.
- Chin JH, Chu SH, Jiang W, Cho Y-I, Basyirin R, Brar DS, et al. 2011. identification of QTLs for hybrid fertility in inter-subspecific crosses of rice (Oryza sativa L.). Genes Genom. 33: 39-48.
- Chin JH, Kim JH, Jiang W, Chu SH, Woo MO, Han L, et al. 2007. Identification of subspecies-specific STS markers and their association with segregation distortion in rice (Oryza sativa L.). J Crop Sci Biotech. 10: 175-184.
- Cho YG, Kang HJ, Lee JS, Lee YT, Lim SJ, Gauch H, et al. 2007. Identification of quantitative trait loci in rice for yield, yield components, and agronomic traits across years and locations. Crop Sci. 47: 2403-2417.
- Chu SH, Jiang W, Lee J, Chin JH, Koh HJ. 2012. QTL analyses of heterosis for grain and grain yield-related traits in indica-japonica crosses of rice (Oryza sativa L). Genes Genom. 34: 367-377.
- Dan Z, Hu J, Zhou W, Yao G, Zhu R, Huang W, et al. 2015. Hierarchial additive effects on heterosis in rice (Oryza sativa L.). Front Plant Sci. 6: 738
- Dan Z, Liu P, Huang W, Zhou W, Yao G, Hu J, et al. 2014. Balance between a higher degree of heterosis and increased reproductive Isolation: a strategic design for breeding inter-subspecific hybrid rice. PLoS ONE. 9: e9312
- Doi K, Yoshimura A, Iwata N. 1998. RFLP mapping and QTL analysis of heading date and pollen sterility using backcross populations between Oryza sativa L. and Oryza glaberrima Steud. Breed Sci. 48: 395-399.
- FAORAP and APSA (FAO Regional Office for Asia and the Pacific and Asia-Pacific Seed Association)2014. Hybrid rice development in Asia. Assessment of limitations and potential In: Proceedings of the Regional Expert Consultation; Bangkok. 2–3 July 2014; pp 35-46.
- Jiang L, Zhang W, Xia Z, Jiang G, Qian Q, Li A, et al. 2007. A paracentric inversion suppresses genetic recombination at the FON3 locus with breakpoints corresponding to sequence gaps on rice chromosome 11L. Mol Genet Genomics. 277: 263-272.
- Jiang W, Jin Y-M, Lee J, Lee K-I, Piao R, Han L, et al. 2011. Quantitative trait loci for cold tolerance of rice recombinant inbred lines in low temperature environments. Mol Cells. 32: 579-587.
- Li DT, Zhu SS, Jiang L, Wan JM. 2005. Mapping for a new locus causing hybrid sterility in a China landrace (Oryza sativa L.). Rice Genetics Newsletters. 22: 20.
- Li D, Huang Z, Song S, Xin Y, Mao D, Lv Q, et al. 2016. Integrated analysis of phenome, genome transcriptome of hybrid rice uncovered multiple heterosis-related loci for yield increase. Proc Natl Acad Sci USA. 113: E6026-E6035.
- Li L, Lu K, Chen Z, Mu T, Hu Z, Li X. 2008. Dominance, overdominance and epistasis condition the heterosis in two heterotic rice hybrids. Genetics. 180: 1725-1742.
- Li ZK, Luo LJ, Mei HW, Shu QY, Tabien R, Zhong DB, et al. 2001. Overdominant epistatic loci are the primary genetic basis of inbreeding depression and heterosis in rice. I. Biomass and grain yield. Genetics. 158: 1737-1753.
- Li ZK, Yu SB, Lafitte HR, Huang N, Courtois B, Hittalmani S, et al. 2003. QTL × environment interactions in rice. I. heading date and plant height. Theor Appl Genet. 108: 141-153.
- Lin H, Liang ZW, Sasaki T, Yano M. 2003. Fine mapping and characterization of quantitative trait loci Hd4 and Hd5 controlling heading date in rice. Breed Sci. 53: 51-59.
- Luo LJ, Li ZK, Mei HW, Shu QY, Tabien R, Zhong DB, et al. 2001. Overdominant epistatic loci are the primary genetic basis of inbreeding depression and heterosis in rice. II. grain yield components. Genetics. 158: 1755-1771.
- Mei HW, Li ZK, Shu QY, Guo LB, Wang YP, Yu XQ, et al. 2005. Genetic actions of QTLs affecting several agronomic traits resolved in a recombinant inbred rice population and two backcross populations. Theor Appl Genet. 110: 649-659.
- Miura K, Ikeda M, Matsubara A, Song XJ, Ito M, Asano K, et al. 2010. OsSPL14 promotes panicle branching and higher grain productivity in rice. Nat Genet. 42: 545-549.
- Miyata M, Yamamoto T, Komori T, Nitta N. 2007. Marker-assisted selection and evaluation of the QTL for stigma exsertion under japonica rice genetic background. Theor Appl Genet. 114: 539-548.
- Mizuta Y, Harushima Y, Kurata N. 2010. Rice pollen hybrid incompatibility caused by reciprocal gene loss of duplicated genes. Proc Natl Acad Sci USA. 107: 20417-20422.
- Reflinur , Chin JH, Jang SM, Kim B, Lee J, Koh HJ. 2012. QTLs for hybrid fertility and their association with female and male sterility in rice. Genes Genom. 34: 355-365.
- Rogers SO, Bendich AJ. 1988. Extraction of DNA from plant tissues. Plant Mol Biol Man. 6: 1-10.
- Shen B, Zhunag JY, Zhang KQ, Xia QQ, Sheng CX, Zheng KL. 2003. QTLs mapping of leaf traits and root vitality in a recombinant inbred line population of rice. Yi Chuan Xue Bao. 30: 1133-1139.
- Shen G, Zhan W, Chen H, Xing Y. 2014. Dominance and epistasis are the main contributors to heterosis for plant height in rice. Plant Sci. 215: 11-18.
- Sobrizal , Matsuzaki Y, Sanchez PL, Ikeda K, Yoshimura A. 2000. Mapping of F1 pollen semi-sterility gene found in backcross progeny of Oryza sativa L. and Oryza glumaepatula Steud. Rice Genetics Newsletters. 17: 61-62.
- Song X, Qiu SQ, Xu CG, Li XH, Zhang Q. 2005. Genetic dissection of embryo sac fertility, pollen fertility, and their contributions to spikelet fertility of intersubspecific hybrids in rice. Theor Appl Genet. 110: 205-211.
- Stam P. 1993. Construction of integrated genetic linkage maps by means of a new computer package: Join Map. Plant J. 3: 739-744.
- Tan XL, Vanavichit A, Amornsilpa S, Trangoonrung S. 1998. Genetic analysis of rice CMS-WA fertility restoration based on QTL mapping. Theor Appl Genet. 97: 994-999.
- Tao Y, Zhu J, Xu J, Wang L, Gu H, Zhou R, et al. 2016. Exploitation of heterosis loci for yield and yield components in rice using chromosome segment substitution lines. Sci Rep. 6: 36802
- Tian F, Li DJ, Fu Q, Zhu ZF, Fu YC, Wang XK, et al. 2006. Construction of introgression lines carrying wild rice (Oryza rufipogon Griff.) segments in cultivated rice (Oryza sativa L.) background and characterization of introgressed segments associated with yield-related traits. Theor Appl Genet. 112: 570-580.
- Venu RC, Jia JMY, Liu G, Jia MH, Nobuta K, Sreerekha MV, et al. 2014. Identification of candidate genes associated with positive and negative heterosis in rice. PLoS ONE. 9: e95178
- Wang DL, Zhu J, Li ZK, Paterson AH. 1999. Mapping QTLs with epistatic effects and QTL x environment interactions by mixed linear model approaches. Theor Appl Genet. 99: 1255-1264.
- Xin XY, Wang WX, Yang JS, Luo XJ. 2011. Genetic analysis of heterotic loci detected in a cross between indica and japonica rice (Oryza sativa L.). Breed Sci. 61: 380-388.
- Yan CJ, Liang GH, Gu SL, Yi CD, Lu JF, Li X, et al. 2003. Molecular marker analysis and genetic basis for sterility of typical indica/japonica hybrids. Yi Chuan Xue Bao. 30: 267-276.
- Yan CJ, Liang GH, Zhu LH, Gu MH. 2000. RFLP analysis on wide compatibility genes in rice variety dular of ecotype aus. Yi Chuan Xue Bao. 27: 409-417.
- Yu SB, Li JX, Xu CG, Tan YF, Gao YJ, Li XH, et al. 1997. Importance of epistasis as the genetic basis of heterosis in an elite rice hybrid. Proc Natl Acad Sci USA. 94: 9226-9231.
- Yu SB, Li JX, Xu CG, Tan YF, Li XH, Zhang Q. 2002. Identification of quantitative trait loci and epistatic interactions for plant height and heading date in rice. Theor Appl Genet. 104: 619-625.
- Zhuang JY, Fan YY, Wu JL, Xia YW, Zheng KL. 2001. Comparison of the detection of QTL for yield traits in different generations of a rice cross using two mapping approaches. Yi Chuan Xue Bao. 28: 458-464.