Abstract
Finger millet (Eleusine coracana L. Gaertn.) is an important cereal crop in eastern Africa and southern India with excellent grain storage capacity and the unique ability to thrive in extreme environmental conditions. In this study, we analyzed the genetic diversity and population structure of finger millet using 12 developed microsatellites. By sequencing 815 clones from an SSR-enriched genomic DNA library, we obtained 12 polymorphic SSR markers, which also revealed successful amplicons in finger millet accessions. Using the developed SSR markers, we estimated genetic diversity and population structure among 76 finger millet accessions in Asia, Africa, and unknown origins. The number of alleles ranged from 2 to 9, with an average of 3.3 alleles. The mean values of observed heterozygosity and expected heterozygosity were 0.27 and 0.35, respectively. The average polymorphism information content was 0.301 in all 76 finger millet accessions. AMOVA analysis showed that the percentage of molecular variance among the populations was 1%, that among individuals was 5%, and that within individuals was 94%. In STRUCTURE analysis, the 76 finger millet accessions were divided into two subpopulations which had an admixture of alleles. There was a correspondence among PCoA, AMOVA, and population structure. This study may form the basis for a finger millet breeding and improvement program.
-
Key words: AMOVA, Finger millet, PCoA, SSR marker, STRUCTRUE
INTRODUCTION
Micronutrient deficiency is recognized as a serious human health problem worldwide (
Kanatti et al. 2014). Finger millet (
Eleusine coracana L. Gaerth.), a highly self-pollinating crop, is a good source of micronutrients like iron and zinc (
Ramakrishnan et al. 2016). In many developing countries, finger millet can be an authoritative driver for economic development through the creation of local food and beverage processing industries (
Taylor and Shewry 2006). Increasing attention is being paid in recent days to improving finger millet owing to its rich nutritional profile, its inherent capacity to tolerate several biotic and abiotic stressors, and its ability to grow in marginal soil with low fertility (
Babu et al. 2007).
Genetic diversity offers opportunities to utilize various genomic resources and technologies to manipulate desirable traits (
Kalyana Babu et al. 2014). Characterization of genetic diversity among genotypes has been a major goal for crop improvement (
Laurentin 2009;
Dong et al. 2014;
Yaman et al. 2014;
Zhang et al. 2014). Various molecular markers are being used, such as RFLP, RAPD, AFLP, and SSR, to evaluate the genetic diversity of different crop species (
Ramakrishnan et al. 2016). Genetic diversity of finger millet has also been assessed using different molecular markers, but these studies are limited and more and more germplasm needs to be characterized at the molecular level for identification of diverse germplasm links/subpopulations to use in crop improvement (
Arya et al. 2013).
SSR markers are one of the most valuable molecular markers owing to their high level of potential polymorphisms, locus-specificity, multi-allelic traits, co-dominant nature, high abundance, wide genome coverage, and reproducibility (
Powell et al. 1996). They are amenable to high-throughput genotyping, thus suitable for diversity analysis (
Wang et al. 2011; Hua
et al. 2015). SSR markers have been used successfully to evaluate genetic diversity among several species, including finger millet, foxtail millet, and proso millet (
Cho et al. 2010;
Kim et al. 2012;
Zhao et al. 2012).
In this study, the distribution and variation in size of microsatellites within the DNA sequence of the finger millet genome were characterized. Our goal was to develop new SSR markers to assess the genetic relationships among finger millet accessions. Our study not only provides a means of understanding the genetic relatedness and structure of finger millet accessions, but is also helpful for finger millet breeding and germplasm conservation.
MATERIALS AND METHODS
Plant materials
The 76 finger millet accessions used in this study were obtained from the Korea Genebank Rural Development Administration (
Supplementary Table 1). Leaf samples were collected from five to six plants on the field. Genomic DNA was extracted from leaves using the modified CTAB method (
Zhao et al. 2013), and the final DNA concentration was adjusted to 20 ng/μL with a NanoDrop ND-1000 spectrometer (Wilmington, DE, USA).
A microsatellite-motif enrichment library was constructed using the modified biotin-streptavidin capture method with genomic DNA from finger millet (
Ma et al. 2009). Briefly, genomic DNA was digested using six restriction enzymes,
AluI,
DraI,
HaeIII,
RsaI,
EcoRV, and
NruI. The digested DNA was size-fractionated on a 1.2% agarose gel and fragments ranging from 300 bp to 1,500 bp were eluted from the gel. After adaptor ligation and PCR amplification, the DNA fragments were hybridized with a mixture of the following biotin-labeled SSR probes: (GA)
20, (CA)
20, (AT)
20, (GC)
20, (AGC)
15, (GGC)
15, (AAG)
15, (AAC)
15, and (AGG)
15. The hybridized DNA fragments were captured with streptavidin-coated magnetic beads (Promega, Madison, WI, USA) and were cloned into the pGEM-T Easy vector (Promega). In total, 815 white colonies were randomly picked and sequenced in an ABI 3100 DNA sequencer (Applied Biosystems, Foster City, CA, USA), and SSR MANAGER was used to find SSR motifs and design primer pairs (
Kim 2004).
The “M13 tail at its 5′ end” PCR method was used to measure the size of the PCR products (
Schuelke 2000). PCR amplification was carried out in a total volume of 20 μl containing 2 μL of genomic DNA (10 ng/μL), 0.2 μL of the specific primer (10 pmol/μL), 0.4 μL of M13 universal primer (10 pmol/μL), 0.6 μL of normal reverse primer, 2.0 μL of 10× PCR buffer (Takara, Tokyo, Japan), 1.6 μL of dNTPs (2.5 mM), and 0.2 μL of
Taq DNA polymerase (5 units/μL; Takara). The conditions used for the PCR amplification were as follows: 94°C (3 minutes), followed by 30–33 cycles at 94°C (30 seconds), 50–55°C (45 seconds), and 72°C (45 seconds), then 15 cycles at 94°C (30 seconds), 53°C (45 seconds), and 72°C (45 seconds), and a final extension at 72°C for 20 minutes. PCR was carried out in PTC-220 thermocyclers (MJ Research, Waltham, MA, USA). The PCR products of three microsatellites were mixed together in a ratio of 6-FAM:HEX:NED (fluorescent dyes) = 1 : 3 : 4, which was varied depending on the amplification intensity of the individual markers as determined on an ABI PRISM 3130xl Genetic Analyzer (Applied Biosystems). PCR products labeled with HEX and NED were added in higher amounts, whereas those labeled with FAM were added in lower amounts because of the different signal intensities of the three fluorescent dyes. The mixed PCR product (1.5 μL) was combined with 9.2 μL of Hi-Di formamide and 0.3 μL of an internal size standard, Genescan-500 ROX (6-carbon-X-rhodamine) as a molecular size standard (35–500 bp). The samples were denatured at 94°C for 3 minutes and analyzed with an ABI PRISM 3130xl Genetic Analyzer (Applied Biosystems). The molecular weights, in base pairs, of the microsatellite products were estimated with Genescan software ver. 3.7 (Applied Biosystems) using the local Southern method. Individual fragments were assigned as alleles of the appropriate microsatellite loci with Genotyper software ver. 3.7 (Applied Biosystems).
The total number of alleles, allele frequency, genetic diversity, and polymorphism information content (PIC) per individual SSR locus were calculated with PowerMarker version 3.25 (
Liu and Muse 2005). A dendrogram was constructed with an unweighted pair group method with an arithmetic mean (UPGMA) to visualize the phylogenetic distribution of accessions using MEGA version 5.03 software (
Tamanna and Khan 2005). Principal co-ordinate analysis (PCoA) in GenAlEx 6.5 was used to further examine the genetic relationships among the detected populations on the basis of the SSR data (
Peakall and Smouse 2012). STRUCTURE software (V2.3.4) was used to detect possible subpopulations (K = 1 to K = 10) with a model allowing for admixture and correlated allele frequencies using a burn-in period of 50,000 and MCMC repeats of 50,000 followed by three iterations (
Pritchard et al. 2000). The optimal number of populations corresponded to the highest peak in the ΔK graph and accessions with membership probabilities ≥ 70% were assigned to subpopulations (
Evanno et al. 2005).
RESULTS
Simple sequence repeats in finger millet
A total of 815 clones from an SSR-enriched genomic DNA library were sequenced, of which 14 (1.72%) were redundant. Of the 801 independent clones, 158 (19.7%) contained SSR motifs (
Table 1). Tri-nucleotide repeats (TNRs) were the most abundant motifs, accounting for 55.7% of all SSRs (
Table 1). Mono-nucleotide repeats (MNRs), di-nucleotide repeats (DNRs), tetra-nucleotide repeats (TtNRs), penta-nucleotide repeats (PNRs), and hexa-nucleotide repeats (HNRs) accounted for 0.6, 40.5, 0.6, 0.6, and 1.9% of all SSRs, respectively. Among the TNRs, CCG/CGG was the most abundant (15.2%), followed by AAC/GTT (12.7%) and AGG/CCT (11.4%). By contrast, ATC/GAT repeats were rather rare, accounting for only 0.6% of all TNRs. Of the DNRs, AG/CT was the most abundant (26.6%), followed by CT/AC (12.0%). MNRs, TtNRs, and PNRs were present in only one clone, while there were three HNR repeats (CAAAGA, GAAAGA, and GAGTGA). In addition, AG/CT was the most predominant motif overall, accounting for 26.6% of all SSRs.
From the 158 unique SSR clones, we acquired 12 polymorphic SSR markers in diverse finger millet accessions. The number of alleles for each SSR ranged from 2 to 9, with an average of 3.3 alleles per SSR (
Table 2). To measure the informativeness of these markers, we assessed the polymorphism information content (PIC) for each SSR locus. The PIC values varied from 0.013 to 0.717, with an average of 0.301 (
Table 2). Based on the PIC value, GB-FM-53 was the most informative, with a value of 0.717. The average number of effective alleles per SSR ranged from 1.01 to 3.98, with a mean of 1.75 alleles per SSR. The Shannon index ranged from 0.04 to 1.66, with an average of 0.61. The expected heterozygosity ranged from 0.01 for GB-FM-81 to 0.75 for GB-FM-53, with an average of 0.35. The observed heterozygosity varied from 0.00 for GM-FM-39, GB-FM-122, and GB-FM-117 to 1.00 for GB-FM-70, with a mean of 0.27.
The number of alleles (Na) was 2.500, 2.000, and 2.833 in Asia (AS), Africa (AF), and accessions of unknown origin (Un), respectively (
Table 3). The Shannon index (I) of AS, AF, and Un were 0.545, 0.459, and 0.649, respectively. The observed heterozygosity (Ho) and expected heterozygosity (He) of AS, AF, and Un were 0.280, 0.260, and 0.267 and 0.333, 0.283, and 0.375, respectively. The PIC values of AS, AF, and Un were 0.286, 0.301, and 0.263, respectively.
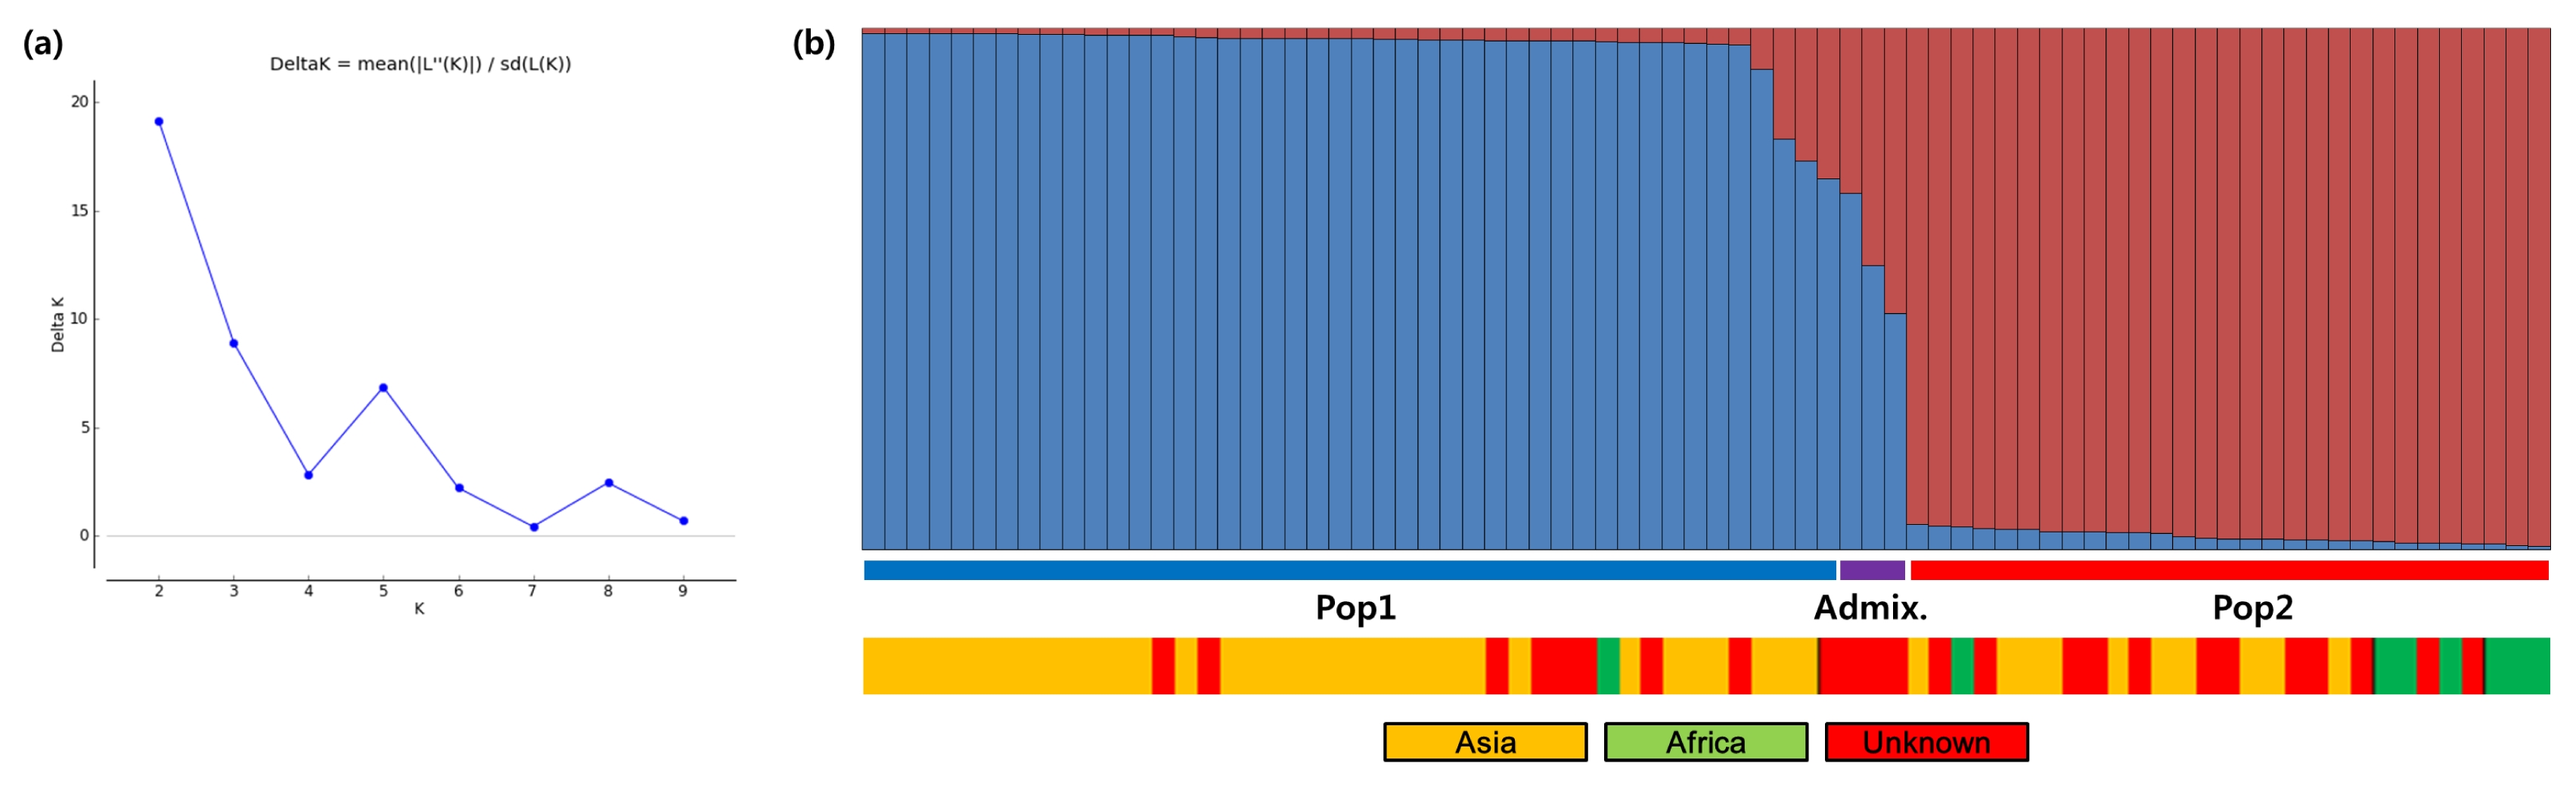
The inferred population structures are given in
Fig. 1. By comparing LnP(D) and Evanno’s
ΔK values by increasing
K from 1 to 10, we found that LnP(D) values increased with
K, with the highest log likelihood score at
K = 2, while the
ΔK value was also the highest at
K = 2 (
Fig. 1a). This indicates that these 76 finger millet accessions fit into two genetic subpopulations. Pop1 has 44 finger millets accessions, including 34 Asian, one African, and nine unknown accessions. Pop2 consists of a total of 29 accessions, including 10 Asian, seven African, and 12 unknown accessions. Altogether, three admixture accessions (with < 70% of inferred ancestry from any one group), FM-26, FM-27, and FM-28, were identified in this population. Between the two STRUCTURE subpopulations, all population 2 (Pop2) parameters were higher than those of population 1 (Pop1), except Ho and PIC. Analysis of molecular variance (AMOVA) showed that 4% of the observed variation was attributable to variation among populations (
Table 4). Approximately 74% of the total genetic variance was explained by differences within individuals, with 22% of the variation being among individuals.
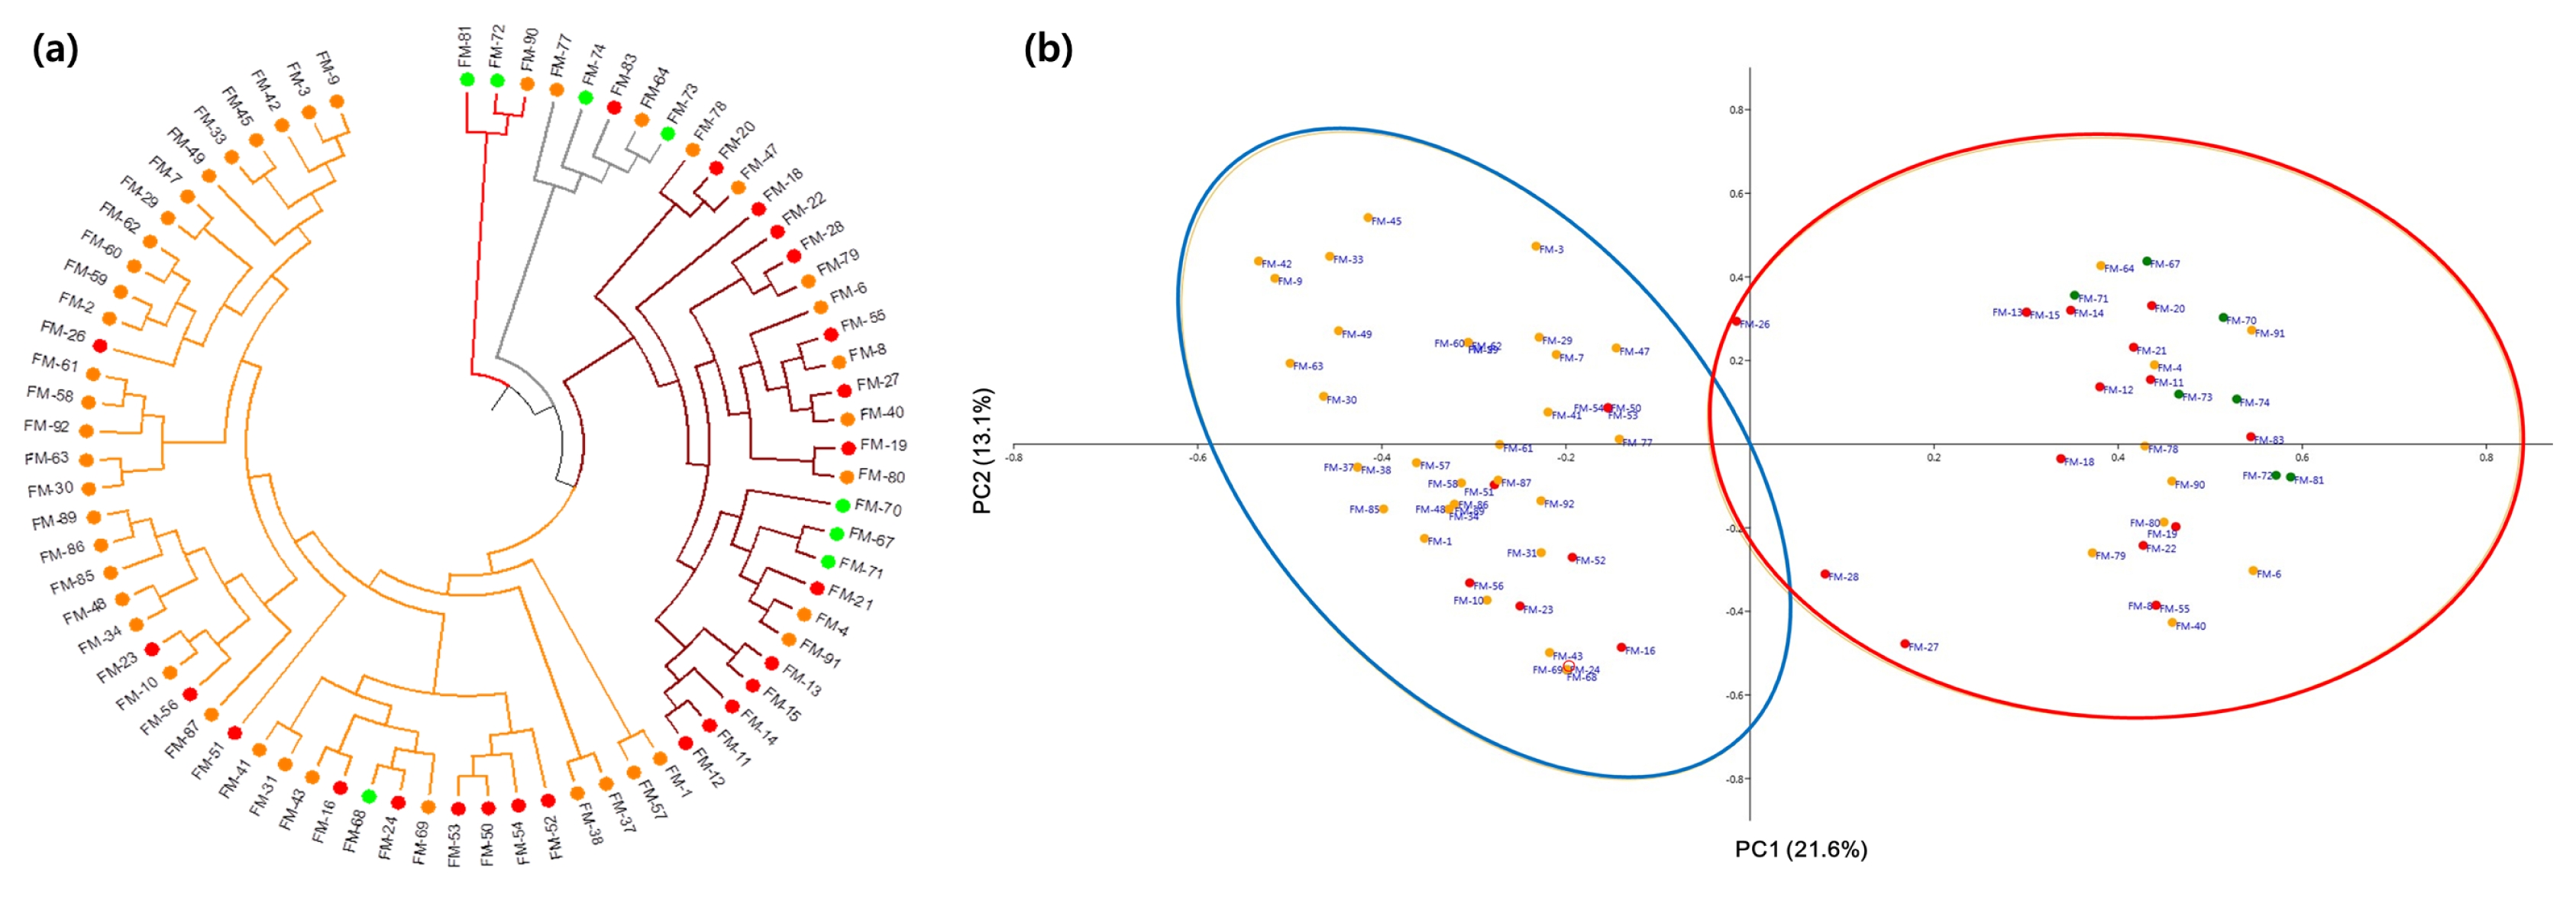
Cluster analysis using the unweighted pair group method with arithmetic mean (UPGMA) detected four clusters (
Fig. 2a). Cluster 1 consisted of 43 finger millet accessions, including 32 Asian, one African, and 10 unknown accessions. Cluster 2 was comprised of nine Asian, three African, and 13 unknown accessions. Clusters 3 and 4 consisted of five and three accessions, including two Asian, two African, and one unknown accession and one Asian and two African accessions, respectively. Upon labelling the accessions according to their inferred STUCTURE ancestry, we found no exact matches between the results of UPGMA clustering and STRUCTURE analysis. However, the PCoA results were consistent with the STRUCTURE results (
Fig. 2b). In PCoA, the first two coordinates clearly divided the two STRUCTURE subpopulations.
DISCUSSION
In this study, we evaluated the genetic diversity and population structure of 76 finger millet accessions collected from Asia, Africa, and unknown regions using 12 SSR markers. Finger millet is a major crop in less developed countries like Asia and Africa (
Dwivedi et al. 2011). The crop is highly valued in part for its nutritional content; it is especially calcium rich and contains amino acids which are often absent in starch-based diets (
Goron and Raizada 2015). However, there are no reports available on genetic diversity analysis using SSR markers with a significant degree of polymorphism in Korea. This is the first study to date to detail finger millet genotypes and to analyze and compare them in a considerable number of accessions collected from two major regions and unknown origins that aimed to characterize diversity at the molecular level in finger millet genotypes.
SSR markers are very useful when analyzing species with low levels of genetic variation, inbred populations, and recently derived or geographically close populations where differentiation may be difficult using other molecular approaches (
Weising et al. 2005). There are few reports of the utilization of SSR markers to characterize finger millet varieties because a limited number of SSR markers have been developed for finger millet (
Naga et al. 2012). In this study, we analyzed the distribution of microsatellites with 2–6 bp motifs and provided 12 SSR markers for finger millet. Also, SSR markers revealed a higher than average number of alleles, with 3.3 alleles per locus (
Table 2).
Arya et al. (2013) and
Panwar et al. (2010) reported an average of 1.02 and 0.84 alleles, respectively, per finger millet genotype using SSR markers. In addition,
Babu et al. (2014) and
Ramakrishnan et al. (2016) reported an average of 0.7 and 1.06 allele per finger millet genotype. The PIC values in this study ranged from 0.013 to 0.717; the average PIC value was 0.301 (
Table 2). These values are lower than those reported in previous studies; from 0.292 to 0.703 (
Kalyana Babu et al. 2014), 0.274 to 0.758 (
Panwar et al. 2010), and 0.196 to 0.834 (
Bharathi 2011). The high average PIC value for SSRs have been mainly reported with diverse germplasm lines because they are genetically more diverse compared to varieties. PIC depends upon many factors such as breeding behavior of the species, genetic diversity in the collection, size of the collection, sensitivity of genotyping method and location of primers in the genome used for study (
Singh et al. 2013). This study provides important new SSR markers and reveals the population genetic structure of 76 finger millet accessions. These results will be helpful for the evaluation of germplasm resources for breeding.
AMOVA analysis showed that the percentage of molecular variance among the various populations, among individuals, and within individuals were 4, 22, and 74%, respectively (
Table 4). This is in agreement with a previous report (
Babu et al. 2014) that found 73% variance within individuals and 27% variance among individuals in 190 finger millet genotypes. Similar results were found in 128 genotypes of finger millet, in which 94% of the total variance was identified and attributed to divergence within individuals and only 5% was attributed to divergence among individuals (
Ramakrishnan et al. 2016). AMOVA analysis showed significant differences between genotypes and also produced a greater percentage of molecular variance among the populations, among individuals, and within individuals. This is due to the self-pollinating nature of finger millet (
Ramakrishnan et al. 2016). It was also shown by population structure analysis that these populations are genetically isolated from one another. There was good correspondence between the AMOVA results and the population structure in terms of differentiating the finger millet genotypes into different clusters (
Ramakrishnan et al. 2016).
Structure analysis showed a maximum
ΔK value of
K = 2, and 76 accessions were divided into two subpopulations (Pop1 and Pop2). In this study, using SSR markers, two subpopulations had an admixture of alleles, FM-26, FM-27, and FM-28, although three accessions had origins that could not be confirmed. This is in agreement with a previous report by (
Dida et al. 2008), who observed an admixture of African and Asian alleles of finger millet genotypes using 45 SSR markers. Similarly (
Babu et al. 2014), identified four subpopulations among 190 finger millet genotypes using 74 genic SSR makers with an admixture of alleles from other populations. PCoA and AMOVA analysis showed that populations have a reliable genetic relationship, high intra-population variation, and strong genetic structure, which indicated that these two populations were genetically isolated from each other.
According to the results of STRUCTURE, Pop1 and Pop2 were mixed between the Asian and African finger millets, since many accessions of unknown origin were contained in our study.
Dida et al. (2008) reported that the geographic patterning observed in the phylogenetic tree corresponded to the population structure identified using STRUCTURE in 79 finger millets, although some accessions fell within the other subpopulations. They described that some Asian accessions that were grouped with the African subpopulation have been bred for the Northern India, Pakistan, and Nepal; They might be selections from recent introductions from the African highlands. Also, a few admixture accessions between Asian and African germplasms were a selection from the progeny of a cross between Asian and African accessions in agriculture institutes, EAAFRO and ICRISAT (
Dida et al. 2008). We suggest that the 76 finger millet accessions in this study were collected from Asia and Africa countries and they were already interchanged among many countries
In conclusion, we have uncovered 12 SSR markers in finger millet and confirmed that all 76 studied finger millet accessions were genetically diverse and were clustered into two subpopulations. Data generated by this study may be utilized for mapping of important agronomical traits for breeding programs to improve the finger millet.
Supplementary Information
ACKNOWLEDGEMENTS
This study was carried out with the support of the “Research Program for Agricultural Science & Technology Development (Project No. PJ010106)”. It was also supported by the 2016 Postdoctoral Fellowship Program of the National Institute of Agricultural Science funded by the Rural Development Administration, Republic of Korea.
Fig. 1Population genetic structures and relationships between 76 finger millet accessions. (a) Values of ΔK, with its modal value detecting a true K of two groups (K = 2). (b) The two subgroups inferred from STRUCTURE analysis.

Fig. 2Genetic grouping of 76 finger millet accessions. (a) Clustering analysis using the unweighted pair group method with arithmetic mean (UPGMA) and (b) principal coordinate analysis. In both (a and b), the accessions have been color coded: orange, Asian; green, African; red, unknown.

Table 1Distribution of the major SSR motifs identified in finger millet.
Table 1
|
Repeat unit |
Motif type |
No. of clones |
Frequency (%) |
|
Monomer |
G/C |
1 |
0.6 |
|
Dimer |
AG/CT |
42 |
26.6 |
|
CG/AC |
2 |
1.3 |
|
GT/AC |
1 |
0.6 |
|
CT/AG |
19 |
12.0 |
|
Sub-total |
64 |
40.5 |
|
Trimer |
AAC/GTT |
20 |
12.7 |
|
AAG/CTT |
7 |
4.4 |
|
ACC/GGT |
6 |
3.8 |
|
ACG/CGT |
3 |
1.9 |
|
AGC/GCT |
7 |
4.4 |
|
AGG/CCT |
18 |
11.4 |
|
ATC/GAT |
1 |
0.6 |
|
ATG/CAT |
2 |
1.3 |
|
CCG/CGG |
24 |
15.2 |
|
Sub-total |
88 |
55.7 |
|
Tetramer |
ATCG |
1 |
0.6 |
|
Pentamer |
CCCTT |
1 |
0.6 |
|
Hexamer |
CAAAGA |
1 |
0.6 |
|
GAAAGA |
1 |
0.6 |
|
GAGTGA |
1 |
0.6 |
|
Sub-total |
3 |
1.9 |
|
Total |
158 |
|
Table 2SSR markers assayed in the characterization of finger millet.
Table 2
|
Name |
R-motif |
Forward primer |
Reverse primer |
Naz)
|
Ne |
I |
Ho |
He |
PIC |
|
GB-FM-39 |
CGT |
CACCAAAACTGGCTCTGC |
TCAAAAAGCCCGTAGCAA |
2 |
1.08 |
0.17 |
0.00 |
0.08 |
0.073 |
|
GB-FM-53 |
AG |
TTCAGAATCCGTTCGTGC |
CTGCCTTTGAATAGTTCACCA |
9 |
3.98 |
1.66 |
0.01 |
0.75 |
0.717 |
|
GB-FM-67 |
AG |
CAGCTCTGGTGAGGTCCA |
CAACTCTCCACCCTGTGC |
3 |
1.69 |
0.63 |
0.54 |
0.41 |
0.331 |
|
GB-FM-70 |
CTG |
GAAGGTGGGAACCGTCTC |
ACCCAGCTCATGAAAGCC |
4 |
2.22 |
0.89 |
1.00 |
0.55 |
0.447 |
|
GB-FM-81 |
GTT |
CAGCTGGGAAACGAACAG |
TCGCCAGAGAATGTACAGC |
2 |
1.01 |
0.04 |
0.01 |
0.01 |
0.013 |
|
GB-FM-86 |
ACG |
CATCACGACGGACGAAAT |
CTGACAGCCGATTCTTCG |
2 |
1.73 |
0.61 |
0.61 |
0.42 |
0.333 |
|
GB-FM-92 |
CCT |
GTAGTTGCCGAACCCGAC |
CGGTCACAGCATCCAAAT |
2 |
1.53 |
0.53 |
0.45 |
0.35 |
0.287 |
|
GB-FM-103 |
AG |
CAGAAGCCCTGCTGTTTG |
CTCCTCTCCCGATGGC |
2 |
1.35 |
0.42 |
0.01 |
0.26 |
0.224 |
|
GB-FM-87 |
CGG |
CGATGGCAATCGACTCTC |
AAACGTAACCGTCCTCGC |
2 |
1.93 |
0.68 |
0.04 |
0.48 |
0.366 |
|
GB-FM-98 |
CGG |
CTGGACAGGTCCTGGATG |
ATCTGACGATCCCGTTCC |
2 |
1.75 |
0.62 |
0.62 |
0.43 |
0.336 |
|
GB-FM-122 |
AG |
CGGAGCCAGCAATGAG |
TGCCTGCCACTAAAGGTG |
5 |
1.53 |
0.70 |
0.00 |
0.35 |
0.322 |
|
GB-FM-117 |
AG |
GGACGAGGTAGACTGGGG |
CACGCCCCTCGAACA |
4 |
1.21 |
0.38 |
0.00 |
0.17 |
0.165 |
|
|
Mean |
|
|
|
3.3 |
1.75 |
0.61 |
0.27 |
0.35 |
0.301 |
Table 3Genetic diversity of finger millet populations.
Table 3
|
Naz)
|
Ne |
I |
Ho |
He |
PIC |
|
Originy)
|
|
AS |
2.500 |
1.637 |
0.545 |
0.280 |
0.333 |
0.286 |
|
AF |
2.000 |
1.601 |
0.459 |
0.260 |
0.283 |
0.301 |
|
Un |
2.833 |
1.988 |
0.649 |
0.267 |
0.375 |
0.263 |
|
STRUCTURE subpopulations (K = 2) |
|
Pop1 |
2.500 |
1.637 |
0.545 |
0.280 |
0.333 |
0.273 |
|
Pop2 |
2.917 |
1.953 |
0.643 |
0.273 |
0.369 |
0.255 |
Table 4Summary of analysis of molecular variance (AMOVA) results.
Table 4
|
Source |
dfz)
|
SS |
MS |
Est. Var. |
% |
Fst |
P value |
|
Among Pops |
2 |
11.961 |
5.981 |
0.079 |
4% |
0.036 |
< 0.003 |
|
Among Indiv |
73 |
192.670 |
2.639 |
0.497 |
22% |
|
|
|
Within Indiv |
76 |
125.000 |
1.645 |
1.645 |
74% |
|
|
|
Total |
151 |
329.632 |
|
2.221 |
100% |
|
|
References
- Arya L, Verma M, Gupta VK, Seetharam A. 2013. Use of genomic and genic SSR markers for assessing genetic diversity and population structure in Indian and African finger millet (Eleusine coracana (L.) Gaertn.) germplasm. Plant Syst Evol. 299: 1395-1401.
- Babu BK, Agrawal PK, Pandey D, Kumar A. 2014. Comparative genomics and association mapping approaches for opaque2 modifier genes in finger millet accessions using genic, genomic and candidate gene-based simple sequence repeat markers. Mol Breed. 34: 1261-1279.
- Babu BK, Senthil N, Gomez SM, Biji KR, Rajendraprasad NS, Kumar SS, et al. 2007. Assessment of genetic diversity among finger millet (Eleusine coracana (L.) Gaertn.) accessions using molecular markers. Genet Resour Crop Evol. 54: 399-404.
- Bharathi A. 2011. Phenotypic and genotypic diversity of global finger millet (Eleusine coracana (L.) Gaertn.) composite collection. Tamil Nadu Agricultural University.
- Cho Y-I, Chung JW, Lee G-A, Ma K-H, Dixit A, Gwag J-G, et al. 2010. Development and characterization of twenty-five new polymorphic microsatellite markers in proso millet (Panicum miliaceum L.). Genes Genom. 32: 267-273.
- Dida MM, Wanyera N, Dunn MLH, Bennetzen JL, Devos KM. 2008. Population structure and diversity in finger millet (Eleusine coracana) germplasm. Trop Plant Biol. 1: 131-141.
- Dong D, Fu X, Yuan F, Chen P, Zhu S, Li B, et al. 2014. Genetic diversity and population structure of vegetable soybean (Glycine max (L.) Merr.) in China as revealed by SSR markers. Genet Resour Crop Evol. 61: 173-183.
- Dwivedi S, Upadhyaya H, Senthilvel S, Hash C, Fukunaga K, Diao X, et al. 2011. Millets: Genetic and genomic resources. pp. 247-375. Janick J, editor. Plant breeding reviews. 35: John Wiley & Sons, Inc. Hoboken, NJ, USA:
- Evanno G, Regnaut S, Goudet J. 2005. Detecting the number of clusters of individuals using the software structure: a simulation study. Mol Ecol. 14: 2611-2620.
- Goron TL, Raizada MN. 2015. Genetic diversity and genomic resources available for the small millet crops to accelerate a New Green Revolution. Front Plant Sci. 6: 157
- Hua W, Zhang X, Zhu J, Shang Y, Wang J, Jia Q, et al. A study of genetic diversity of colored barley (Hordeum vulgare L.) using SSR markers. Genet Resour Crop Evol. 62: 395-406.
- Kalyana Babu B, Agrawal PK, Pandey D, Jaiswal JP, Kumar A. 2014. Association mapping of agro-morphological characters among the global collection of finger millet genotypes using genomic SSR markers. Mol Biol Rep. 41: 5287-5297.
- Kanatti A, Rai KN, Radhika K, Govindaraj M, Sahrawat KL, Rao AS. 2014. Grain iron and zinc density in pearl millet: combining ability, heterosis and association with grain yield and grain size. SpringerPlus. 3: 763
- Kim E, Sa K, Park K-C, Lee J. 2012. Study of genetic diversity and relationships among accessions of foxtail millet [Setaria italica (L.) P. Beauv.] in Korea, China, and Pakistan using SSR markers. Genes Genomics. 34: 529-538.
- Kim KW. 2004. Developing one step program (SSR manager) for rapid identification of clones with SSRs and primer designing. Master’s thesis Seoul National University.
- Laurentin H. 2009. Data analysis for molecular characterization of plant genetic resources. Genet Resour Crop Evol. 56: 277-292.
- Liu KJ, Muse SV. 2005. PowerMarker: an integrated analysis environment for genetic marker analysis. Bioinformatics. 21: 2128-2129.
- Ma KH, Kim NS, Lee G-A, Lee SY, Lee JK, Yi JY, et al. 2009. Development of SSR markers for studies of diversity in the genus Fagopyrum. Theor Appl Genet. 119: 1247-1254.
- Naga BLRI, Mangamoori LN, Subramanyam S. 2012. Identification and characterization of EST-SSRs in finger millet (Eleusine coracana (L.) Gaertn.). J Crop Sci Biotechnol. 15: 9-16.
- Panwar P, Saini RK, Sharma N, Yadav D, Kumar A. 2010. Efficiency of RAPD, SSR and Cytochrome P450 gene based markers in accessing genetic variability amongst finger millet (Eleusine coracana) accessions. Mol Biol Rep. 37: 4075-4082.
- Peakall R, Smouse PE. 2012. GenAlEx 6.5: genetic analysis in Excel. Population genetic software for teaching and research—an update. Bioinformatics. 28: 2537-2539.
- Powell W, Morgante M, Andre C, Hanafey M, Vogel J, Tingey S, Rafalski A. 1996. The comparison of RFLP, RAPD, AFLP and SSR (microsatellite) markers for germplasm analysis. Mol Breed. 2: 225-238.
- Pritchard JK, Stephens M, Donnelly P. 2000. Inference of population structure using multilocus genotype data. Genetics. 155: 945-959.
- Ramakrishnan M, Antony Ceasar S, Duraipandiyan V, Al-Dhabi NA, Ignacimuthu S. 2016. Assessment of genetic diversity, population structure and relationships in Indian and non-Indian genotypes of finger millet (Eleusine coracana (L.) Gaertn) using genomic SSR markers. SpringerPlus. 5: 120
- Singh N, Choudhury RC, Singh AK, Kumar S, Srinivasan K, Tyagi RK, et al. 2013. Comparison of SSR and SNP markers in estimation of genetic diversity and population structure of Indian rice varieties. PLoS One. 8: e84136
- Schuelke M. 2000. An economic method for the fluorescent labeling of PCR fragments. Nat Biotech. 18: 233-234.
- Tamanna A, Khan AU. 2005. Mapping and analysis of simple sequence repeats in the Arabidopsis thaliana Genome. Bioinformation. 1: 64-68.
- Taylor J, Shewry P. 2006. Preface to sorghum and millets reviews. J Cereal Sci. 44: 223
- Wang YW, Samuels TD, Wu YQ. 2011. Development of 1,030 genomic SSR markers in switchgrass. Theor Appl Genet. 122: 677-686.
- Weising K, Nybom H, Wolff K, Kahl G. 2005. DNA Fingerprinting in plants: Principles, methods, and applications. Second edtion. CRC Press. Boca Raton, FL: pp. 235-276.
- Yaman H, Tarıkahya-Hacıoğlu B, Arslan Y, Subaşı I. 2014. Molecular characterization of the wild relatives of safflower (Carthamus tinctorius L.) in Turkey as revealed by ISSRs. Genet Resour Crop Evol. 61: 595-602.
- Zhang Q-P, Liu D-C, Liu S, Liu N, Wei X, Zhang A-M, et al. 2014. Genetic diversity and relationships of common apricot (Prunus armeniaca L.) in China based on simple sequence repeat (SSR) markers. Genet Resour Crop Evol. 61: 357-368.
- Zhao W, Lee G-A, Kwon S-W, Ma K-H, Lee M-C, Park Y-J. 2012. Development and use of novel SSR markers for molecular genetic diversity in Italian millet (Setaria italica L.). Genes Genomics. 34: 51-57.
- Zhao W-G, Chung J-W, Kwon S-W, Lee J-H, Ma K-H, Park Y-J. 2013. Association analysis of physicochemical traits on eating quality in rice (Oryza sativa L.). Euphytica. 191: 9-21.