Abstract
Simple sequence repeats (SSRs) have been the marker of choice for rice molecular breeding due to the high level of polymorphism, technical simplicity and low cost. Recent advances in rice genomics have led to the discovery of abundant single nucleotide polymorphism (SNPs) which have enormous potential for rice molecular breeding. To assess both marker systems for molecular breeding in rice, SSR and SNP markers were evaluated on a set of 23 genotypes representing indica germplasm for their usefulness in molecular research and breeding program. Seven hundred SSR and sequence tagged sites (STS) markers and 384 SNPs were screened for polymorphism. Highly polymorphic markers based on polymorphic information content (PIC) values were identified, which will be useful for molecular breeding. Data was used to identify an “indica genotyping set” based on high level of polymorphism, chromosome position and marker quality which will provide kits of markers for marker assisted selection (MAS). Genetic diversity analysis using SSR data was more consistent with pedigrees compared to analysis with SNP data indicating that more than 384 SNPs are required when elite indica breeding material is used. The results also indicated that there were polymorphic “blind spots” for the fixed SNP set suggesting that SSRs could still be used to complement fixed-SNP genotyping platforms for some molecular breeding applications.
-
Key words: Molecular breeding, Genotyping set, PIC, SSR, STS, SNP
INTRODUCTION
Rice (
Oryza sativa L.) is the most important crop in Asia. Many constraints to rice production may be overcome by developing new rice varieties (e.g. breeding for biotic or abiotic stress tolerance). Molecular breeding using DNA markers can greatly increase the precision and efficiency of rice breeding and therefore may provide useful tools for breeders (
Jena and Mackill 2008). Marker assisted selection (MAS) is advantageous over conventional phenotypic selection for the following reasons: it may be simpler than phenotypic screening which can save time, resources and effort; selection can be carried out at the seedling stage; and single plants can be accurately selected (
Collard and Mackill 2008;
Ribaut and Hoisington 1998). Marker-assisted backcrossing (MABC), a specific MAS scheme in plant molecular breeding, has been used to upgrade new varieties for many traits, especially for abiotic stress tolerance in rice (
Gregorio et al. 2013;
Mackill et al. 2012).
Of the many types of DNA markers, microsatellites or simple sequence repeats (SSRs) are widely used due to their high polymorphism and technically simple method of detection (
Wu and Tanksley 1993;
Panaud et al. 1996;
Akagi et al. 1997;
Chen et al. 1997;
McCouch et al. 2002). SSRs, like other PCR-based markers, can be run with common lab equipment and are cost effective (for low throughput). In rice, they have been extremely well characterized largely due to the completion of the rice genome reference sequence from Nipponbare (MSU7) and the availability of numerous genomics resources (
Schatz et al. 2014). Hence, SSRs have been the marker of choice for rice molecular breeding. The disadvantages of SSRs include the requirement of polyacrylamide gel electrophoresis, limited abundance when saturating genomic regions, constraints in multiplexing, limitations in universal data storage, and automation. Moreover, SSRs may differ in robustness, quality of the amplification products, and amplification of single or multiple loci which suggests that not all SSRs are equal. They may have low information content in the gene of interest (
Macaulay et al. 2001).
In recent years, single nucleotide polymorphisms (SNPs) have become widely used DNA markers because they are more efficient, stable and cost effective (for high throughput) (
Rafalski 2002;
Duran et al. 2009;
Edwards and Batley 2010). Moreover, automated, high-throughput processing of large numbers of samples is possible. SNPs are the most abundant variations in the genome that are ideal for high-resolution genotyping, hence, they are appropriate for association mapping, genetic diversity analysis, linkage mapping and MAS (
McCouch et al. 2010;
Tung et al. 2010). With the development of genotyping by sequencing (GBS), SNPs are expected to remain as the marker of choice in the 21
st century (
Thomson 2014).
Recently in rice,
Narshimulu et al. (2011) provided “ready-to-use” SSR markers for background selection for marker-assisted breeding in rice. A total of 840 hypervariable microsatellite markers (hvRMs) evenly distributed in the genome were selected from 18,828 Class I SSRs (hypervariable markers that are more polymorphic than Class II due to longer repeats of ≥ 20 nucleotides in length as reported by
Cho et al. 2000 and
Temnykh et al. 2000). A selection of 36 hvRMs were selected from the 840 markers and screened on 24 diverse rice cultivars to estimate the polymorphic information content (PIC). PIC is a measure of polymorphism for a marker locus (
Shete et al. 2000). It considers both the number of alleles that are expressed and the relative frequencies of those alleles in order to provide an estimate of the discriminatory power of a locus. The values ranged from 0 (monomorphic) to 1 (highly discriminative) (
Anderson et al. 1993). A “MAS kit” of molecular markers was developed using the hvRMs that are tightly-linked to important agronomic traits to effectively speed up the process of crop improvement.
Singh et al. (2009) evaluated the relationship between SSR length and level of polymorphism in eight diverse rice genotypes using 201 random SSR loci to find most variable SSR loci for agarose gel electrophoresis.
Previous studies in assessing genetic relatedness in maize association mapping panels confirmed that SSR markers with moderate density were more informative than SNPs (
Yang et al. 2011). Although, there was a high coefficient of correlation between the genetic similarity of SSR and SNP genotyping data, average PIC values of SSRs in barley were higher compared to SNP markers (
Varshney et al. 2008;
2010). High throughput SNP genotyping platforms are becoming more accessible and hence replacing SSR markers in molecular breeding research.
Thomson et al. (2012) designed seven GoldenGate VeraCode oligo pool assay (OPA) sets (384 SNPs) for rice using the Illumina BeadXpress platform. The results indicated that 384-plex SNP genotyping using the BeadXpress platform was effective for diversity analysis, QTL mapping, MABC and developing specialized genetic (
Thomson et al. 2012).
The aim of this study was to evaluate a large number of SSRs and SNPs using an important set of
indica varieties or important donor parents which are highly relevant to current breeding activities at the International Rice Research Institute (IRRI). Our main objective was to identify highly polymorphic SSRs and SNPs that could be used as “genotyping sets” in rice for various molecular breeding applications, as have been reported in other crops such as barley (
Macaulay et al. 2001) or cotton (
Lacape et al. 2007). In many previous studies, a diverse set of genotypes is often used including
indica and
japonica subspecies, which may give an exaggerated indication of the potential of markers for breeding applications. Hence our focus was on
indica germplasm, which is the predominant sub-species in South and Southeast Asia. Particular emphasis was given to breeding for submergence tolerance by focusing on the
SUB1 locus on chromosome 9 (
Xu and Mackill 1996).
SUB1 is a major QTL controlling submergence tolerance and has been used to develop ‘upgraded’ rice mega-varieties (
Iftekharuddaula et al. 2011;
Mackill et al. 2012;
Neeraja et al. 2007;
Septiningsih et al. 2009;
2013;
2015).
MATERIALS AND METHODS
Plant material
A total of 23 genotypes including important irrigated and rainfed
indica varieties, donor parents and elite breeding lines were assembled, with an emphasis on breeding for flood tolerance at IRRI. Many
SUB1 donors (i.e. released
SUB1 varieties) and selected recipient parents were specifically included in order to identify polymorphic markers for current research and molecular breeding activities. Parents used in mapping populations for submergence and stagnant flooding tolerance were also included (
Table 1). Additional information about these donor parents was described in
Collard et al. (2013) and
Mackill et al. (1993).
DNA was isolated using modified mini prep CTAB method (
Zheng et al. 1995). Young leaves of 2 week old plants were sampled and ground using Genogrinder (SPEX SamplePrep, Metuchen, NJ, USA) equipment and liquid nitrogen. Addition of 2% CTAB buffer (100 mM Tris-HCl pH8, 50 mM EDTA pH=8, 500 mM NaCl, 1.25% SDS, 0.38% sodium biosulfate) and incubation in water bath at 65°C for 1 hour followed. Subsequently, the mixture was shaken sporadically, followed by the treatment with chloroform:isoamyl alcohol mixture (24:1) to remove protein. Afterwards, supernatant was precipitated in ice cold isopropanol for 1 hour and pellets were washed with 70% ethanol. RNA was removed using RNase and pellets were dissolved in TE buffer. Finally, the quality of DNA was verified using 1% agarose gel stained with Sybr® safe (Invitrogen, Catalog no. S33102) and DNA was quantified using Nano Drop Spectrophotometer (Thermo Scientific, Wilmington, DE, USA). The DNA samples were normalized to 20 ng/uL and 50 ng/uL for SSR and SNP genotyping, respectively.
Seven hundred SSR and STS markers obtained from Genetics and Genomics Laboratory at IRRI were selected across all 12 rice chromosomes. Most SSRs were selected based on previous research identifying these SSRs to have high PIC values, whereas others were based on the availability in the laboratory. Other SSR or STS markers were selected based on the physical position near
SUB1 (e.g. ART5, RM3609). PCR amplification was performed in 7 uL volume containing of 20 ng/uL DNA (2uL) template, 10× PCR buffer (0.7 uL), 1 mM dNTPs (0.7 uL), 1.5 mM MgCl
2 (0.6 uL), 5 uM of each forward and reverse primer (0.4 uL each) and 1 unit of homemade Taq DNA polymerase (0.9 uL) on thermal cycler (G-Storm, United Kingdom). The temperature profile used for amplification includes: 3 min of initial denaturation at 94°C followed by 35 cycles of denaturation at 94°C for 30 sec, annealing at 54–55°C for 30 sec and extension at 72°C for 30 sec, and the final extension at 72°C for 2 min. A no DNA template control was used to determine if there was contamination within the process. The samples were then mixed with 2 uL of bromophenol blue gel loading dye and 4 uL PCR products were separated using 8% polyacrylamide gel along with a 1 kb ladder (Invitrogen, Cat No.10787026) for 2 hours. Visualization was done using Alpha Imager 1220 (Alpha Innotech, CA, USA) under ultraviolet (UV) light after staining with Sybr® safe (Invitrogen, Catalog no. S33102). The amplicons were scored manually in base pairs using the 1 kb ladder. The protocol was optimized for SSRs that failed once and repeated for 2 or 3 times. After the third attempt, SSRs that still failed to amplify were not used again. Genetic and physical map positions were determined using the Gramene website (
www.gramene.org) and from the Nipponbare rice genome reference (
IRGSP, 2005). Marker ‘quality’ was assessed and defined as the clarity and reproducibility of the marker.
A 384-plex SNP genotyping assay on the BeadXpress (Illumina®) platform was used. Normalized DNA samples were genotyped using “GoldenGate Genotyping Assay” (VeraCode Manual Protoco; Illumina Part 311275211), following the manufacturer’s instructions. An Allegra 25R (Beckman Coulter, Brea, CA, USA) and GSI thermal cycler (G-storm, Surrey, UK) were used for the plate centrifuge steps and for PCR amplification respectively. RiceOPA2.1 was used for genotyping the 23 rice varieties in which the Illumina OPA ID was GS0011861-OPA
a. This OPA is appropriate for
indica genotypes and informative for
indica/indica populations (
Thomson et al. 2012).
The size of SSR marker alleles were estimated and scored based on the 1 kb ladder (10787-018, Life Technologies). SSR data in base pairs was directly inputted in the PowerMarker software (v3.25). The SNP data was analyzed using the Genotyping module (v1.6.3) of the Illumina GenomeStudio (v2010.1) software. For a more accurate allele calling, ALCHEMY program was used because it was created for highly inbred samples (
Thomson et al. 2012). The ALCHEMY-Illumina plug-in v1.0 (
http://alchemy.sourceforge.net/) was installed into GenomeStudio. The Genome Studio “Reports Wizard” was used to output the data into ALCHEMY format resulting to two data, one with the project name containing sample intensity data and the second as a map file with the SNP map information. The outputs were used as input files for ALCHEMY and all succeeding output re-shaping and manipulations was done in the GALAXY-ALCHEMY bioinformatics workflow environment (
http://main.g2.bx.psu.edu/). Allele calls were used for the genetic diversity analysis using Nei1983 genetic distance measure with a neighbor-joining tree with PowerMarker v3.25 software (
Liu and Muse 2005;
http://statgen.ncsu.edu/powermarker/). Bootstrap NJ phylogenetic trees were produced using TreeView (
http://taxonomy.zoology.gla.ac.uk/rod/treeview.html). PIC values were calculated using PowerMarker based on the formula reported by
Botstein et al. (1980). The PIC values of 23 genotypes (including FR13A and Super Basmati) were compared with 21 genotypes (excluding FR13A and Super Basmati), however PIC values based on only the 21
indica genotypes were shown in
Tables 2 and
3. Polymorphism survey data can be obtained from the corresponding author upon request.
RESULTS
SSR genotyping
Four hundred ninety out of 722 SSRs tested (68%) were polymorphic across the 23 genotypes used. In terms of polymorphism, chromosome 5 had the highest percentage of 80% and chromosome 11 had the lowest percentage of 52.8%. However, chromosome 11 had the highest maximum PIC value of 0.83 and chromosome 12 had the lowest value of 0.563. The average PIC values ranged from 0.331 to 0.461 (
Table 2). SSR genotyping set was created based on the reliability of the marker measured visually through the band quality, polymorphism using the generated PIC values and marker position with at least 2 Mb distance between each markers (
Table 3). Chromosome 9, the location of S
UB1 was examined for tightly linked SSR markers between 5.92–8 Mb.
SUB1 marker alleles were recorded for each marker across the 23 genotypes (
Table 4).
Three hundred sixty five out of 384 SNPs screened (95%) were polymorphic across 23 genotypes which was 27% higher than SSRs. Chromosomes 5, 8 and 9 had 100% polymorphism while chromosome 3 had the lowest polymorphism of 86.4% which was still higher by 33.6% of the lowest value in SSR. However, the maximum PIC value of SSRs (0.563–0.830) was higher compared with SNPs (0.490–0.580) which is due to the multi-allelic nature of SSR polymorphism. The average PIC values of SNP markers range from 0.289 to 0.382 (
Table 5). SNPs with high PIC values are indicated in
Table 6. There were “blind spots” in SNP coverage where the PIC values of the SNP markers were very low especially on chromosomes 5, 7, 9, 10 and 11 (
Fig. 1 and
Supplementary Fig. 1).
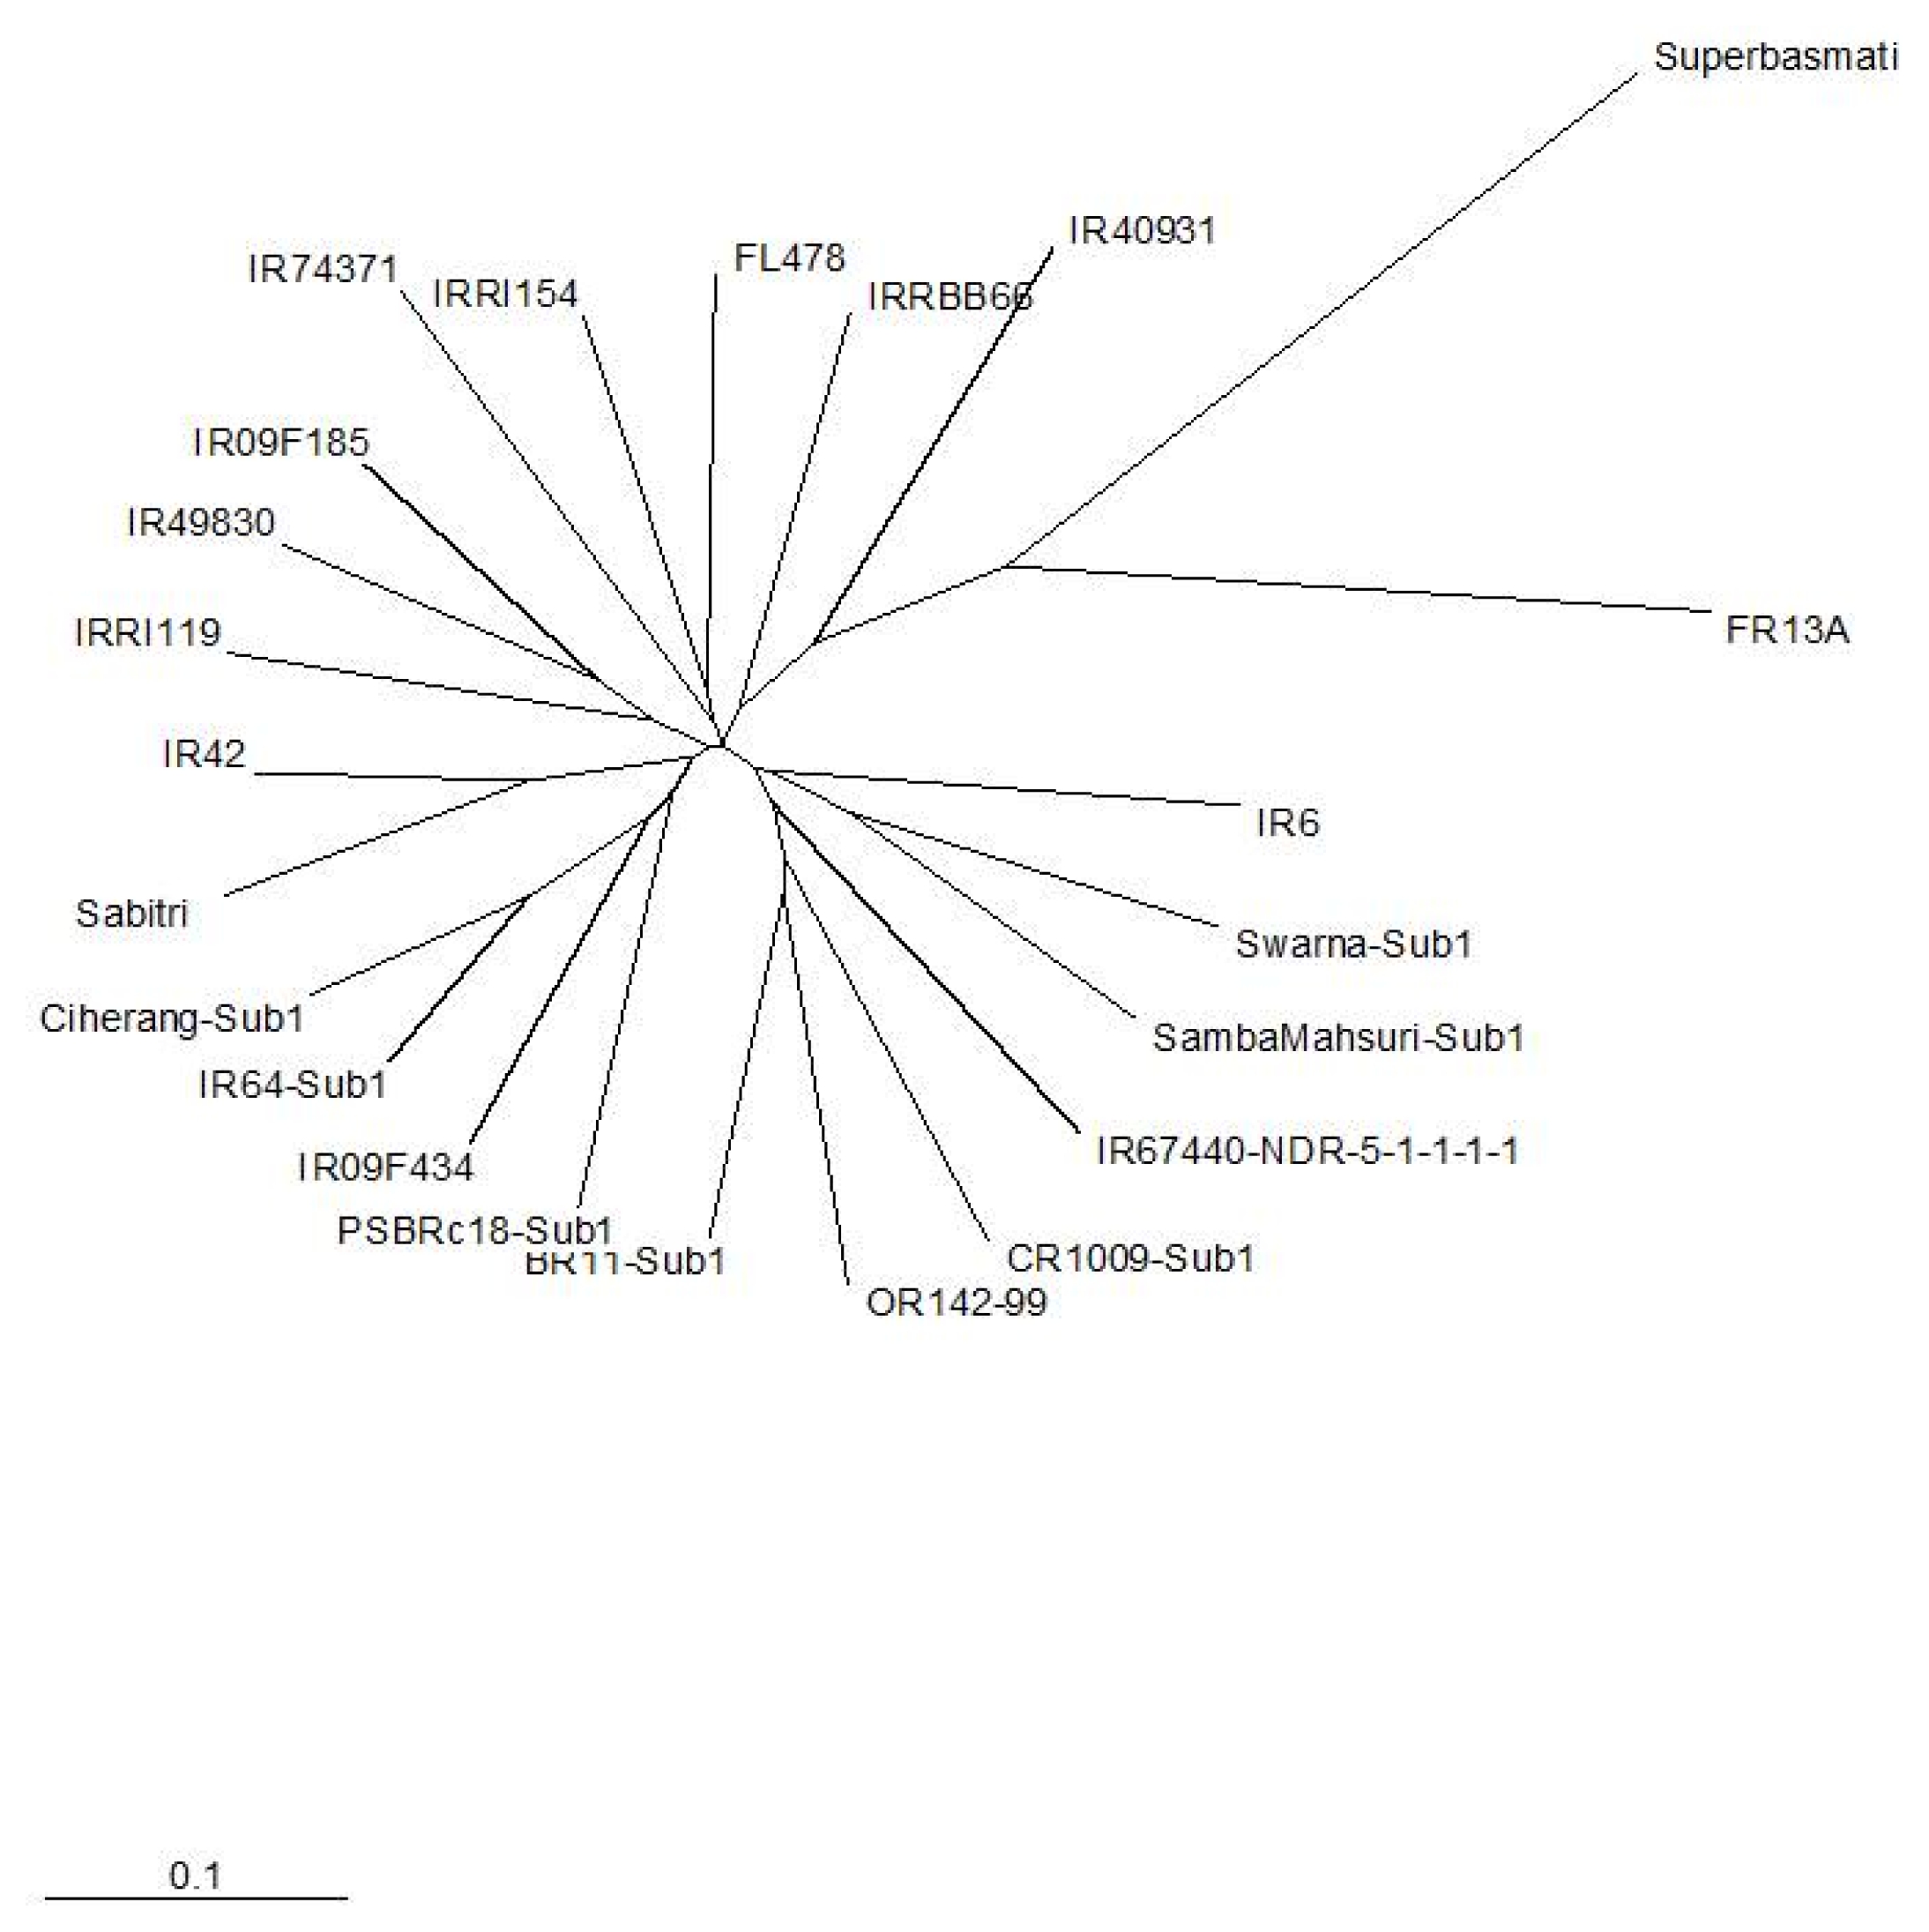
The radial trees generated from SSR and SNP data showed were generally consistent with known pedigrees. Both trees indicated that FR13A and Super Basmati were diverse from the rest of the indica accessions. However, there were differences in the clustering of the 21 indica lines generated from the SSR and SNP analysis. The tree produced from SSR data was more consistent with pedigrees compared to the tree produced from SNP data.
DISCUSSION
In this study, over 700 SSR markers were selected based on the literature searching for high PIC values and the availability of markers in our labs, and the availability of the 384-plex SNP BeadXpress platform. The plant material used was highly relevant to current breeding activities in which 21 of the 23 genotypes were indica. This was done to avoid the exaggerated PIC values of markers and to provide a more accurate estimate of the usefulness of a marker in actual breeding programs.
The 12 chromosomes in rice have different sizes (
Chen et al. 2002), hence different numbers of markers were screened for different chromosomes.
Table 2 shows the uneven distribution of polymorphism of SSR markers between chromosomes. Chromosome 5 was the most polymorphic (80%) and chromosome 11 is the least polymorphic (53%). SSRs were identified based on quality of amplification and PIC values, which can be used for MABC, marker-assisted pyramiding and other applications. Specifically for MABC, it is extremely useful to have a set of ‘ready to use’ highly polymorphic SSRs which we refer to as the
indica genotyping set (
Table 3). The markers comprising the genotyping set were chosen based on the marker quality, polymorphism and position. Some chromosomes had fewer markers due to lower polymorphism levels in the genotypes that we used. For some molecular breeding applications such as MABC, it is important to have evenly spaced markers with a window of approximately 5 Mb for background selection. Also, 5–10 markers per chromosome are generally sufficient to have an efficient recovery of the recipient parent during background selection or to construct a framework map for QTL analysis.
We emphasized the
SUB1 region in this study; hence more markers were screened within and near this locus on chromosome 9.
Table 4 shows the markers tightly-linked to
SUB1 and compares the allele sizes for comparison between
SUB1 and non-
SUB1 genotypes. Markers with the highest PIC values will be useful to select markers for tracking
SUB1 in
indica breeding populations. Polymorphism information is also currently being used to introgress
SUB1 into new varieties (
Collard et al. 2013;
Gregorio et al. 2013).
SNP markers have the potential for providing the highest map resolution (
Nasu et al. 2002). SNPs are rapidly replacing SSRs in plant breeding and genetics research because of their abundance and many SNP platforms are high throughput (i.e. many samples per assay) which increases efficiency and cost effectiveness (
Rafalski 2002;
Duran et al. 2009;
Edwards and Batley 2010). An earlier SNP platform assayed 1536 markers but a recent study compared the cost effectiveness of using 96 or 384 SNPs subsets compared to the original one for diversity studies. Results indicated that the 384 SNP markers gave the optimal balance between power and economy for germplasm characterization in barley (
Moragues et al. 2010). SNP genotyping (384-plex) using the BeadXpress was used in this experiment due to lower costs per sample (
Lin et al. 2009).
Table 6 shows the most polymorphic SNP markers based on the PIC values. These SNP markers could also be used in lower-plex SNP genotyping platforms (e.g. 24 or 96 SNPs) such as the Fluidigm EP1™ System (
Thomson 2014).
SNP platforms such as the BeadXpress platform usually contain a fixed set of SNP markers; hence there may be a need for complementation with other marker systems. Our results indicate that SSR markers can be used to “fill in the gaps” and complement SNP marker genotyping for some molecular breeding applications. Additionally, as shown in
Fig. 1 and
Supplementary Fig. 1, the 384-plex SNP set has “blind spots” in which markers have very low PIC values; SSRs can specifically be used in these regions for QTL mapping or background selection. For example, on chromosomes 5, 7, 9, 10 and 11, where the SSR markers had higher PIC values compared to SNPs (
Fig. 1).
Genetic diversity analysis was also conducted to compare two marker systems.
Figures 2 and
3 show radial trees using SSR and SNP markers, respectively. From this analysis, Super Basmati and FR13A were distant to the rest of the lines. However, based on pedigree information, the tree formed using SSR data was more consistent with pedigrees as shown in
Table 1. This was probably the result of more SSRs being tested compared to SNPs, and suggests that more markers are needed for genetic diversity analysis to complement with the fixed 384 SNPs when elite
indica breeding germplasm is used. Breeding material is more genetically similar compared to diversity panels. The requirement to use more SNP markers compared to SSRs for genetic diversity analysis has been previously reported in maize (
Hamblin et al. 2007;
Yang et al. 2011)
In conclusion, SSRs and SNPs are complementary marker systems that can be used for molecular breeding in rice. SSRs are needed to “fill in the gaps” for fixed SNP arrays like BeadXpress platform, containing the same set of SNP markers for a more efficient and effective process. It is hoped that the genotyping sets identified in this paper will be useful for other rice researchers to efficiently identify polymorphic SSRs or SNPs especially for activities involving indica germplasm.
Supplementary Information
ACKNOWLEDGMENTS
The authors gratefully acknowledge funding from the Bill and Melinda Gates Foundation (BMGF) for the Stress Tolerant Rice for Africa and South Asia (STRASA) program. We also thank Dr. Tobias Kretzschmar and Dr. J. Damien Platten (IRRI) for critically reviewing the manuscript.
Fig. 1Graphs of PIC values (y axis) plotted for SSR and SNP markers based on chromosome position (x axis).
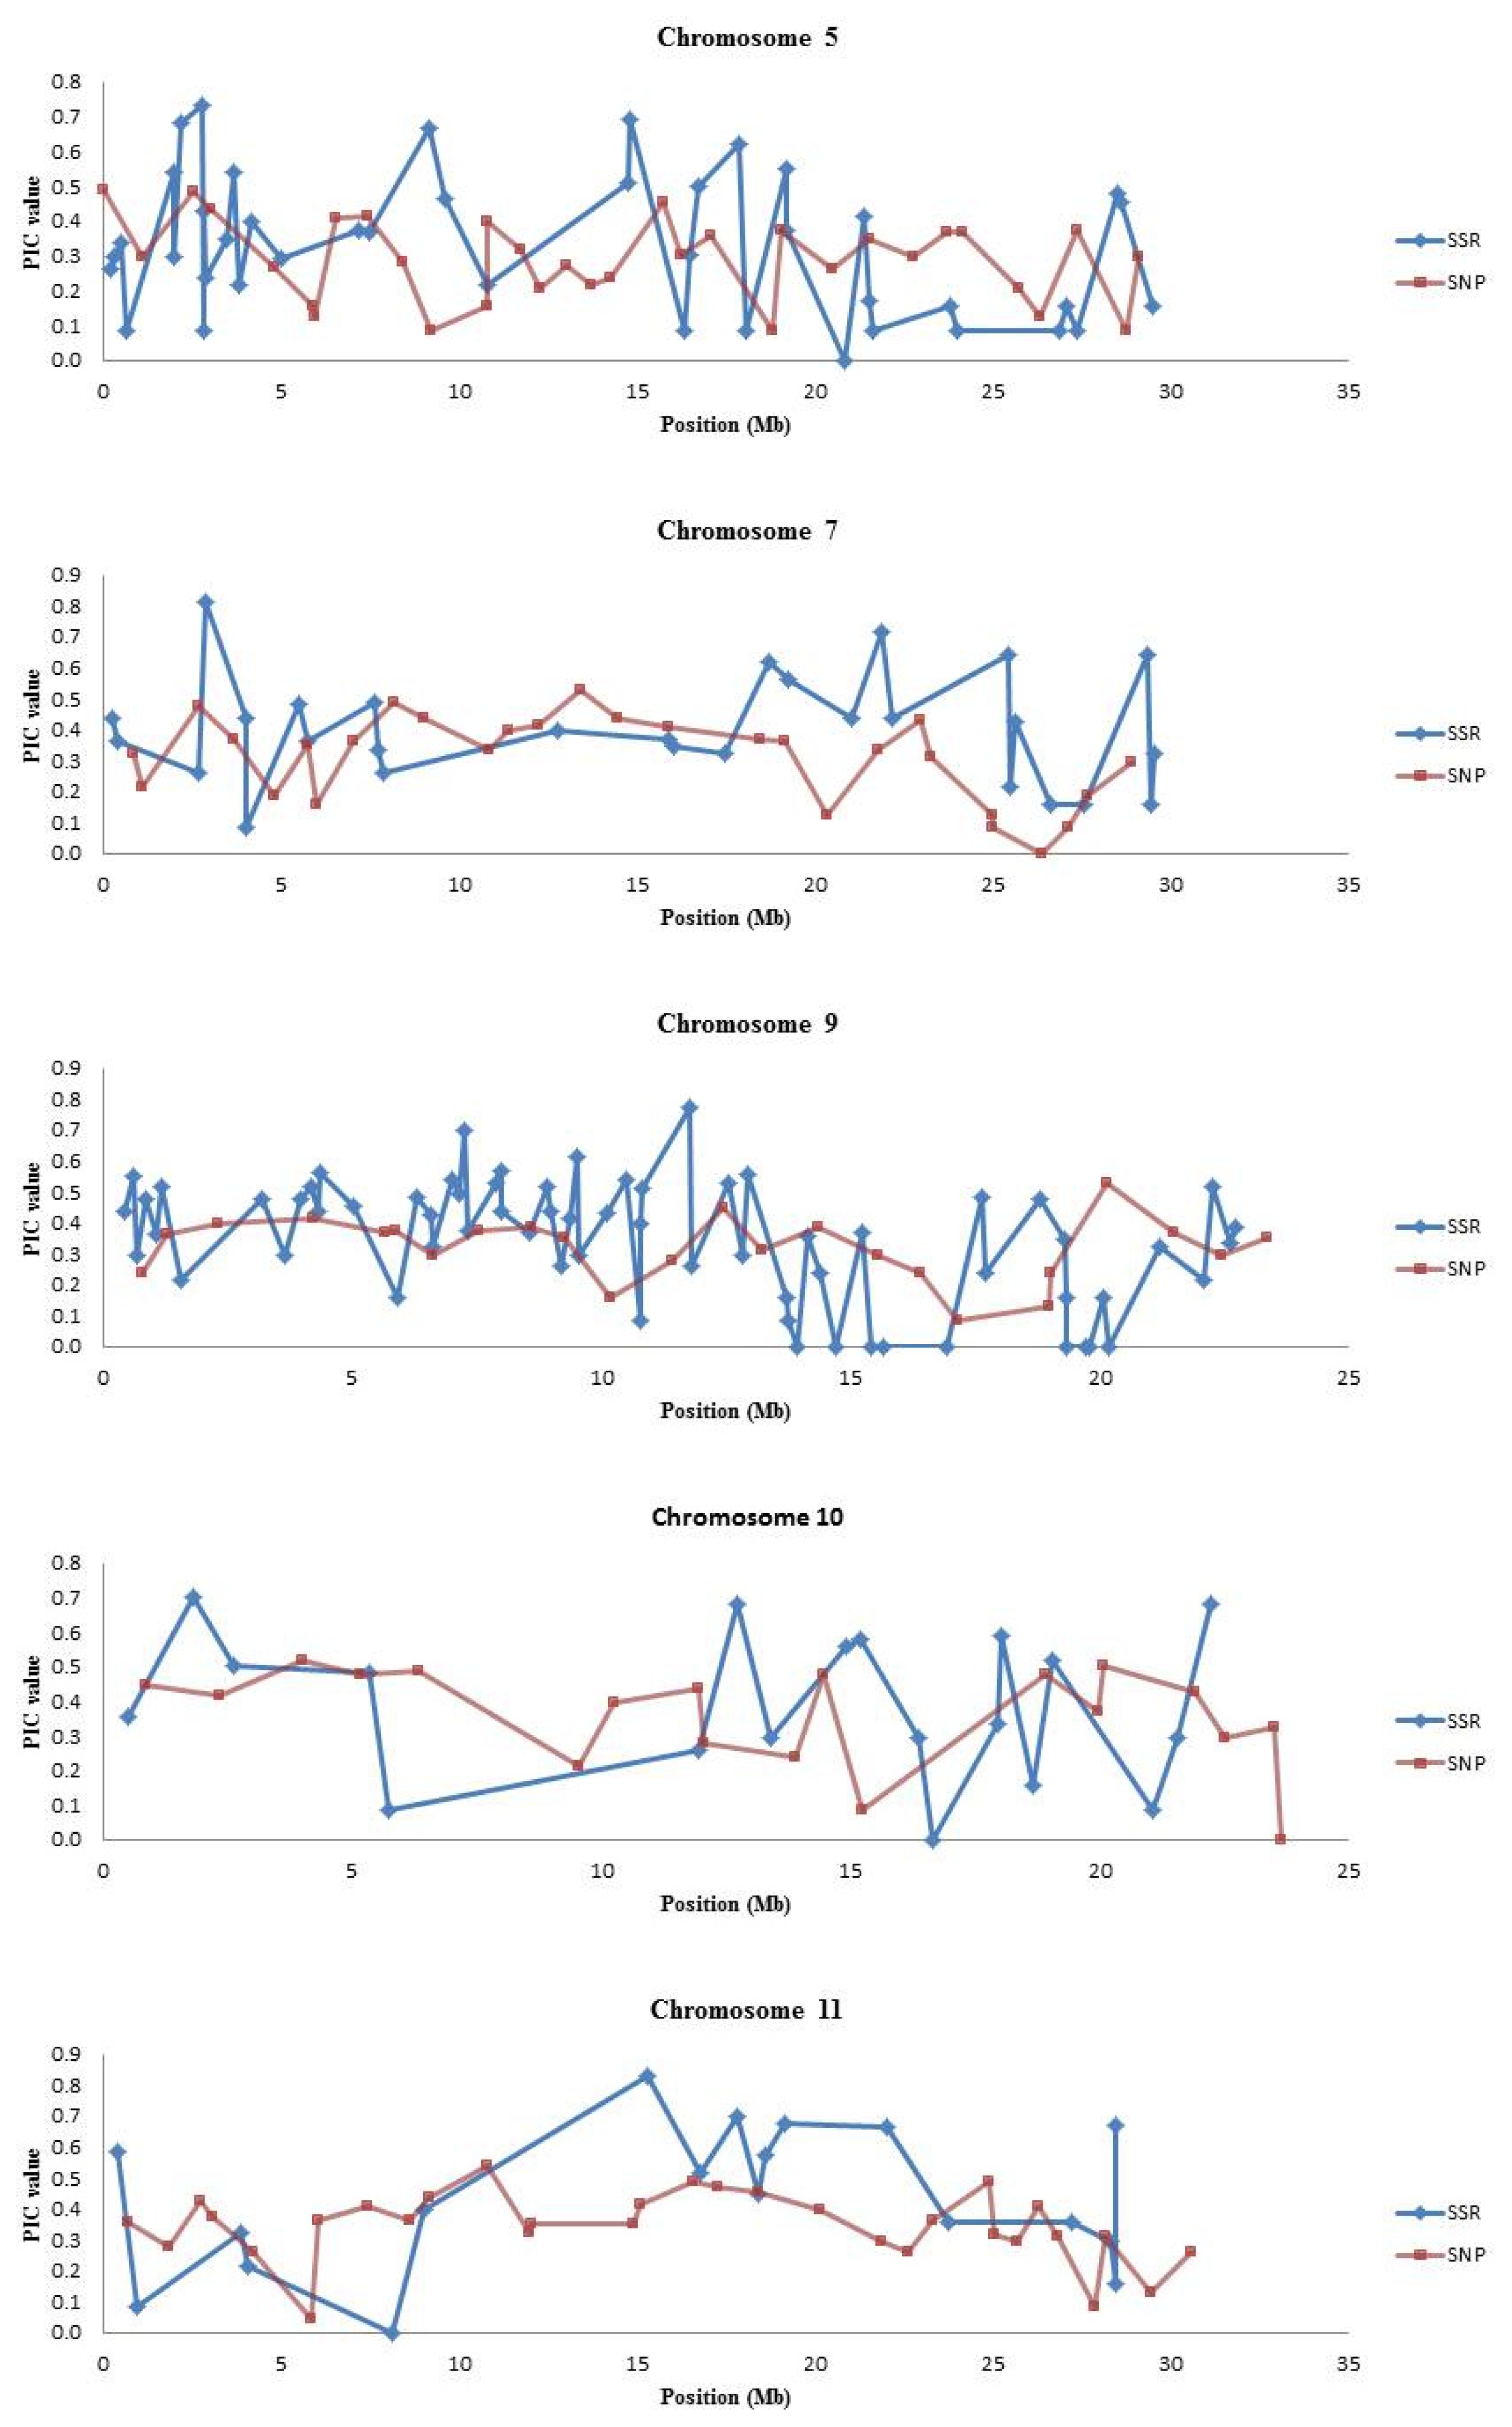
Fig. 2Radial tree using unrooted neighbor-joining method of SSR data using Nei’s similarity coefficient.

Fig. 3Radial tree view of unrooted neighbor-joining tree of SNP data using Nei’s similarity coefficient.
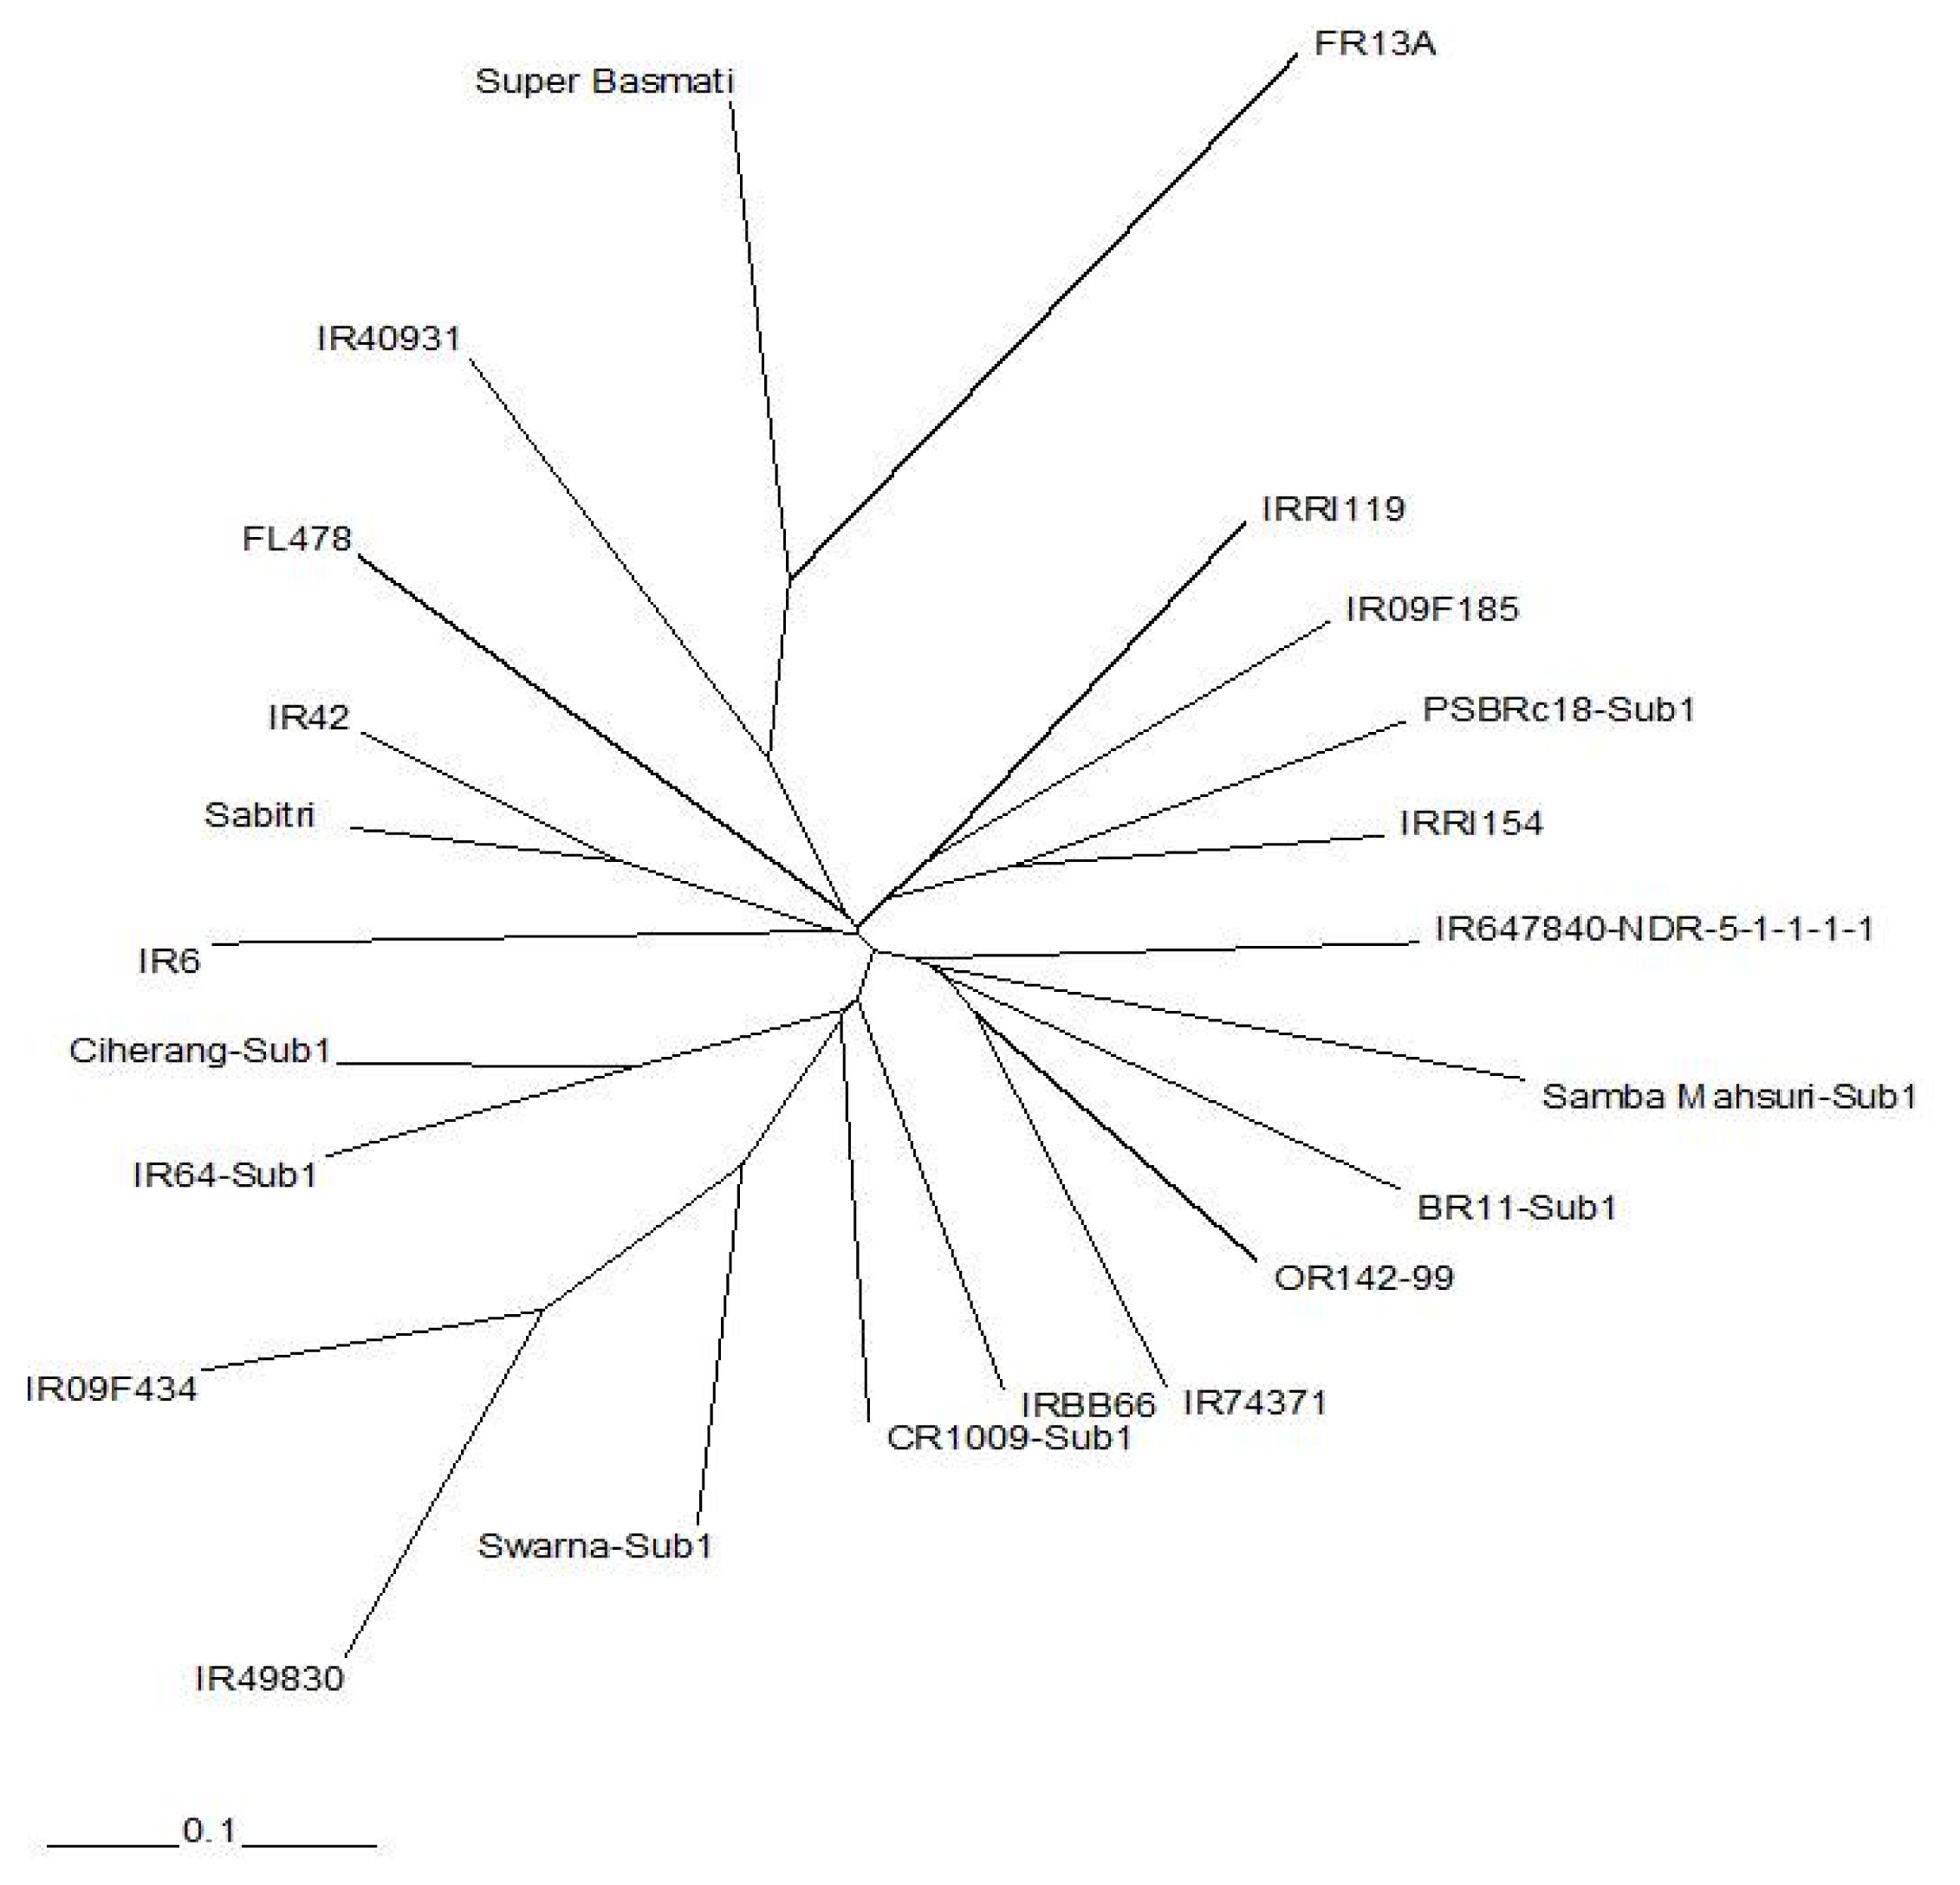
Table 1Rice genotypes used for marker evaluation.
Table 1
|
Name |
Alias |
Parentage |
Designation |
GID |
Information |
|
Swarna-Sub1 |
|
Swarna*4/IR49830-7-1-2-3 |
IR05F102 |
1847271 |
New variety with submergence tolerance in India |
|
Samba Mahsuri-Sub1 |
|
SAMBHA MAHSURI*3/IR 49830-7-1-2-3 |
IR07F101 |
2159598 |
New variety with submergence tolerance in India |
|
BR11-Sub1 |
BRRI dhan 52 (Bangladesh) |
BR 11*3/IR 40931-33-1-3-2 |
IR07F290 |
2295328 |
New variety with submergence tolerance in Bangladesh |
|
CR1009-Sub1 |
|
CR 1009*3/IR 49830-7-1-2-3 |
IR07F291 |
2403712 |
New variety with submergence tolerance in India |
|
IR09F434 |
|
IRRI 123*2/IRRI 149 |
IR09F434 |
2847875 |
Sub1 near isogenic line (NIL) in popular Philippine variety PSBRc82 |
|
Ciherang-Sub1 |
Inpari 30 (Indonesia) |
CIHERANG*2/IRRI 149 |
IR09F436 |
2847870 |
New variety with submergence tolerance in Indonesia |
|
PSBRc18-Sub1 |
|
PSB RC 18 (IR 51672-62-2-1-1-2-3)*2/IRRI 149 |
IR09F437 |
2853229 |
Sub1 near isogenic line (NIL) in popular Philippine variety awaiting to be released |
|
IR64-Sub1 |
IRRI 149 or NSICRc194 or “Submarino” (Philippines) |
IR 40931-33-1-3-2/3*IR 64 |
IR07F102 |
2159583 |
New variety with submergence tolerance in the Philippines |
|
Sabitri |
|
IR 1561-228-1/IR 1737//CR 94-13 |
IRTP 8487 |
2268099 |
Popular variety in Nepal |
|
IR6 |
|
SIAM 29 (ACC 42)/DEE GEO WOO GEN |
IRTP 25398 |
2440173 |
Popular variety in Pakistan |
|
Super basmati |
|
BAS 320/IR 661 |
IRTP 20918 |
2274228 |
Popular basmati variety in Pakistan |
|
IR09F185 |
|
BR 11/IR 49830-7-1-2-3//IR04N106 |
IR 85288-SUB 38-1-1 |
2707581 |
Stagnant flooding donor. Parent of RIL population |
|
IR67440-NDR-5-1-1-1-1 |
|
CNM 539/IR 53479-B-45-3-2-3 |
|
84299 |
Stagnant flooding donor. Parent of RIL population |
|
FR13A |
|
DHALPUTTIA |
|
32293 |
Donor of Sub1 and highly flood tolerant landrace |
|
IR40931 |
|
BKNFR 76106-16-0-1/IR 19661-131-1-2 |
IR40931-33-1-3-2 |
71615 |
Sub1 donor parent. |
|
IR49830 |
“Popoul” (Myanmar) |
IR 4568-86-1-3-2/IR 26702-111-1//IR 20992-7-2-2-2-2-3/IR 21567-9-2-2-2-1 |
IR49830-7-1-2-3 |
88474 |
Sub1 and stagnant flooding donor parent/variety |
|
IR42 |
|
IR 1561-228-1-2/IR 1737//CR 94-13 |
IR 2071-586-5-6 |
13988 |
IRRI variety released for irrigated and rainfed areas. Susceptible check for submergence tolerance screening. |
|
IRBB66 |
|
IRBB 7/IR BB 60 (IR 72920-1-44-4) |
|
1847199 |
Widely-used bacterial blight gene donor (Xa4, xa5, xa7, xa13 and Xa21) in IR24 background |
|
OR 142-99 |
Santepheap 3 (Cambodia) |
PANKAIJ/SIGADIS |
IRTP 13636 |
415260 |
Indian breeding line released as a variety in Cambodia |
|
IRRI 119 |
PSBRc68 or ‘Sacobia’ (Philippines); Shwe Pyi Tan (Myanmar) |
IR 43581-57-3-3-6/IR 26940-20-3-3-3-1//KHAO DAWK MALI 105 |
PSB RC 68 |
2266161 |
IRRI variety released with Sub1 for rainfed areas in the Philippines with stagnant flooding tolerance |
|
IRRI 154 |
NSICRc222 or ‘Tubigan 18’ (Philippines) |
IR 73012-137-2-2-2/PSB RC 10 (IR 50404-57-2-2-3) |
IR04A412 |
1253989 |
IRRI variety released for irrigated and favourable rainfed areas in the Philippines |
|
FL478 |
IR 66946-3R-178-1-1 |
IR 29/POKKALI B |
IR 66946-3R-178-1-1 |
1192884 |
Widely used salinity tolerant donor line |
|
IRRI 148 |
NSICRc192 or ‘Sahod Ulan 1’ (Philippines) |
IR 55419-4*2/WAY RAREM |
IR74371-54-1-1 |
1161411 |
Drought released in tolerant the Philippines IRRI variety |
Table 2Polymorphic SSR markers and PIC values per chromosome.
Table 2
|
Chr |
No. SSRs |
% monomorphic |
% polymorphic |
PIC Min |
PIC Max |
PIC Ave |
|
1 |
107 |
35.2 |
64.8 |
0.087 |
0.720 |
0.338 |
|
2 |
64 |
25.4 |
74.6 |
0.087 |
0.691 |
0.333 |
|
3 |
60 |
27.1 |
72.9 |
0.087 |
0.648 |
0.331 |
|
4 |
61 |
35.0 |
65.0 |
0.087 |
0.748 |
0.332 |
|
5 |
56 |
20.0 |
80.0 |
0.087 |
0.735 |
0.340 |
|
6 |
53 |
24.0 |
76.0 |
0.087 |
0.791 |
0.386 |
|
7 |
38 |
26.3 |
73.7 |
0.087 |
0.813 |
0.402 |
|
8 |
52 |
25.0 |
75.0 |
0.087 |
0.711 |
0.396 |
|
9 |
102 |
24.7 |
75.3 |
0.087 |
0.772 |
0.400 |
|
10 |
33 |
37.5 |
62.5 |
0.087 |
0.703 |
0.414 |
|
11 |
42 |
47.2 |
52.8 |
0.087 |
0.830 |
0.461 |
|
12 |
54 |
37.3 |
62.7 |
0.087 |
0.563 |
0.352 |
Table 3Indica SSR genotyping set based on reliability, polymorphism and marker position.
Table 3
|
SSR Name |
Chr. |
Physical (Mb) |
PIC Values |
|
RM495 |
1 |
0.2 |
0.4393 |
|
RM1 |
1 |
4.6 |
0.2608 |
|
RM243 |
1 |
7.9 |
0.3975 |
|
RM582 |
1 |
9.1 |
0.4470 |
|
RM449 |
1 |
15.1 |
0.1575 |
|
RM24 |
1 |
18.9 |
0.5334 |
|
RM237 |
1 |
26.8 |
0.4345 |
|
RM84 |
1 |
29.7 |
0.3554 |
|
RM486 |
1 |
34.9 |
0.3249 |
|
RM14 |
1 |
41.3 |
0.5885 |
|
RM154 |
2 |
1 |
0.6913 |
|
RM279 |
2 |
2.8 |
0.5468 |
|
RM71 |
2 |
8.7 |
0.5623 |
|
RM324 |
2 |
11.3 |
0.4394 |
|
RM300 |
2 |
13.1 |
0.4925 |
|
RM341 |
2 |
19.3 |
0.5192 |
|
RM263 |
2 |
25.8 |
0.5109 |
|
RM1342 |
2 |
28.1 |
0.5396 |
|
RM6 |
2 |
29.5 |
0.3457 |
|
RM208 |
2 |
35.1 |
0.5743 |
|
RM231 |
3 |
2.4 |
0.5736 |
|
RM218 |
3 |
8.4 |
0.6479 |
|
RM3297 |
3 |
13.2 |
0.3131 |
|
RM15187 |
3 |
16.6 |
0.4551 |
|
RM411 |
3 |
21.4 |
0.3604 |
|
RM426 |
3 |
27.5 |
0.3850 |
|
RM186 |
3 |
28.8 |
0.5736 |
|
RM571 |
3 |
33.1 |
0.2970 |
|
RM570 |
3 |
35.5 |
0.4647 |
|
RM85 |
3 |
36.3 |
0.5038 |
|
RM335 |
4 |
0.6 |
0.6550 |
|
RM261 |
4 |
6.5 |
0.4065 |
|
RM307 |
4 |
13.1 |
0.5623 |
|
RM16945 |
4 |
20.5 |
0.2373 |
|
RM3839 |
4 |
23.9 |
0.2970 |
|
RM252 |
4 |
25.1 |
0.5509 |
|
RM3820 |
4 |
27.6 |
0.4898 |
|
RM303 |
4 |
28.5 |
0.2922 |
|
RM5473 |
4 |
31.4 |
0.7481 |
|
RM280 |
4 |
34.9 |
0.4638 |
|
RM13 |
5 |
2 |
0.5396 |
|
RM592 |
5 |
2.7 |
0.7349 |
|
RM17954 |
5 |
3.6 |
0.5425 |
|
RM18188 |
5 |
9.1 |
0.6657 |
|
RM1115 |
5 |
14.7 |
0.5109 |
|
RM5454 |
5 |
17.8 |
0.6221 |
|
RM163 |
5 |
19.1 |
0.5509 |
|
RM3575 |
5 |
21.3 |
0.4160 |
|
RM274 |
5 |
26.8 |
0.0866 |
|
RM31 |
5 |
28.6 |
0.4551 |
|
RM435 |
6 |
0.5 |
0.3967 |
|
RM586 |
6 |
1.4 |
0.6272 |
|
RM204 |
6 |
3.1 |
0.7913 |
|
RM3408 |
6 |
4.5 |
0.3249 |
|
RM276 |
6 |
6.2 |
0.3604 |
|
RM549 |
6 |
6.9 |
0.3604 |
|
RM136 |
6 |
8.7 |
0.2149 |
|
RM3827 |
6 |
22.2 |
0.5179 |
|
RM30 |
6 |
27.2 |
0.5921 |
|
RM400 |
6 |
28.4 |
0.6172 |
|
RM51 |
7 |
0.2 |
0.4368 |
|
RM481 |
7 |
2.8 |
0.8129 |
|
RM21077 |
7 |
4 |
0.0866 |
|
RM214 |
7 |
12.7 |
0.3967 |
|
RM500 |
7 |
15.9 |
0.3698 |
|
RM2 |
7 |
16 |
0.3457 |
|
RM320 |
7 |
18.6 |
0.6175 |
|
RM336 |
7 |
21.8 |
0.7137 |
|
RM18 |
7 |
25.6 |
0.4252 |
|
RM248 |
7 |
29.3 |
0.6398 |
|
RM6925 |
8 |
0.6 |
0.6608 |
|
RM38 |
8 |
2.1 |
0.4303 |
|
RM25 |
8 |
4.3 |
0.4160 |
|
RM72 |
8 |
6.7 |
0.6494 |
|
RM3395 |
8 |
10.2 |
0.7069 |
|
RM22837 |
8 |
12.3 |
0.7109 |
|
RM404 |
8 |
15.4 |
0.6024 |
|
RM223 |
8 |
20.6 |
0.4368 |
|
RM52 |
8 |
24.7 |
0.5109 |
|
RM5545 |
8 |
28.2 |
0.5425 |
|
RM23679 |
9 |
0.8 |
0.4783 |
|
RM23793 |
9 |
4.3 |
0.5603 |
|
RM5515 |
9 |
7.1 |
0.4925 |
|
RM23958 |
9 |
7.9 |
0.4394 |
|
RM3855 |
9 |
9.3 |
0.4160 |
|
RM24087 |
9 |
10.8 |
0.5109 |
|
RM105 |
9 |
12.5 |
0.5267 |
|
RM24260 |
9 |
14.1 |
0.3554 |
|
RM410 |
9 |
17.6 |
0.4818 |
|
RM242 |
9 |
18.8 |
0.4783 |
|
RM108 |
9 |
19.3 |
0.3457 |
|
RM205 |
9 |
22.7 |
0.3850 |
|
RM24888 |
10 |
0.5 |
0.3554 |
|
RM222 |
10 |
2.6 |
0.5015 |
|
RM216 |
10 |
5.3 |
0.4842 |
|
RM25436 |
10 |
14.9 |
0.5578 |
|
RM25459 |
10 |
15.2 |
0.5780 |
|
RM258 |
10 |
18 |
0.5880 |
|
RM228 |
10 |
22.2 |
0.6801 |
|
RM286 |
11 |
0.3 |
0.5877 |
|
RM167 |
11 |
4 |
0.2149 |
|
RM202 |
11 |
9 |
0.3967 |
|
RM26664 |
11 |
15.3 |
0.8295 |
|
RM209 |
11 |
17.8 |
0.6982 |
|
RM26834 |
11 |
18.6 |
0.5736 |
|
RM21 |
11 |
19.1 |
0.6769 |
|
RM206 |
11 |
22 |
0.6641 |
|
RM224 |
11 |
27.2 |
0.3554 |
|
RM27389 |
11 |
28.4 |
0.6690 |
|
RM3472 |
12 |
3.5 |
0.5578 |
|
RM27809 |
12 |
7.4 |
0.3744 |
|
RM27933 |
12 |
10.4 |
0.3975 |
|
RM28102 |
12 |
16 |
0.4303 |
|
RM1261 |
12 |
17.5 |
0.5629 |
|
RM415 |
12 |
19.5 |
0.3026 |
|
RM17 |
12 |
26.9 |
0.4813 |
|
RM28825 |
12 |
27.5 |
0.2373 |
|
|
|
|
Table 4SSR markers tightly linked to SUB1.
Table 4
|
Genotype |
Chromosome 9a,b
|
|
Marker |
RM8206 |
ART5 |
RM464 |
RM8300 |
RM6920 |
RM5515 |
RM5526 |
RM219 |
SC30 |
RM23958 |
|
Physical position (Mb) |
5.92 |
6.30 |
6.58 |
6.60 |
7.01 |
7.15 |
7.31 |
7.89 |
8.00 |
8.00 |
|
PIC Value |
0.157 |
0.484 |
0.425 |
0.325 |
0.537 |
0.493 |
0.374 |
0.527 |
0.568 |
0.439 |
|
Swarna-Sub1 |
152 |
200 |
262 |
200 |
300 |
n/a |
172 |
202 |
178 |
98 |
|
Samba Mahsuri-Sub1 |
152 |
200 |
262 |
200 |
300 |
124 |
170 |
206 |
178 |
80 |
|
CR1009-Sub1 |
152 |
200 |
262 |
200 |
300 |
124 |
172 |
208 |
184 |
98 |
|
BR11-Sub1 |
152 |
200 |
262 |
200 |
250 |
126 |
172 |
204 |
178 |
98 |
|
PSBRc82-Sub1 |
152 |
200 |
262 |
200 |
300 |
126 |
172 |
204 |
170 |
80 |
|
Ciherang-Sub1 |
152 |
200 |
262 |
200 |
300 |
126 |
170 |
206 |
170 |
80 |
|
PSBRc18-Sub1 |
154 |
200 |
262 |
200 |
250 |
126 |
170 |
206 |
190 |
98 |
|
IR64-Sub1 |
152 |
200 |
262 |
200 |
300 |
126 |
170 |
206 |
178 |
80 |
|
Sabitri |
152 |
210 |
262 |
198 |
300 |
124 |
170 |
206 |
170 |
80 |
|
IR6 |
152 |
210 |
300 |
200 |
250 |
124 |
172 |
208 |
178 |
80 |
|
Super basmati |
158 |
210 |
258 |
200 |
300 |
128 |
172 |
206 |
190 |
82 |
|
IR09F185 |
152 |
200 |
262 |
200 |
300 |
126 |
172 |
206 |
178 |
80 |
|
IR67440-NDR-5-1-1-1-1 |
152 |
210 |
262 |
198 |
250 |
124 |
170 |
206 |
170 |
80 |
|
FR13Ab
|
152 |
200 |
262 |
200 |
300 |
126 |
172 |
202 |
178 |
82 |
|
IR40931 |
152 |
200 |
262 |
200 |
250 |
126 |
172 |
202 |
178 |
82 |
|
IR49830 |
152 |
200 |
262 |
200 |
300 |
124 |
170 |
206 |
170 |
80 |
|
IR42 |
152 |
210 |
262 |
198 |
290 |
124 |
170 |
206 |
170 |
80 |
|
IRRBB66 |
152 |
210 |
300 |
200 |
290 |
124 |
170 |
206 |
178 |
80 |
|
OR 142-99 |
152 |
210 |
270 |
198 |
250 |
124 |
172 |
208 |
178 |
98 |
|
IRRI 119 |
152 |
n/a |
n/a |
200 |
290 |
126 |
172 |
206 |
178 |
80 |
|
IRRI 154 |
152 |
210 |
270 |
198 |
290 |
128 |
170 |
206 |
190 |
80 |
|
FL478 |
152 |
210 |
262 |
198 |
300 |
124 |
170 |
206 |
184 |
80 |
|
IR74371 |
154 |
n/a |
300 |
200 |
300 |
124 |
172 |
204 |
178 |
78 |
Table 5Percentage of polymorphic SNP markers and average PIC value per chromosome.
Table 5
|
Chr. |
Total |
% monomorphic |
% polymorphic |
PIC Min |
PIC Max |
PIC Ave |
|
1 |
45 |
8.9 |
91.1 |
0.045 |
0.531 |
0.314 |
|
2 |
37 |
8.1 |
91.9 |
0.130 |
0.574 |
0.381 |
|
3 |
44 |
13.6 |
86.4 |
0.045 |
0.574 |
0.310 |
|
4 |
31 |
3.2 |
96.8 |
0.087 |
0.588 |
0.342 |
|
5 |
33 |
0.0 |
100.0 |
0.087 |
0.490 |
0.289 |
|
6 |
38 |
2.6 |
97.4 |
0.045 |
0.501 |
0.323 |
|
7 |
28 |
3.6 |
96.4 |
0.087 |
0.527 |
0.319 |
|
8 |
27 |
0.0 |
100.0 |
0.124 |
0.580 |
0.377 |
|
9 |
24 |
0.0 |
100.0 |
0.087 |
0.530 |
0.320 |
|
10 |
19 |
5.3 |
94.7 |
0.087 |
0.517 |
0.382 |
|
11 |
31 |
0.0 |
100.0 |
0.045 |
0.537 |
0.343 |
|
12 |
26 |
3.9 |
96.2 |
0.087 |
0.501 |
0.331 |
Table 6Set of genotyping SNPs based on PIC value.
Table 6
|
Chr |
SNP |
Position (Mb) |
PIC Values |
|
1 |
id1003559 |
4.3 |
0.5308 |
|
1 |
id1004817 |
6.1 |
0.4292 |
|
1 |
ud1000727 |
16.1 |
0.5267 |
|
1 |
id1010609 |
19.1 |
0.5174 |
|
1 |
id1023158 |
38.2 |
0.5290 |
|
1 |
id1028304 |
44.7 |
0.5015 |
|
2 |
id2008501 |
22 |
0.5578 |
|
2 |
id2008866 |
23.2 |
0.4728 |
|
2 |
id2010969 |
26.1 |
0.4898 |
|
2 |
id2011561 |
27.2 |
0.4842 |
|
2 |
id2014684 |
34 |
0.5743 |
|
2 |
id2015767 |
35.8 |
0.5743 |
|
3 |
id3000362 |
0.7 |
0.5743 |
|
3 |
id3005216 |
10.1 |
0.4842 |
|
3 |
id3008333 |
17.3 |
0.4336 |
|
3 |
id3011383 |
27.8 |
0.5229 |
|
3 |
id3013669 |
29.9 |
0.4842 |
|
3 |
id3015399 |
32.9 |
0.3750 |
|
4 |
ud4000438 |
5.8 |
0.5771 |
|
4 |
id4003973 |
13.5 |
0.5629 |
|
4 |
id4007105 |
21.8 |
0.5880 |
|
4 |
id4007444 |
22.8 |
0.5724 |
|
4 |
id4009293 |
28.6 |
0.5880 |
|
4 |
id4010924 |
32.3 |
0.5015 |
|
5 |
id5000015 |
0 |
0.4898 |
|
5 |
id5001470 |
2.5 |
0.4842 |
|
5 |
id5001756 |
3 |
0.4336 |
|
5 |
id5006311 |
15.7 |
0.4551 |
|
5 |
id5006821 |
17.1 |
0.3604 |
|
5 |
id5010661 |
23.7 |
0.3658 |
|
6 |
fd17 |
6.8 |
0.5015 |
|
6 |
id6004481 |
7 |
0.3604 |
|
6 |
id6005350 |
8.2 |
0.4460 |
|
6 |
id6011018 |
21.8 |
0.4904 |
|
6 |
id6015793 |
28.5 |
0.4303 |
|
6 |
id6016490 |
30.1 |
0.4292 |
|
7 |
id7000461 |
2.7 |
0.4783 |
|
7 |
id7001478 |
8.2 |
0.4904 |
|
7 |
id7002051 |
12.2 |
0.4160 |
|
7 |
id7002105 |
13.4 |
0.5267 |
|
7 |
id7002427 |
15.9 |
0.4065 |
|
7 |
id7002859 |
19.2 |
0.3604 |
|
8 |
id8000699 |
2.2 |
0.4368 |
|
8 |
id8003681 |
12.5 |
0.5552 |
|
8 |
ud8001072 |
16.6 |
0.5798 |
|
8 |
id8004838 |
18.4 |
0.5743 |
|
8 |
id8006727 |
23.6 |
0.5290 |
|
8 |
id8007472 |
27.4 |
0.4160 |
|
9 |
id9000661 |
2.3 |
0.3967 |
|
9 |
id9000881 |
4.2 |
0.4160 |
|
9 |
id9003188 |
12.5 |
0.4470 |
|
9 |
id9003720 |
14.4 |
0.3845 |
|
9 |
id9004168 |
15.5 |
0.2970 |
|
9 |
id9006988 |
20.1 |
0.5298 |
|
10 |
id10000174 |
0.9 |
0.4470 |
|
10 |
id10001250 |
4 |
0.5174 |
|
10 |
id10001624 |
5.2 |
0.4792 |
|
10 |
wd10001251 |
6.3 |
0.4898 |
|
10 |
id10005538 |
18.9 |
0.4792 |
|
10 |
id10006726 |
21.9 |
0.4292 |
|
11 |
id11003924 |
10.8 |
0.5371 |
|
11 |
id11004398 |
15.1 |
0.4160 |
|
11 |
id11004812 |
16.6 |
0.4898 |
|
11 |
id11005065 |
17.3 |
0.4728 |
|
11 |
id11005646 |
18.4 |
0.4551 |
|
11 |
id11008862 |
24.9 |
0.4908 |
|
12 |
id12000252 |
0.7 |
0.5015 |
|
12 |
id12001996 |
4.4 |
0.4677 |
|
12 |
id12003019 |
7.6 |
0.3026 |
|
12 |
id12004491 |
12.5 |
0.4393 |
|
12 |
id12005205 |
14.6 |
0.3967 |
|
12 |
id12005501 |
15.7 |
0.4842 |
References
- Akagi H, Yokozeki Y, Inagaki A, Fujimura T. 1997. Highly polymorphic microsatellites of rice consist of AT repeats, and a classification of closely related cultivars with these microsatellite loci. Theor Appl Genet. 94: 61-67.
- Anderson JA, Churchill GA, Autrique JE, Sorrells ME, Tanksley SD. 1993. Optimizing parental selection for genetic linkage maps. Genome. 36: 181-186.
- Botstein D, White RL, Skolnick M, Davis RW. 1980. Construction of a genetic linkage map in man using restriction fragment length polymorphisms. Am J Hum Genet. 32: 314-331.
- Chen M, Presting G, Barbazuk WB, Goicoechea JL, Blackmon B, Fang G, Kim H, Frisch D, Yu Y, Sun S, Higingbottom S, Phimphilai J, Phimphilai D, Thurmond S, Gaudette B, Li P, Liu J, Hatfield J, Main D, Farrar K, Henderson C, Barnett L, Costa R, Williams B, Walser S, Atkins M, Hall C, Budiman MA, Tomkins JP, Luo M, Bancroft I, Salse J, Regad F, Mohapatra T, Singh NK, Tyagi AK, Soderlund C, Dean RA, Wing RA. 2002. An integrated physical genetic map of rice genome. Plant Cell. 14: 537-545.
- Chen X, Temnykh S, Xu Y, Cho YG, McCouch SR. 1997. Development of a microsatellite framework map providing genome-wide coverage in rice (Oryza sativa L.). Theor Appl Genet. 95: 553-567.
- Cho YG, Ishii T, Temnykh S, Chen X, Lipovich L, McCouch SR, Park WD, Ayres N, Cartinhour S. 2000. Diversity of microsatellites derived from genomic libraries and GenBank sequences in rice (Oryza sativa L.). Theor Appl Genet. 100: 713-722.
- Collard BCY, Mackill DJ. 2008. Marker-assisted selection: an approach for precision plant breeding in the twenty-first century. Phil Trans R Soc B. 363: 557-572.
- Collard BCY, Septiningsih EM, Das SR, Carandang JJ, Pamplona AM, Sanchez DL, Kato Y, Ye G, Reddy JN, Singh US, Iftekharuddaula KM, Venuprasad R, Vera-Cruz CN, Mackill DJ, Ismail AM. 2013. Developing new flood-tolerant varieties at the international rice research institute (IRRI). SABRAO J Breed Genet. 45: 42-56.
- Duran C, Appleby N, Clark T, Wood D, Imelfort M, Batley J, Edwards D. 2009. AutoSNPdb: an annotated single nucleotide polymorphism database for crop plants. Nucleic Acids Res. 37: D951-D953.
- Edwards D, Batley J. 2010. Plant genome sequencing: applications for crop improvement. Plant Biotech J. 8: 2-9.
- Gregorio GB, Islam MR, Vergara GV, Thirumeni S. 2013. Recent advances in rice science to design salinity and other abiotic stress tolerant rice varieties. SABRAO J Breed Genet. 45: 31-41.
- Hamblin MT, Warburton ML, Buckler ES. 2007. Empirical comparison of simple sequence repeats and single nucleotide polymorphism in assessment of maize diversity and relatedness. PLoS ONE. 2(12): e1367
- Iftekharuddaula KM, Newaz MA, Salam MA, Ahmed HU, Mahbub MAA, Septiningsih EM, Collard BCY, Sanchez DL, Pamplona AM, Mackill DJ. 2011. Rapid and high-precision marker assisted backcrossing to introgress the SUB1 QTL into BR11, the rainfed lowland rice mega variety of Bangladesh. Euphytica. 178: 83-97.
- IRGSP2005. The map-based sequence of the rice genome. Nature. 436: 793-800.
- Jena KK, Mackill DJ. 2008. Molecular Markers and Their Use in Marker-Assisted Selection in Rice. Crop Sci. 48: 1266
- Lin CH, Yeakley JM, McDaniel TK, Shen R. 2009. Medium- to high-throughput SNP genotyping using VeraCode microbeads. Methods Mol Biol. 496: 129-142.
- Liu K, Muse SV. 2005. PowerMarker: an integrated analysis environment for genetic marker analysis. Bioinformatics. 21: 2128-2129.
- Lacape JM, Dessauw D, Rajab M, Noyer JL, Hau B. 2007. Microsatellite diversity in tetraploid Gossypium gene pool: assembling a highly informative genotyping set of cotton SSRs. Mol Breed. 19: 45-58.
- Macaulay M, Ramsay L, Powell W, Waugh R. 2001. A representative, highly informative “genotyping set” of barley SSRs. Theor Appl Genet. 102: 801-809.
- Mackill DJ, Amante MM, Vergara BS, Sarkarung S. 1993. Improved semidwarf rice lines with tolerance to submergence of seedlings. Crop Sci. 33: 749-753.
- Mackill DJ, Ismail AM, Singh US, Labios RV, Paris TR. 2012. Development and rapid adoption of submergence-tolerant (Sub1) rice varieties. Adv Agron. 115: 303-356.
- McCouch SR, Teytelman L, Xu Y, Lobos KB, Clare K, Walton M, Fu B, Maghirang R, Li Z, Xing Y, Zhang Q, Kono I, Yano M, Fjellstrom R, Declerck G, Schneider D, Cartinhour S, Ware D, Stein L. 2002. Development and mapping of 2240 new SSR markers for rice (Oryza sativa L.) (supplement). DNA Res. 9: 257-279.
- McCouch SR, Zhao K, Wright M, Tung CW, Ebana K, Thomson M, Reynolds A, Wang D, Declerck G, Ali ML, McClung A, Eizenga G, Bustamante C. 2010. Development of genome-wide SNP assays for rice. Breed Sci. 60: 524-535.
- Moragues M, Comadran J, Waugh R, Milne I, Flavell AJ, Russel JR. 2010. Effects of ascertainment bias and marker number on estimations of barley diversity from high-throughput SNP genotype data. Theor Appl Genet. 120: 1525-1534.
- Narshimulu G, Jamaloddin M, Vemireddy LR, Anuradha G, Siddiq E. 2011. Potentiality of evenly distributed hyper-variable microsatellite markers in marker-assisted breeding of rice. Plant Breed. 130: 314-320.
- Nasu S, Suzuki J, Ohta R, Hasegawa K, Yui R, Kitazawa N, Monna L, Minobe Y. 2002. Search for and Analysis of Single Nucleotide Polymorphisms (SNPs ) in Rice (Oryza sativa, Oryza ruf ipogon) and Establishment of SNP Markers. DNA Res. 171: 163-171.
- Neeraja CN, Rodriguez RM, Pamplona A, Heuer S, Collard BCY, Septiningsih EM, Vergara G, Sanchez D, Xu K, Ismail AM, Mackill DJ. 2007. A marker-assisted backcross approach for developing submergence-tolerant rice cultivars. Theor Appl Genet. 115: 767-776.
- Panaud O, Chen X, McCouch SR. 1996. Development of microsatellite markers and characterization of simple sequence length polymorphism (SSLP) in rice (Oryza sativa L.). Mol Gen Genet. 252: 597-607.
- Rafalski A. 2002. Applications of single nucleotide polymorphisms in crop genetics. Curr Opin Plant Biol. 5: 94-100.
- Ribaut J-M, Hoisington D. 1998. Marker-assisted selection: new tools and strategies. Trends Plant Sci. 3: 236-239.
- Schatz MC, Maron LG, Stein JC, Wences AH, Gurtowski J, Biggers E, Lee H, Kramer M, Antoniou E, Ghiban E, Wright MH, Chia J, Ware D, McCouch SR, McCombie R. 2014. Whole genome de novo assemblies of three divergent strains of rice, Oryza sativa, document novel gene space of aus and indica. Genome Biol. 15: 506
- Septiningsih EM, Collard BCY, Heuer S, Bailey-Serres J, Ismail AM, Mackill DJ. 2013. Applying genomics tools for breeding submergence tolerance in rice. Varshney RK, Tuberosa R, editors. Translational genomics for crop breeding: Volume 2 - Improvement for abiotic stress, quality and yield improvement. Wiley-Blackwell. USA: pp. 9-30.
- Septiningsih EM, Hidayatun N, Sanchez DL, Nugraha Y, Carandang J, Pamplona AM, Collard BYC, Ismail AM, Mackill DJ. 2015. Accelerating the development of new submergence tolerant rice varieties: the case of Ciherang-Sub1 and PSB Rc18-Sub1. Euphytica. 202: 259-268.
- Septiningsih EM, Pamplona AM, Sanchez DL, Neeraja CN, Vergara GV, Heuer S, Ismail AM, Mackill DJ. 2009. Development of submergence-tolerant rice cultivars: the Sub1 locus and beyond. Ann Botany. 103: 151-60.
- Shete S, Tiwari H, Elston RC. 2000. On estimating heterozy-gosity and polymorphism information content value. Theor Popul Biol. 57: 265-271.
- Singh H, Deshmukh RK, Singh A, Singh AK, Gaikwad K, Sharma TR, Mohapatra T, Singh NK. 2009. Highly variable SSR markers suitable for rice genotyping using agarose gels. Mol Breed. 25: 359-364.
- Temnykh S, Park WD, Ayres N, Cartinhour S, Hauck N, Lipovich L, Cho YG, Ishii T, McCouch SR. 2000. Mapping and genome organization of microsatellite sequences in rice (Oryza sativa L.). Theor Appl Genet. 100: 697-712.
- Thomson MJ. 2014. High-Throughput SNP Genotyping to Accelerate Crop Improvement. Plant Breed Biotech. 2014: 195-212.
- Thomson MJ, Zhao K, Wright M, McNally KL, Rey J, Tung CW, Reynolds A, Scheflfler B, Eizenga G, McClung A, Kim H, Ismail AM, De Ocampo M, Mojica C, Reveche MY, Dilla-Ermita CJ, Mauleon R, Leung H, Bustamante C, McCouch SR. 2012. High-throughput single nucleotide polymorphism genotyping for breeding applications in rice using the BeadXpress platform. Mol Breed. 29: 875-886.
- Tung C-W, Zhao K, Wright MH, Ali ML, Jung J, Kimball J, Tyagi W, Thomson MJ, McNally K, Leung H, Kim H, Ahn S-N, Reynolds A, Scheffler B, Eizenga G, McClung A, Bustamante C, McCouch SR. 2010. Development of a Research Platform for Dissecting Phenotype–Genotype Associations in Rice (Oryza spp.). Rice. 3: 205-207.
- Varshney RK, Baum M, Guo P, Grando S, Ceccarelli S, Graner A. 2010. Features of SNP and SSR diversity in a set of ICARDA barley germplasm collection. Mol Breed. 26: 229-242.
- Varshney RK, Thiel T, Sretenovic-Rajicic T, Baum M, ValKoun J, Guo P, Grando S, Ceccarelli S, Graner A. 2008. Identification and validation of a core set of informative genic SSR and SNP markers for assaying functional diversity in barley. Mol Breed. 22: 1-13.
- Wu KS, Tanksley SD. 1993. Abundance, polymorphism and genetic mapping of microsatellites in rice. Mol Gen Genet. 241: 225-235.
- Xu K, Mackill DJ. 1996. A major locus for submergence tolerance mapped on rice chromosome 9. Mol Breed. 2: 219-224.
- Yang X, Xu Y, Shah T, Li H, Han Z, Li J, Yan J. 2011. Comparison of SSRs and SNPs in assessment of genetic relatedness in maize. Genetica. 139: 1045-1054.
- Zheng KL, Subudhi PK, Domingo J, Magpantay G, Huang N. 1995. Rapid DNA isolation for marker assisted selection in rice breeding. Rice Genet News. 12: 255-258.