Abstract
Capsinoids are the class of secondary metabolites identified in non-pungent peppers exhibiting the same bioactive properties as capsaicinoid. Previously, it has been demonstrated that capsinoid production is controlled by the capsaicin synthase (CS) gene and the putative-aminotransferase (pAMT) gene. In this study, we report that C. chinense ‘SNU11-001’ containing high levels of capsinoid has an early stop codon in pAMT resulted from 403 bp and 8 bp insertions deletion in the third and sixth exons. In order to know whether CS expression is correlated with the level of capsinoid, CS and pAMT expressions were determined using SNU11-001 and four Capsicum accessions with different pungency level. RT-PCR analysis showed higher transcription levels of CS in pungent accessions but no clear differences in pAMT expression. To investigate the effect of the substitution of the pAMT allele of C. chinense ‘Habanero’ with the dysfunctional pAMT allele of SNU11-001, an F2 population was constructed by a cross between aforementioned parental lines. Molecular markers were developed to distinguish CS and pAMT genotypes of SNU11-001 and Habanero and F2 plants were genotyped. All F2 plants having the pAMT genotype of SNU11-001 contained high levels of capsinoid while very low levels of capsaicinoid. There was no significant difference in levels of capsinoid among the F2 plants regardless of CS genotypes. This may be due to strong CS expression of both parental lines. In conclusion, our results show that it is possible to develop a new Habanero cultivar with high capsinoid content by introducing a dysfunctional pAMT allele.
-
Key words: Capsaicinoid, Capsinoid, Capsiate, pAMT, CS, SNU11-001
INTRODUCTION
The pungency is a unique characteristic of genus
Capsicum caused by capsaicinoids in fruits. Capsaicinoids are alkaloids derived from placenta tissues of pepper and contain many biomedical functions such as antioxidation, cancer prevention, weight reduction, and cardiovascular regulation (
Thiele et al. 2008;
Xiu-Ju et al. 2011). Capsaicin, one of the capsaicinoid analogues, is synthesized by capsaicin synthase (
CS) through condensation of vanillyl amine derived from the phenylpropanoids pathway and 8-methyl-6-nonenoic acid from the valine pathway. Vanillin is converted to vanillylamine by putative aminotransferase (
pAMT) (
Xiu-Ju et al. 2011).
Capsinoid, capsaicinioid-like substance was first reported by
Yazawa in 1989. Capsiate, one of the capsinoid analogues, has the same structure as capsaicin except for replacement of a peptide bond (NH) by an ester bond (O). The replacement of peptide bond with ester bond causes nonpungency or low-pungency of capsinoid. Low-pungency of capsiate makes it more palatable and less toxic than capsaicin. Capsinoid are unstable and easily degraded in the aqueous phase. Therefore, capsinoid has advantage over capsaicinoid in biomedical uses (
Sharma et al. 2013).
Several genetic studies have been conducted on biosynthesis of capsinoid. Biosynthesis of capsinoid is caused by mutations in the
pAMT gene resulting in suppression of the formation vanillylamine from vanillin (
Lang et al. 2009;
Tanaka et al. 2010a). Dysfunction of
pAMT shunts synthesis vanillylamine into vanillyl alcohol.
Tanaka et al. (2010) identified several loss-of-function in
pAMT alleles that rendered production of capsinoid in pepper. Capsaicin synthase encoded by the
Pun1 locus is required for biosynthesis of both capsaiciniod and capsinoid (
Han et al. 2013).
Quatitative control of capsinoid synthesis can be affected by other factors besides
pAMT and
CS. Capsaicinoid accumulation is affected by environmental conditions and genetic constitutions. Genetic studies on capsaicinoid content have been conducted using QTL analysis and molecular mapping. Six QTLs in capsaicinoid accumulation were identified explaining 31% of the phenotypic variation (
Ben-Chaim et al. 2006). The same genetic factors controlling capsaicinoid accumulation may be involved in capsinoid accumulation. Genetic study of capsinoid biosynthesis has been performed since capsinoid was discovered in 1980s. However, quantitative control of capsinoid in pepper has not been elucidated.
The purpose of this research was to investigate the genetic factors affecting capsinoid accumulation and to test the possibility to develop a new Habanero cultivar with high capsinoid content by introducing a dysfuctional pAMT allele. To achieve the objectives, analysis of capsaicinoid and capsinoid content and genotype analysis of pAMT and CS were performed in an F2 population derived from crossed between C. chinense ‘SNU11-001’ and C. chinense ‘Habanero’.
MATERIALS AND METHODS
Plant materials
A total of six Capsicum cultivars containing different levels of capsaicinoid and capsinoid were used. C. chinense ‘SNU11-001’ contains the highest level of capsinoid and the lowest level of capsaicinoid. C. annuum ‘Early Calwonder (ECW)’ produces no capsaicinoid and capsinoid. C. annuum ‘Yuwol-cho’ and C. annuum ‘Takanotsume’, which are Korean and Japanese landraces, respectively, have mild pungency. C. chinense ‘Habanero’ and ‘Jolokia’ are very pungent cultivars.
SNU11-001 and Habanero were used to construct a mapping population. Nine F1 and 215 F2 plants were grown in Seoul National University farm (Suwon, Korea).
pAMT and CS genotype analysis
For genotyping of
pAMT of SNU11-001, two types of molecular markers were developed. To design SCAR markers,
pAMT sequence was obtained from
C. annuum genome database (
http://cab.pepper.snu.ac.kr). The first primer set, at the third intron F and R, was designed to detect insertion of repeat sequence on the third intron of the
pAMT gene which is specific to
C. chinense. The second marker, the third intron
Tcc-R3 and third intron (R), was designed to detect the transposable element on the third intron in the
pAMT gene which is specific to SNU11-001.
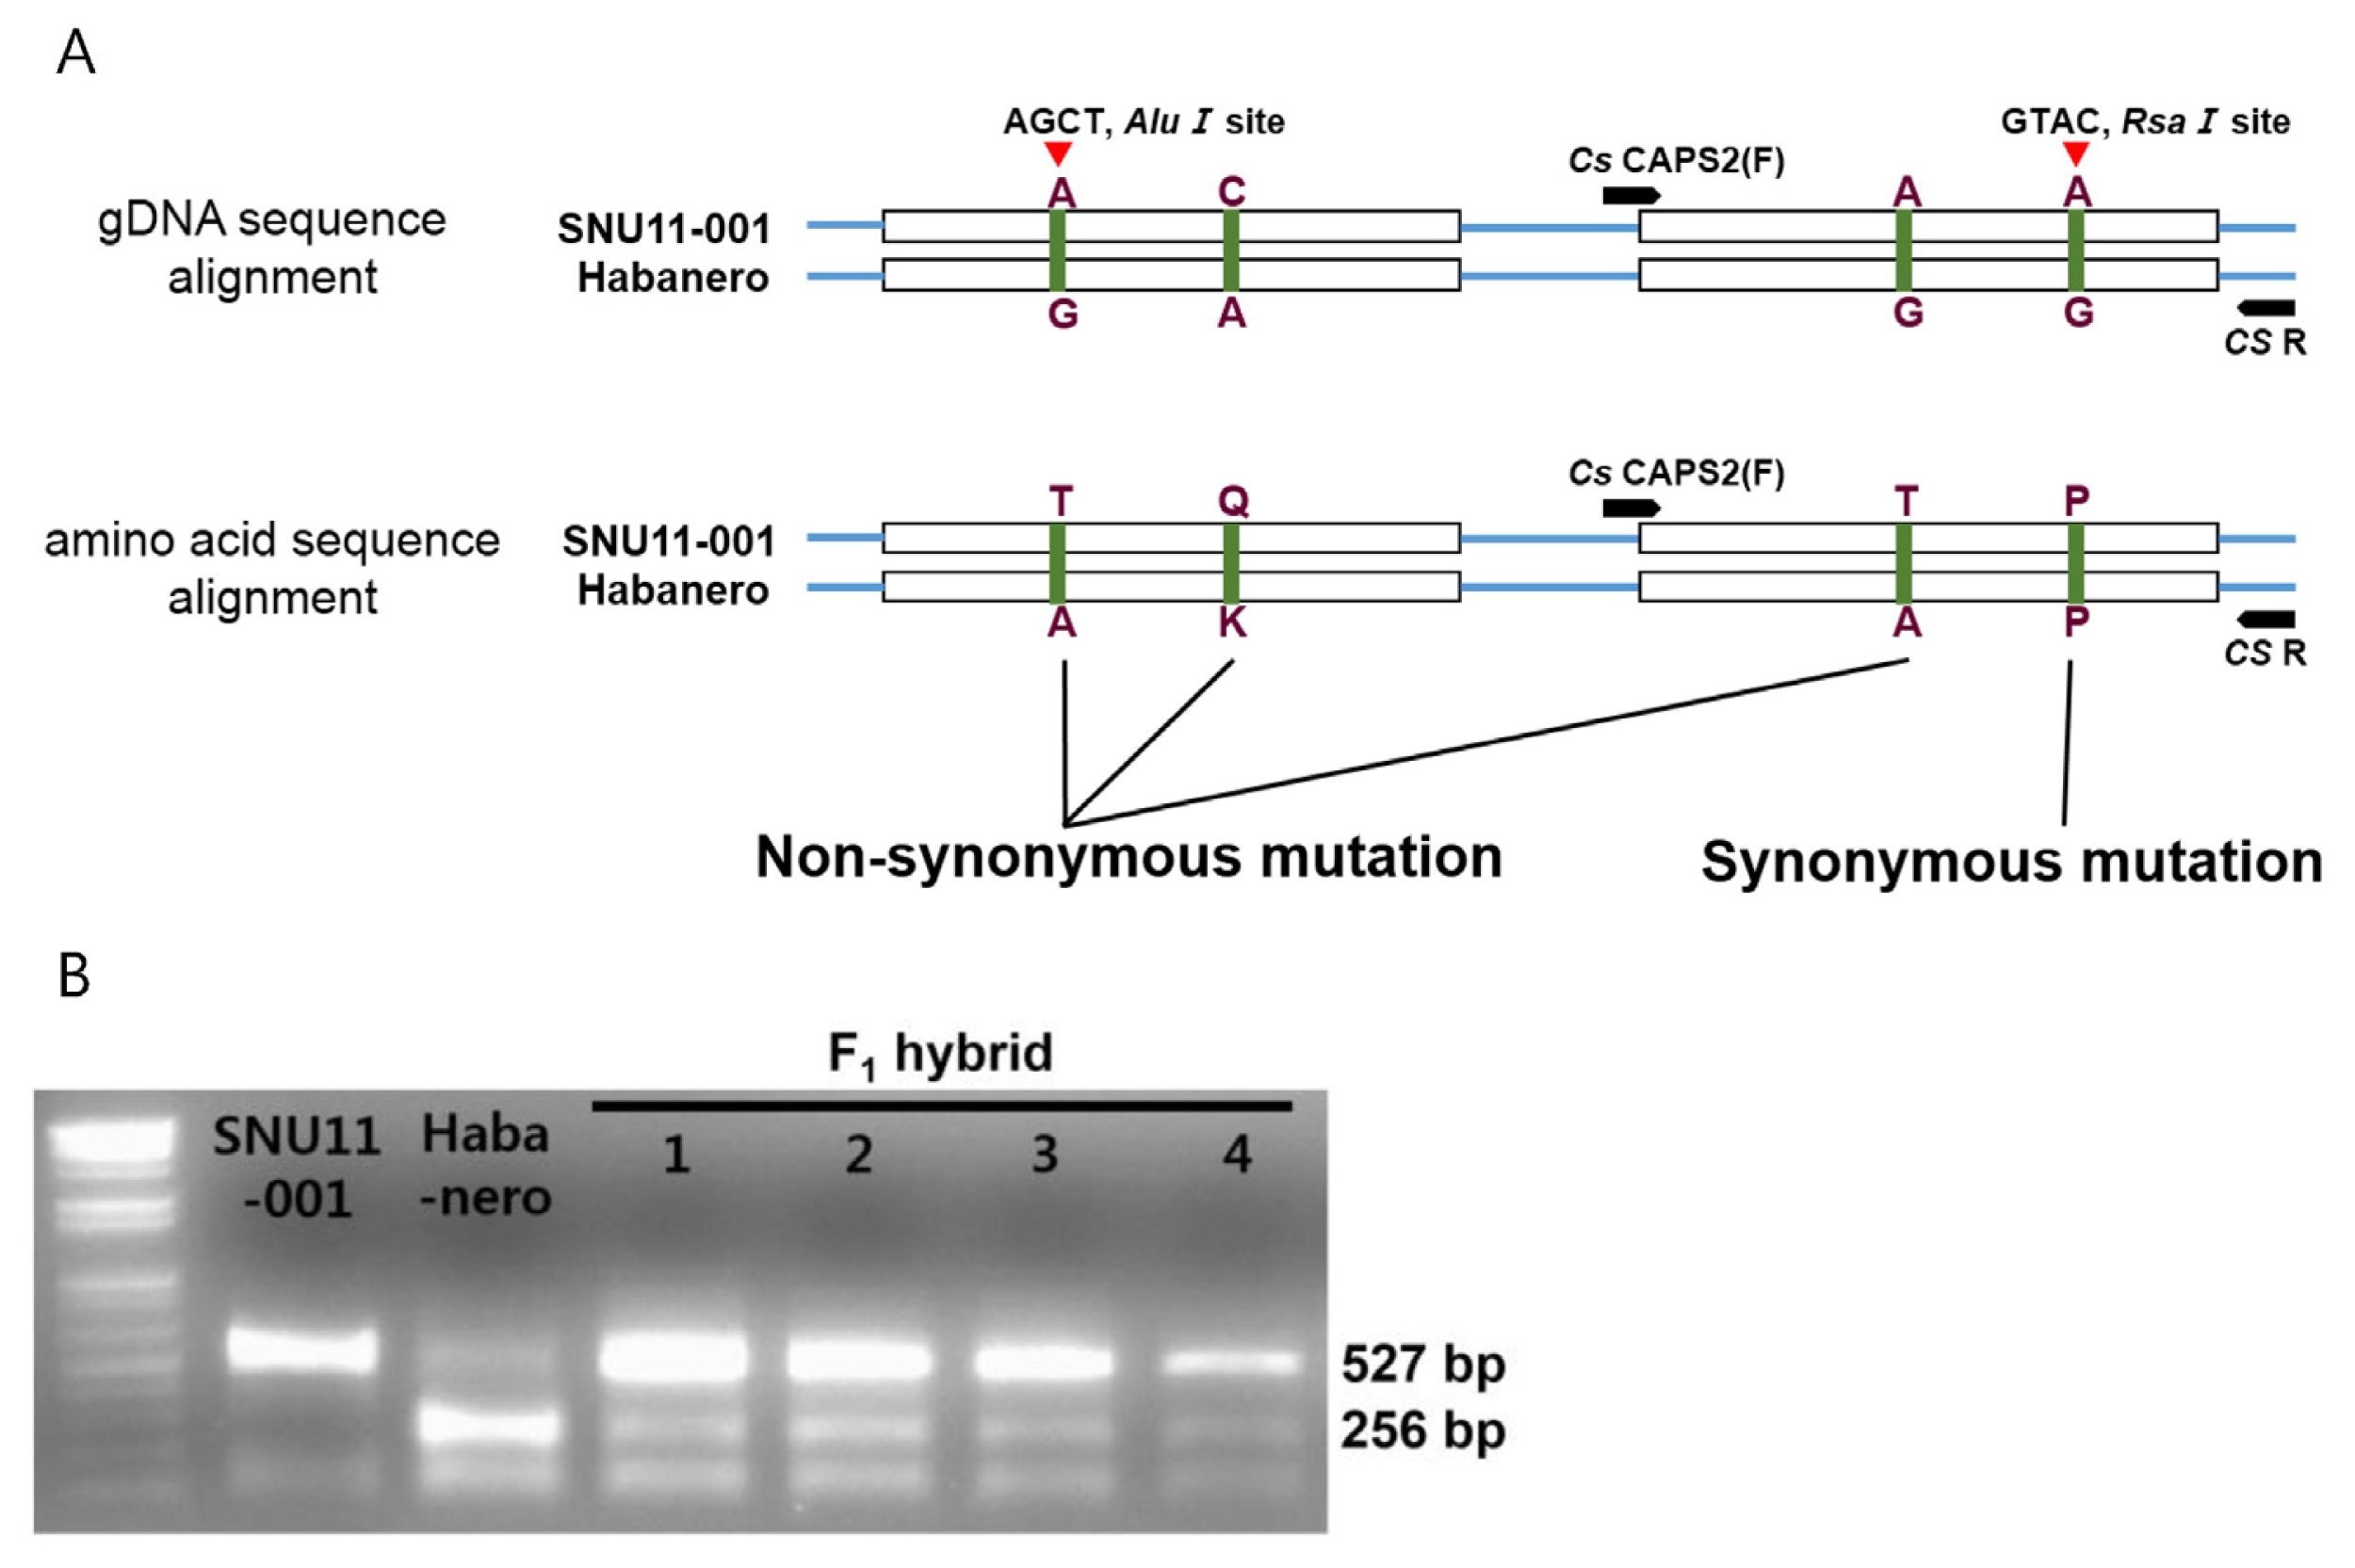
To distinguish the CS genotype between SNU11-001 and Habanero, two CAPS markers were developed. First marker was designed in the first exon using Alu1 site and the other marker was designed in the second exon using Rsa1 site. The latter marker was used for the CS genotyping, since it showed clearer band pattern than the former.
To determine the pAMT genotype of SNU11-001, polymerase chain reaction was performed in a 25 μl final volume containing 50 ng template DNA concentration, 10 pmol of reverse and forward primers, dNTP, 10x Hipi buffer and 1 unit of Taq polymerase.
PCR was performed with following conditions: 94ºC preheating for 5 minutes followed by 35 cycles of 94 ºC for 30 seconds, 60ºC for 30 seconds, 72ºC for 1 minutes and a final extension of 10 minutes at 72ºC. PCR condition to determine the CS genotype was similar to that of the pAMT genotype analysis. Except the annealing temperature which was standardized at 57ºC.
DNA extraction
Total genomic DNA was extracted from young leaves by CTAB method as described previously (
Han et al. 2013). Nanodrop (Nanodrop Technology, Inc., Wilmington, DE, USA) was used to determine the concentration of genomic DNA. DNA samples were dissolved in the final volume of 30 μl in TE buffer (pH7.0).
Total RNA was isolated from the placenta 20 days after fruit setting by TRIzol reagent (Invitrogen, Korea) method (
Han et al. 2013). RNA samples were diluted in RNAse- free water (Hybrid-R, GeneAll Biotechnology, Seoul, Korea). RNA concentration was measured at Nanodrop. To synthesize cDNA, reverse-transcriptional PCR was performed in a 20μl PCR volume containing M-MLV 5x reaction buffer, dNTP, M-MLV RT 200 units and mixture of mRNA and oligo dT for 1 hour at 42ºC.
Three fruits from individual plants were harvested from all
Capsicum accessions and SNU11-001 x Habanero F
1 and F
2 plants. Whole fruits including seeds were chopped and stored at −20ºC. HPLC analysis was performed in the Foundation of Agri. Tech. Commercialization and Transfer (FACT, Suwon, Korea) according to the method described by
Han et al. (2013).
RESULTS
Capsaicinoid and capsinoid content of the five cultivars
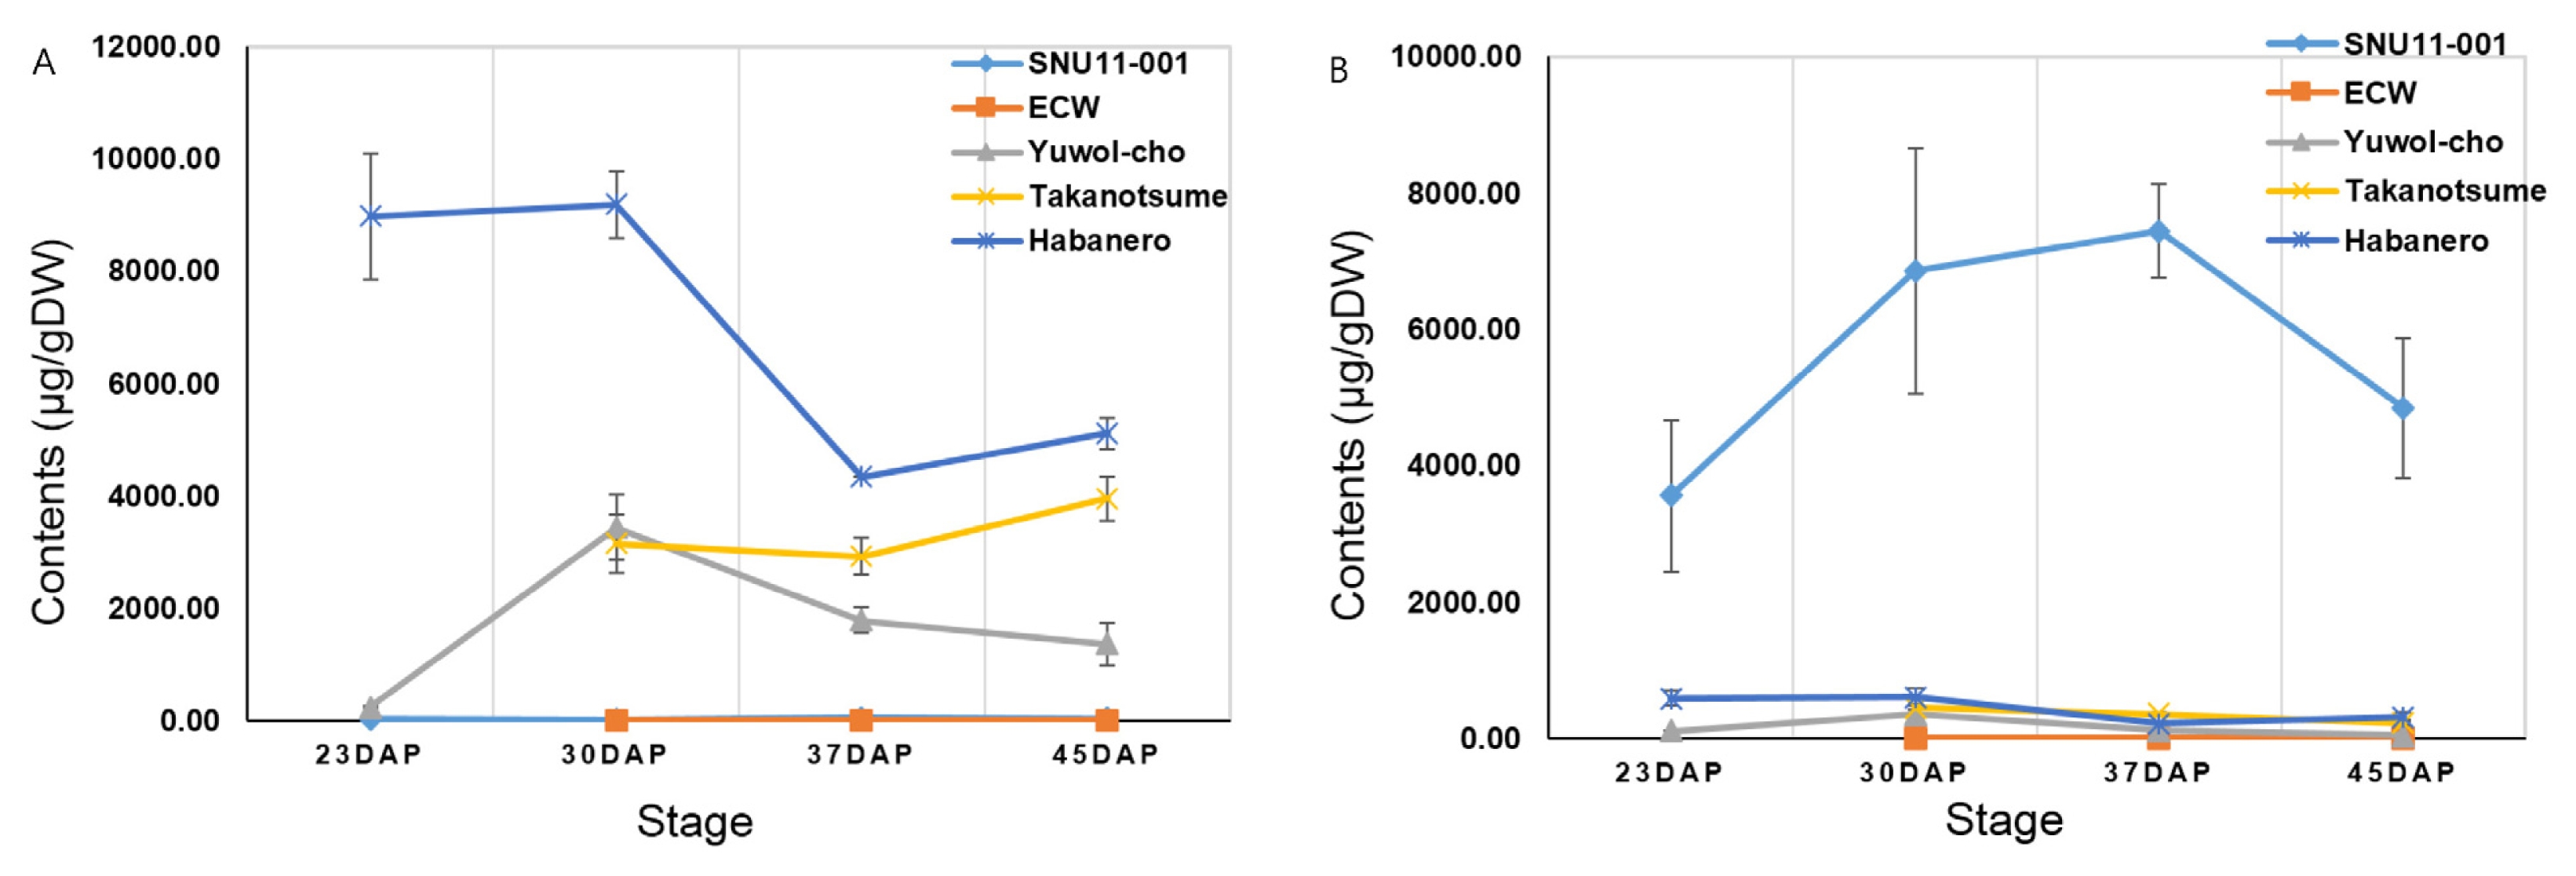
HPLC analysis was executed to measure capsaicinoid and capsinoid concentrations of five cultivars; SNU11-001, ECW, Yuwol-cho, Takanotsume and Habanero (
Table 1,
Fig. 1). It was assumed that
CS transcriptional level might be correlated with capsaicinoid content. Capsaicinoid and capsinoid content were measured at four different stages. Habanero contained the highest capsaicinoid concents (9195.3 ± 591.29 μg/gDW) among five cultivars at stage 2. Yuwol-cho and Takanotsume showed similar capsaicinoid levels, 3433.52 ± 588.23 μg/gDW and 3153.73 ± 518.04 μg/gDW, respectively. However, capsaicinoid content of Takanotsume was higher than those of Yuwol-cho at stage 3 and 4. ECW and SNU11-001 was marked with nondetectable capsaicinoid (16.13 ± 7.15 μg/gDW). On the other hand, the highest capsinoid level (6855.98 ± 1795.53 μg/gDW) was detected in SNU11-001 followed by Habanero, whereas no capsinoid was detected in ECW.
To investigate relationship between capsinoid production and Nonitalic activity, four F1 populations using SNU11-001 and four cultivars showing various levels of pungency (ECW, Yuwolcho, Takanotsume, Habanero) were constructed. In the interspecific crosses, C. annuum lines were used as a maternal parent and others as paternal parents to reduce the cross incompatibility. Only one F2 population was developed derived from the cross between SNU11-001 and Habanero due to interspecific cross incompatibility.
pAMT and CS expression patterns
pAMT and
CS expression patterns were tested in five cultivars. The primers for
pAMT and
CS were designed using an allele-specific sequences. The cDNA of
pAMT and
CS were amplified as 1455 bp and 1206 bp in size, respectively. cDNAs were prepared from RNA extracted from fruits after 20 and 45 days after fruit set were used (
Fig. 2).
pAMT transcripts were amplified at immature stage in all cultivars. Two pAMT transcripts with different sizes were detected in SNU11-001. The nonpungent cultivar ECW also expressed the pAMT gene. However, at mature stage, no pAMT expression was detected in all cultivars except Habanero. The CS gene was not expressed in ECW as expected. CS expression was detected in other cultivars including SNU11-001 at the immature stage. Habanero showed the highest CS expression among the tested cultivars. By contrast, almost no CS transcript was detected at the mature stage in all cultivars.
cDNA sequence analysis of pAMT and CS
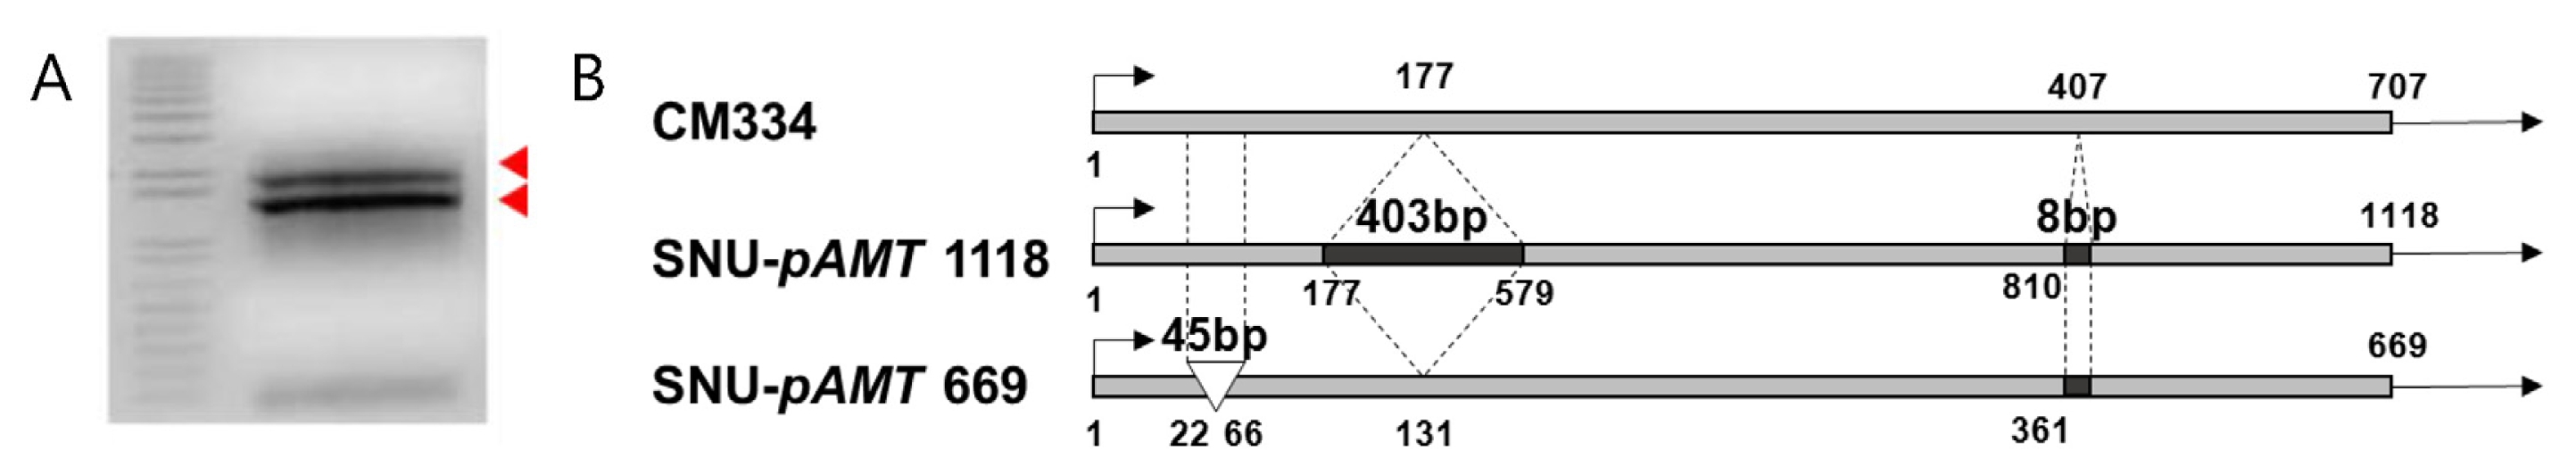
Two partial
pAMT transcripts were obtained from SNU11-001 (
Fig. 3). The longer transcript 1,118 bp in size contained a 403 bp insertion and 8 bp deletion in the third and sixth exons. The longer transcript was similar to that of Aji Dulce strain 2 (
Tanaka et al. 2010b). The smaller transcript had 45 bp deletion and 8 bp insertions. Both transcripts contained an early stop codon.
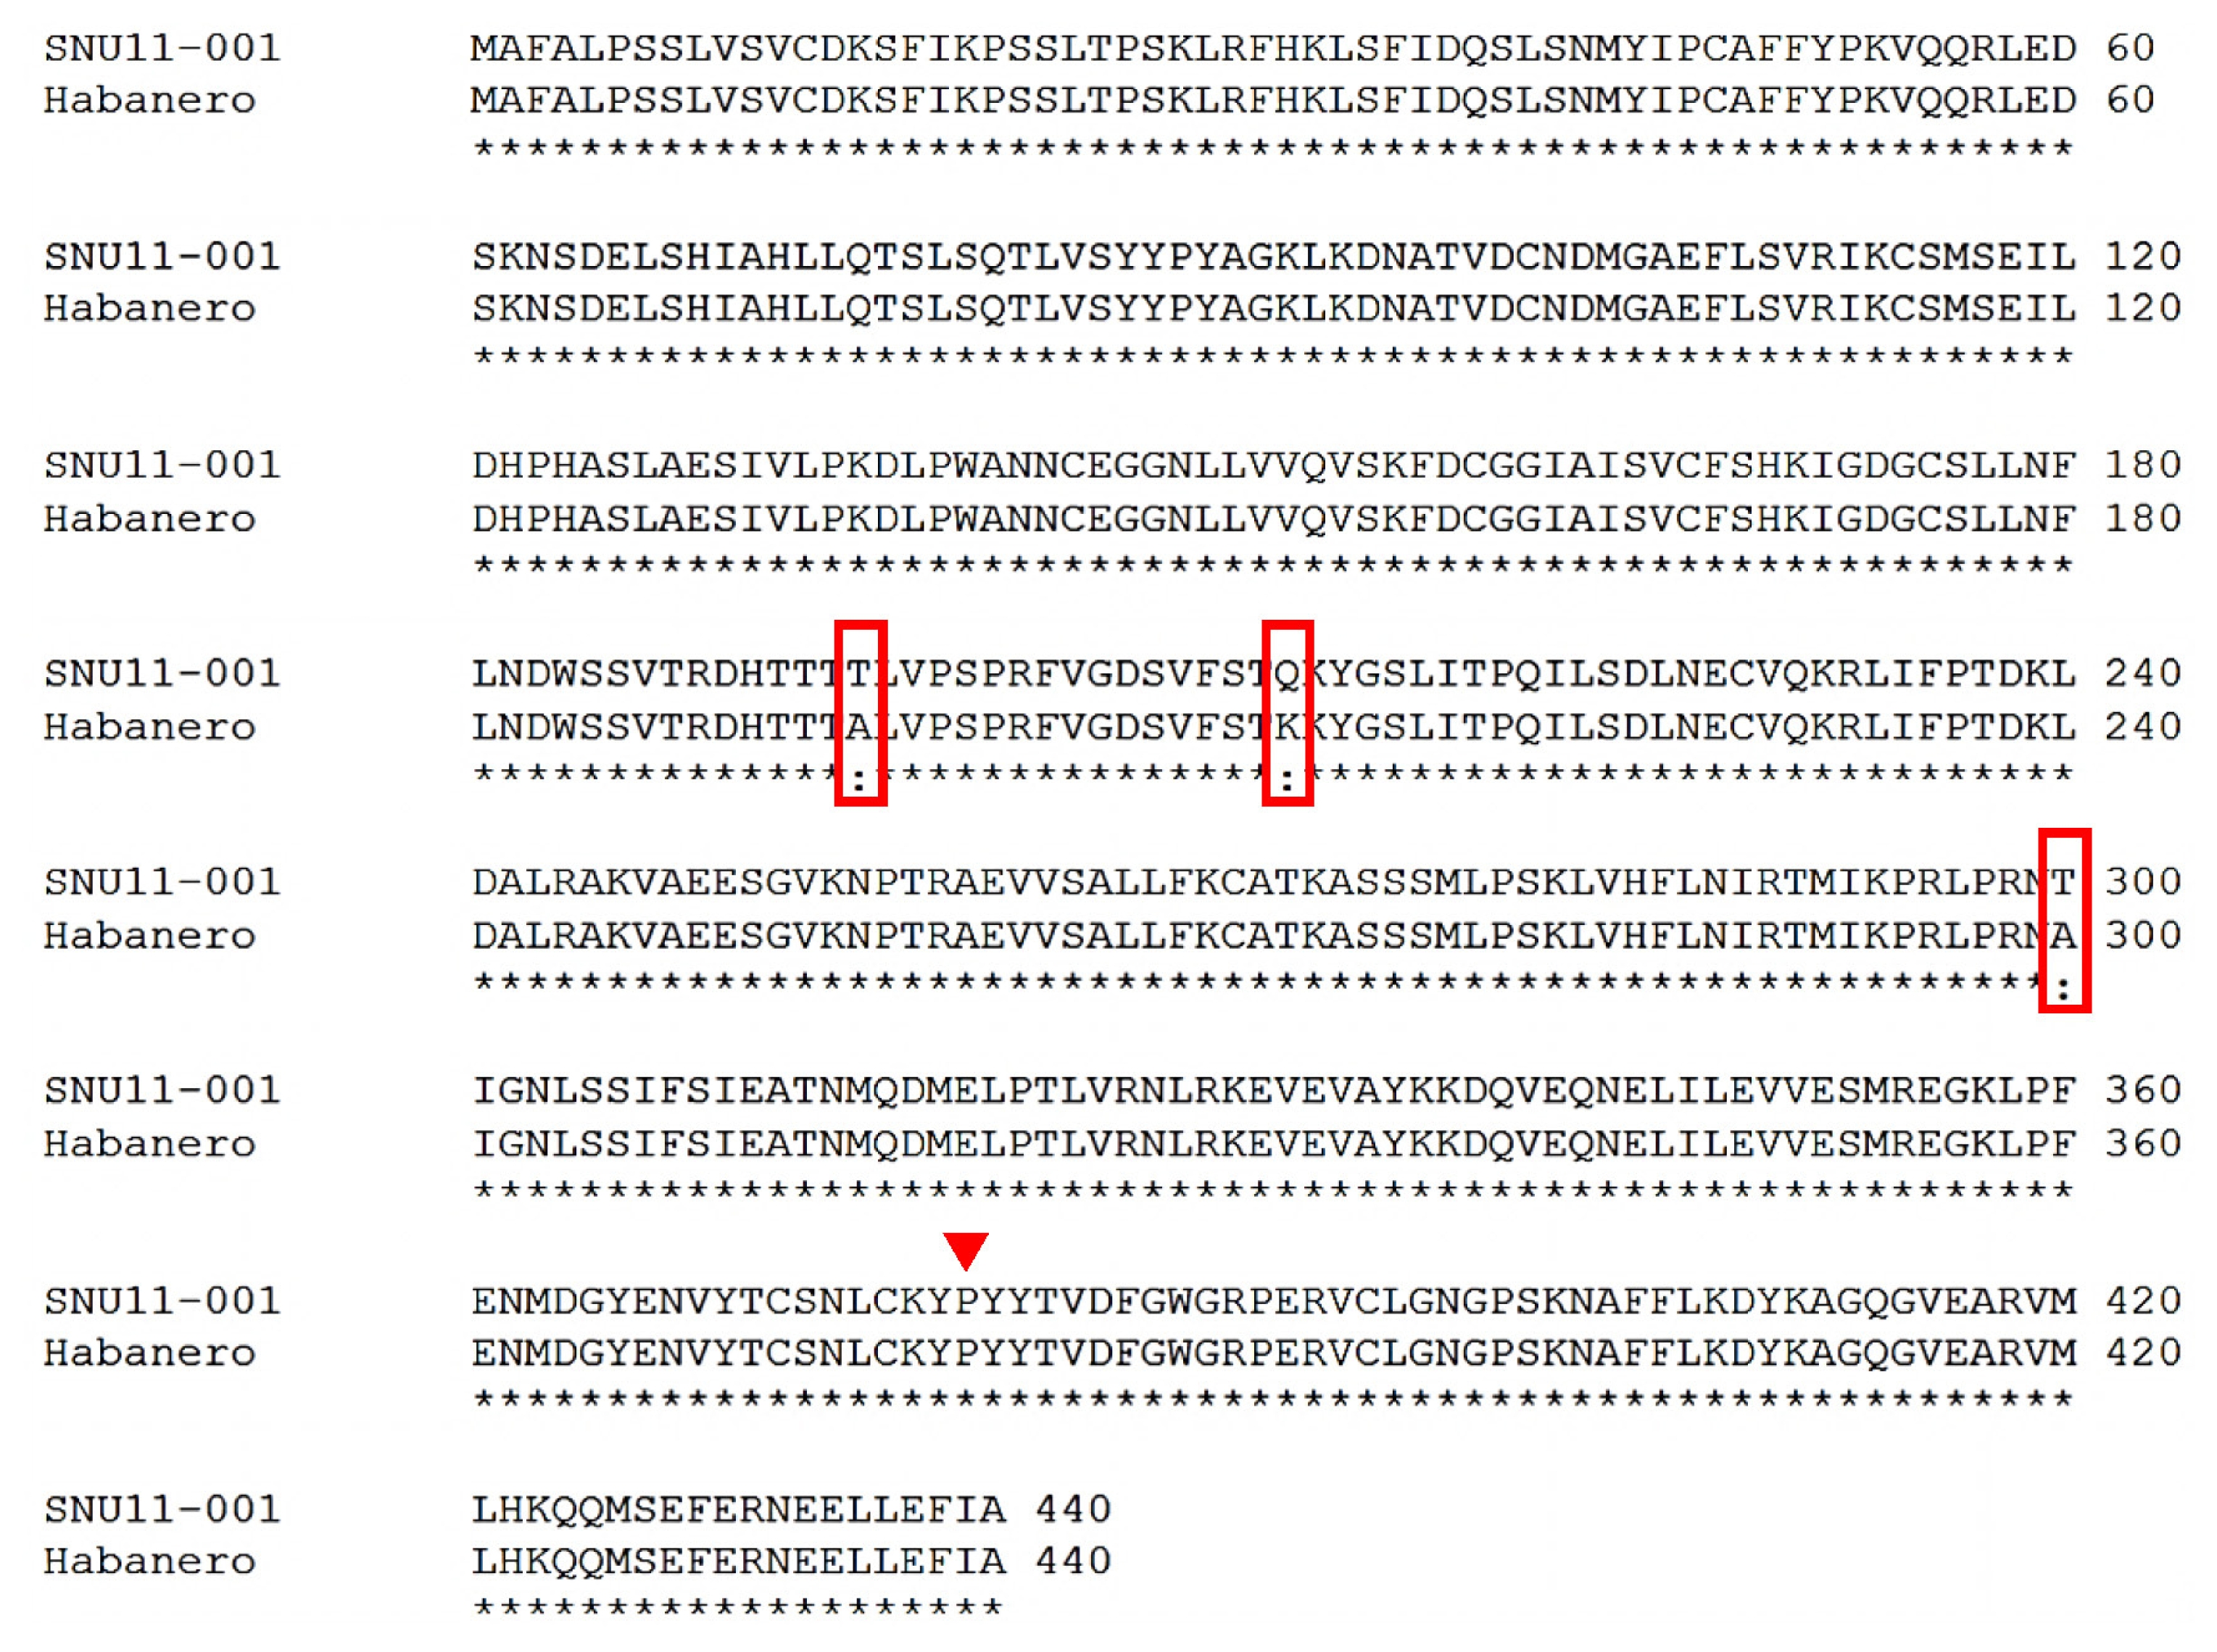
To identify sequence differences of
CS between SNU11- 001 and Habanero, full sequences of the coding region in both cultivars were obtained (
Fig. 4) and 4 SNPs were identified. Three SNPs resulted in amino-acid changes but one was a synonymous mutation. First two non-synonymous mutations were located in the first exon whereas the other was occurred in the second exon.
Two molecular markers were designed. One marker was developed for the
pAMT gene to detect the
pAMT mutant and the other marker was based on the
CS gene to distinguish
CS of SNU11-001 and Habanero.
pAMT marker was designated as SNU-
pAMT669. The insertion of transposable element (
Tcc) on the third intron of the
pAMT gene was specific to SNU11-001. This SCAR marker was developed from the sequence of
Tcc in the third intron of SNU11-011 (
Fig. 5). Therefore, the primer set differentiated
pAMT mutant cultivars which contain
Tcc element. On the other hand,
CS marker was developed to discriminate between normal
CS in two cultivars using a SNP (
Fig. 6). This marker set was based on the synonymous mutation in second exon which can be detected by
Rsa1 site. This CAPS marker was used to genotype
CS alleles in SNU11-001 x Habanero F
2 population.
pAMT and
CS genotyping analysis was performed for SNU11-001 x Habanero F
2 plant using SCAR and CAPS markers described above. Out of 215 F
2 individuals, 76, 84, and 49 plants turned out to have
pAMT/pAMT,
pAMT/pamt, and
pamt/
pamt genotypes, respectively (
Table 2). Overall, the segregation ratio did not fit an expected ratio 1:2:1 (p<0.05) and the number of
pAMT/
pamt heterozygote was less than expected. When F
2 plants were subjected to
CS genotyping,
CSS/
CSs,
CSH/
CSH and
CSS/
CSH genotypes were 50, 150 and 108, respectively (
Table 3).
Capsinoid and capsaicinoid content in plants having the pamt/pamt genotype
Capsaicinoid and capsinoid content was measured for 42
pamt/
pamt plants (
Table 4). All tested plants contained very low levels of capsaicinoid whereas capsinoid content were relatively high ranging from 1485.61 ± 115.58 to 6050.75 ± 698.74 μg/gDW (
Table 4). Capsinoid content in plant No. 76 was marked approximately 4 times higher as compared to No. 170. Capsinoid content of No. 76 was comparable to that of SNU11-001 (
Table 4).
Using the 42
pamt/
pamt plants, correlation between the
CS genotype with capsinoid content was investigated. Capsinoid content in plants having
CSS/
CSS,
CSH/
CSH and
CSS/
CSH were 3033.95d with, 2664.02 ± 198.43, and 2933.66 ± 309.53 μg/gDW, respectively (
Table 4). These results demonstrate that there is no significant difference in capsinoid content between
CS genotypes.
DISCUSSION
This research was conducted to investigate the genetic factors affecting capsinoid accumulation and to test the possibility to develop pepper cultivars with high capsinoid content by introducing a dysfuctional pAMT allele. We showed that substitution of the pAMT allele of ‘Habanero’ with the dysfuctional pAMT allele of ‘SNU11-001’ results in high levels of capsinoid in F2 plants.
In this study we identified and used a pepper accession
C. chinense ‘SNU11-001’. cDNA sequence structure of SNU11-001 is similar to Aji Dulce strain 2 in that SNU11- 001 has
Tcc element in third intron and 8 bp insertion (
Tanaka et al. 2010b). However, SNU11-001 is distinguished from Aji Dulce strain 2, since SNU11-001 has additional 45 bp deletion and remarkably higher capsinoid content as compared to Aji Dulce strain 2. Furthermore, capsinoid content was higher because it was measured in whole fruits of SNU11-001 while it was extracted from placenta and seeds in Aji Dulce strain 2 (
Tanaka et al. 2010b). It is expected that SNU11-001 would be useful for breeding cultivars with high capsinoid content.
A similar study was reported by a Japanese research group (
Tanaka et al. 2014). A cultivar named ‘Maru Salad’ was developed by crossing non-pungent pepper ‘Murasaki’ and ‘CH-19 Sweet’ which also has a dysfunctional
pAMT allele. This cultivar contains approximately 700 μg/gDW capsinoid, which is much lower than those of ‘CH-19 Sweet’ (5825 ± 286 μg/gDW) and of F
2 plants derived from SNU11-001. In this study, Habanero was selected to generate a population because of its high levels of capsaicinoid. It was assumed that the strong CS activity of Habanero causing high content of capsaicinoid could also contribute to capsinoid content.
However, we cannot rule out other factors that are also involved in the control of capsinoid content because plants with
CSS/
CSS,
CSH/
CSH and
CSS/
CSH contained almost similar concentration of capsinoid (3033.95 ± 383.82 μg/gDW, 2622.69 ± 207.26 μg/gDW and 2933.66 ± 309.53 μg/gDW, respectively). Other genes in capsaicin or capsinoid pathway could be
Pal,
Ca4h,
Comt, and
Kas (
Curry et al. 1999; Aluru
et al. 2003). If the factors causing high capsaicinoid content in Habanero had have the same effect on capsinoid content, QTL responsible for capsaicinoid might also control accumulation of capsinoid (Blum
et al. 2003;
Ben-chaim et al. 2006). For further study, F
2 populations using SNU11-001 and other cultivars with various pungency levels need to be developed to validate the relationship between
CS expression levels and capsinoid content.
ACKNOWLEDGMENTS
This work was supported by a grant (code: 0636-20140011) from the Vegetable Breeding Research Center through R&D Convergence Center Support Program, Ministry for Food, Agriculture, Forestry and Fisheries and by the Next-GenerationBioGreen 21 Program (Plant Molecular Breeding Center, No. PJ009083), Rural Development Administration, Republic of Korea.
Fig. 1Comparison of (A) capsaicinoid and (B) capsinoid content according to fruit developmental stages in five cultivars.

Fig. 2
pAMT and CS expression patterns in five cultivars by RT-PCR. Immature and mature stages correspond to 20 and 45 days after fruit set respectively. Actin was used as control. S SNU11-001, E ECW, Y Yuwol-cho, T Takanotsume, H Habanero.
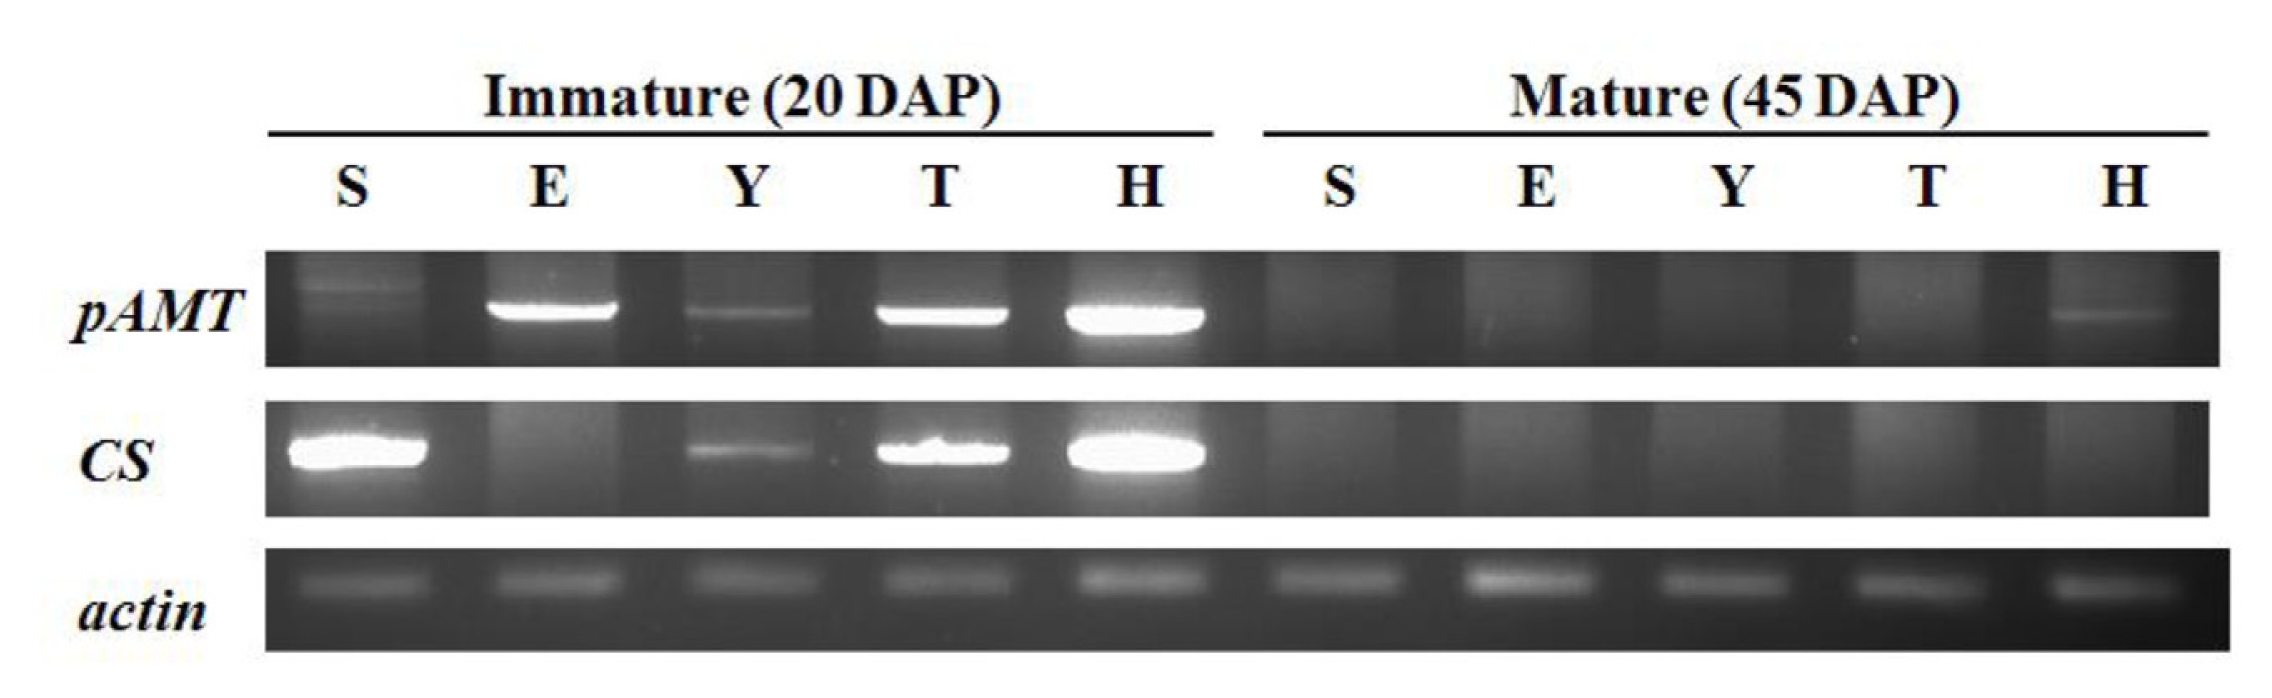
Fig. 3Two types of loss-of-function pAMT in SNU11-001. (A) Two types of pAMT transcript were detected in SNU11-001. (B) The longer transcript contains a 403 bp insertion between the third and the fourth exons and another 8 bp insertion but smaller transcript has 45 bp deletion and 8 bp insertion.

Fig. 4Amino acid sequence alignment of the CS gene in SNU11-001 and Habanero. Four mutations were detected. Three of them in the box are non-synonymous mutation and another marked with triangle is synonymous mutation.

Fig. 5Development of molecular markers to select pAMT mutant. (A) The SCAR marker set was designed from the sequence of Tcc in the third intron of SNU11-001 to select pAMT mutant plant. (B) PCR analysis of pAMT marker. Striped box corresponds to exon and black bar indicates marker.
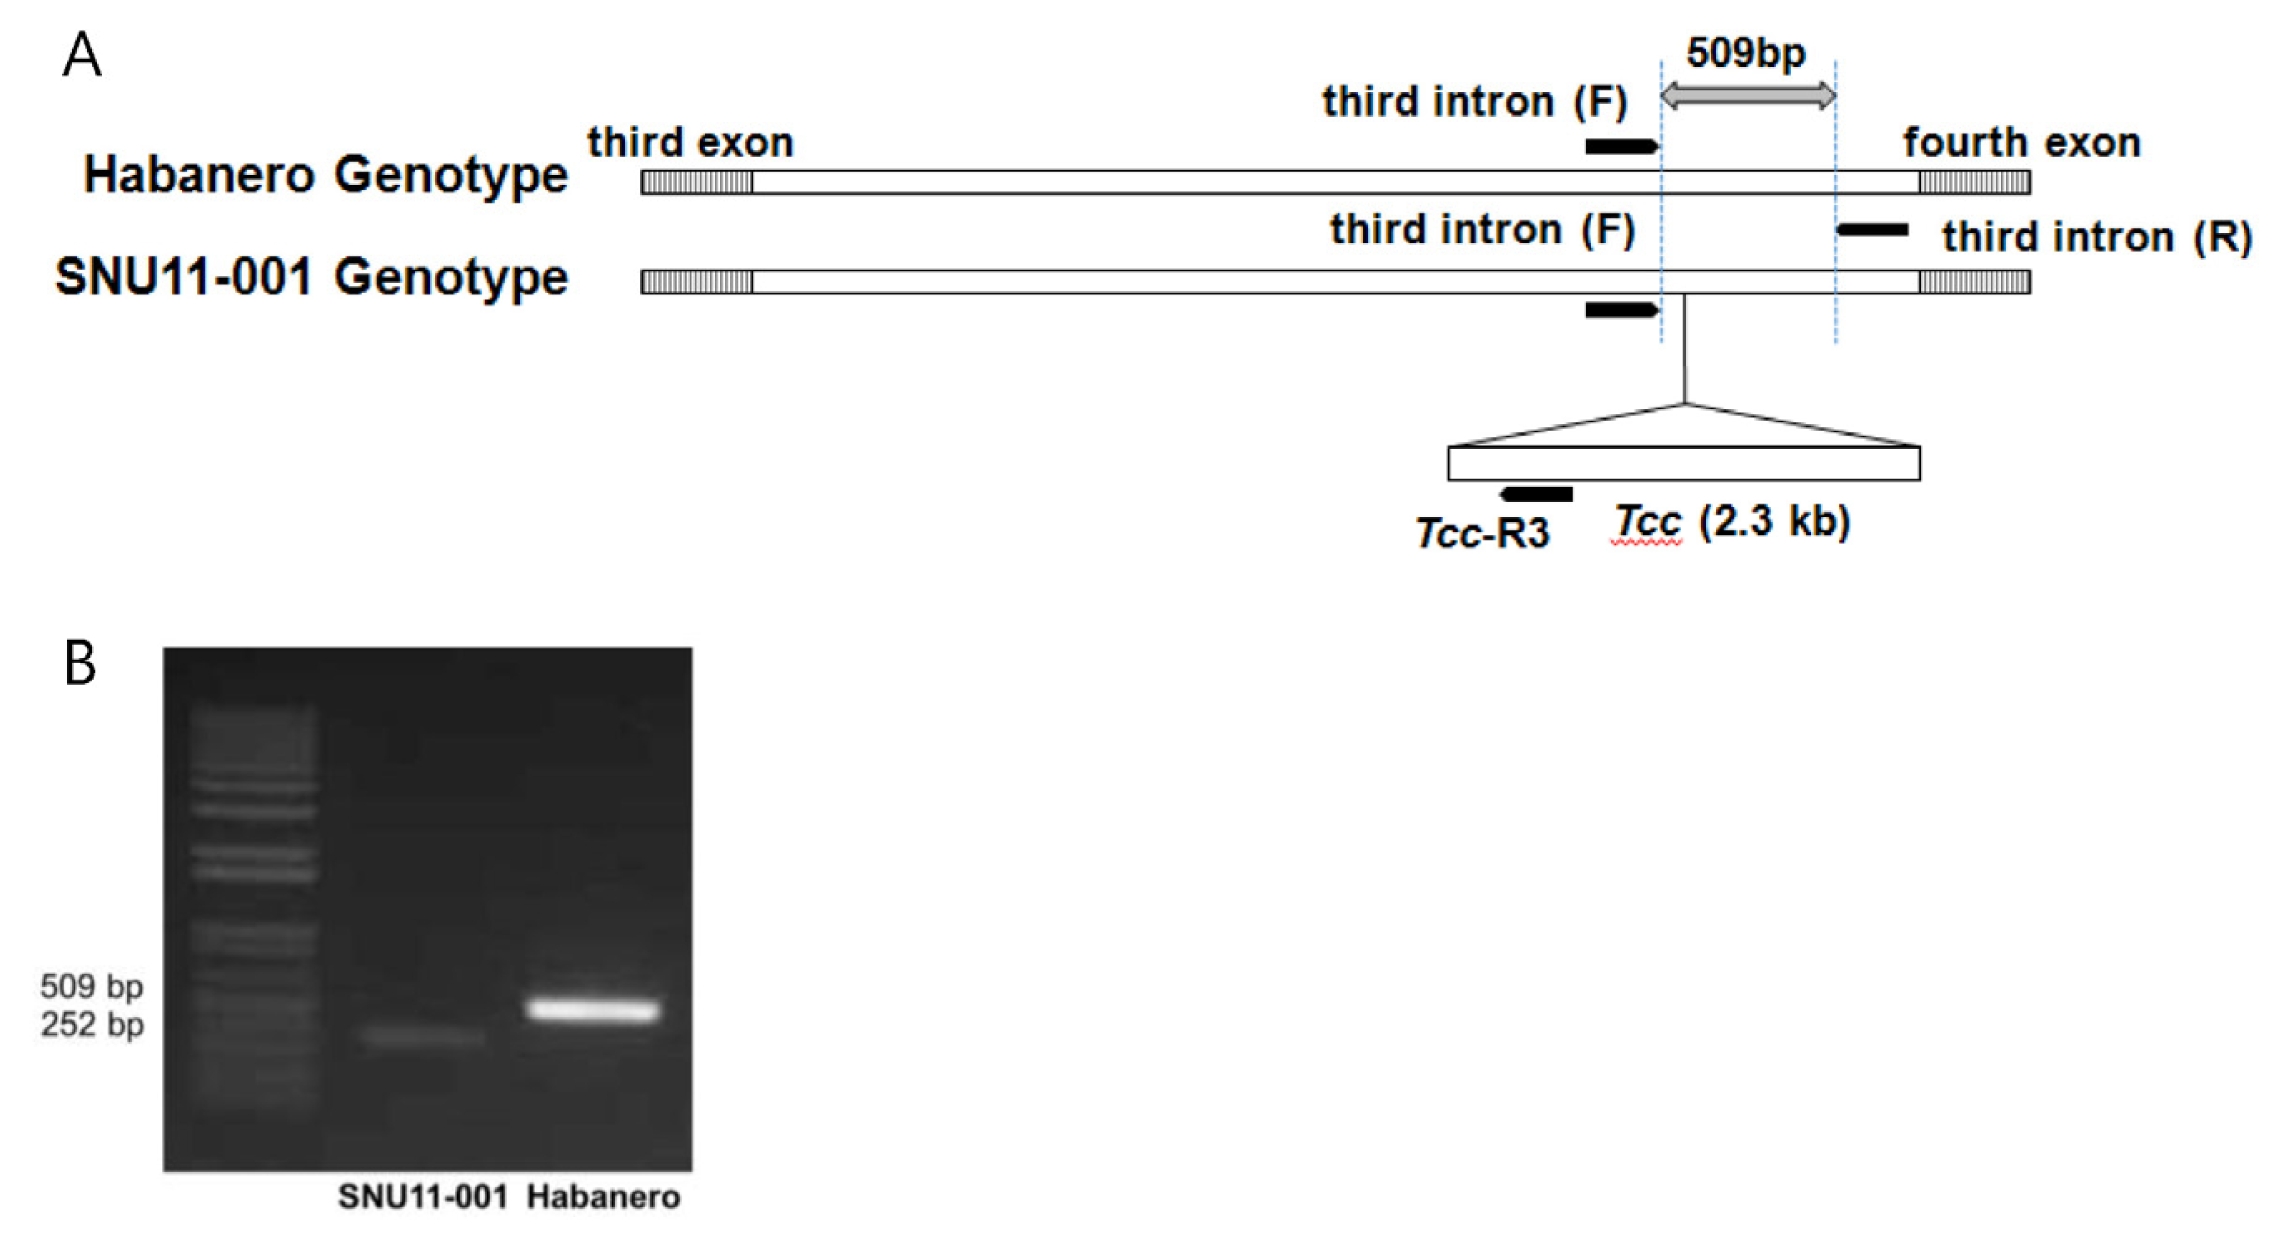
Fig. 6Development of molecular markers to distinguish the CS genotypes of SNU11-001 and Habanero. (A) SNP position and restriction sites distinguishing SNU-001 and Habanero. The CAPS marker set was developed in the second exon using Rsa 1 site to distinguish CS genotypes of SNU11-001 and Habanero. (B) CS marker analysis using SNU-001, Habanero, and F1 hybrids

Table 1Comparison of capsaicinoid and capsinoid content in five cultivars by HPLC analysis.
Table 1
|
Capsicum cultivars
|
species |
Stagey)
|
Capsaicinoid (μg/gDW) |
Capsinoid (μg/gDW) |
|
|
Capsaicin |
Dihydrocapsaicin |
Total |
Capsiate |
Dihydrocapsiate |
Total |
|
SNU11-001 |
C. chinense
|
1 |
17.9±5.26 |
15.5±4.79 |
33.4±10.04 |
2910.43±974.2 |
647.85±138.33 |
3558.28±1112.54 |
|
2 |
16.13±4.28 |
0 |
16.13±7.15 |
6106.47±1609.48 |
749.52±186.96 |
6855.98±1795.53 |
|
3 |
25.72±6.6 |
24.36±11.4 |
50.09±17.94 |
6669.92±613.8 |
771.88±90.47 |
7441.81±693.84 |
|
4 |
17.72±5.08 |
17.31±2.99 |
35.03±7.94 |
4352.9±925.64 |
487.96±110.79 |
4840.86±1032.86 |
|
|
ECW |
C. annuum
|
1 |
- |
- |
- |
- |
- |
- |
|
2 |
ndx)
|
nd |
nd |
nd |
nd |
nd |
|
3 |
nd |
nd |
nd |
nd |
nd |
nd |
|
4 |
nd |
nd |
nd |
nd |
nd |
nd |
|
|
Yuwol-cho |
C. annuum
|
1 |
116.52±10.29 |
125.45±4.09 |
241.97±6.19 |
87.59±3.58 |
22.9±3 |
110.48±0.59 |
|
2 |
1572.32±325.99 |
1861.19±317.44 |
3433.52±588.23 |
273.17±145.78 |
79.21±15.7 |
352.37±159.43 |
|
3 |
717.43±84.11 |
1063.48±152.96 |
1780.9±235.44 |
101.74±29.01 |
18.81±2.89 |
120.55±31.74 |
|
4 |
516.92±204.75 |
841.51±186.46 |
1358.44±391.21 |
30.25±8.13 |
12.53±0.27 |
42.78±7.86 |
|
|
Takanotsume |
C. annuum
|
1 |
- |
- |
- |
- |
- |
- |
|
2 |
1632.78±203.98 |
1520.95±322.53 |
3153.73±518.04 |
364.53±21.62 |
85.46±8.32 |
449.98±29.49 |
|
3 |
1362.76±92.97 |
1563.18±161.88 |
2925.93±324.81 |
275.4±22.97 |
82.58±7.09 |
357.98±29.96 |
|
4 |
1780.93±174.57 |
2172.31±359.59 |
3953.24±399.23 |
187.81±36.12 |
40±6.76 |
227.81±42.84 |
|
|
Habanero |
C. chinense
|
1 |
4771.1±677.47 |
4211.51±474.46 |
8982.62±1130.04 |
470.63±83.72 |
118.47±16.52 |
589.1±99.95 |
|
2 |
4655.94±566.67 |
4539.36±53.88 |
9195.3±591.29 |
488.82±102.01 |
114.84±23.02 |
603.66±128.81 |
|
3 |
2113.27±0*
|
2227.2±0*
|
4340.47±0*
|
169.34±0*
|
45.75±0*
|
215.1±0*
|
|
4 |
2456.59±143.4 |
2651.17±140.63 |
5107.75±277.74 |
255.44±59.45 |
58.28±6.37 |
313.71±65.54 |
Table 2Genotype analysis of pAMT and CS.
Table 2
|
F2 (SNU11-001 x Habanero) |
Pop. size |
Expected ratio |
pAMT genotype |
χ2 (p value) |
CS genotype |
Undetermined |
χ 2 (p value) |
|
|
|
pamt/pamt
|
pAMT/pamt
|
pAMT/pAMT
|
CSS/CSS
|
CSS/CSH
|
CSH/CSH
|
|
|
1:2:1 |
49 |
84 |
76 |
14.7674 (0.00062130) |
|
|
|
6 |
|
|
215 |
|
|
|
|
|
|
|
|
|
|
|
1:2:1 |
|
|
|
|
50 |
108 |
50 |
7 |
0.308 (0.8574) |
Table 3Inheritance pattern of pAMT and CS in SNU11-001 x Habanero F2 population.
Table 3
|
pAMT genotype |
Number of individuals |
CS genotype |
Number of individuals |
|
pamt/pamt
|
49 |
CSS/CSS
|
14 |
|
CSS/CSH
|
25 |
|
CSH/CSH
|
10 |
|
pAMT/pAMT
pAMT/pamt
|
160 |
CSS/CSS
|
36 |
|
CSS/CSH
|
83 |
|
CSH/CSH
|
40 |
Table 4Capsaicinoid and capsinoid content in pamt/pamt F2 plants with different CS genotypes.
Table 4
|
pamt mutant individual |
CS type |
Capsaicinoid (μg/gDW) |
Capsinoid (μg/gDW) |
|
|
|
Capsaicin |
Dihydrocapsaicin |
Capsaicinoid |
Capsiate |
Dihydrocapsiate |
Capsinoid |
|
6 |
CSS/CSH
|
50.15noid7 |
56.64noid8 |
106.79oid.85 |
2461.66id50.09 |
628.466id |
3090.06id53.29 |
|
15 |
CSH/CSH
|
31.4806id1 |
38.6306id8 |
70.1106id15 |
1639.35id80.97 |
536.255id.65 |
2175.61id27.96 |
|
18 |
CSS/CSH
|
39.5561id6 |
46.9761id46 |
86.5261id07 |
2602.74id10.73 |
380.784id.37 |
2983.52id28.45 |
|
23 |
CSS/CSH
|
30.9352id |
28.3752id2 |
59.3752id2 |
2132.12±284.9 |
608.632±284 |
2740.75±284.9t |
|
26 |
CSS/CSS
|
15.3475±28 |
13.8875±28 |
29.2275±28 |
1968.62±284.9t |
357.522±284. |
2326.15±284.9t |
|
38 |
CSS/CSH
|
36.1315±28 |
50.9915±284 |
87.1215±284 |
2400.28±284.9t |
417.548±284. |
2817.82±284.9t |
|
39 |
CSS/CSH
|
17.3482±284 |
20.6482±28 |
56.97±30.67 |
1660.430.67.9 |
222.2430.67 |
1993.720.67.9t |
|
42 |
CSS/CSH
|
23.1.720. |
30.45720.6 |
48.93720.67 |
2584.320.67.9t |
530.2820.67.9 |
3114.620.67.9 |
|
48 |
CSS/CSS
|
23.0562 |
14.0862 |
37.1362 |
2679.750. |
363.8450 |
3043.590. |
|
64 |
CSS/CSS
|
6.25.590. |
6.46.590. |
12.71590.6 |
2233.2±177.1 |
335.33±177.1 |
2568.52177.19t |
|
66 |
CSS/CSS
|
41.4652177 |
38.0652177. |
79.5252177. |
1821.85177.19t |
476.295177.1 |
2298.14177.19t |
|
69 |
CSS/CSS
|
37.8.1 |
45.5714 |
83.3714 |
2023.7117 |
368.5611 |
2392.2717 |
|
76 |
CSS/CSH
|
48.0427177 |
46.1627177 |
94.262717 |
4965.44177.19t |
1085.31±96.63 |
6050.75±96.63t |
|
83 |
CSS/CSS
|
38.7575±9 |
37.7275±96 |
76.4775±96 |
4126.75±96.63 |
609.025±96.6 |
4735.72±96.63t |
|
91 |
CSH/CSH
|
16.8.72± |
4.87.72±9 |
21.6772±96 |
3955.06±96.63t |
679.286±96.6 |
4634.34±96.63t |
|
93 |
CSS/CSH
|
2.73.34±9 |
4.31.34±9 |
7.04.34± |
2025.29±96.63t |
316.079±96.6 |
2341.36±96.63t |
|
96 |
CSH/CSH
|
18.4936±9 |
14.1936±96 |
32.6736±96 |
1444.06±96.63 |
396.946±96. |
1841946±96 |
|
99 |
CSS/CSH
|
19.3946±9 |
21.7646±96 |
41.0646±96. |
3352.42±96.63t |
620.182±96.6 |
3972.62±96.63 |
|
102 |
CSS/CSH
|
27.9.62±9 |
32.3262±96 |
60.2262±96 |
1358.05±96.612 |
185.675±96.6 |
1543.71±96.612 |
|
105 |
CSS/CSH
|
24.9271±9 |
20.5971±9 |
45.5171±96. |
2807.51±96.612 |
351.311±96.6 |
3158.81±96.612 |
|
112 |
CSS/CSH
|
31.9381±9 |
42.1681±96 |
74.0981±9 |
2935.99±96.612 |
364.329±96.6 |
3300.31±96.612 |
|
113 |
CSH/CSH
|
37.1431±96 |
38.2731±96 |
75.4131±96 |
3280.82±316.12 |
455.382±316. |
3736.22±316.1 |
|
116 |
CSS/CSH
|
25.6522±31 |
15.3822±31 |
41.0222±31 |
1504.93±316.12 |
396.943±316 |
1901.87±316.12 |
|
124 |
CSS/CSS
|
36.9487±31 |
28.2287±31 |
65.1687±31 |
4521.08±316.12e |
416.358±316. |
4937.43±316.12 |
|
137 |
CSS/CSH
|
13.0743±31 |
15.7843±31 |
28.8443±31 |
2075.93±316.1 |
437.743±316. |
2513.64±316.1 |
|
138 |
CSS/CSH
|
50.8464±31 |
54.8264±31 |
105.664±316 |
2436.68±316.12 |
511.158±316. |
2947.84±316.12 |
|
143 |
CSS/CSH
|
42.0384±31 |
54.4884±316 |
96.5884±31 |
1313.25±316.12 |
477.325±316. |
1790.57±316.12 |
|
144 |
CSS/CSH
|
41.5357±19 |
54.6757±19 |
96.2757±1 |
2147.34±196.12 |
416.634±19 |
2563.94±196.12 |
|
158 |
CSH/CSH
|
70.3594±19 |
41.3594±1 |
111.654±196. |
4570.33±196.12 |
625.233±196. |
5195.55±196.12 |
|
162 |
CSS/CSH
|
35.6255±19 |
48.5755±19 |
84.1855±19 |
2381.47±196.12 |
313.657±196 |
2695.13±196.12 |
|
164 |
CSS/CSH
|
18.0213 |
12.2213 |
30.2413 |
1295.06±1 |
518.116± |
1813.17±1 |
|
169 |
CSH/CSH
|
37.6217±19 |
53.0917±19 |
90.7117±19 |
2488.37±196.12 |
310.027±196. |
2798.47±196.1 |
|
170 |
CSS/CSH
|
104.647±196 |
28.8747±19 |
133.477±196. |
1234.92±196.12 |
250.792±196 |
1485.61±196.12 |
|
172 |
CSS/CSH
|
14.75±7.74 |
38.59±7.746 |
53.33±7.74 |
1490.46.746.12 |
291.666.746. |
1782.12.746.12 |
|
176 |
CSH/CSH
|
33.7912.74 |
33.5812.74 |
67.3712.746 |
1967.44.746.12 |
347.384.746. |
2314.81.746.12 |
|
187 |
CSH/CSH
|
11.7481.74 |
12.1981.74 |
23.9481.746 |
1607.09.746.1 |
244.929.746. |
1852.02.746.1 |
|
189 |
CSS/CSH
|
111.742.746. |
46.174 |
157.832.746. |
2026832.746 |
445.222.746. |
2471.22.746.12 |
|
190 |
CSS/CSS
|
39.8222.74 |
71.5222.7 |
111.322.746. |
1841.77.746.12 |
339.517.746. |
2181.28.746.12 |
|
195 |
CSS/CSS
|
22.1728.74 |
26.6128.746 |
48.7828.746 |
2160.44.746.12 |
382.494.746. |
2542.93±242.4 |
|
204 |
CSH/CSH
|
63.7493±242 |
54.3793±242 |
118.113±242. |
2408.69±242.42 |
348.919±242 |
2757.59±242.42 |
|
205 |
CSS/CSH
|
27.3759±24 |
56.5359±242 |
83.9159±242 |
1890.82±242.4 |
419.542±242.4 |
2310.35±242.42 |
|
213 |
CSS/CSS
|
31.3635±24 |
45.6335±24 |
77.6335 |
1998.59±242.42 |
311.94±33.04 |
2310.5333.0442 |
References
- Ben-Chaim A, Borovsky Y, Falise M, Mazourek M, Kang BC, Paran I, Jahn MM. 2006. QTL analysis for capsaicinoid content in Capsicum. Theor Appl Genet. 113: 1481-1490.
- Curry J, Alure M, Mendoza M, Nevarez J, Melendrez M, O’connel MA. 1999. Transcripts for possible capsaicinoid biosynthetic genes are differentially accumulated in pungent and non-pungent Capsicum spp. Plant Sci. 148: 47-57.
- Del Rosario Abraham-Juarez M, Del Carmen Rocha-Granados M, Lopez MG, Rivera-Bustamante RF, Ochoa-Alejo N. 2008. Virus-induced silencing of Comt, pAmt and KAs genes results in a reduction of capsaicinoid accumulation in chili pepper fruits. Planta. 227: 681-695.
- Han K, Jeong HJ, Sung J, Keum YS, Cho MC, Kim JH, Kwon JK, Kim BD, Kang BC. 2013. Biosynthesis of capsinoid is controlled by the Pun1 locus in pepper. Mol Breeding. 1-12.
- Lang Y, Kisaka H, Sugiyama R, Nomura K, Morita A, Watanabe T, Tanaka Y, Yazawa S, Miwa T. 2009. Functional loss of pAMT results in biosynthesis of capsinoid, capsaicinoid analogs, in Capsicum annuum cv. CH-19 Sweet. Plant J. 59: 953-961.
- Nelson EK, Dawson LE. 1923. The constitution of capsaicin, the pungent principle of Capsicum. III. J Am Chem Soc. 45: 2179-2181.
- Sharma SK, Vij AS, Sharma M. 2013. Mechanisms of clinical uses of capsaicin. Eur J of Pharm. 720: 55-62.
- Tanaka Y, Hosokawa M, Miwa T, Watanabe T, Yazawa S. 2010a. Newly mutated putative-aminotransferase in nonpungent pepper (Capsicum annuum) results in biosynthesis of capsinoid, capsaicinoid analogues. J Agric Food Chem. 58: 1761-1767.
- Tanaka Y, Hosokawa M, Miwa T, Watanabe T, Yazawa S. 2010b. Novel loss-of-function putative aminotransferase alleles cause biosynthesis of capsinoid, nonpungent capsaicinoid analogues, in mildly pungent chili peppers (Capsicum chinense). J Agric Food Chem. 58: 11762-11767.
- Tanaka Y, Hosokawa M, Hosokawa M, Miwa T, Yazawa S. 2014. Application of marker-assisted selection in breeding of a new fresh pepper cultivar (Capsicum annuum) containing capsiniod, non-pungent capsaicinoid analogs. Sci Hortic. 165: 242-245.
- Thiele R, Mueller-Seitz E, Petz M. 2008. Chili pepper fruits: presumed precursors of fatty acids characteristic for capsaicinoid. J Agric Food Chem. 56: 4219-4224.
- Xiu-Ju L, Jun P, Yuan-Jian L. 2011. Recent advances in the study on capsaicinoid and capsinoid. Eur J Pharmacol. 650: 1-7.
- Yazawa S, Suetome N, Okamoto K, Namiki T. 1989. Content of capsaicinoid and capsaicinoid-like substances in fruit of pepper (Capsicum annuum L.) hybrids made with ‘CH-19 Sweet’ as a parent. J Jpn Soc Hort Sci. 58: 601-607.