Abstract
Grafting has widely used in the agriculture of fruit-bearing crops and trees because rootstocks have a profound influence on many aspects of scion development and scion responses to the environmental changes including biotic and abiotic stress tolerance. These effects appear to result from the change of gene expression on scion, but only limited numbers of papers have been published demonstrating it. To identify altered expression of genes in Chinese cabbage, Chiifu(Brassica rapa ssp. pekinensis, inbred line) shoot was grafted on three Brassica rootstocks: mustard, turnip and broccoli. After head formation, Br300K microarray experiment was conducted using total RNAs from scion leaves collected in two different seasons, spring (June) and fall (October). A large number of differentially expressed genes (DEGs) were identified both in two seasonal samples, but DEGs were more notable in June sample than in October sample. However, the number of DEGs by three rootstocks were high in October with respect to up-regulation, but high in June for down-regulation. Categories of DEGs included metal ion binding, response to hormonal stimuli, response to endogenous stimuli, regulation of transcription, oxidation reduction and response to stress. Up-regulated genes in both June and October samples were similar in mustard and turnip rootstocks, but different in broccoli rootstock. Two genes were found to respond to all experimental conditions: Brapa_ESTC049008 (hypothetical protein) as an up-regulated gene and Brapa_ESTC016027 (CNGC12) as a down-regulated gene. Together with the previous reports, these results suggest that grafting-induced gene expression depends on the species involved.
-
Key words: Microarray, Chiifu, heterografting, MBP2, CNGC12
INTRODUCTION
Grafting has widely used in the agriculture of fruit-bearing crops because rootstocks are known to provide scion biomass and quality as well as biotic and abiotic stress tolerance (
Lee 1994,
2003; Cleaswater
et al. 2006;
Kubota and McClure 2008;
Lee et al. 2010;
Gregory et al. 2013;
Koepke and Dhingra 2013). Grafting also affects pH, fragrance, color, sugar and carotenoid contents, and texture in fruits of Cucurbits and tomatoes (
Davis et al. 2008). As a result, most grafting studies have focused on Cucurbits, tomato, grape and fruit trees, with little attention to the vegetables.
Since grafting connects vascular tissues between rootstocks and scions, various substances can be exchanged. Among others, minerals, amino acids, carboxylic acids, ions, phenylpropanoids and hormones could be transported from rootstocks to scions by xylem sap (
Gollan et al. 1992;
Goodger et al. 2005;
Alvarez et al. 2008;
Wu et al. 2009). In addition, various proteases are also transported through xylem sap (
Biles and Abeles 1991;
Satoh et al. 1992;
Bhutz et al. 2004;
Kehr et al. 2005;
Alvarez et al. 2006). Various materials could also be transported through phloem by grafting (
Le Hir et al. 2008): carbohydrate, amino acids, hormones and mRNAs (
Ruiz-Medrano et al. 1999;
Wu et al. 2002;
Banerjee et al. 2006;
Lough and Lucas 2006;
Kehr and buhtz 2008), small RNA (
Yoo et al. 2004;
Pant et al. 2008), and proteins (
Corbesier et al. 2007;
Lin et al. 2007;
Weller et al. 2009).
It was suggested that many developmental phenomena induced by grafting are caused by long-distance transmissible substances
via phloem and xylem: flowering (
Zeevaart 1976;
Lang et al. 1977), tuber formation (
Jackson 1999), nodule formation (
Oka-Kira and Kawaguchi 2006), leaf development (
Kim et al. 2001), lateral shoot formation (
Beveridge 2006) and defense (
Palauqui et al. 1997). Recent articles demonstrate that flowering is associated with long-distance transmissible substances, such as
CONSTANS mRNA (
Ayre and Turgeon 2004),
FT mRNA (
Huang et al. 2005), FT protein (
Corbesier et al. 2007;
Lin et al. 2007), and GIGANTEA and ELF4 proteins (
Weller et al. 2009). FT and
siRNAs in phloem, which lead epigenetic regulation, can be applied in crop breeding (
McGarry and Kragler 2013).
A few reports have reported scion gene expression change upon grafting (
Jensen et al. 2003,
2010;
Prassinos et al. 2009;
Cookson and Ollat 2013). It was showing that several categories of genes are differentially expressed in genetically identical apple scions, when grafted on rootstocks with different genotypes. Differentially expressed genes (DEGs) include those responding stimulus and abiotic and biotic stress, in addition to genes with unknown biological processes and other biological processes (
Jensen et al. 2010).
Prassinos et al. (2009) used cDNA amplified fragment length polymorphism to compare the effect of a dwarfing and a semi-vigorous rootstocks on gene expression in the scion and observed the differential regulation of various transcription factors and genes involved in signaling processes. In addition,
Cookson and Ollat (2013) demonstrated that heterografts induce more stress-responsive genes than autografts in grapevines.
Genus
Brassica belongs to the mustard family (Brassicaceae) showing various morphology and includes
B. rapa, B. nigra, B. oleracea, B. juncea, B. napus and
B. carinata, which are important edible crops across the world. Brasscia plants include many important vegetable crops contain very potent phytochemicals: cabbage, kale, Brussels sprouts, cauliflower, broccoli, and kohlrabi, with glucosinolates, and their breakdown products (
Mithen et al. 2000;
Park et al. 2012). Chinese cabbage (
B. rapa ssp.
pekinensis) is one of the most important leafy vegetables widely used in East Asian countries. To examine the change in gene expression by grafting, we have used Chiifu inbred line (
B. rapa ssp.
pekinensis) as scion and various rootsocks, such as Chiifu (grafting control), turnip (
B. rapa ssp.
rapa), mustard (
B. juncea) and broccoli (
B. oleracea). When comparing homo-and heterografting results, we found a larger number of genes in the leaves of scion (Chiifu leaves) are differentially expressed by hetero-grafting.
MATERIALS AND METHODS
Plant materials
Chiifu inbred line (B. rapa ssp. pekinensis) used as scion was obtained from Korea Brassica rapa Genome Resource Bank (KBGRB) and various rootsocks’ seeds, such as turnip (B. rapa ssp. rapa), mustard (B. juncea) and broccoli (B. oleracea Italica), were purchased from local market in Korea. Seeds were sown in 50-hole pot and grown in a greenhouse for 2 weeks until the first foliage leaf was emerged. Grafting was performed with Y-type and resulting plants were put into a growth room with controlled moisture over 90%. After acclimation, grafted-seedlings were transplanted to soil and grown for 2 months until heads were formed. Leaf tissues from outer and inner leaves of scion were sampled from 5 independent plants in June 4 for spring and October 29 for fall growing plants, and frozen immediately in liquid nitrogen.
RNA extraction and microarray
Total RNAs were extracted after combining outer and inner leaves of scion using TriZol reagent (Invitrogen, USA) and further purified using an RNeasy MinElute™ Cleanup Kit (Quagen, Germany). For microarray experiment, 300k microarray chip (Version 2.0) for
B. rapa, which was designed from 47,548 unigenes and manufactured by NimbleGen, Inc. (
http://www.nimblegen.com/) were used (
Dong et al. 2013). To assess the reproducibility of the microarray analysis, we repeated the experiment two times using independently prepared total RNA. The data were then normalized and processed with cubic spline normalization using quantile to adjust signal variations between chips and robust multichip analysis using a median polish algorithm implemented in NimbleScan (
Workman et al. 2002;
Irizarry et al. 2003). RNA preparation, GeneChip hybridization, and data analyses were conducted as previously described (
Dong et al. 2013).
Genes with adjusted p-value or false discovery rate below 0.05 were collected and further selected for those with expression difference greater than or less than at least one treatment. Multivariate statistical tests such as principal component analysis, and multidimensional scaling were performed with Acuity 3.1 (Molecular Devices, U.S.A.). Clustering analysis was carried out with MultiExperiment Viewer version 4.9 (MeV4.9,
http://www.tm4.org/mev.html). To gain the insight on putative biological functions and biochemical pathways of DEGs, we carried out enrichment analyses by searching the Gene Ontology (GO) (
Ashburner et al. 2000) and agriGO (
Du et al. 2010).
RESULTSS AND DISCUSSION
Grafted Chinese cabbage
Rootstocks widely used in agriculture can have a profound influence on many aspects of scion development and scion responses to the environment (
Webster 2004;
Lee et al. 2010;
Gregory et al. 2013). These influences might be related to the change in gene expression by transmissible substances through phloem (
Sonoda and Nishiguchi 2000;
Huang et al. 2005;
Kehr and Buhtz 2008; Notaguchi
et al. 2008;
McGarry and Kragler 2013) and xylem (
Ko et al. 2014). Therefore, gene expression in scion can be influenced by both root and shoot parts of rootstocks. To examine the gene expression upon grafting, we used Chiifu inbred line as scion and three
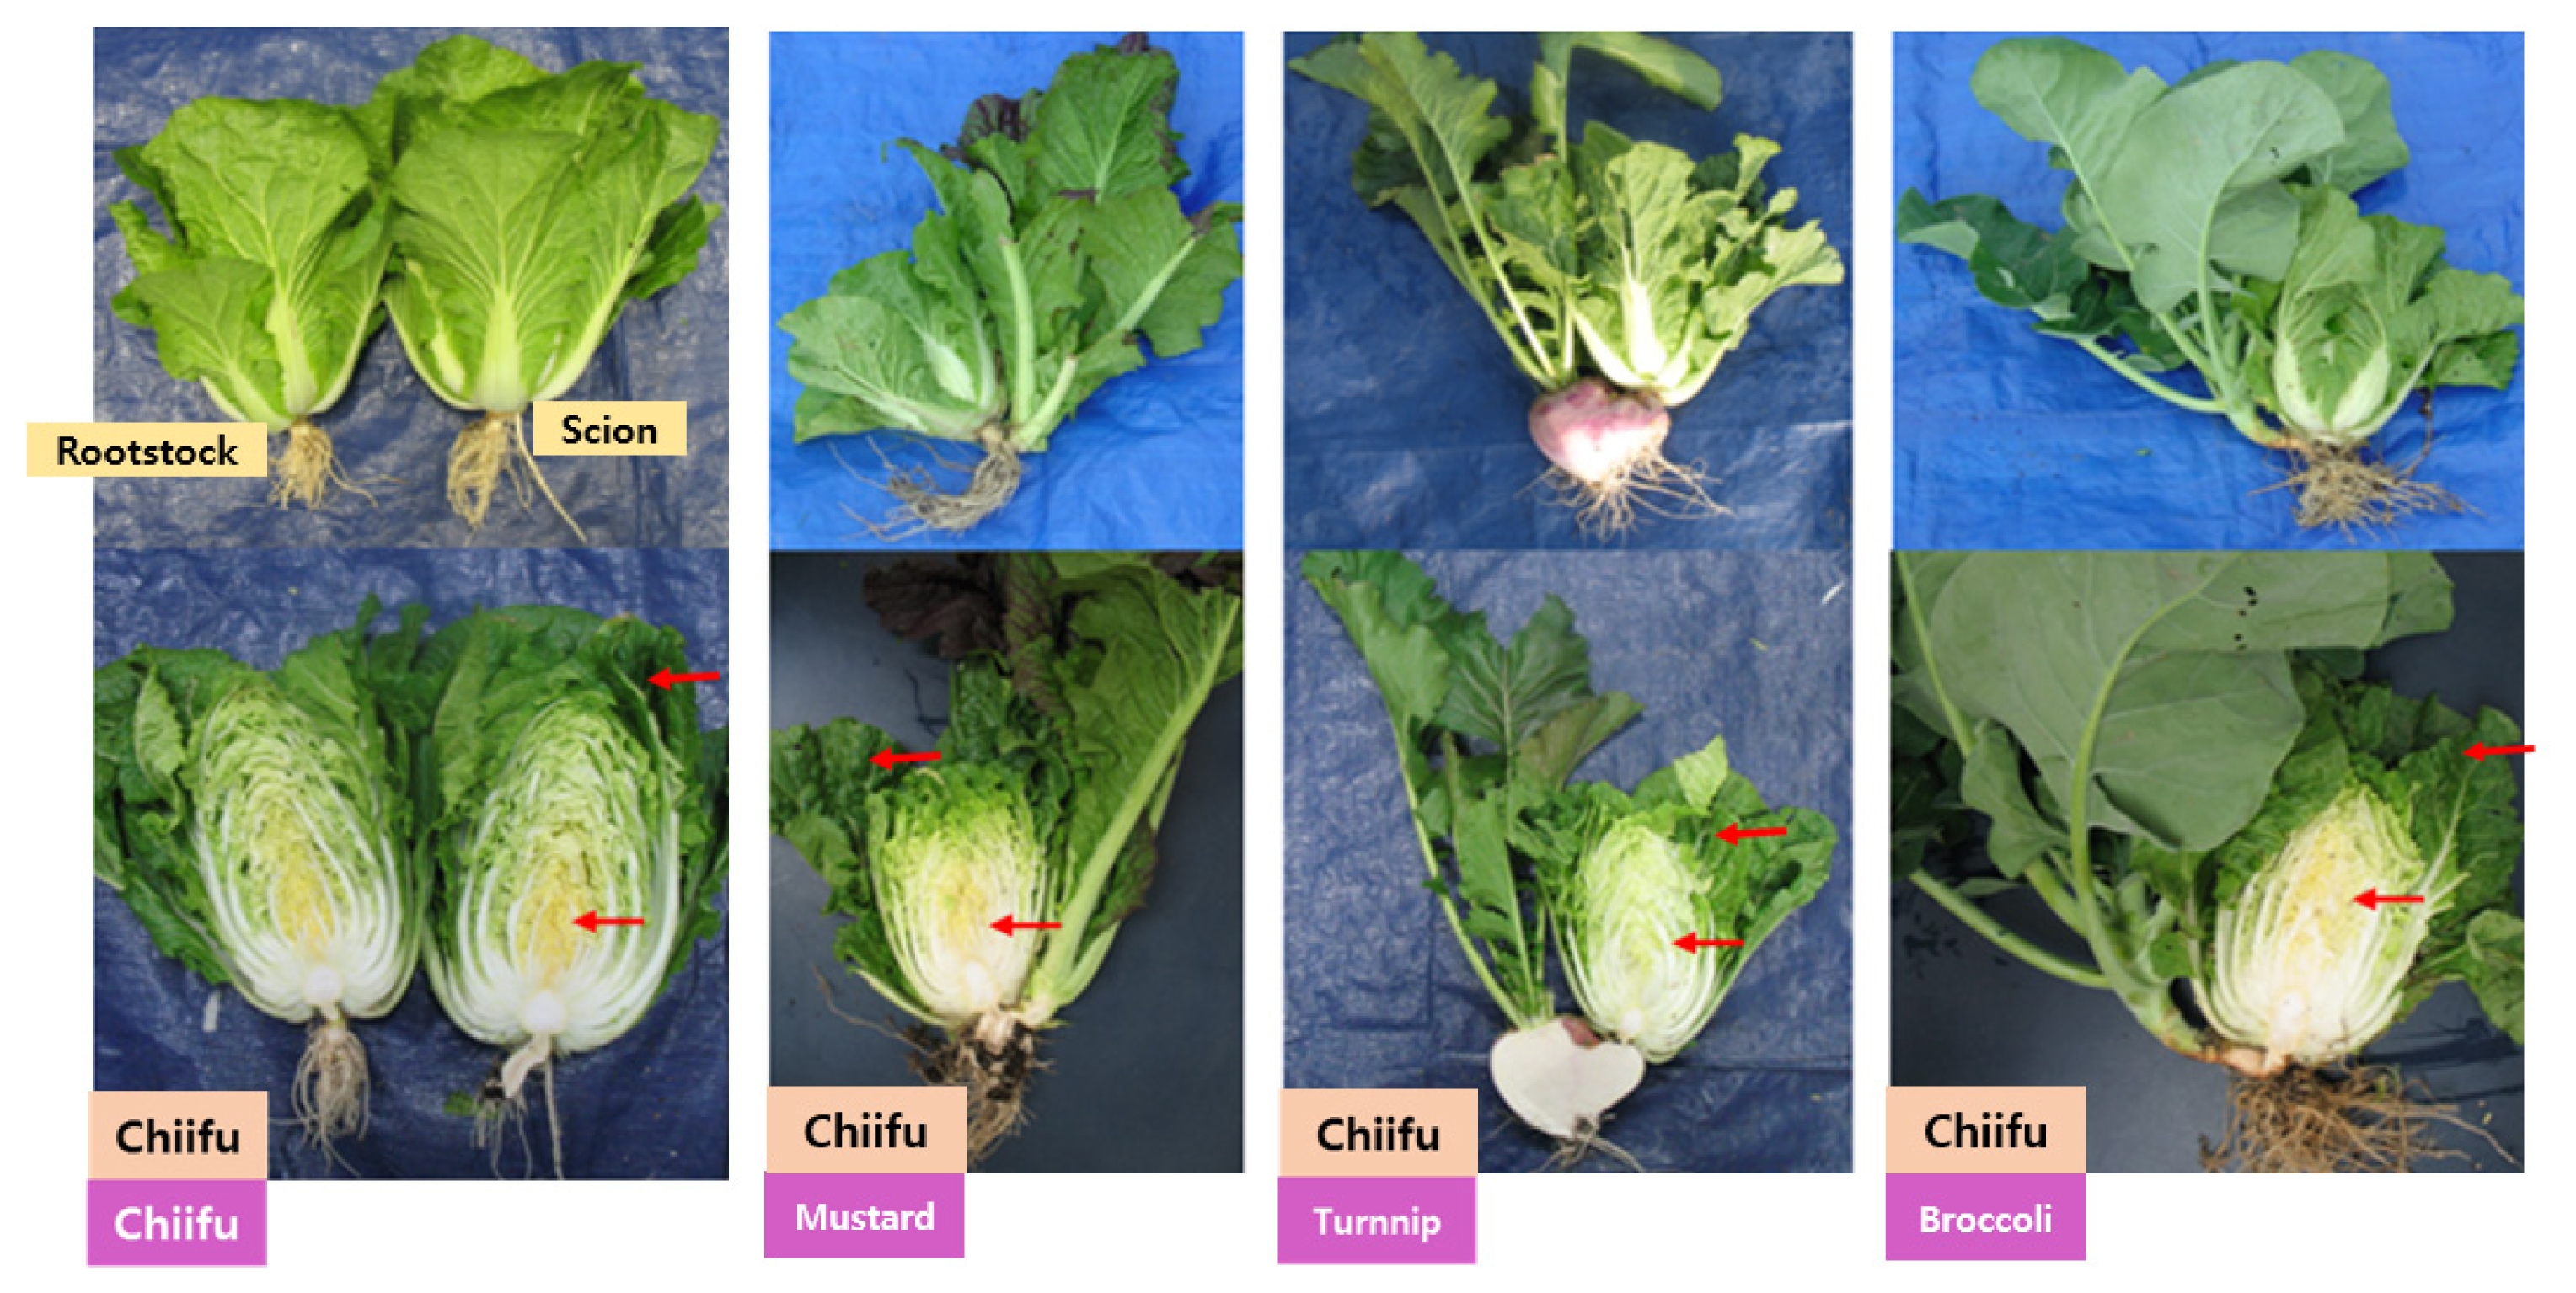
Brassica species as rootstocks. Grafted-Chinese cabbages were grown in two seasons, spring (April 1 to June 4) and fall (Aug. 10 to Oct. 29). Temperature ranges during 7 days before sampling were 13.9°C (low) - 24.7°C (high) for spring and 8.6°C (low) - 18.0°C (high) for fall. To eliminate temperature and rootstock biases, fold change in gene expression was calculated based on homografting (or autografting) values (Chiifu sicon
vs. Chiifu rootstock) (
Fig. 1 and
Table S1). As shown in
Figure 1, shoot for each rootstock remained so that gene expression in Chiifu scion can be affected by mobile substances from both xylem and phloem of rootstocks. Rootstock without the shoot parts showed much less effect on scion gene expression change (data not shown).
Contrast to horticultural point of view on grafting, which aims to increase the biomass and stress tolerance of scion, our experiment was conducted to examine the changes at the gene expression level, by using different rootstocks (
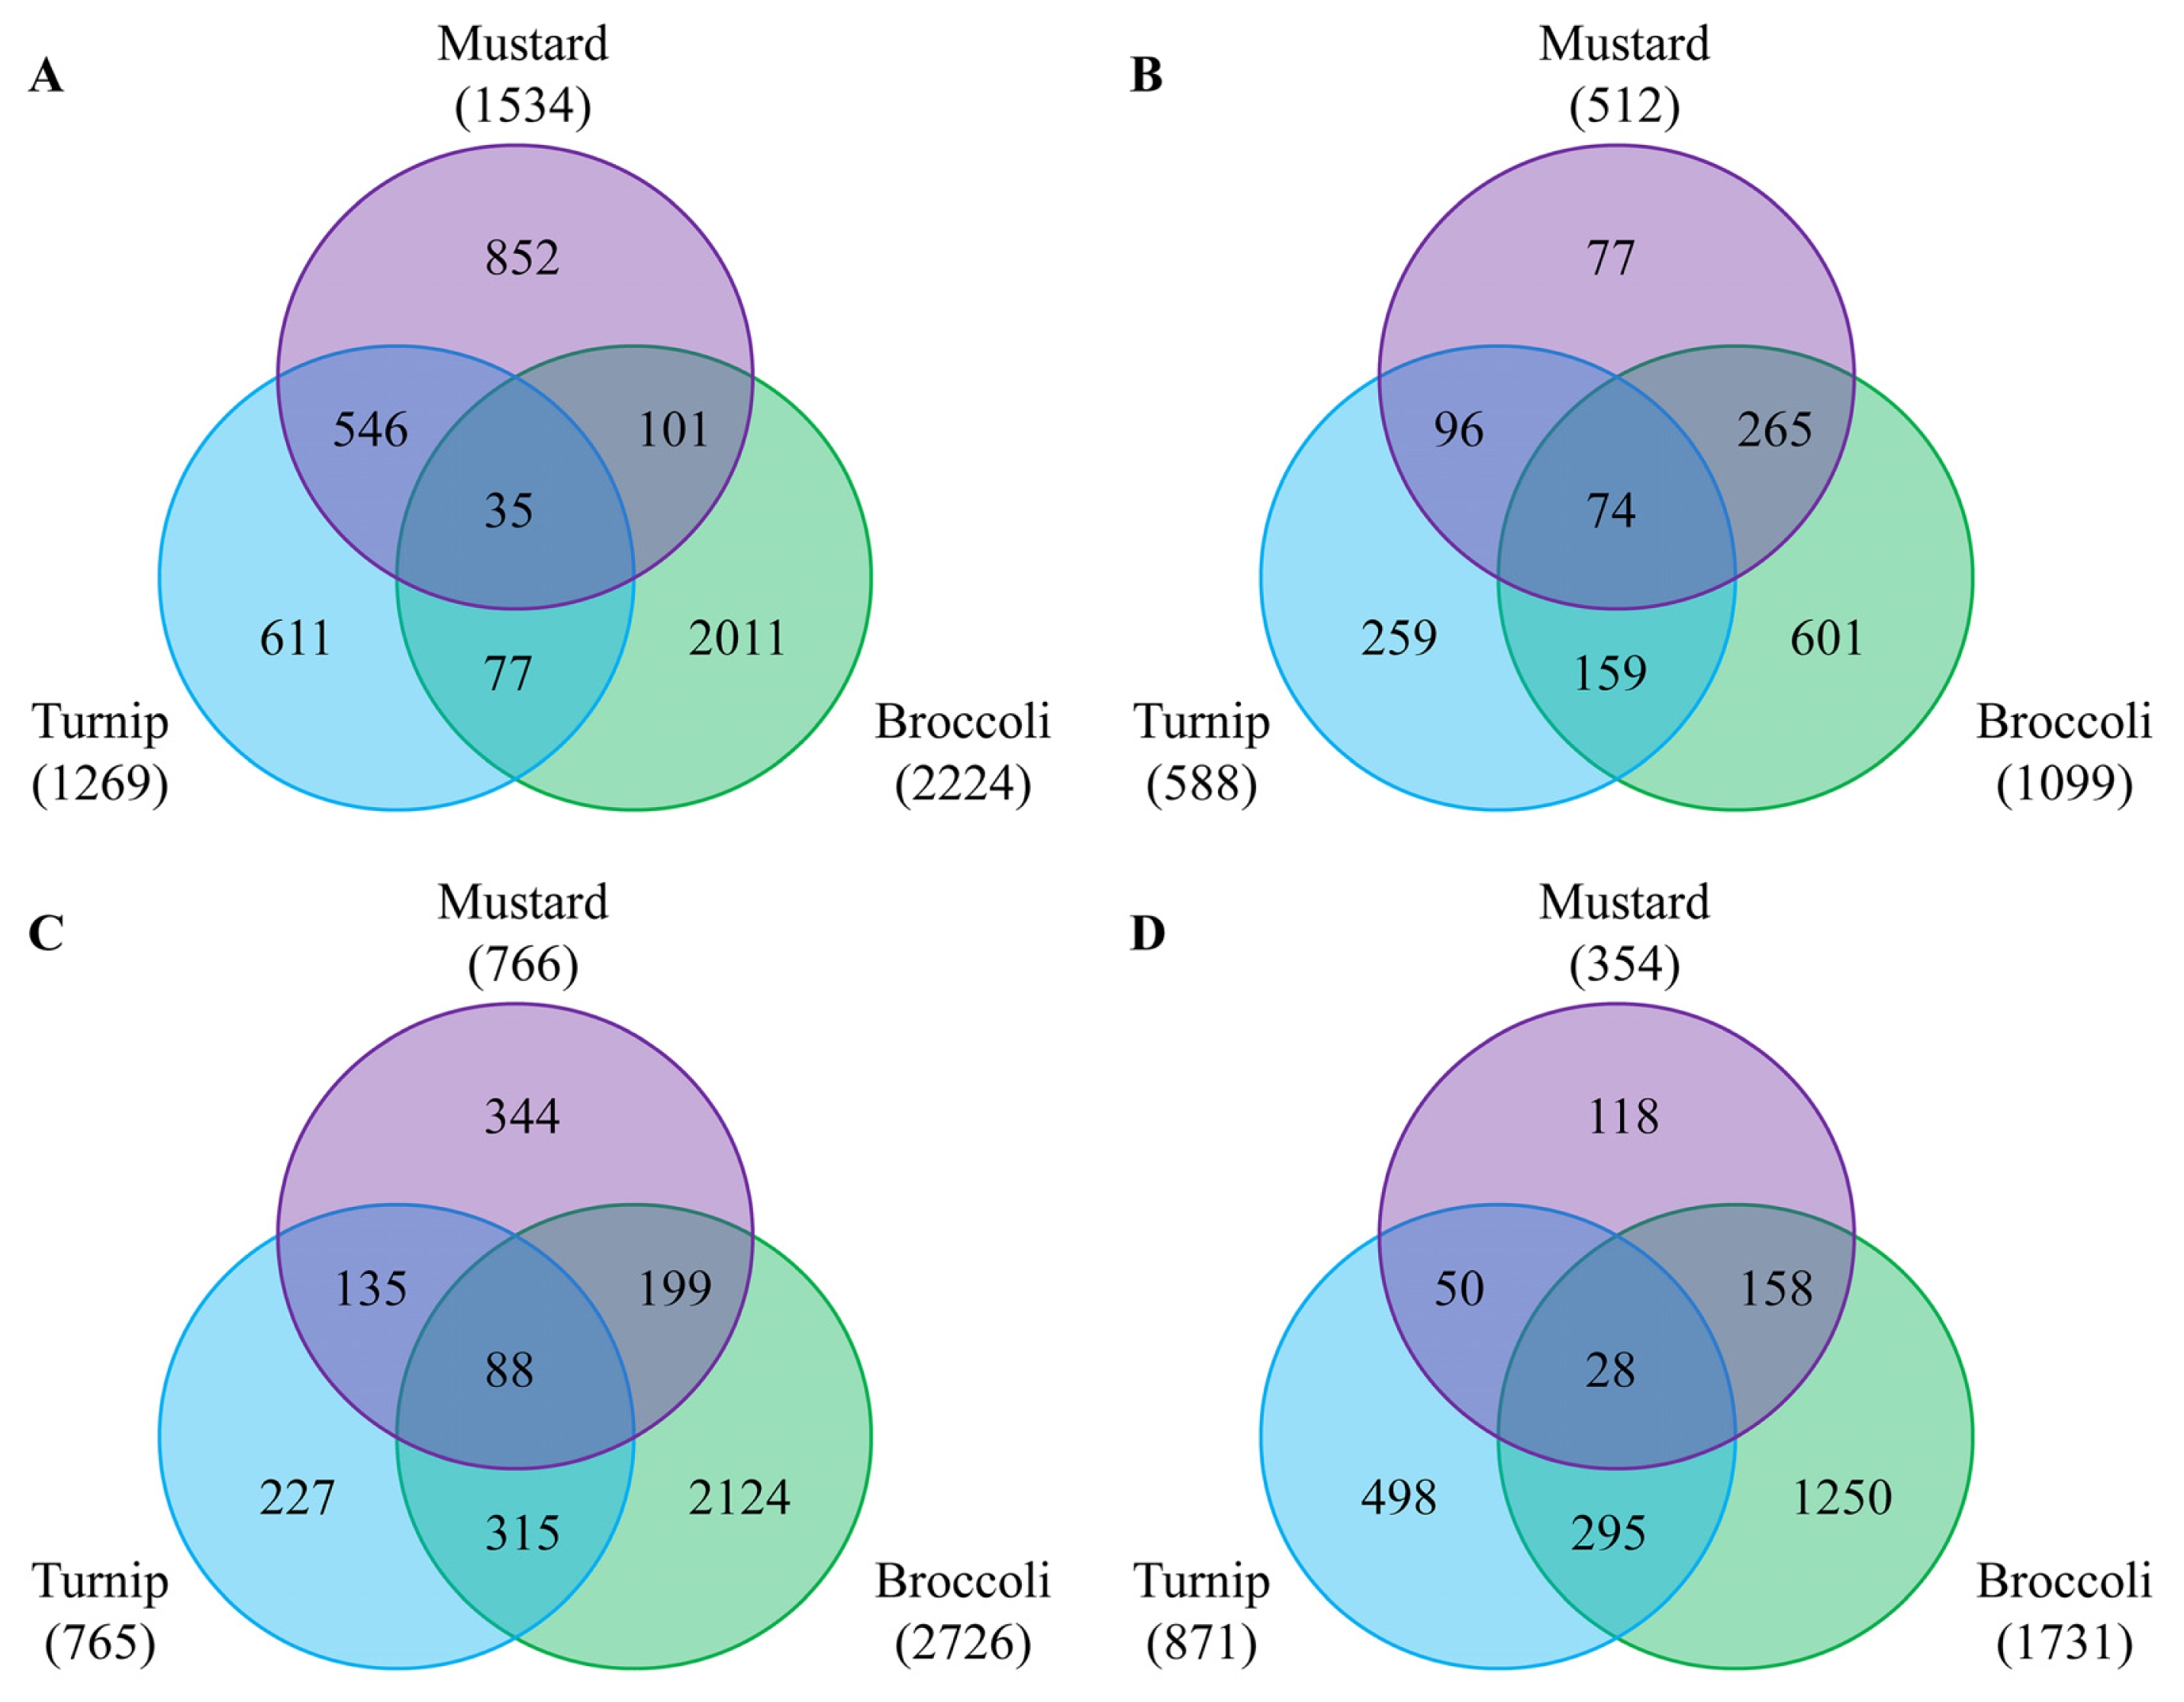
Table S1). Hetero-grafted Chiifu scion with three different rootstocks resulted in the differential expression of a large number of genes in the scion leaves, when compared to the auto-grafted control Chiifu/Chiifu (
Fig. 2). The number of DEGs was dependent on season when Chinese cabbages were grown: more genes were up- and down-regulated in the June sample compared to the October one. This might be due to high light intensity and temperature in June. Regarding to rootstocks, the differential expression of most genes was similar in mustard and turnip, but rather different in broccoli. The number of DEGs shared by all three rootstocks used was higher in October (74 vs. 35) with respect to up-regulation, but higher in June for down-regulation (88 vs. 25) (
Fig. 2). When these genes were further analyzed by functional category, most genes belonged to the categories of metal ion binding, response to hormonal stimuli, response to endogenous stimuli, regulation of transcription, oxidation reduction and response to stress (
Table 1). Interestingly, genes involved in metal ion binding and response to hormonal stimuli occupied the first and second places.
Alteration of gene expression by grafting has been examined in apple trees (
Prassinos et al. 2009;
Jensen et al. 2010) and grape vines (
Cookson and Ollat 2013). In both plants, autografting did not induce shoot gene expression, but heterografting had great effect on gene expression. However, functional category or Gene Ontology (GO) terms were different between two species. In apple trees, GO terms enriched in the differentially expressed genes were response to stimulus, response to abiotic and biotic stress, among others. (
Jensen et al. 2010). In addition, the authors identified 116 genes, whose expression levels were correlated with the plant size. Using a dwarfing and a semi-vigorous rootstocks,
Prassinos et al. (2009) identified differential regulation for many transcription factors and genes involved in signaling processes using scion shoot apex. In grape grafting, categories of genes showing increased expression at shoot apex were genes related to DNA, chromatin structure, histones, flavonoids, and leucine rich repeat containing receptor kinases (
Cookson and Ollat 2013). These results suggest that grafting-induced gene expression change is species-specific, except developmentally determined genes like those involved in FT-induced flowering.
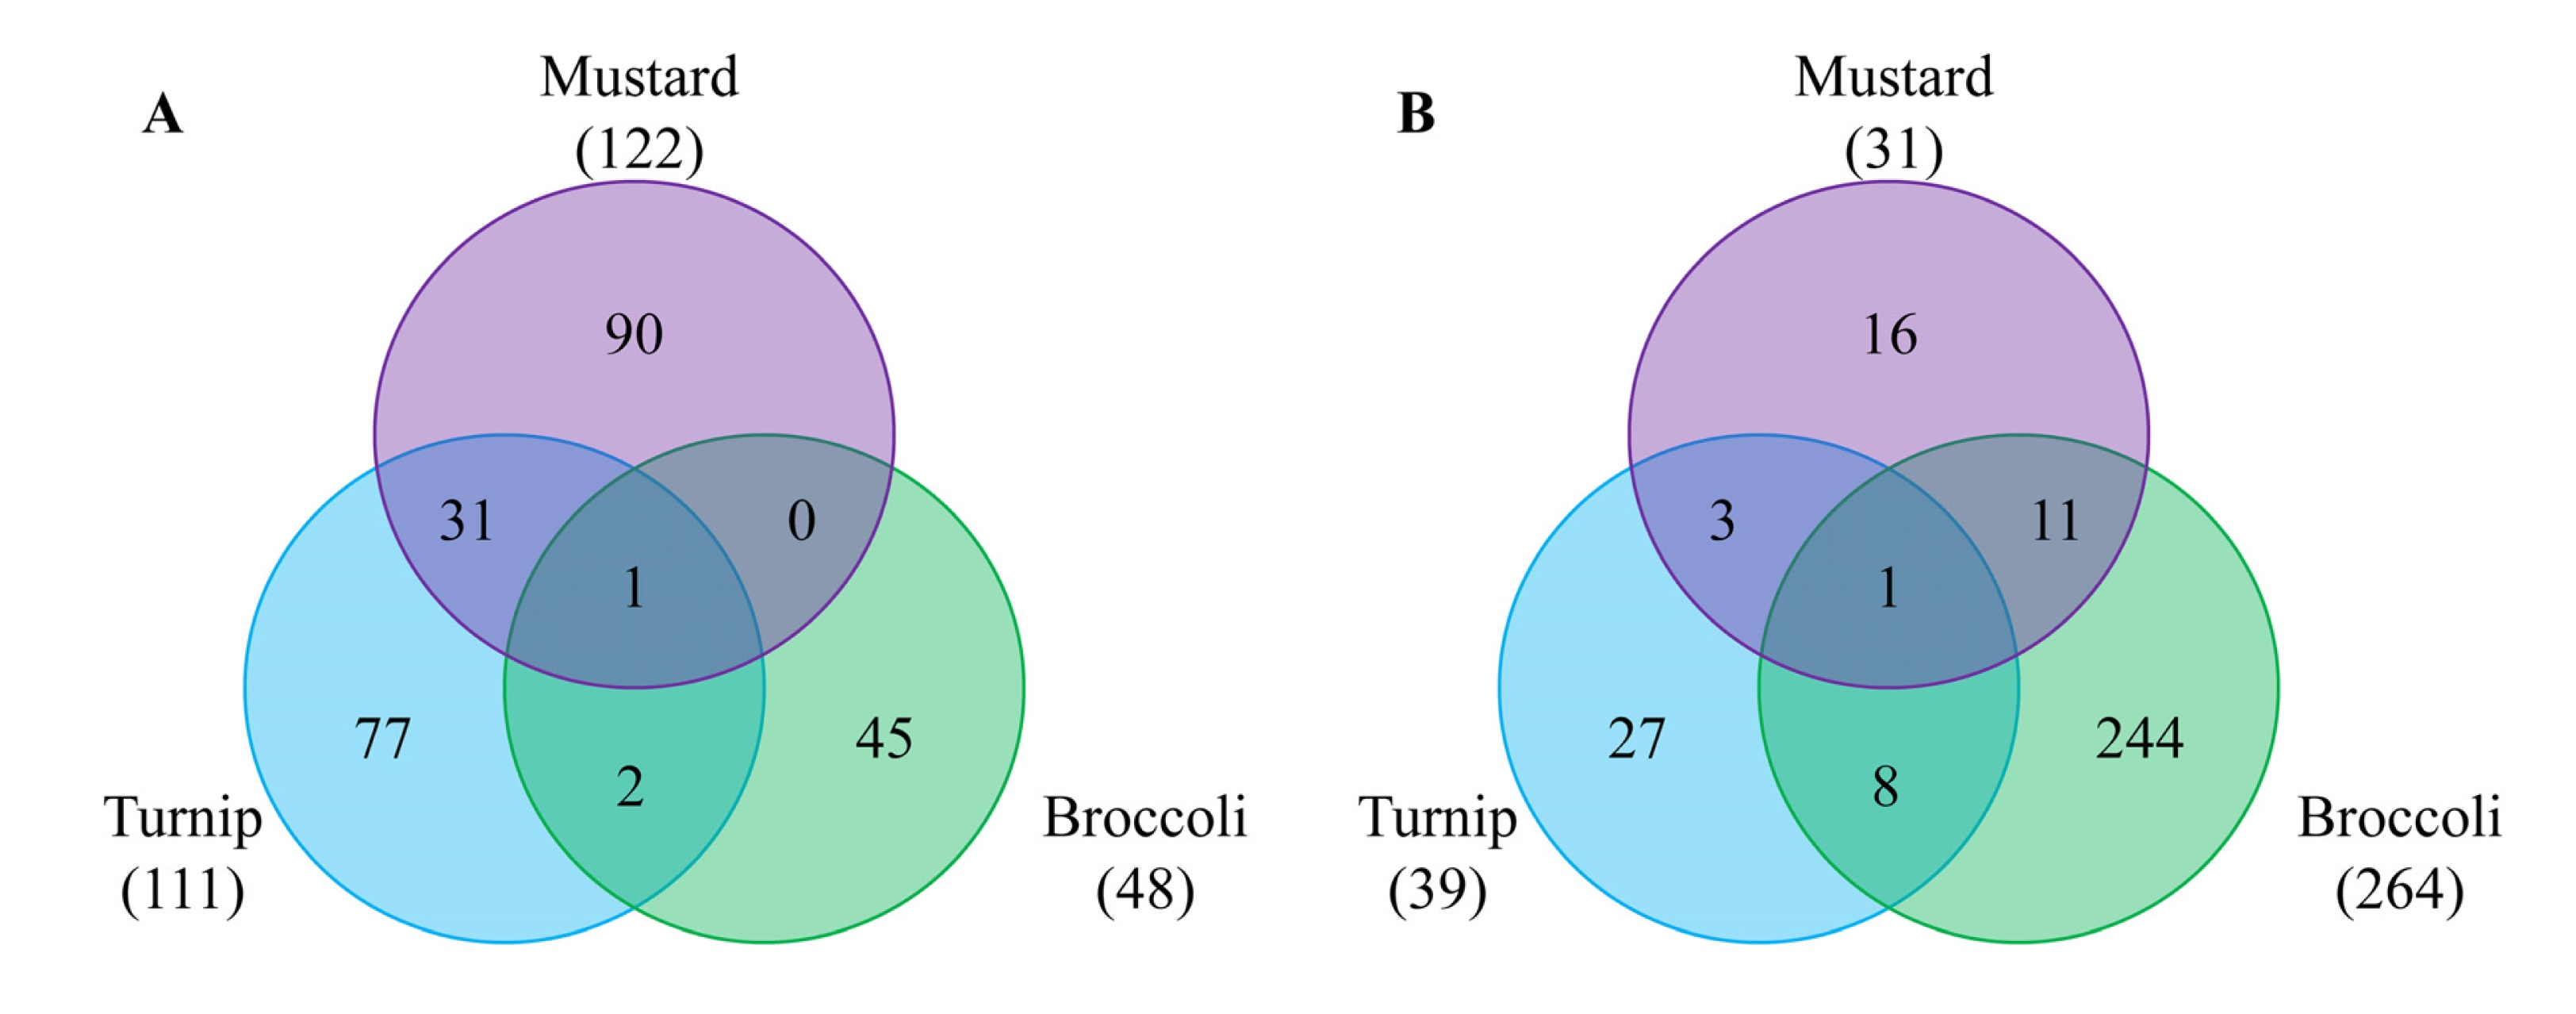
To identify DEGs whose expression is regulated in rootstock-dependent manners regardless of growth conditions, commonly up- or down-regulated genes in both June and October samples were analyzed (
Fig. 3). Similar numbers of genes were differentially regulated when mustard and turnip were used as rootstocks, but broccoli-grafted scions showed different pattern compared to the other two species. Regarding up-regulated genes, samples obtained using mustard and turnip rootstocks shared many genes, quite different from that obtained using broccoli rootstock (
Table 2). The most notable genes were myrosinase-binding protein 2 (
MBP2) and unknown protein genes. MBP2 has been known to form a complex with myrosinase, which degrades secondary metabolites, glucosinolates, upon wounding to provide a defense mechanism against pests. Binding of MBP2 prevents degradation of the complex, but its exact function is still unclear (Erisson
et al. 2002). It is also not known why the expression of MBP2 is dramatically increased upon grafting in Chinese cabbage. In scions grafted to mustard and turnip rootstock, carbonic anhydrase (
CA) gene, which regulates CO
2-controlled stomatal movement in guard cells, was also up-regulated (
Table S1 and
Table 1). Interestingly, up-regulated genes identified with broccoli rootstock included floral bud specific genes, such as ASK-beta (
ASK2) and
ANAC025 (
Dong et al. 2013). In addition, various
CYP genes were also up-regulated when broccoli rootstock were used. Another interesting finding was anthocyanin biosynthesis-related genes were induced as a result of grafting with the rootstock of mustard (flavonol synthase,
FLS and chalcone synthase,
CHS) and turnip (
FLS), but not with that of broccoli. Down-regulated genes were variable depending on the species used for rootstocks, except cyclic nucleotide gated channel 12 (
CNGC12) which was down-regulated in all three combinations.
Only two genes were commonly regulated in three rootstocks:
Brapa_ESTC049008 (hypothetical protein) for up-regulation and
Brapa_ESTC016027 (
CNGC12) for down-regulation (
Table 3,
Fig. 3).
Brapa_ESTC049008 consists of 76 bp of 5′-UTR, 192 bp coding sequences (CDS) and 291 bp long 3′-UTR. Its CDS encodes 7 kDa hypothetical proteins with
pI 8.0.
Brapa_ESTC049008 is 75% identical to
Arabidopsis protein (AT1G49500) at the amino acid sequence level.
Brapa_ESTC016027 encodes
Brassica homolog of cyclic nucleotide gated channel 12 (
CNGC12, which is a positive regulator of resistance against avirulent fungal pathogen (
Yoshioka et al. 2006;
Urquhart et al. 2011). It is intriguing why grafting down-regulates
CNGC12 gene, which leads to the increase in calcium sensitivity.
Recent works have focused on the mechanisms of tissue reunion during grafting, such as exchange of genetic materials in various plants (
Stegemann and Bock 2009;
Asahina and Satoh 2015). Although only limited numbers of papers have been reported for scion gene expression change by grafting, it was revealed that heterografts induce more stress-responsive genes than autografts (
Cookson et al. 2014). Our results are different from previous reports since rootstocks and scions from two related vegetable species were used. To learn more about the influence of grafting on scion gene expression, gene expression needs to be examined at various growth and developmental stages.
Conclusions
Grafting Chiifu inbred line with rootstocks originating from various Brassica spp. had a profound effect on scion gene expression changes, when tested in two different seasons of a year. In contrast to the grafting for fruit production using vigorous rootstocks, our grafting experiment was to identify gene expression changes induced by substances from both rootstock and rootstock-bearing shoot (i.e., xylem and phloem). DEGs were more notable in June sample than in October sample. However, the number of DEGs identified by the use of three different rootstocks was higher in the samples collected in October for up-regulation, while the number was higher in June sample for down-regulation. DEGs identified includes the genes categorized for metal ion binding, response to hormonal stimuli, response to endogenous stimuli, regulation of transcription, oxidation reduction and response to stress. Up-regulated genes in both June and October samples were found similar between scions on mustard and turnip rootstocks, but somewhat different in that on broccoli rootstock. In contrast, no patterns were observed for down-regulated genes. Two genes were identified in all three experimental set-ups: Brapa_ESTC049008 (hypothetical protein) as an up-regulated gene and Brapa_ESTC016027 (CNGC12) as a down-regulated genes. Functional analysis of several genes identified in this study, using transgenic and biochemical approaches, will be necessary to further understand molecular changes induced by grafting and improve the productivity.
Supplementary Information
Supplementary Table 1
Result of Br300K microarray. Microarray was performed with scion tissues on different rootstocks. PI values represent prove intensity of hybridization. Yellow and blue shades indicate over two-fold change in PI values.
ACKNOWLEDGEMENTS
This work was supported by Research Fund of Chungnam National University (CNU), Daejeon, Korea, to Yoonkang Hur (2014-0905-01).
Fig. 1Morphology of grafted-Chinese cabbages: overall appearance (upper panels) and longitudinal section (bottom). Arrows indicate sampled tissues (outer and inner leaves) for microarray. Grafting control was Chiifu (scion)/Chiifu (rootstock). Note that rootstock and scion of the grafting control was separated before photography.

Fig. 2Venn diagram showing differentially expressed genes (DEGs) by three rootstocks compared to homografting. A and B represent up-regulated genes in June and October samples, respectively. C and D represent down-regulated genes in June and October samples, respectively.

Fig. 3Venn diagrams showing differentially expressed genes (DEGs) in both June and October experiments by three different rootstocks, compared to homografting. A and B represent up-regulated and down-regulated genes, respectively.

Table 1Functional categorization of DEGs by different rootstocks.
Table 1
|
Functional category |
Up-regulated |
Down-regulated |
|
|
June |
Oct. |
June |
Oct. |
|
Metal ion binding |
9 |
23 |
24 |
8 |
|
Response to hormone stimulus |
7 |
15 |
2 |
4 |
|
Response to endogenous stimulus |
3 |
10 |
2 |
3 |
|
Regulation of transcription |
9 |
6 |
8 |
1 |
|
Oxidation reduction |
4 |
4 |
7 |
6 |
|
Response to stress |
6 |
2 |
3 |
4 |
|
Transferase |
4 |
2 |
4 |
10 |
|
Membrane |
2 |
13 |
1 |
6 |
|
Response to inorganic substance |
3 |
1 |
4 |
4 |
|
Chloroplast |
0 |
15 |
2 |
6 |
|
Hydrolase |
0 |
3 |
6 |
1 |
|
Monooxygenase |
1 |
3 |
3 |
0 |
|
Signal peptide |
0 |
6 |
7 |
3 |
|
Glycoprotein |
0 |
3 |
6 |
2 |
|
Heat shock protein binding |
3 |
0 |
1 |
0 |
|
Response to inorganic substance |
3 |
1 |
4 |
4 |
|
Response to cadmium ion |
2 |
1 |
0 |
0 |
|
Lipid transport |
0 |
4 |
1 |
1 |
|
Lipid degradation |
0 |
2 |
1 |
1 |
|
Response to nutrient level |
1 |
1 |
1 |
0 |
|
Cellular response to stress |
1 |
1 |
2 |
4 |
|
Reproductive developmental process |
1 |
6 |
3 |
0 |
Table 2Top 5 genes that were commonly regulated in both June and October samples.
Table 2
|
Expression |
Rootstock |
Br_SEQ_ID |
At Locus |
Description |
PI value |
Fold change |
|
|
Chiifu |
Rootstock |
Rootstock/Chiifu |
|
|
June |
Oct |
June |
Oct |
June |
Oct |
|
Up-regulation |
Mustard |
Brapa_ESTC016277
|
AT1G52030 |
MBP2 (MYROSINASE-BINDING PROTEIN 2) |
470 |
413 |
5,099 |
2,022 |
10.9 |
4.9 |
|
Brapa_ESTC007567
|
AT1G52030 |
MBP2 (MYROSINASE-BINDING PROTEIN 2) |
479 |
345 |
4,090 |
1,893 |
8.5 |
5.5 |
|
Brapa_ESTC010078
|
AT4G27360 |
Dynein light chain, putative |
11 |
19 |
56 |
138 |
5.3 |
7.4 |
|
Brapa_ESTC013929
|
AT3G01500 |
CA1 (CARBONIC ANHYDRASE 1) |
1460 |
319 |
4450 |
2079 |
3.0 |
6.5 |
|
Brapa_ESTC000600
|
AT1G16850 |
Unknown protein |
376 |
1,063 |
3,532 |
4,888 |
9.4 |
4.6 |
|
|
Turnip |
Brapa_ESTC007567
|
AT1G52030 |
MBP2 (MYROSINASE-BINDING PROTEIN 2) |
479 |
345 |
8,002 |
2,570 |
16.7 |
7.5 |
|
Brapa_ESTC016277
|
AT1G52030 |
MBP2 (MYROSINASE-BINDING PROTEIN 2) |
470 |
413 |
8,909 |
2,364 |
19.0 |
5.7 |
|
Brapa_ESTC049008
|
AT1G49500 |
Unknown protein |
15 |
28 |
449 |
154 |
29.6 |
5.4 |
|
Brapa_ESTC026374
|
AT5G59310 |
LTP4 (LIPID TRANSFER PROTEIN 4) |
3,006 |
282 |
11,584 |
3,312 |
3.9 |
11.7 |
|
Brapa_ESTC022106
|
AT3G01500 |
CA1 (CARBONIC ANHYDRASE 1) |
5,941 |
532 |
20,763 |
5,420 |
3.5 |
10.2 |
|
|
Broccoli |
Brapa_ESTC008104
|
AT3G49620 |
DIN11 (DARK INDUCIBLE 11); oxidoreductase |
605 |
106 |
4,580 |
645 |
7.6 |
6.1 |
|
Brapa_ESTC049008
|
AT1G49500 |
Unknown protein |
15 |
28 |
106 |
162 |
7.0 |
5.7 |
|
Brapa_ESTC026957
|
AT3G49620 |
DIN11 (DARK INDUCIBLE 11); oxidoreductase |
1,151 |
347 |
4,544 |
1,435 |
3.9 |
4.1 |
|
Brapa_ESTC047756
|
AT3G51590 |
LTP12 (LIPID TRANSFER PROTEIN 12) |
322 |
209 |
831 |
632 |
2.6 |
3.0 |
|
Brapa_ESTC028727
|
AT3G15400 |
ATA20 (Arabidopsis thaliana anther 20) |
150 |
139 |
327 |
586 |
2.2 |
4.2 |
|
|
Down-regulation |
Mustard |
Brapa_ESTC016027
|
AT2G46450 |
ATCNGC12 (cyclic nucleotide gated channel 12) |
707 |
70 |
101 |
11 |
−7.0 |
−6.1 |
|
Brapa_ESTC022776
|
AT1G06160 |
Ethylene-responsive factor, putative |
4,299 |
466 |
962 |
71 |
−4.5 |
−6.5 |
|
Brapa_ESTC044452
|
AT4G23990 |
ATCSLG3 (Cellulose synthase-like G3) |
1,958 |
1,605 |
477 |
279 |
−4.1 |
−5.8 |
|
Brapa_ESTC022540
|
AT5G20820 |
Auxin-responsive protein-related |
400 |
474 |
40 |
232 |
−9.9 |
−2.0 |
|
Brapa_ESTC014184
|
AT5G49360 |
BXL1 (BETA-XYLOSIDASE 1) |
847 |
141 |
314 |
34 |
−2.7 |
−4.1 |
|
|
Turnip |
Brapa_ESTC026136
|
AT3G01420 |
ALPHA-DOX1 (ALPHA-DIOXYGENASE 1) |
3,059 |
2,016 |
287 |
204 |
−10.7 |
−9.9 |
|
Brapa_ESTC016027
|
AT2G46450 |
ATCNGC12 (cyclic nucleotide gated channel 12) |
707 |
70 |
15 |
15 |
−46.8 |
−4.5 |
|
Brapa_ESTC006382
|
AT5G45340 |
CYP707A3 (cytochrome P450, family 707, subfamily A, polypeptide 3) |
4,649 |
906 |
962 |
220 |
−4.8 |
−4.1 |
|
Brapa_ESTC004877
|
no_hits_found |
--------- |
315 |
161 |
100 |
40 |
−3.2 |
−4.0 |
|
Brapa_ESTC012086
|
AT4G16260 |
Glycosyl hydrolase family 17 protein |
7,703 |
764 |
523 |
272 |
−14.7 |
−2.8 |
|
|
Broccoli |
Brapa_ESTC014184
|
AT5G49360 |
BXL1 (BETA-XYLOSIDASE 1); hydrolase, hydrolyzing O-glycosyl compounds |
847 |
141 |
34 |
18 |
−25.1 |
−7.9 |
|
Brapa_ESTC002586
|
AT4G35770 |
DIN1 | SEN1 (DARK INDUCIBLE 1) |
6,771 |
562 |
22 |
135 |
−303.4 |
−4.2 |
|
Brapa_ESTC016027
|
AT2G46450 |
CNGC12, ATCNGC12 | ATCNGC12 (cyclic nucleotide gated channel 12) |
707 |
70 |
7 |
12 |
−106.0 |
−5.9 |
|
Brapa_ESTC021555
|
AT4G15530 |
PPDK (PYRUVATE ORTHOPHOSPHATE DIKINASE) |
4,100 |
604 |
310 |
100 |
−13.2 |
−6.1 |
|
Brapa_ESTC007363
|
AT4G37010 |
Calcium ion binding |
1,109 |
145 |
77 |
26 |
−14.4 |
−5.5 |
Table 3Genes that are differentially expressed in all experimental samples as well as both June and October samples.
Table 3
|
Br_SEQ_ID |
At Locus |
Description |
Fold change |
|
|
Mustard/Chiifu |
Turnip/Chiifu |
Broccoli/Chiifu |
|
|
June |
Oct. |
June |
Oct. |
June |
Oct. |
|
Brapa_ESTC049008
|
AT1G49500 |
Hypothetical protein |
34.5 |
3.0 |
29.6 |
5.4 |
7.0 |
5.7 |
|
Brapa_ESTC016027
|
AT2G46450 |
CNGC12 |
−7.0 |
−6.1 |
−46.8 |
−4.5 |
−106.0 |
−5.9 |
References
- Alvarez S, Goodger JQD, Marsh EL, Chen S, Aslrvatham VS, et al. 2006. Characterization of maize xylem sap proteome. J Proteome Res. 5: 963-972.
- Alvarez S, Marsh EL, Schroeder SG, Schanchtman DP. 2008. Metabolomic and proteomic changes in the xylem sap of maize under drought. Plant Cell Environ. 31: 425-340.
- Ashburner M, Ball CA, Blake JA, Botstein D, Butler H, et al. 2000. Gene ontology: tool for the unification of biology. The Gene Ontology Consortium. Nat Genet. 25: 25-29.
- Asahina M, Satoh S. 2015. Molecular and physiological mechanisms regulating tissue reunion in incised plant tissues. J Plant Res.
- Ayre BG, Turgeon R. 2004. Graft transmission of a floral stimulant derived from CONSTANS. Plant Physiol. 13: 2271-2278.
- Banerjee AK, Chatterjee M, Yu Y, Suh SG, Miller WA, et al. 2006. Dynamics of a mobile RNA of potato involved in a long-distance signaling pathway. Plant Cell. 18: 3443-3457.
- Beveridge C. 2006. Axillary bud outgrowth: sending a message. Curr Opin Plant Biol. 9: 35-40.
- Bhutz A, Kolasa A, Arlt K, Walz C, Kehr J. 2004. Xylem sap protein composition is conserved among different plant species. Planta. 219: 610-618.
- Biles CL, Abeles FB. 1991. Xylem sap proteins. Plant Physiol. 96: 597-601.
- Clearwater MJ, Seleznyova A, Thorp TG, Blattmann P, Barnett AM, et al. 2006. Vigor-controlling rootstocks affect early shoot growth and leaf area development of kiwifruit. Tree Physiol. 26: 505-515.
- Cookson SJ, Ollat N. (2013): Grafting with rootstocks induces extensive transcriptional re-programming in the shoot apical meristem of grapevine. BMC Plant Biol. 13: 147
- Cookson SJ, Moreno MJC, Mendome LZN, Delrot S, Magnin N, et al. 2014. Heterografting with nonself rootstocks induces genes involved in stress responses at the graft interface when compared with autografted controls. J Exp Bot. 65: 2473-2481.
- Corbesier L, Vincent C, Jang S, Fornara FQ, Fan I, et al. 2007. FT protein movement contributes to long-distance signaling in floral induction of Arabidopsis. Science. 316: 1030-1033.
- Davis AR, Perkins-Veazie P, Hassel R, Levi A, King SR, et al. 2008. Grafting effects on vegetable quality. HortScience. 43: 1670-1672.
- Dong X, Feng H, Xu M, Lee J, Kim YK, et al. 2013. Comprehensive analysis of genic male sterility -related genes in Brassica rapa using a newly developed Br300K oligomeric chip. PLoS One. 8: e72178
- Du Z, Zhou X, Zhang Z, Su Z. 2010. agriGO: a GO analysis toolkit for the agricultural community. Nucleic Acids Res. 38: W64-70.
- Eriksson S, Andréasson E, Ekbom B, Granér G, Pontoppidan B, et al. 2002. Complex formation of myrosinase isoenzymes in oilseed rape seeds are dependent on the presence of myrosinase-binding proteins. Plant Physiol. 129: 1592-1599.
- Gollan T, Schurr U, Schultze ED. 1992. Stomatal response to drying soil in relation to changes in xylem sap composition of Helianthus annuus L. The concentrations of cations, anions, amino acids in, and pH of, the xylem sap. Plant Cell Environ. 15: 453-459.
- Goodger JQD, Sharp RE, Marsh EL, Schachtman DP. 2005. Relationships between xylem sap constituents and leaf conductance of well-watered and water-stressed maize across three xylem sampling techniques. J Exp Bot. 56: 2389-2400.
- Gregory PJ, Atkinson CJ, Bengough AG, Else MA, Fernández-Fernández F, et al. 2013. Contributions of roots and rootstocks to sustainable, intensified crop production. J Exp Bot. 64: 1209-1222.
- Huang T, Böhlenius H, Eriksson S, Parcy F, Nilsson O. 2005. The mRNA of Arabidopsis gene FT moves from leaf to shoot apex and induces flowering. Science. 309: 1694-1696.
- Irizarry RA, Hobbs R, Collin R, Beazer-Barclay YD, Antonellis KJ, et al. 2003. Exploration, normalization, and summaries of high density oligonucleotide array probe level data. Biostatistics. 4: 249-264.
- Jackson S. 1999. Multiple signaling pathways control tuber induction in potato. Plant Physiol. 119: 1-8.
- Jensen PJ, Rytter J, Detwiler EA, Travis JW, McNellis TW. 2003. Rootstock effects on gene expression patterns in apple tree scions. Plant Mol Biol. 493: 493-511.
- Jensen PJ, Makalowska I, Altman N, Fazio G, Praul C, et al. 2010. Rootstock-regulated gene expression patterns in apple tree scions. Tree Genet Genomes. 6: 57-72.
- Jensen PJ, Halbrendt N, Fazio G, Makalowska I, Altman N, et al. 2012. Rootstock-regulated gene expression patterns associated with fire blight resistance in apple. BMC Genomics. 13: 9
- Kehr J, Buhtz A. 2008. Long distance transport and movement of RNA through the phloem. J Exp Bot. 59: 85-92.
- Kehr J, Buhtz A, Giavalisco P. 2005. Analysis of xylem sap proteins from Brassica napus. BMC Plant Biol. 5: 1-13.
- Kim M, Canio W, Kessler S, Sinha N. 2001. Developmental changes due to long-distance movement of a homeobox fusion transcript in tomato. Science. 293: 287-289.
- Ko D, Kang J, Kiba T, Park J, Kojima M, et al. 2014. Arabidopsis ABCG14 is essential for the root-to-shoot translocation of cytokinin. Proc Natl Acad Sci. 111: 7150-7155.
- Koepke T, Dhingra A. 2013. Rootstock scion somatogenetic interactions in perennial composite plants. Plant Cell Rep. 32: 1321-1337.
- Kubota C, McClure MA. 2008. Vegetable grafting: history, use, and current technology status in North America. HortScience. 43: 1664-1669.
- Lang A, Chailakhyan MK, Frolova IA. 1977. Promotion and inhibition of flower formation in a dayneutral plant in grafts with a short-day plant and a long-day plant. Proc Natl Acad Sci. 74: 2412-2416.
- Le Hir R, Beneteau J, Bellini C, Vilaine F, Dinant S. 2008. Gene expression profiling: keys for investigating phloem functions. Trends Plant Sci. 13: 273-280.
- Lee JM. 1994. Cultivation of grafted vegetables I. Current status, grafting methods, and benefits. HortScience. 29: 235-239.
- Lee JM. 2003. Advances in vegetable grafting. Chron Hort. 43: 13-19.
- Lee JM, Kubota C, Tsao SJ, Bie Z, Echevarria PH, et al. 2010. Current status of vegetable grafting: diffusion, grafting techniques, automation. Sci Hortic. 127: 93-105.
- Lin MK, Belanger H, Lee YJ, Varkonyi-Gasic E, Taoka KI, et al. 2007. FLOWERING LOCUS T protein may act as the long-distance florigenic signal in the Cucurbits. Plant Cell. 19: 1488-1506.
- Lough TJ, Lucas WJ. 2006. Integrative plant biology: role of phloem long-distance macromolecular trafficking. Annu Rev Plant Biol. 57: 203-232.
- McGarry RC, Kragler F. 2013. Phloem-mobile signals affecting flowers: applications for crop breeding. Trends Plant Sci. 18: 198-206.
- Mithen RF, Dekker M, Verkerk R, Rabot S, Johnson IT. 2000. The nutritional significance, biosynthesis, and biovailiability of glucosinolates in human foods. J Sci Food Agric. 80: 967-984.
- Notaguch M, Abe M, Kimura T, Daimon Y, Kobayashi T, et al. 2008. Long-distance, graft-transmissible action of Arabidopsis FLOWERING LOCUS T protein to promote flowering. Plant Cell Physiol. 49: 1645-1658.
- Oka-Kira E, Kawaguchi M. 2006. Long-distance signaling to control root nodule number. Curr Opin Plant Biol. 9: 496-502.
- Palauqui JC, Elmayan T, Pollien JM, Vaucheret H. 1997. Systemic acquired silencing: transgene-specific post-transcriptional silencing is transmitted by grafting from silenced stocks to non-silenced scions. EMBO J. 16: 4738-4745.
- Pant BD, Buhtz A, Kehr J, Scheible WR. 2008. Micro-RNA399 is a long-distance signal for the regulation of plant phosphate homeostasis. Plant J. 53: 731-738.
- Park WT, Kim JK, Park S, Lee SW, Li X, et al. 2012. Metabolic profiling of glucosinolates, anthocyanins, carotenoids, and other secondary metabolites in Kohlrabi (Brassica oleracea var. gonglylodes). J Agri Food Chem. 60: 8111-8116.
- Prassinos C, Ko JH, Lang G, Iezzoni AF, Han KH. 2009. Rootstock-induced dwarfing in cherries is caused by differential cessation of terminal meristem growth and is triggered by rootstock-specific gene regulation. Tree Physiol. 29: 927-936.
- Ruiz-Medrano R, Xoconostle-Cázares B, Lucas WJ. 1999. Phloem long-distance transport of CmNACP mRNA: implications for supracellular regulation in plants. Development. 126: 4405-4419.
- Satoh S, Lizuka C, Kikuchi A, Nakamura N, Fujii T. 1992. Proteins and carbohydrates in xylem sap from squash root. Plant Cell Physiol. 33: 841-847.
- Sonoda S, Nishiguchi M. 2000. Graft transmission of post-transcriptional gene silencing : target specificity for RNA degradation is transmissible between silenced and non-silenced plants, but not between silenced plants. Plant J. 21: 1-8.
- Stegemann S, Bock R. 2009. Exchange of genetic material between cells in plant tissue grafts. Science. 324: 649-651.
- Urquhart W, Chin K, Ung H, Moeder W, Yoshioka K. 2011. The cyclic nucleotide-gated channels AtCANG11 and 12 are involved in multilpel Ca2+-dependent physiological responses and act in a synergisitic manner. J Exp Bot. 62: 3671-3682.
- Webster AD. 2004. Vigour mechanisms in dwarfing rootstocks for temperate fruit trees. ISHS Acta Hortic. 658: 29-41.
- Weller JL, Hecht V, Liew LC, Sussmilch FC, Wenden B, et al. 2009. Update on the genetic control of flowering in garden pea. J Exp Bot. 60: 2493-2499.
- Workman C, Jensen LJ, Jarmer H, Berka R, Gautier L, et al. 2002. A new non-linear normalization method for reducing variability in DNA microarray experiments. Genome Biol. 3(9): research0048.
- Wu JL, Wei ZG, Zhao HY, Li HX, Hu F. 2009. The role of amino acids in the long-distance transport of La and Y in the xylem sap of tomato. Biol Trance Elem Res. 129: 239-250.
- Wu X, Weigel D, Wiqqe PA. 2002. Siganling in plants by intercellular RNA and protein movement. Genes Dev. 16: 151-158.
- Yoo BC, Kragler F, Varkonyi-Gasic E, Haywood V, Archer-Evans S, et al. 2004. A systemic small RNA signaling system in plants. Plant Cell. 16: 1979-2000.
- Yoshioka K, Moeder W, Kang HG, Kachroo P, Masmoudi K, et al. 2006. The chimeric Arabidopsis CYLIC NUCTOTIDE-GATED ION CHANNEL11/12 activates multiple pathogen resistance responses. Plant Cell. 18: 747-763.
- Zeevaart JAD. 1976. Physiology of flower formation. Annu Rev Plant Physiol. 27: 321-348.