Abstract
Grain weight (GW) is one of the most important targets for grain yield in rice breeding. In previous studies, two quantitative trait loci (QTLs) for grain weight, tgw2 and gw8.1, were identified using progeny derived from crosses between the japonica cultivar Hwaseong and Oryza grandiglumis, and between Hwaseong and O. rufipogon (IRGC 105491), respectively. The wild alleles increased GW at two loci. An F2 population (186 plants) was developed by crossing two near isogenic lines (NILs) harboring tgw2 and gw8.1 to test their interaction. Simple sequence repeat (SSR) markers tightly linked to the two QTLs were used to check the genotype of the F2 population. Based on the genotype at the two loci, tgw2 and gw8.1, the F2 plants were classified into 9 groups with a combination of three genotypes at each of the two loci. Two-way ANOVA revealed no interaction between the 2 QTLs in the F2 population. The 1,000 grain weight (TGW) of homozygous plants with wild alleles at the two loci was significantly higher than that of plants with a single QTL in the F2 and F3 lines. These results indicate that two QTLs act additively, in distinct or complementary pathways, to control grain weight. Based on these results, it is desirable to pyramid the two QTLs into a single line, since the double-QTL line displayed further increase of TGW in the Hwaseong background.
-
Key words: Rice, Grain weight, Quantitative trait loci, Simple sequence repeat, Interaction, Near isogenic line
INTRODUCTION
Rice (
Oryza sativa L.) is the world’s most important cereal food crop. Its yield is determined by three major components: grain weight, grain number per panicle and panicle number per plant. Grain weight shows a positive correlation with grain size, which is controlled by the length, width and thickness of the grain. In addition, grain weight is important for the evolution of cereal crops, because large seed size was selected by humans during crop domestication (
Li et al. 2004). Large size of the seeds could have a favorable effect on seed vigor and uniform germination, whereas more seeds are able to be produced by smaller seeds (
Takeda 1991). Genetic control of grain weight has been extensively investigated over the last decade. Recently, many QTLs affecting grain size have been identified in rice populations based on crosses between divergent cultivars or accessions (
Cui et al. 2003;
Ishimaru 2003;
Kang et al. 2011). Several genes involved in grain size control have also been cloned. GS3, a major QTL for grain length, encodes a putative transmembrane protein (
Fan et al. 2006).
GW2 encodes an E3 ubiquitin ligase, and affects grain width by restricting cell division (
Song et al. 2007). An unknown protein encoded by qSW5/GW5 is also required to control grain width through limitation of cell proliferation (
Shomura et al. 2008;
Weng et al. 2008). GS5 encodes a putative serine carboxypeptidase, which functions as a positive factor for grain width (
Li et al. 2011). SPL16 (GW8) encodes a protein which acts as a positive regulator of cell proliferation and promotes cell division, leading to increase in grain width (
Wang et al. 2012). Although such studies have improved our understanding of the genetic control of grain size traits, the interaction among these QTLs remains to be clarified.
To elucidate the genetic basis of the yield-related traits of rice (spikelet number per panicle and 1000-grain weight), information about the cloned genes or QTLs has been employed for pyramiding of the QTLs by genomic-assisted selection to accumulate the beneficial QTLs in a single line. Molecular marker-assisted QTL pyramiding has enabled quick and accurate selection of lines with the target traits. The results demonstrated that multiple alleles underlying QTLs contribute to the increase in grain width and grain thickness in rice, and that accumulation of these additive effects allows generation of the large grain shape in rice (
Jin et al. 2011;
Ying et al. 2012).
To date, a number of studies reported interactions among genes which are thought to make substantial contributions to the genetic architecture driving diversification, which can be dissected via QTL analysis in rice (
Yu et al. 1997). In studies employing various primary mapping populations (F
2, RIL), no clear support was provided for the existence of interactions among QTLs, mainly due to background noise and small population size (
Yano and Sasaki 1997). The employment of QTL-NIL has been proposed for the detection of interactions among genes and detailed characterization, as the background genetic effects can be minimized through this method. However, the epistatic interactions between GW QTLs are unclear, and studies on the interaction among QTLs are quite limited (
Jin et al. 2011). Characterization of the genes underlying GW and their interactions will provide more insights into the molecular mechanisms underlying seed size development in rice, and will likely be useful for gene pyramiding aimed at improving rice grain yield.
In the previous studies, two QTL-NILs related to grain weight,
tgw2-NIL (
Yoon et al. 2006) and
gw8.1-NIL (
Xie et al. 2006), were developed by introgressing the chromosomal segments of two different wild species,
O. grandiglumis (IRGC 101154) and
O. rufipogon (IRGC 105491), into the Korean elite
japonica cultivar Hwaseong. The present study was carried out to elucidate the interactions between the two QTLs,
gw8.1 and
tgw2.
MATERIALS AND METHODS
Plant materials
Molecular marker-assisted backcrossing was used to pyramid 2 QTLs, gw8.1 and tgw2. A total of 186 F2 plants were produced from a cross between the 2 QTL-NILs and genotyped using SSR markers tightly linked to the two QTLs. Four F2 plants, including 1 of each of the following 4 types of QTL-NILs, were selected and advanced to F3 lines: NIL-1 (Hwaseong homozygous at both loci), NIL-2 (O. grandiglumis homozygous at tgw2 and Hwaseong homozygous at gw8.1), NIL-3 (Hwaseong homozygous at tgw2 and O. rufipogon homozygous at gw8.1), and NIL-4 (O. grandiglumis and O. rufipogon homozygous at tgw2 and gw8.1).
Field trials and trait evaluation
During the summer of 2012, 186 F2 plants were grown at the experimental farm of Chungnam National University, Daejeon, Korea, at a density of 15 cm × 30 cm (line × row). The seeds were sown on April 25, and transplanted to a field on May 29. To minimize border effects, the seedlings of the F2 plants were planted in the middle, excluding the first five and last five lines in each row. The length, width, and thickness of the grain, and 1000-grain weight was measured in brown rice of the F2 plants. Fully-filled seeds were re-dried in an oven at 30°C for 24h. The 1,000-grain weight (TGW) was evaluated by measuring the weight of 100 randomly-selected brown rice grains. This procedure was performed in triplicate, and the values were averaged to yield a single mean. The four F3 lines selected from the F2 population were grown in the field during the summer of 2013. The planting density was the same as in 2012. The 4 F3 lines were evaluated for 8 traits (days to heading, plant height, panicle length, panicle number). Each line was represented by a row of 30-day-old seedlings, planted with 15 cm between plants and 30 cm between rows in a completely randomized block design with two replications. Days to heading (DTH) was estimated as the number of days from sowing in the field until 50% panicle in the plant headed. Plant height (PH) was measured in centimeters from the surface of the soil to the tip of tallest panicle. Panicle length (PL) was measured in centimeters from the panicle neck to the tip of the panicle. Panicle number (PN) was calculated as the number of panicles per plant. The middle 10 plants from each line were chosen for evaluation, and the average of the measurements was used as the phenotype of each line for the 1,000-grain weight (TGW). Grains with hulls were allowed to dry naturally after harvesting, and partial or unfilled seeds were removed by soaking the grains in water. Fully filled seeds were re-dried in an oven at 30°C for 24 h. The TGW was evaluated by measuring the weight of 250 randomly selected brown rice grains per plant (10 plants per line). Grain length (GL), grain width (GWD), and grain thickness (GTH) were also measured, for 15 grains (brown rice) per plant (10 plants per line) using a 150-mm Vernier caliper (Mitutoyo Corp., Japan). The 1,000-grain weight was corrected for 12% grain moisture content.
Means of the two replications were averaged for each trait and used in data analysis.
DNA extraction and SSR analysis
DNA was extracted from the fresh leaf tissue of each of the 186 F
2 plants. DNA extraction was performed as described in
Causse et al. (1994). Simple sequence repeat (SSR) analysis of the F
2 population was performed according to the method described by
Panaud et al. (1996). SSR markers with tight linkage to the two QTLs (RM12813 for
tgw2 and RM23204, RM23208, RM30000 and RM30002 for
gw8.1,
Xie et al. 2006), were used for genotype analysis of the 186 F
2 plants. The protocols for marker amplification using polymerase chain reaction (PCR), for size separation using polyacrylamide gel electrophoresis (PAGE), and for marker detection using the silver staining procedure were as described in
Xie et al. (2006). The silver staining kits were purchased from Bioneer Co., Korea (
www.bioneer.co.kr).
To analyze the effect of digenic interaction on grain weight, nine genotypes were identified from the 186 F2 plants based on the SSR genotypes tightly linked to each target QTL. In the F2 generation, a QTL was declared if the phenotype was associated with a marker locus at P<0.05 using one-way ANOVA. Two-way ANOVA was used for analysis of the epistatic interaction between the two QTLs. The proportion of observed phenotypic variation attributable to a particular QTL was estimated by the coefficient of determination (R2). The mean values of the four QTL-NILs in the F3 generation were compared using Duncan’s multiple range test, performed in SAS9.2.
RESULTS
Confirmation of QTLs
The existence of the two QTLs was confirmed by QTL analysis of the F
2 population (
Table 1). The
O. grandiglumis and
O. rufipogon alleles contributed to positive effects on grain weight in the Hwaseong background. The results were consistent with those in earlier reports (
Yoon et al. 2006;
Xie et al. 2006). The distribution in the F
2 plants, based on genotypes at the two loci, is shown in
Fig. 1. Wide variation was observed in the F
2 population. The grain weights of the two NILs with
tgw2 and
gw8.1 were 26.4g and 24.1g, respectively, which were significantly higher than that of Hwaseong-NIL (21. 9g) (
P<0.05). At the
tgw2 locus, the mean TGW of the homozygous
O. grandiglumis class was significantly higher than those of the heterozygous and Hwaseong homozygous class. A significant difference was also observed between the heterozygotes and the Hwaseong homozygote (
Table 1). This result indicated that the
O. grandiglumis allele increased TGW in the Hwaseong background in an additive fashion.
Similarly, the TGW of the homozygous O. rufipogon class at gw8.1 was significantly higher than that of the Hwaseong homozygous class. However, no significant difference was detected between the heterozygotes and the Hwaseong homozygote.
The existence of the two QTLs was also confirmed by QTL analysis.
tgw2 and
gw8.1 were found to explain 49.7% and 9.9% of the phenotypic variance of TGW in the F
2 population, respectively (
Table 1).
Based on the genotypes at two loci, RM12813 for
tgw2 and RM23204 for
gw8.1, the 186 F
2 plants were classified into nine groups, with a combination of three genotypes (homozygous for Hwaseong,
O. rufipogon/
O. grandiglumis or heterozygous) at each locus. To test the pyramiding effect of the two QTLs, the average grain weights of the nine genotype classes in the F
2 population were compared. Digenic interaction was not detected, based on two-way ANOVA (
P = 0.98) (
Fig. 2). The TGW-increasing effect of the
O. rufipogon allele at the
tgw2 locus was observed in three genotype classes at the
tgw2 locus. In addition, presence of the
O. grandiglumis allele at the
tgw2 locus increased the TGW in three genotype classes at the
gw8.1 locus. The highest grain weight was observed in the genotype class homozygous for
O. grandiglumis and
O. rufipogon at both loci,
tgw2 and
gw8.1, indicating no interaction between
tgw2 and
gw8. To further confirm the lack of interaction, the grain weights of four QTL-NILs in the F
3 generation were measured (
Table 2). The four F
3 lines were selected from the F
2 population based on the genotypes at the two loci (
Fig. 3). The effect of the
O. rufipogon allele at
gw8.1 on TGW was observed based on comparison of the grain weight between NIL-1 and NIL-3. The effect of the
O. grandiglumis allele at
tgw2 on TGW was observed based on comparison of grain weight between NIL-1 and NIL-2 plants. Finally, the additive effect of the
O. grandiglumis allele at
tgw2 and the
O. rufipogon allele at
gw8.1 on TGW was observed based on comparison of the grain weight between NIL-2 and NIL-4. Difference in TGW between NIL-2 and NIL-4, caused by the genotype of
gw8.1, was observed. The finding further supports that there is no interaction between
tgw2 and
gw8.1. To clarify which grain shape trait was associated with the increase in GW, the grain length, width and thickness was evaluated for the 4 NILs (
Table 2,
Fig. 4). The grain length of the NIL-4 plants was significantly higher than in the NIL-2 and NIL-3 plants. A phenotypic difference was observed between NIL-2 and NIL-4, as a result of the
O. rufipogon allele at
gw8.1. There was no difference in grain width between the NIL-2 and NIL-4 plants, whereas grain widths of the NIL-2 and NIL-4 plants were significantly higher than NIL-3. Similar results were observed for grain thickness: grains of the NIL-2 and NIL-4 plants were significantly thicker than NIL-3 grains. These results indicate that the variation in GW seen in NIL-3 was associated with grain length, whereas all three grain shape traits were responsible for the variation in GW in NIL-2.
To determine the effects of the chromosomal segment harboring
tgw2 and
gw8.1 from
O. grandiglumis and
O. rufipogon on agronomic traits, four agronomic traits of the NILs were next evaluated (
Table 2). The results indicated no significant differences in DTH, PH and PL. However, the NIL-2 and NIL-4 plants had significantly lower numbers of panicles per plant than NIL-1 and NIL-3. This result seems to imply that the QTL associated with panicle number is located in the
O. grandiglumis introgression on chromosome 2, which is consistent with the previous study (
Yoon et al. 2006).
DISCUSSION
In order to understand the genetic architecture of complex traits, it is prerequisite to know the interactions among QTL genes. In rice, primary mapping populations have been extensively used in QTL analyses (
Yano and Sasaki 1997). However, these populations are not appropriate for the precise mapping of one of multiple QTLs, because of the simultaneous segregation of many genetic factors in the whole genome in such populations. Moreover, it would be more difficult to determine the true genetic action of the QTL, because the genetic parameters of a given QTL are often affected by the segregation of other QTLs (
Yano and Sasaki 1997). Only a limited number of interactions between QTLs have been detected, because primary populations cannot provide much information about the real nature of interactions among QTLs due to background noise. For example, two independent studies reported contrasting results on the interaction between QTLs related to grain size. Major QTLs for grain size,
GW2 and
qSW5/GW5, were detected using an F
2 population from a cross between ‘FAZ1’ and ‘Jizi1560,’ with no significant interaction observed between the two (
Ying et al. 2012). However, gene expression analysis with GW2-RNAi lines and CSSL of qSW5 at the transcriptional level clearly showed that
qSW5 can be down-regulated by repression of GW2 transcription, implying the existence of interaction between
GW2 and
qSW5 (
Yan et al. 2011). This problem can be overcome by using QTL-NILs, because the background genetic effects can be minimized by use of QTL-NILs or populations derived from crosses between QTL-NILs with a uniform genetic background. QTLs for heading date (
hd1, hd2, hd3, hd4, hd5, hd6) have been mapped as single Mendelian factors, and the interactions among them were dissected through the QTL-NIL strategy by
Yamamoto et al. (1998). In addition, SPP in four QTL-NILs expressed bimodal or discontinuous distributions and followed the expected segregation ratio of single Mendelian factor by a progeny test (
Zhang et al. 2009). These results clearly indicate that utilization of QTL-NILs is a powerful strategy for estimating the gene action of QTLs. However, few studies have yet examined the interactions among QTLs related to grain weight through use of NILs (
Jin et al. 2011).
GW is one of the most important components of sink size in rice. The pyramiding experiment used in this study revealed that
tgw2 showed no interaction with another grain weight gene,
gw8.1. Compared with the TGW of NIL-1,
tgw2 from
O. grandiglumis increased the GW by up to 22.2%,
gw8.1 from
O. rufipogon by up to 7.4%, and both by up to about 32.4%. The TGWs of three QTL-NILs, NIL-2, NIL-3 and NIL-4, were significantly higher than that of NIL-1. In addition, the TGW of NIL-4 plants was significantly higher than both NIL-3 and NIL-2 plants. These results indicate that the two QTLs act additively, in distinct or complementary pathways, to control grain weight. Analysis of the grain shape traits suggested that the increase in grain length may be responsible for the increased grain weight in NIL-3, whereas increases in the grain length, width and thickness were associated with the increased weight in NIL-2 and NIL-4.
Li et al. (2004) also reported grain length as the main cause of the variation of TGW, based on the highly significant correlation between TGW and grain length at
gw3.1. In some QTL studies, the genetic basis of yield and its components have been explained. For example,
Xing et al. (2002) detected that a number of epistatic QTLs had much larger effects than the main-effect QTLs on the four traits, yield per plant, tillers per plant, grains per panicle and 1,000-grain weight, while most of the epistatic QTLs did not have main effects at the single-locus level. In contrast, a large proportion of the main-effect QTLs was involved in the epistatic interactions. This indicates that epistasis, in the form of additive by additive interactions, plays a very important role in controlling the expression of yield and yield-component traits. Similarly,
Yu et al. (1997) detected large numbers of interactions for yield and yield components in F
2:3 families derived from the cross between Zhensan 97 and Minghui63, the parents of Sanyou63, an elite rice hybrid, while additive by additive interactions were the predominant forms of interactions.
Li et al. (1997) also found epistasis to be an important genetic basis of three grain yield components, with digenic interactions due primarily to the additive epistatic gene action. These results indicate that epistasis plays a very important role of in controlling the expression of yield and its component traits.
The seed size is a complex quantitative trait in rice. Genetic improvement of this factor through gene pyramiding would be difficult, mainly due to the complicated interactions of seed size genes. Our analysis indicated that more comprehensive research on epistasis among QTLs is necessary to provide enough data to facilitate the accumulation of desirable QTLs in breeding lines, and to better understand the genetic mechanisms controlling grain weight. The results suggested that it is desirable to pyramid two QTLs into a single line, since the double-QTL line provided further advantages for increasing TGW in the Hwaseong background.
CONCLUSION
To elucidate the interaction of two QTLs, gw8.1 and tgw2, an F2 population was developed by crossing two near isogenic lines (NILs) harboring tgw2 and gw8.1. SSR markers tightly linked to the two QTLs were used to check the genotype of the F2 population, and to select four F3 QTL-NILs with different combinations of the two QTLs. Two-way ANOVA revealed no interaction between the 2 QTLs in the F2 population. The TGW of homozygous plants with wild alleles at the two loci was significantly higher than that of plants with a single QTL in the F2 and F3 lines. These results indicate that the two QTLs act additively in distinct or complementary pathways to control grain weight. Based on these results, it would be desirable to pyramid two QTLs into a single line, since the double-QTL line gave further advantages for increasing TGW in the Hwaseong background.
ACKNOWLEDGEMENTS
This work was supported by the research fund of Chungnam National University in 2014.
Fig. 1Frequency distributions of 1,000 grain weight in 3 genotype classes (homozygous for Hwaseong and O. grandiglumis/O. rufipogon, and heterozygous for tgw2 and gw8.1, respectively) of individual QTLs in the F2 population. Arrows indicate mean 1,000 grain weight for Hwaseong and each of the QTL-NILs.
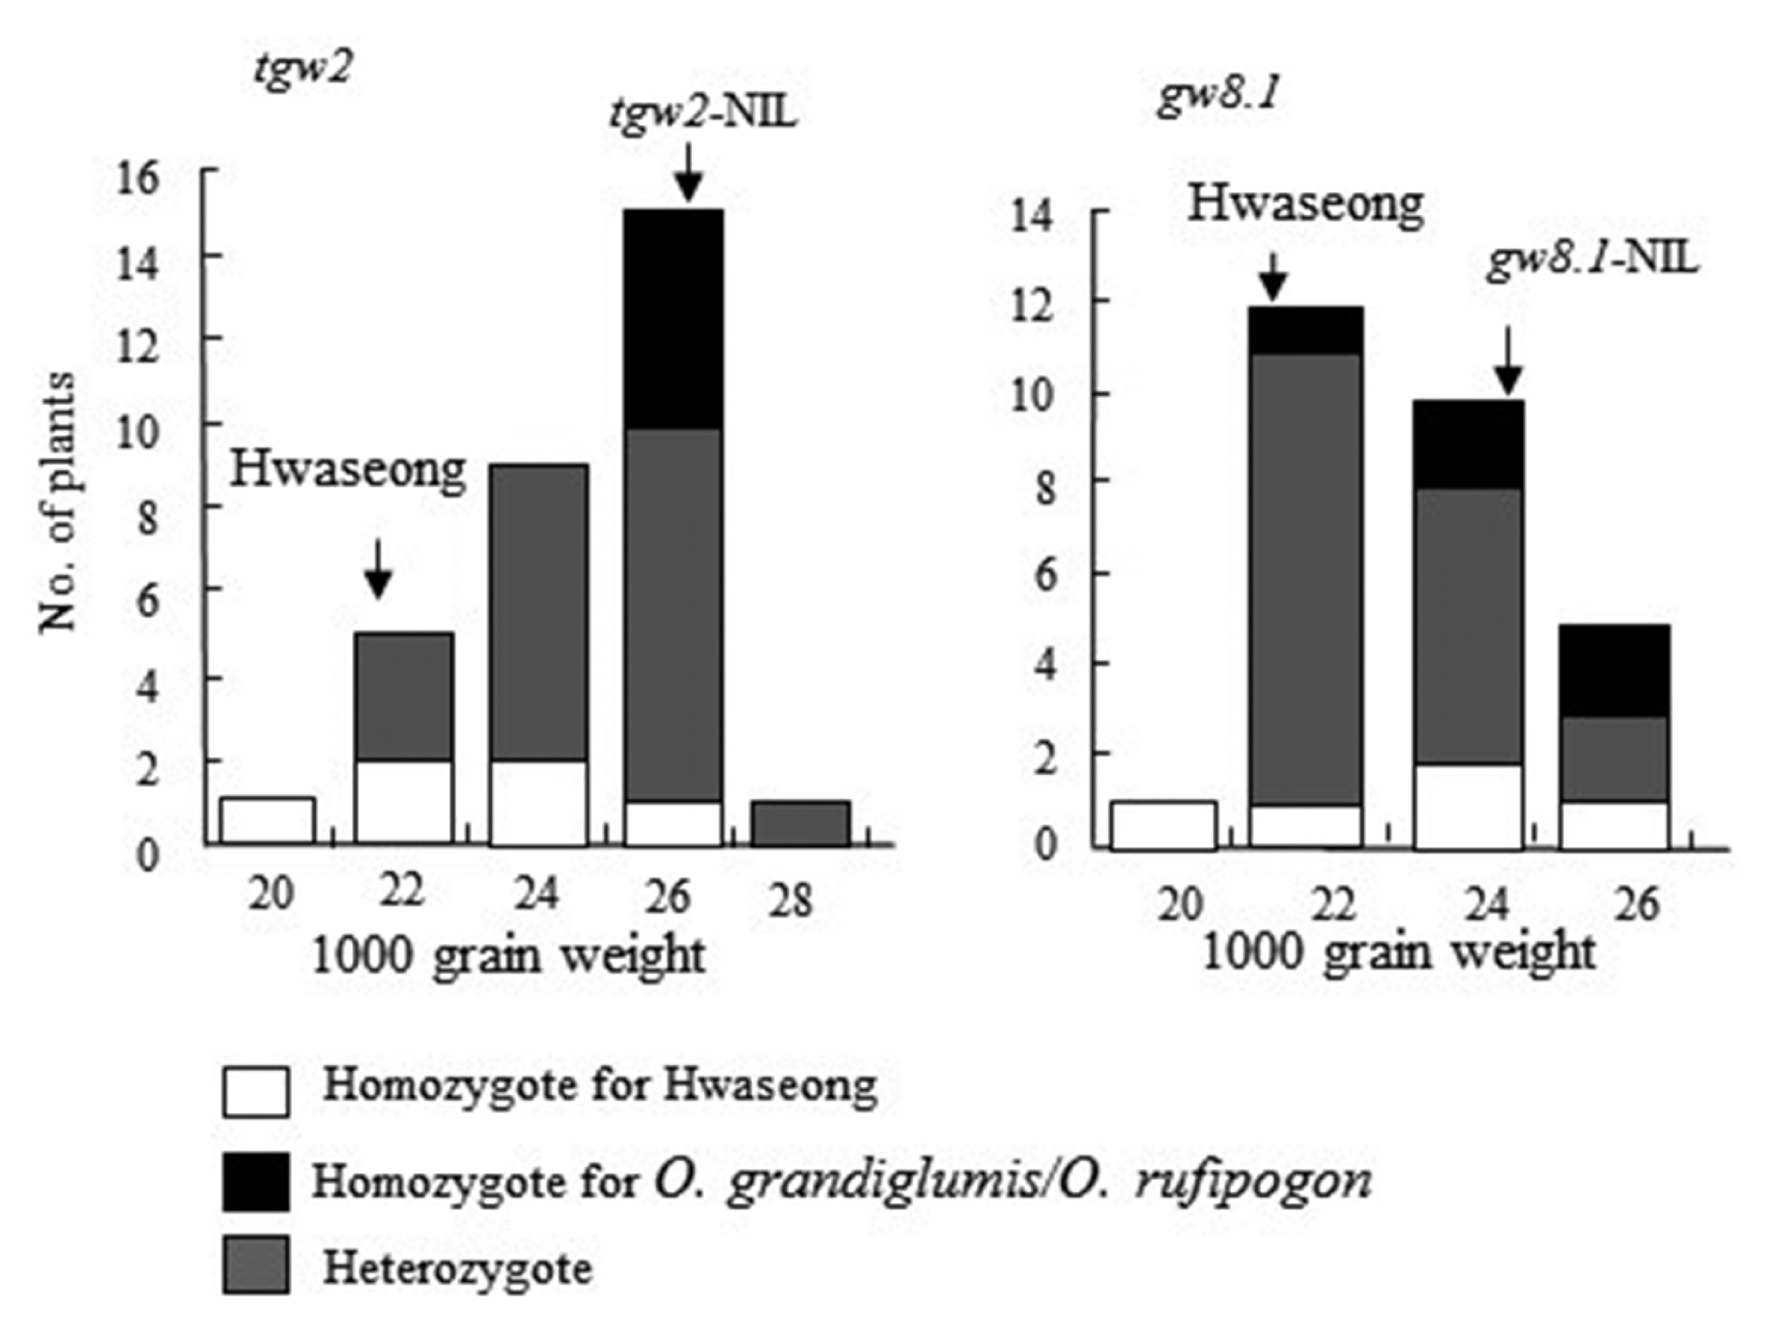
Fig. 2Differences in TGW for different genotype classes between tgw2 and gw8.1 in the F2 population from the cross between two QTL-NILs. The P-value was calculated using two-way ANOVA, and indicated no interaction between the two QTLs. Numbers in parenthesis indicate the number of each genotype class. HH, HG and GG indicate Hwaseong homozygotes, Hwaseong/O. grandiglumis heterozygotes and O. grandiglumis homozygotes, respectively. HH, HR and RR indicate Hwaseong homozygotes, Hwaseong/O. rufipogon heterozygotes and O. rufipogon homozygotes, respectively.
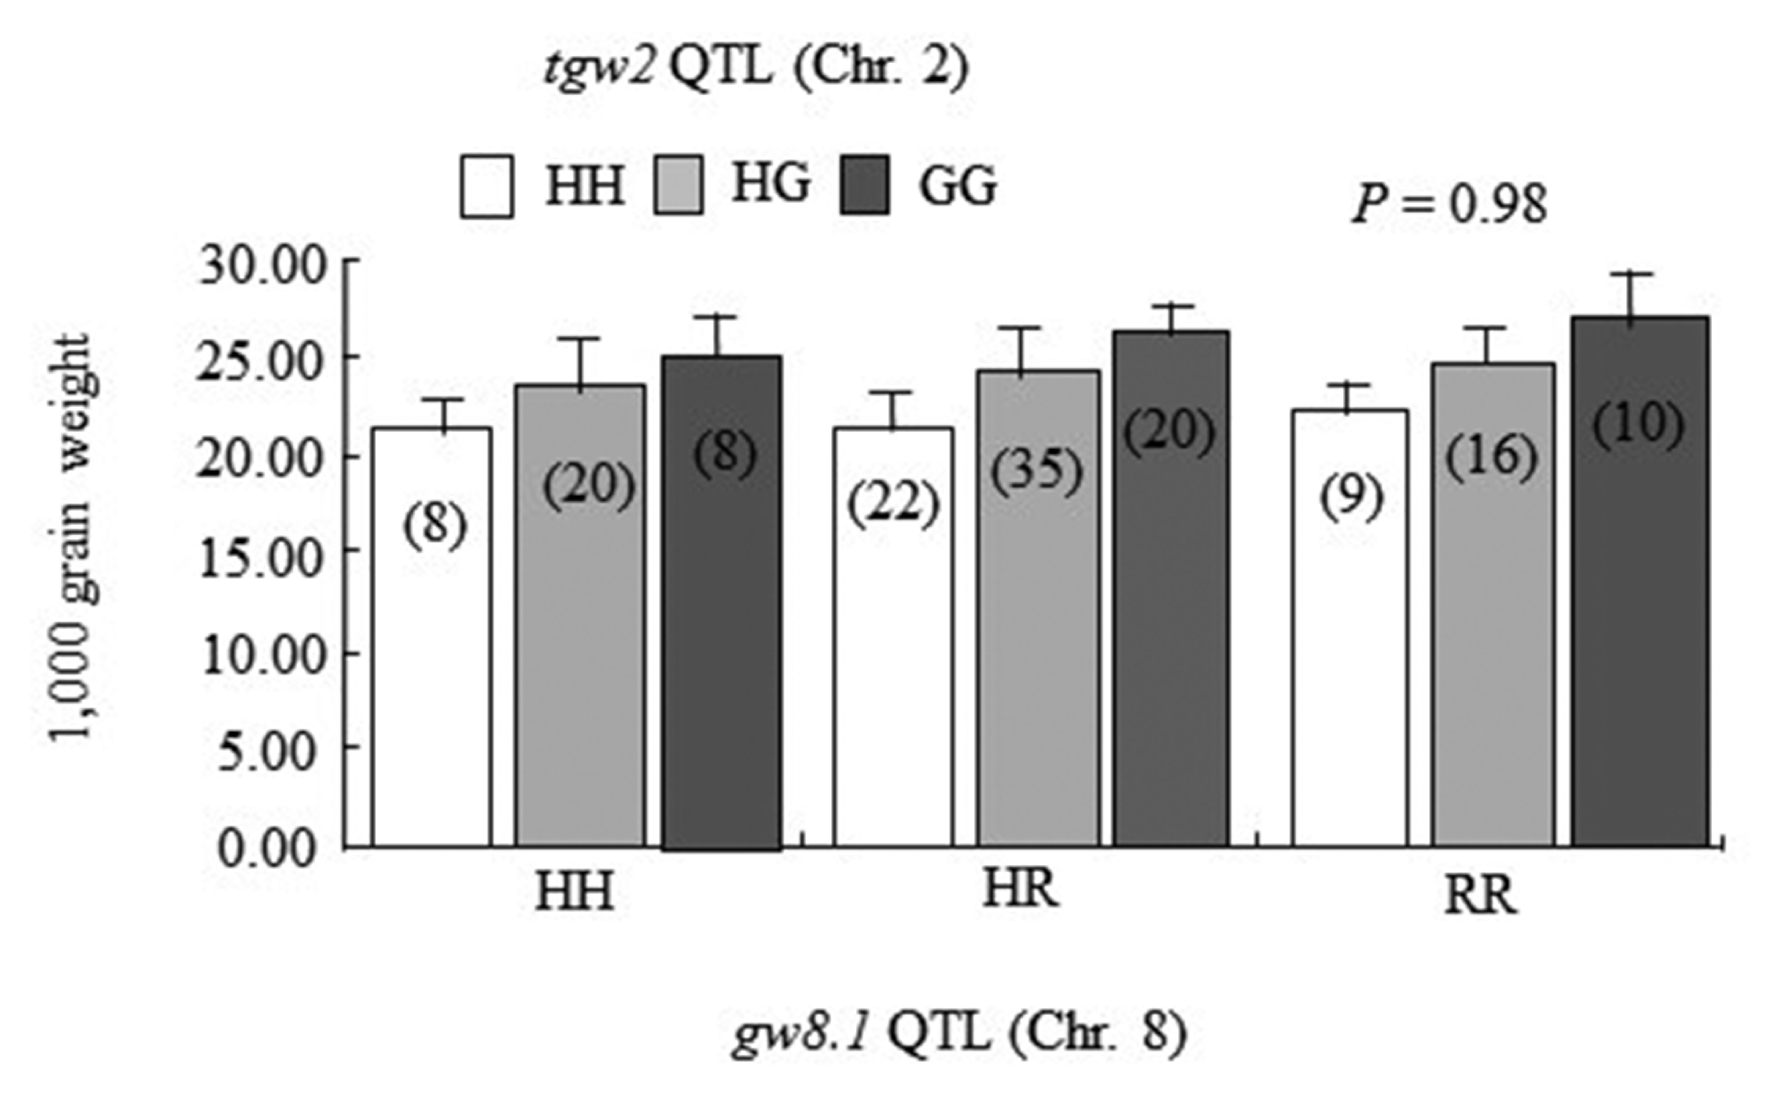
Fig. 3Graphical genotype of the 4 NIL-QTLs in the F3 generation. The two circles on the chromosomes represent regions of the 2 QTLs. Open bars and solid bars show chromosome segments derived from Hwaseong and O. grandiglumis or O. rufipogon, respectively.
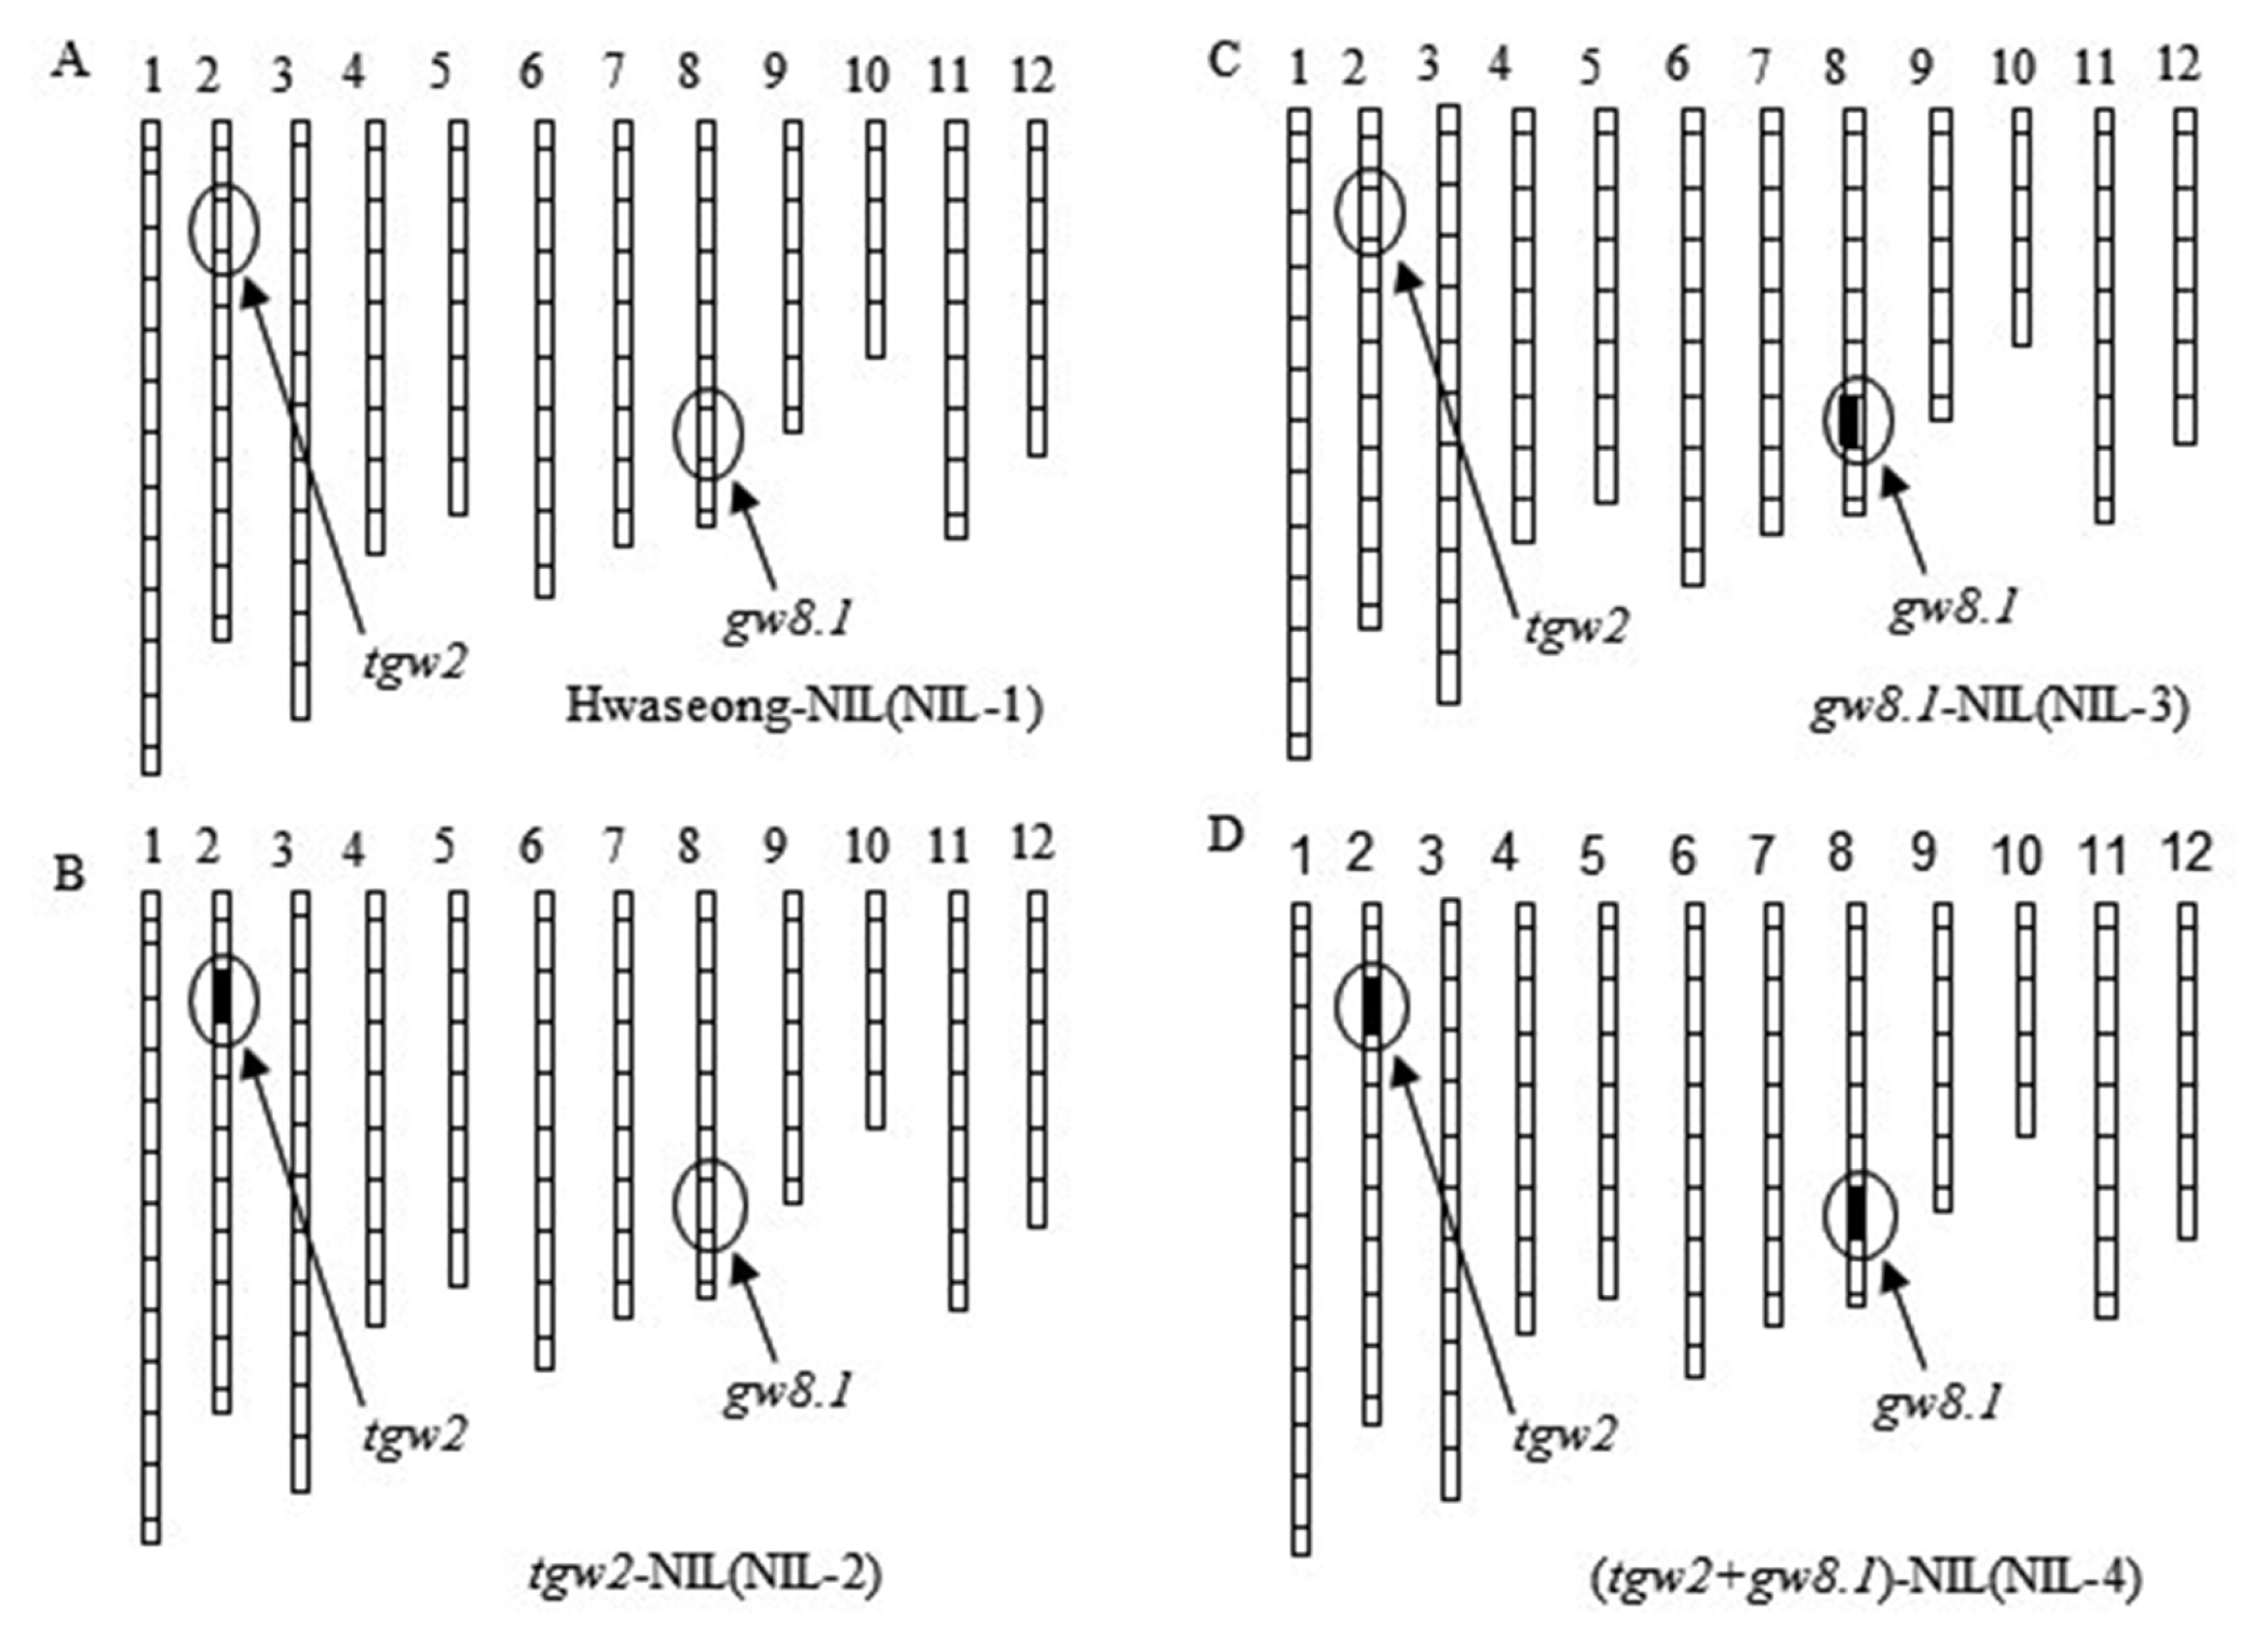
Fig. 4Comparison of grain morphology traits among the 4 QTL-NILs with O. grandiglumis and O. rufipogon. Five brown rice grains are arranged for comparison (Scale bar in boxes). A: O. grandiglumis, B: O. rufipogon, C: NIL-1, D: NIL-2, E: NIL-3, F: NIL-4. NIL-1 (Hwaseong homozygous at both loci), NIL-2 (O. grandiglumis homozygous at tgw2 and Hwaseong homozygous at gw8.1), NIL-3 (Hwaseong homozygous at tgw2 and O. rufipogon homozygous at gw8.1), and NIL-4 (O. grandiglumis and O. rufipogon homozygous at tgw2 and gw8.1).
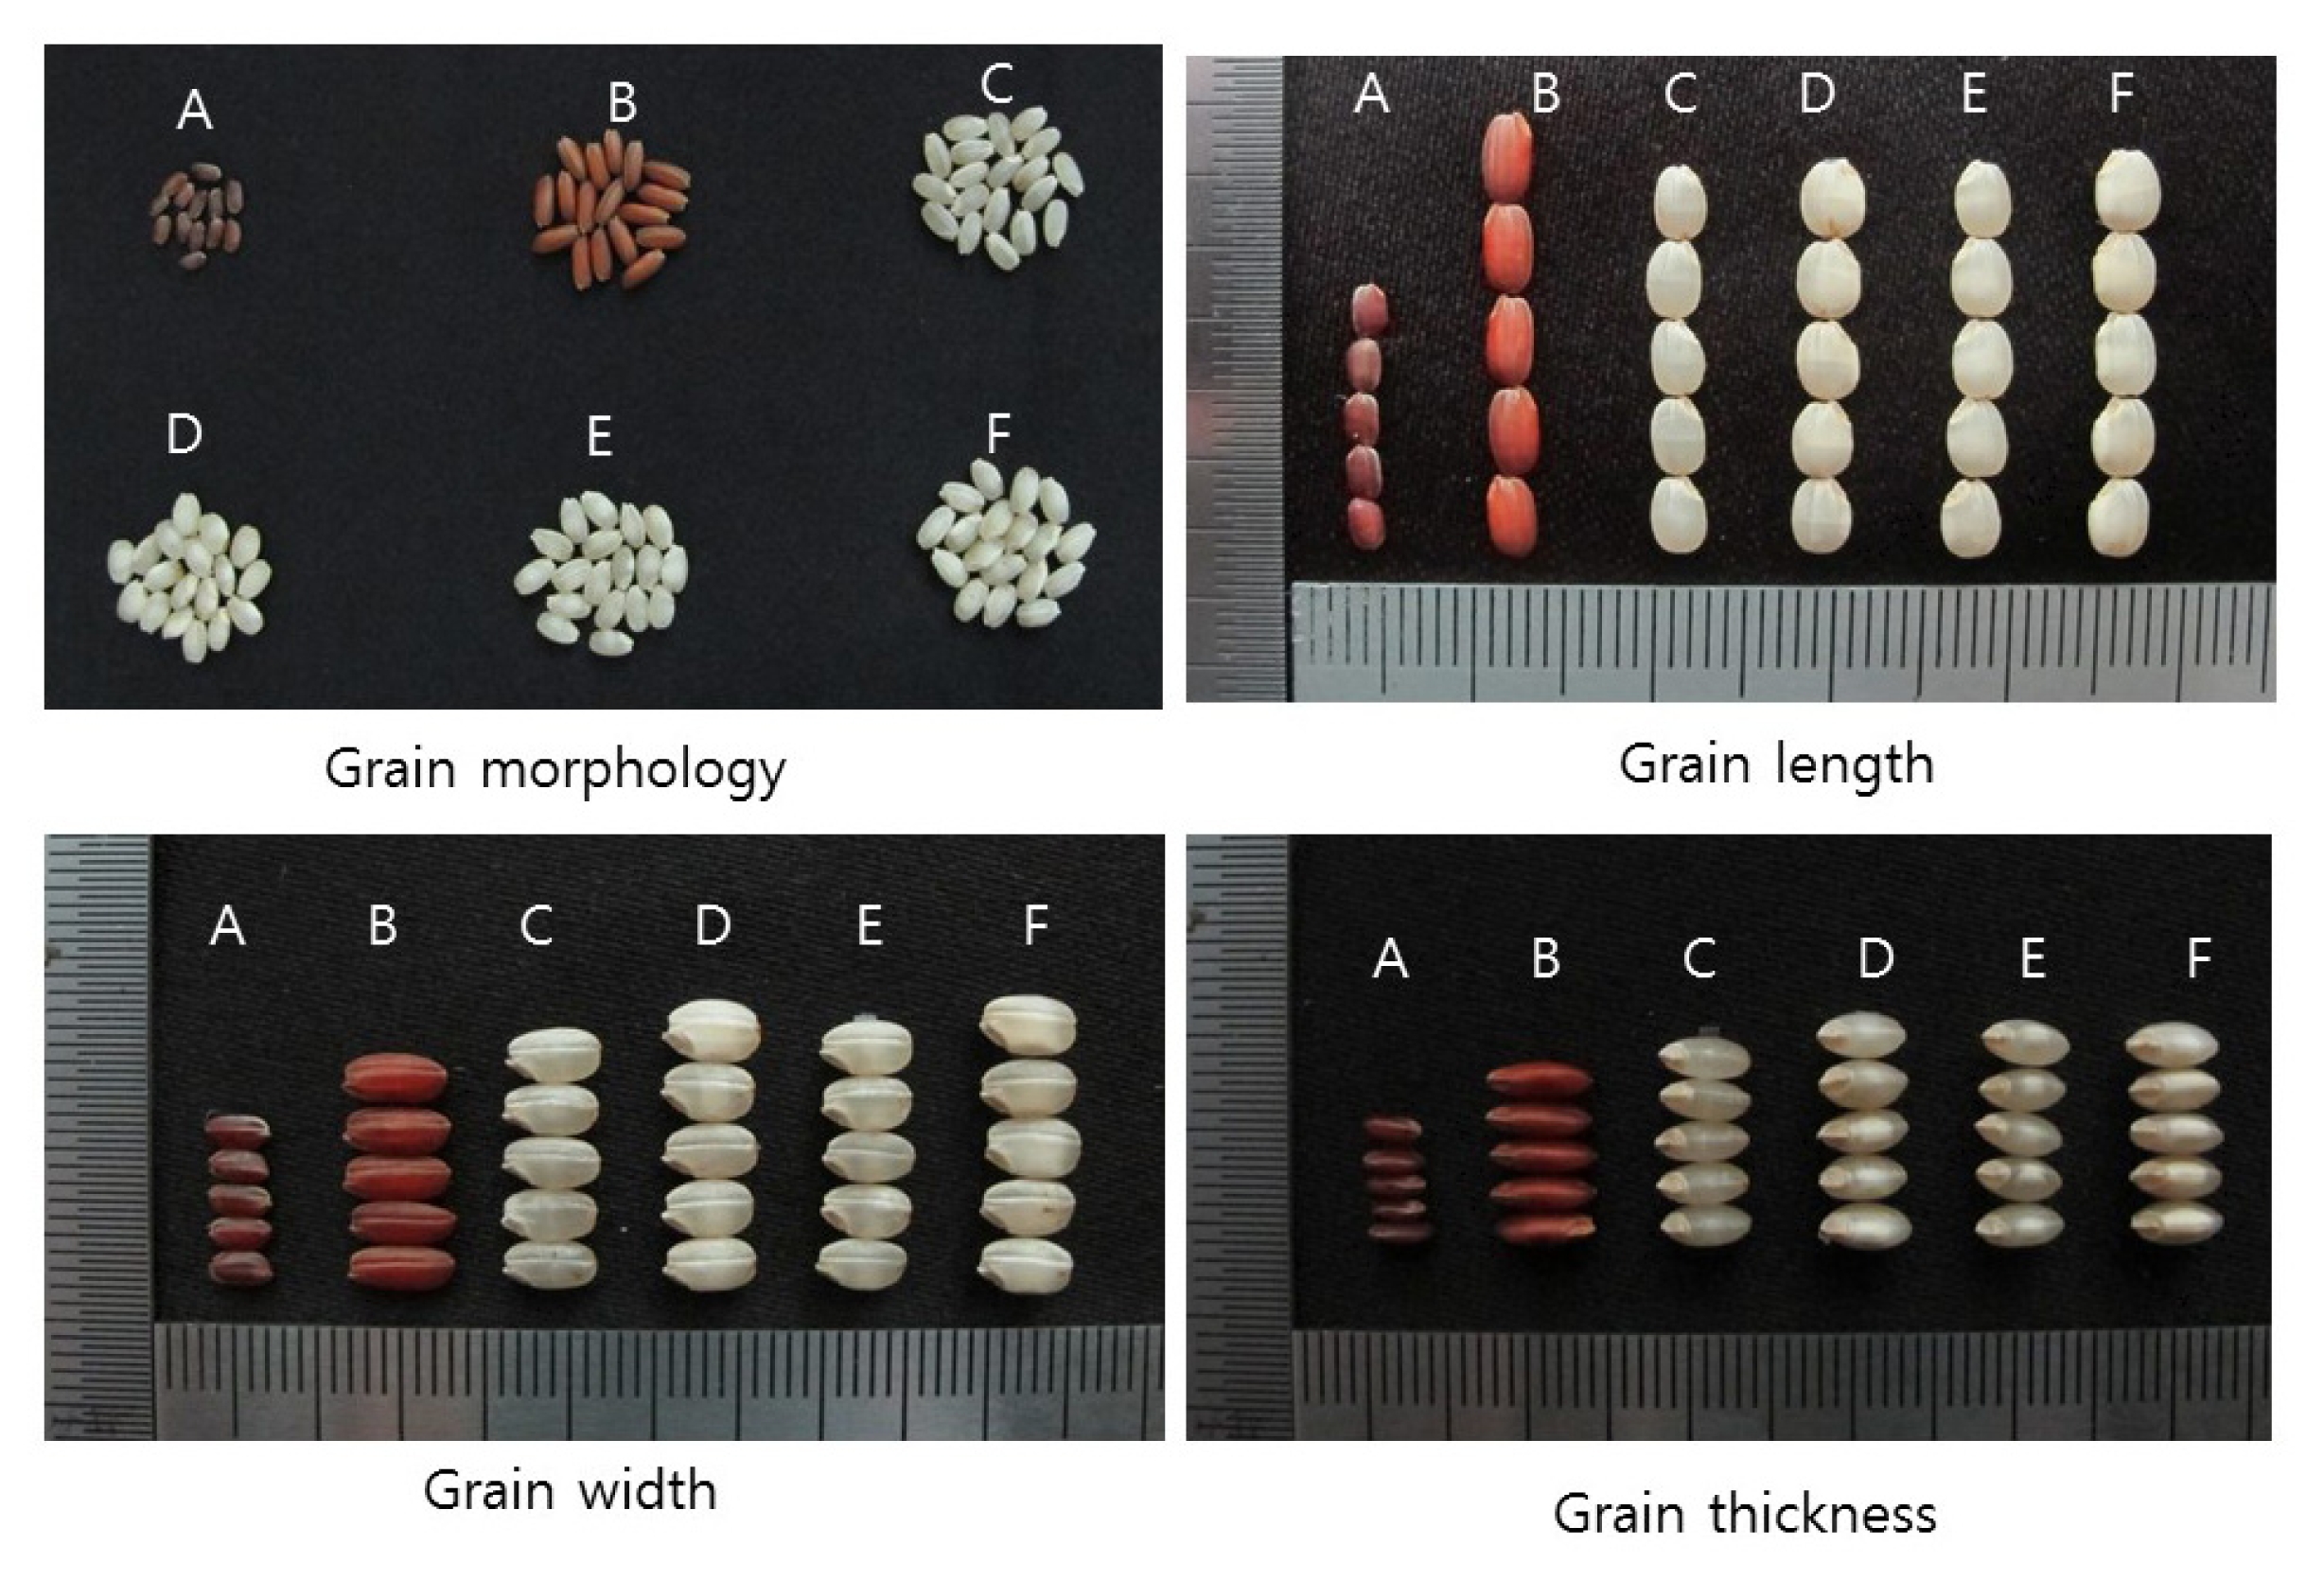
Table 1QTLs detected for grain weight based on one-way ANOVA in the F2 population.
Table 1
|
Cross |
QTL |
Chr. |
SSR marker |
P value |
R2z)
|
Meany)
|
|
|
HH |
HG/HR |
GG/RR |
|
tgw2/gw8.1
|
tgw2
|
2 |
RM 12813 |
<0.0001 |
49.7 |
21.6ax)
|
23.8b |
26.4c |
|
gw8.1
|
8 |
RM 23204 |
0.02 |
9.9 |
21.6a |
22.8ab |
23.6b |
Table 2Comparison of 8 agronomic traits among the four F3 QTL-NILs.
Table 2
|
Line |
Traitz)
|
|
|
DTH |
PH |
PL |
PN |
GL |
GWD |
GTH |
TGW |
|
NIL-1 |
102ay)
|
107a |
20a |
12a |
5.00c |
2.85b |
2.10b |
21.6d |
|
NIL-2 |
101a |
107a |
19a |
10b |
5.19b |
3.24a |
2.30a |
26.4b |
|
NIL-3 |
101a |
109a |
20a |
12a |
5.10b |
2.93b |
2.12b |
23.2c |
|
NIL-4 |
101a |
107a |
20a |
10b |
5.34a |
3.30a |
2.32a |
28.6a |
References
- Causse MA, Fulton TM, Cho YG, Ahn SN, Chunwongse J, Wu K, Xiao J, Yu Z, Ronald PC, Harrington SE, Second G, McCouch SR, Tanksley SD. 1994. Saturated molecular map of the rice genome based on an interspecific backcross population. Genetics. 138(4): 1251-174.
- Cui KH, Peng SB, Xing YZ, Yu SB, Xu CG, Zhang Q. 2003. Molecular dissection of the genetic relationships of source-sink and transport tissue with yield traits in rice. Theor Appl Genet. 106: 649-658.
- Fan C, Xing Y, Mao H, Lu T, Han B, Xu C, Li X, Zhang Q. 2006. GS3, a major QTL for grain length and weight and minor QTL for grain width and thickness in rice, encodes a putative transmembrane protein. Theor Appl Genet. 112: 1164-1171.
- Ishimaru K. 2003. Identification of a locus increasing rice yield and physiological analysis of its function. Plant Physiol. 133: 1083-1090.
- Jin FX, Ji SD, Xie XB, Kang JW, Ju HG, Ahn SN. 2011. Detection of epistatic interaction of two QTLs, gw8.1 and gw9.1, underlying grain weight using nearly isogenic lines. Breeding Sci. 61: 69-75.
- Kang JW, Yang P, Yun YT, Ahn SN. 2011. Mapping grain weight QTL using near isogenic lines from an interspecific cross. Korean J Breeding Sci. 43: 304-310.
- Li J, Xiao J, Grandillo S, Jiang L, Wan Y, Deng Q, Yuan L, McCouch SR. 2004. QTL detection for rice grain quality traits using an interspecific backcross population derived from cultivated Asian (O. sativa L.) and African (O. glaberrima S.) rice. Genome. 47(4): 697-704.
- Li Y, Fan C, Xing Y, et al. 2011. Natural variation in GS5 plays an important role in regulating grain size and yield in rice. Nature genet. 43: 1266-1269.
- Li ZK, Pinson SRM, Park WD, Paterson AH, Stansel JW. 1997. Epistasis for three grain yield components in rice (Oryza sativa L.). Genetics. 145: 453-465.
- Panaud O, Chen X, McCouch SR. 1996. Development of microsatellite markers and characterization of simple sequence length polymorphism (SSLP) in Rice (Oryza sativa L.). Mol Gen Genet. 252: 597-607.
- Shomura A, Izawa T, Ebana K, Ebitani T, Kanegae H, Konishi S, Yano M. 2008. Deletion in a gene associated with grain size increased yields during rice domestication. Nature genet. 40: 1023-1028.
- Song XJ, Huang W, Shi M, Zhu MZ, Lin HX. 2007. A QTL for rice grain width and weight encodes a previously unknown RING-type E3 ubiquitin ligase. Nature genet. 39: 623-630.
- Takeda K. 1991. Rice Genetics II. pp. 181-189. International Rice Research Institute. Manila, The Philippines.
- Wang S, Wu K, Yuan Q, Liu X, Liu Z, Lin X, Zeng R, Zhu H, Dong G, Qian Q, Zhang G, Fu X. 2012. Control of grain size, shape and quality by OsSPL16 in rice. Nature genet. 44: 950-955.
- Weng J, Gu S, Wan X, Gao H, Guo T, Su N, Lei C, Zhang X, Cheng Z, Guo X, Wang J, Zhai H, Wan J. 2008. Isolation and initial characterization of GW5, a major QTL associated with rice grain width and weight. Cell Res. 18: 1199-1209.
- Xie X, Song MH, Jin FX, Ahn SN, Suh JP, Hwang HG, McCouch SR. 2006. Fine mapping of a grain weight quantitative trait locus on rice chromosome 8 using near-isogenic lines derived from a cross between Oryza sativa and Oryza rufipogon. Theor Appl Genet. 113: 885-894.
- Xing Y, Tan Y, Hua J, Sun X, Xu C, Zhang Q. 2002. Characterization of the main effects, epistatic effects and their environmental interactions of QTLs on the genetic basis of yield traits in rice. Theor Appl Genet. 105: 248-257.
- Yamamoto T, Kuboki Y, Lin SY, Sasaki T, Yano M. 1998. Fine mapping of quantitative trait loci Hd-1, Hd-2 and Hd-3, controlling heading date of rice, as single Mendelian factors. Theor Appl Genet. 97: 37-44.
- Yan S, Zou G, Li S, Wang H, Liu H, Zhai G, Guo P, Song H, Yan C, Tao Y. 2011. Seed size is determined by the combinations of the genes controlling different seed characteristics in rice. Theor Appl Genet. 123: 1173-1181.
- Yano M, Sasaki T. 1997. Genetic and molecular dissection of quantitative traits in rice. Plant Mol Biol. 35: 145-153.
- Ying JZ, Gao JP, Shan JX, Zhu MZ, Shi M, Lin HX. 2012. Dissecting the Genetic Basis of Extremely Large Grain Shape in Rice Cultivar ‘JZ1560’. J Genet Genomics. 39: 325-333.
- Yoon DB, Kang KH, Kim HJ, Ju HG, Kwon SJ, Suh JP, Jeong OY, Ahn SN. 2006. Mapping quantitative trait loci for yield components and morphological traits in an advanced backcross population between Oryza grandiglumis and the O. sativa japonica cultivar Hwaseongbyeo. Theor Appl Genet. 112: 1052-1062.
- Yu SB, Li JX, Xu CG, Tan YF, Gao YJ, Li XH, Zhang Q, Saghai Maroof MA. 1997. Importance of epistasis as the genetic basis of the heterosis in an elite rice hybrid. Proc Natl Acad Sci. 94: 9226-9231.
- Zhang Y, Luo L, Liu T, Xu C, Yongzhong X. 2009. Four rice QTL controlling number of spikelets per panicle expressed the characteristics of single Mendelean gene in near isogenic backgrounds. Theor Appl Genet. 118: 1035-1044.


