Abstract
Vicia amurensis is a perennial plant found in Northern China, Japan, and Korea that plays an important role in sustainable agricultural practices due to its ability to fix atmospheric nitrogen in a symbiotic association with rhizobia. 454 sequencing technology was used to sequence the V. amurensis transcriptome which yielded 26.41 Mb from 71,197 reads as a result of 24,959 valid singletons. In addition, 1743 contigs, with the largest contig size being 3534, and 26,702 unigenes were detected. The contig distributions in three non-mutually exclusive Gene Ontology classifications and clusters of orthologous gene classes showed that differentially expressed genes were generally overrepresented in general function and prediction alone (176, 14.47%), and posttranslational modifications, protein turnover, chaperones (162, 13.32%). In total, 12,656 single nucleotide polymorphism (SNP) types were detected; these variants contained 10,585 SNPs, 1513 indels and 558 variants involving more than one nucleotide. The 2383 SNP types with high confidence differences were identified. The present study provides invaluable information on the functional genomic resources and future biological research on V. amurensis. The SNPs identified in this study will provide a material basis for future mapping and marker-assisted breeding analyses.
-
Key words: 454 sequencing, Gene ontology, Single nucleotide polymorphism, Transcriptome, Vicia amurensis
INTRODUCTION
The legume family (Fabaceae) contains more than 650 genera and 18,000 species, and is considered to be the third largest family of higher plants and second only to grasses in terms of agricultural importance (
Young et al. 2003). The temperate and herbaceous genus
Vicia L. is a member of the legume tribe Vicieae of the subfamily Papilionoideae (
Frediani et al. 2004). The genus
Vicia comprises 166 (
Allkin et al. 1986) annual or perennial species distributed mainly in Europe, Asia, and North America, also extending to the temperate regions of South America and tropical Africa (
Maxted 1993;
Jaaska 2005). Some genera such as
Vicia have genome sizes that vary by a factor of 10 or more, which is associated with extensive differences in the abundance of retroelements that account for substantial proportions of these genomes (
Pearce et al. 1996).
Vicia amurensis is one of most commonly grown crops used as green manure, pasture, silage, and hay. It is now extensively cultivated in Korea, Northern China, Japan, and Manchuria. The
V. amurensis chromosome number is 2n = 12 (
Raina and Rees 1983); it is a perennial and flowering plant that is pollinated by insects.
V. amurensis has a symbiotic relationship with certain soil bacteria, which form nodules on the roots and fix atmospheric nitrogen. Some of this nitrogen is utilized by the host plant, although plants growing nearby can also utilize some of this nitrogen (
http://www.aussiegardening.com.au/findplants/plant/Vicia_amurensis).
Legumes provide major benefits to cropping systems and the environment due to their ability to perform symbiotic nitrogen fixation. However, in comparison to cereals, for which a broad range of genetic and genomic resources are available, genomic databases for legumes are generally still underdeveloped. Nevertheless, recent advances in sequencing and genotyping technologies offer the opportunity to rapidly ameliorate the status of a given species at a relatively low cost (
Cannon et al. 2006). Major efforts are currently being directed toward the development of species-specific genomic tools and data sets.
Recent advances in sequencing technology have made it possible to rapidly generate large data sets with significantly reduced time and labor requirements (
Moore et al. 2006;
Wicker et al. 2006)
. These methods offer a cost-effective means to access the gene space of a target organism through in-depth sequencing of the transcriptome. Initial transcriptome sequencing studies were largely exploratory and failed to exploit the potential for next-generation transcriptome sequencing at different scales (
Wall et al. 2009). However, many reports have recently been published on massively parallel approaches to transcriptome sequencing (
Li et al. 2010;
Schilmiller et al. 2010) that have largely used model organisms with available draft genomes to assist in assembly
. Nonetheless, successful studies have also been performed to generate
de novo transcriptome data assemblies for organisms with no prior genomic resource development (
Parchman et al. 2010)
.
Different molecular markers such as simple sequence repeats (SSRs) and single nucleotide polymorphisms (SNPs) have been developed (
Cheung et al. 2006;
Bouck and Vision 2007). Among the different varieties of molecular genetic markers, SNPs have many advantages due to their abundance, and SNP-based markers can be used to generate very dense genetic maps. Such maps can be used to conduct marker-assisted selection (MAS) programs, construct the specific genotypes required for quantitative genetic studies, and enhance our understanding of genome organization and function (
Rafalski 2002). Additionally, to date, no adequate research reports are available on
V. amurensis species. The present study describes the cDNA sequence generation,
de novo assembly and annotation of transcriptome data obtained from
V. amurensis by using 454 GS FLX Titanium sequencing technology. Transcriptome data annotated and generated unigene set that allows us to identify SNP markers.
MATERIALS AND METHODS
Plant materials
V. amurensis seeds were obtained from the National Agrobiodiversity Center, Rural Development Administration, Republic of Korea. Seeds were germinated and grown in greenhouse. The leaves from single young seedlings were processed to extract RNA. RNA isolation, mRNA purification, cDNA synthesis, size fragmentation by nebulization and adaptor ligation were performed prior to 454 sequencing, as described previously (
Moe et al. 2011).
Library preparation
A single-stranded template DNA library was generated to ensure cDNA quality. The cDNA was fragmented by nebulization using an Agilent 2100 Bioanalyzer (Waldbronn, Germany) with a mean fragment size of ~600 bp. Approximately 1 μg cDNA was used to generate a library for genome sequencing with a FLX Titanium Analyzer (Roche, Mannheim, Germany). The cDNA fragment ends were blunted, and two short adapters were ligated to each end according to standard procedures (
Margulies et al. 2005). The adapters provided priming sequences for amplification and sequencing of the sample library fragments. They also served as a sequencing key, which is a short sequence of four nucleotides used by the system software for base calling. The sequencing key also released the unbound strand of each fragment (with 5-adaptor A) following the repair of any nicks in the double-stranded DNA library. The quality of the single-stranded template DNA fragment library was assessed using the 2100 Bioanalyzer, and the library was quantified, including functional quantification, to determine the optimal amount to use as input for emulsion-based clonal amplification.
Single effective copies of template species from the DNA library were hybridized to DNA capture beads. The immobilized library was then resuspended in an amplification solution, and the mixture was emulsified, followed by PCR amplification. After amplification, the DNA-carrying beads were recovered from the emulsion and enriched. The second strands of the amplification products were melted away, leaving the amplified single-stranded DNA library bound to the beads. The sequencing primer was then annealed to the immobilized amplified DNA templates. After amplification, a single DNA-carrying bead was placed into each well of a PicoTiterPlate (PTP) device. Simultaneous sequencing with multiple samples on a single (four region gasket) was used. The PTP was then inserted into an FLX Genome Titanium Sequencer for pyrosequencing (
Ronaghi 2001;
Elahi and Ronaghi 2004), and sequencing reagents were sequentially flowed over the plate. Information from the PTP wells was captured simultaneously with a camera, and the images were processed in real time by an onboard computer. Multiplex identifiers were used to specifically tag unique samples in the GS FLX Titanium sequencing runs. These were subsequently recognized by the GS FLX data analysis software (v 2.5.3) after the sequencing run to assign an individual sequencing read to the correct sample with high confidence.
Sequence assembly was carried out after sequencing using GS De Novo Assembler software (newbler v 2.5.3) to produce contigs and singletons. Several contig variants called isotigs may exist within a contig due to many sequence particularities, such as splice variants. We counted all isotigs as different individual unigenes. All sequence data were confirmed with references using GS Reference Mapper software (v 2.6.0). The resulting sequences were trimmed using SeqClean (
http://sourceforge.net/projects/seqclean/) and the Lucy program (
http://lucy.sourceforge.net/).
The
de novo sequence assembly was analyzed to identify all contiguous sequences (contigs) and singletons using GS De Novo Assembler software, a tool for processing larger, more complex genomes and transcriptomes. Singletons were trimmed using the SeqClean and Lucy programs. Next, BLAST (
http://www.ncbi.nlm.nih.gov/BLAST/) was used to search the mRNA sequences of all contigs and singletons (i.e., unigenes) against the National Center for Biotechnology Information (NCBI) nonredundant and UniProt databases (
ftp://ftp.ncbi.nih.gov/blast/db), respectively, using an arbitrary expectation value of E
−5. The aim of this procedure was to obtain gene accession numbers and associated annotation information based on sequence similarity. Unigenes were then functionally classified using FunCat (version 2.1) available at the Munich Information Center for Protein Sequences (MIPS) Web site (
http://mips.gsf.de/projects/funcat), to evaluate potential gene functions expressed in
V. amurensis. Gene Ontology (GO) terms were also assigned to the set of unigenes that produced hits with The Arabidopsis Information Resource (TAIR) database using the “Gene Ontology at TAIR” tool. Additionally, a BLASTx search against the 10 TAIR version databases (
http://www.arabidopsis.org/) was performed with an E-value threshold of <10
−5. To annotate the function of the
V. amurensis unigenes more specifically, we performed a cluster of orthologous group (COG) analysis wherein we BLASTed
V. amurensis unigenes against the Cluster of Orthologous Groups (COG) database (cutoff, E
−5).
We aligned the individual reads using the genome sequencer (GS) Reference Mapper software (Roche) to define the SNPs. This software automatically computes the alignment of reads from amplicon-based samples against a reference sequence and detects low frequency (1%) variants. We restricted the conditions so that at least two individual reads aligning to the consensus must have had the variant allele and at least two others must have had the consensus allele in order to define a true polymorphism (
Novaes et al. 2008). High-confidence variations were screened from all kinds using the following criteria: a variation must be demonstrated by three or more non- duplicate reads, and both forward and reverse reads must support the same variation. Five or more reads with a quality score value >20 must be present in both, and the single nucleotide indel must meet most of the reads aligned.
RESULTS
454 sequencing
A summary of 454 sequencing data and the following sequence assembly analyses for Vicia amurensis is presented in
Table 1. The sequencing for
Vicia amurensis yielded 71,197 transcripts reads totaling 26,410,000 bp. Raw data from the 454 sequencing run was submitted to the National Center for Biotechnology Information (NCBI) Short Read Archive (SRA), and can be retrieved as accession SRP043968. The sample reads were assembled separately using the De Novo Assembler (
Table 1). In total, 39,295 sequence reads were fully incorporated into the assembly, resulting in 26,707 singletons, 39,295 assembled contigs, 3738 partially assembled contigs, and 71 repeats. We applied two subsequent cleaning processes to obtain valid singletons. The first cleanup process with SeqClean excluded various contaminants (e.g., adaptor sequence, Poly A tails) and low-quality or low-complexity sequences. Then the prescreened singletons were processed using Lucy to reassure confidence, which resulted in 24,959 valid singletons. In addition, 1743 contigs, with a maximum contig size of 3534, and a N50 contig size of 716 bp, resulted in 26,702 nonredundant sequences or unigenes, respectively (
Table 1).
The consensus sequences were also compared against TAIR and 26,702 unique matches were identified, including 1743 contigs and 24,959 singletons (Supp. Table S1 and S2). All unique matches were annotated and GO terms were assigned. In the biological process, major categories were assigned as unclassified (27%), metabolic process (22%), and response to stimulus (19%), followed by biological regulation (7%), cellular process (7%), establishment of localization (6%), and developmental process (6%) with the E value cutoff of le-5 (
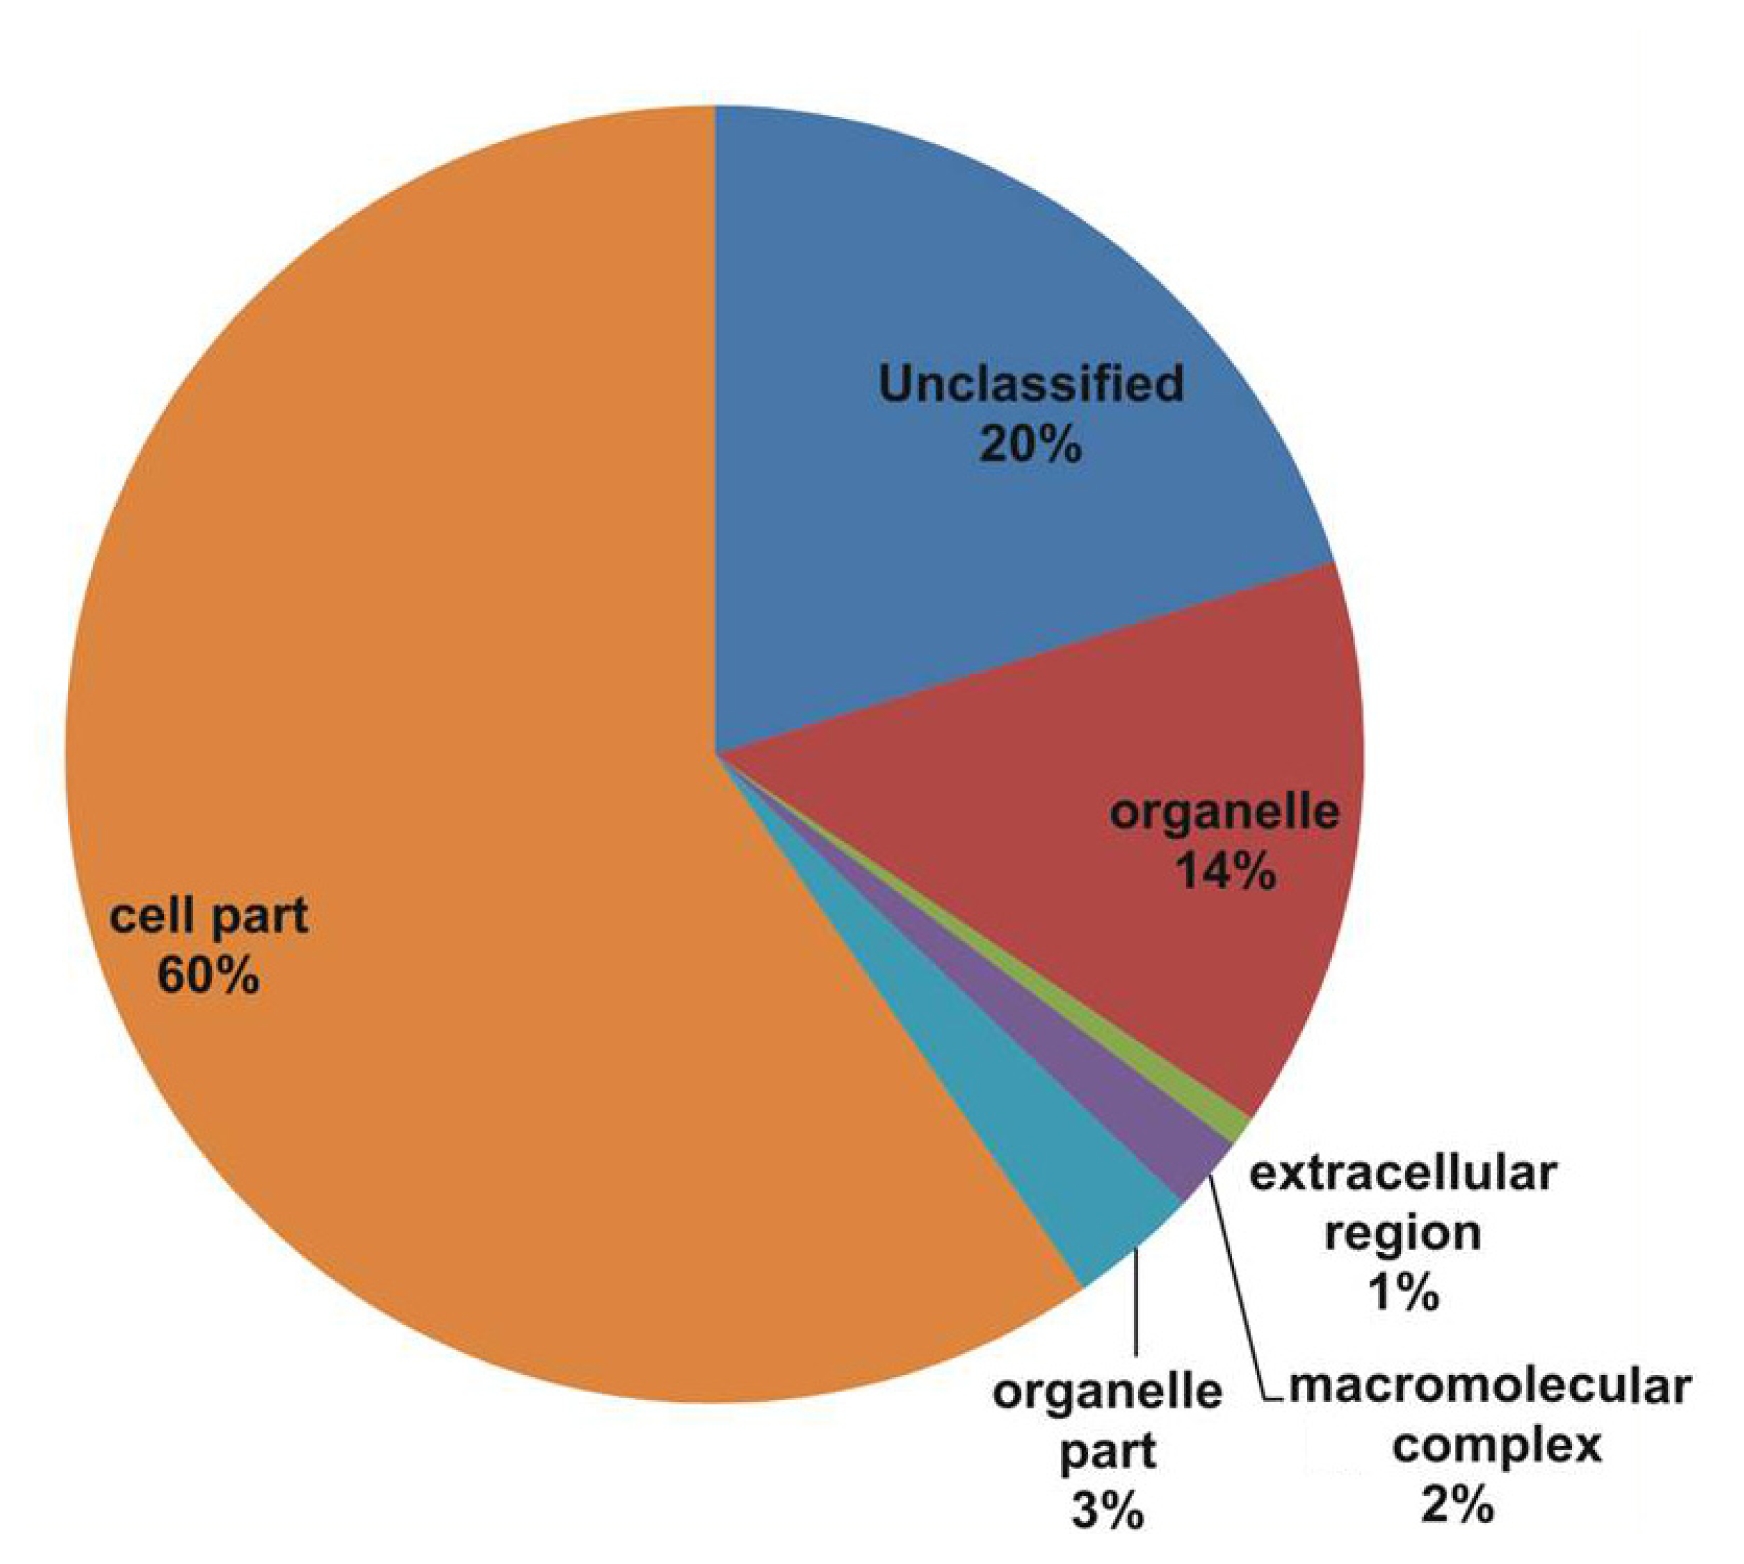
Fig. 1). The cellular component class assigned GO terms, followed by cell part (60%), unclassified (20%), organelle (14%), and other components such as organelle part (3%), macromolecular complex (2%), and extracellular region (1%) categories (
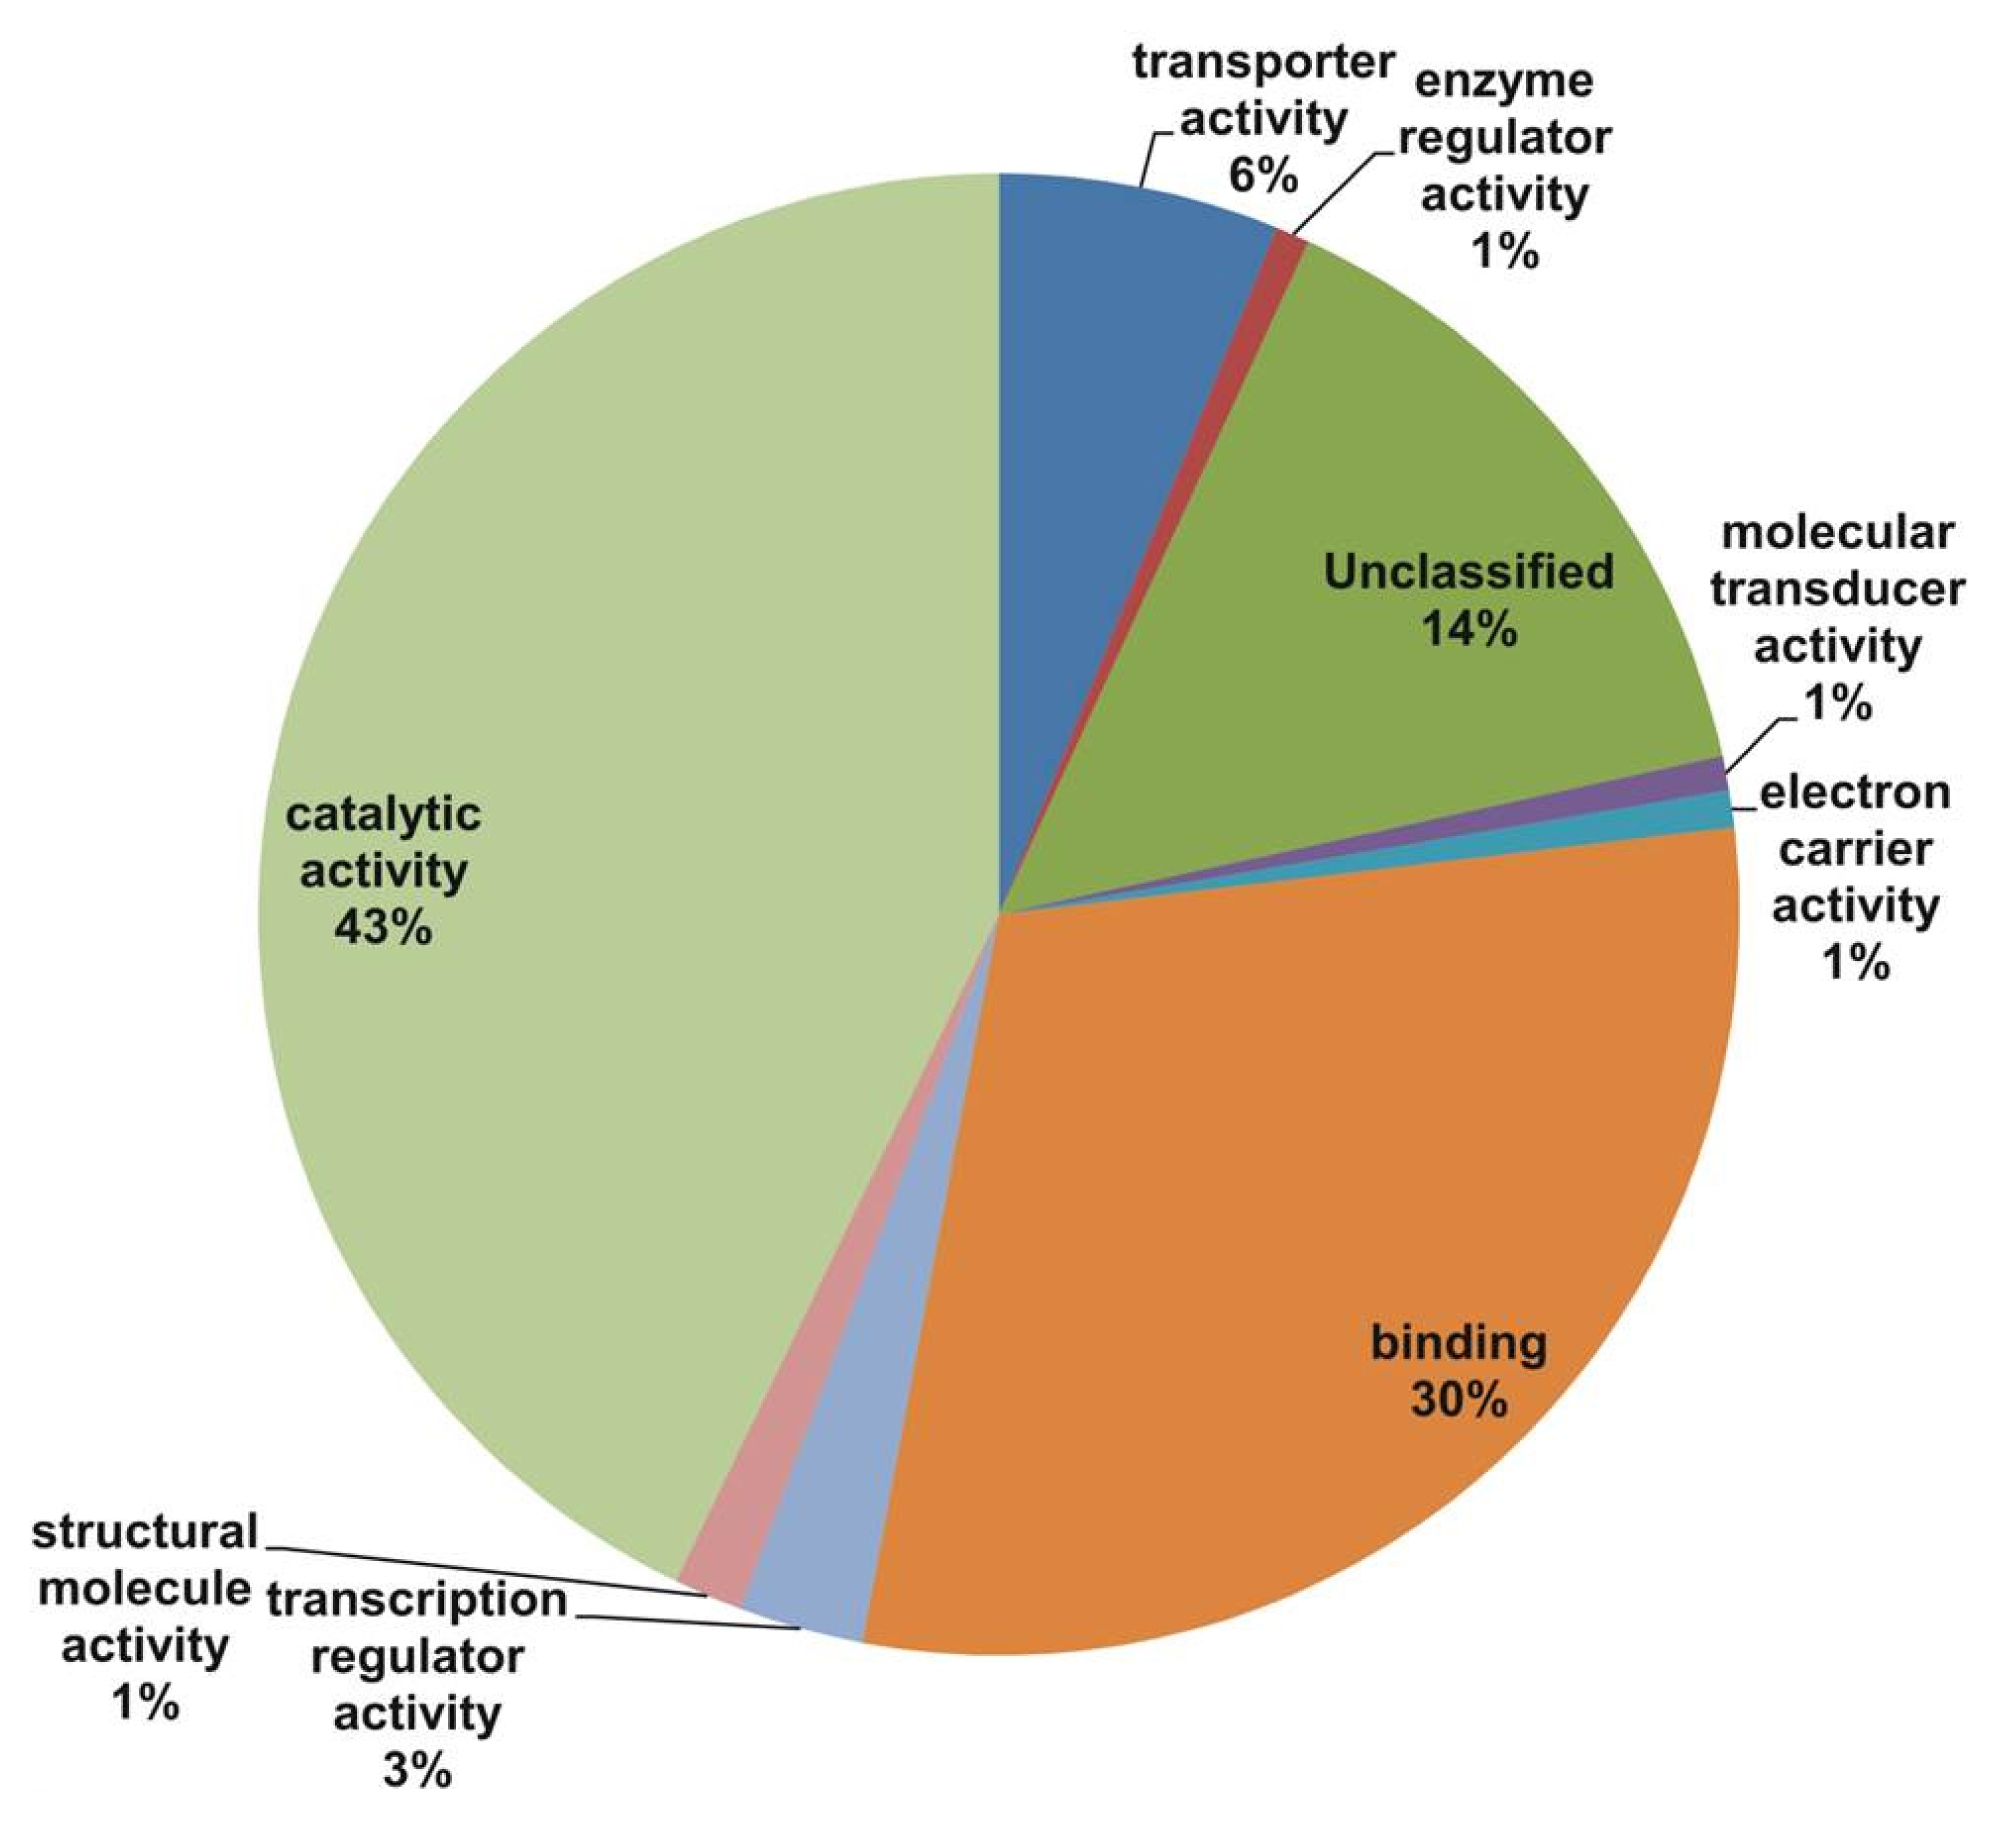
Fig. 2). The main molecular function categories were catalytic activity (43%), binding (30%), and unclassified (14%), while other components such as transporter activity, enzyme regulator activity, molecular transducer activity, electron carrier activity, and structural molecule activity were represented at proportions less than 6% of the total (
Fig. 3). The GO annotations provided comprehensive information on the transcript functions of
V. amurensis (Table S1).
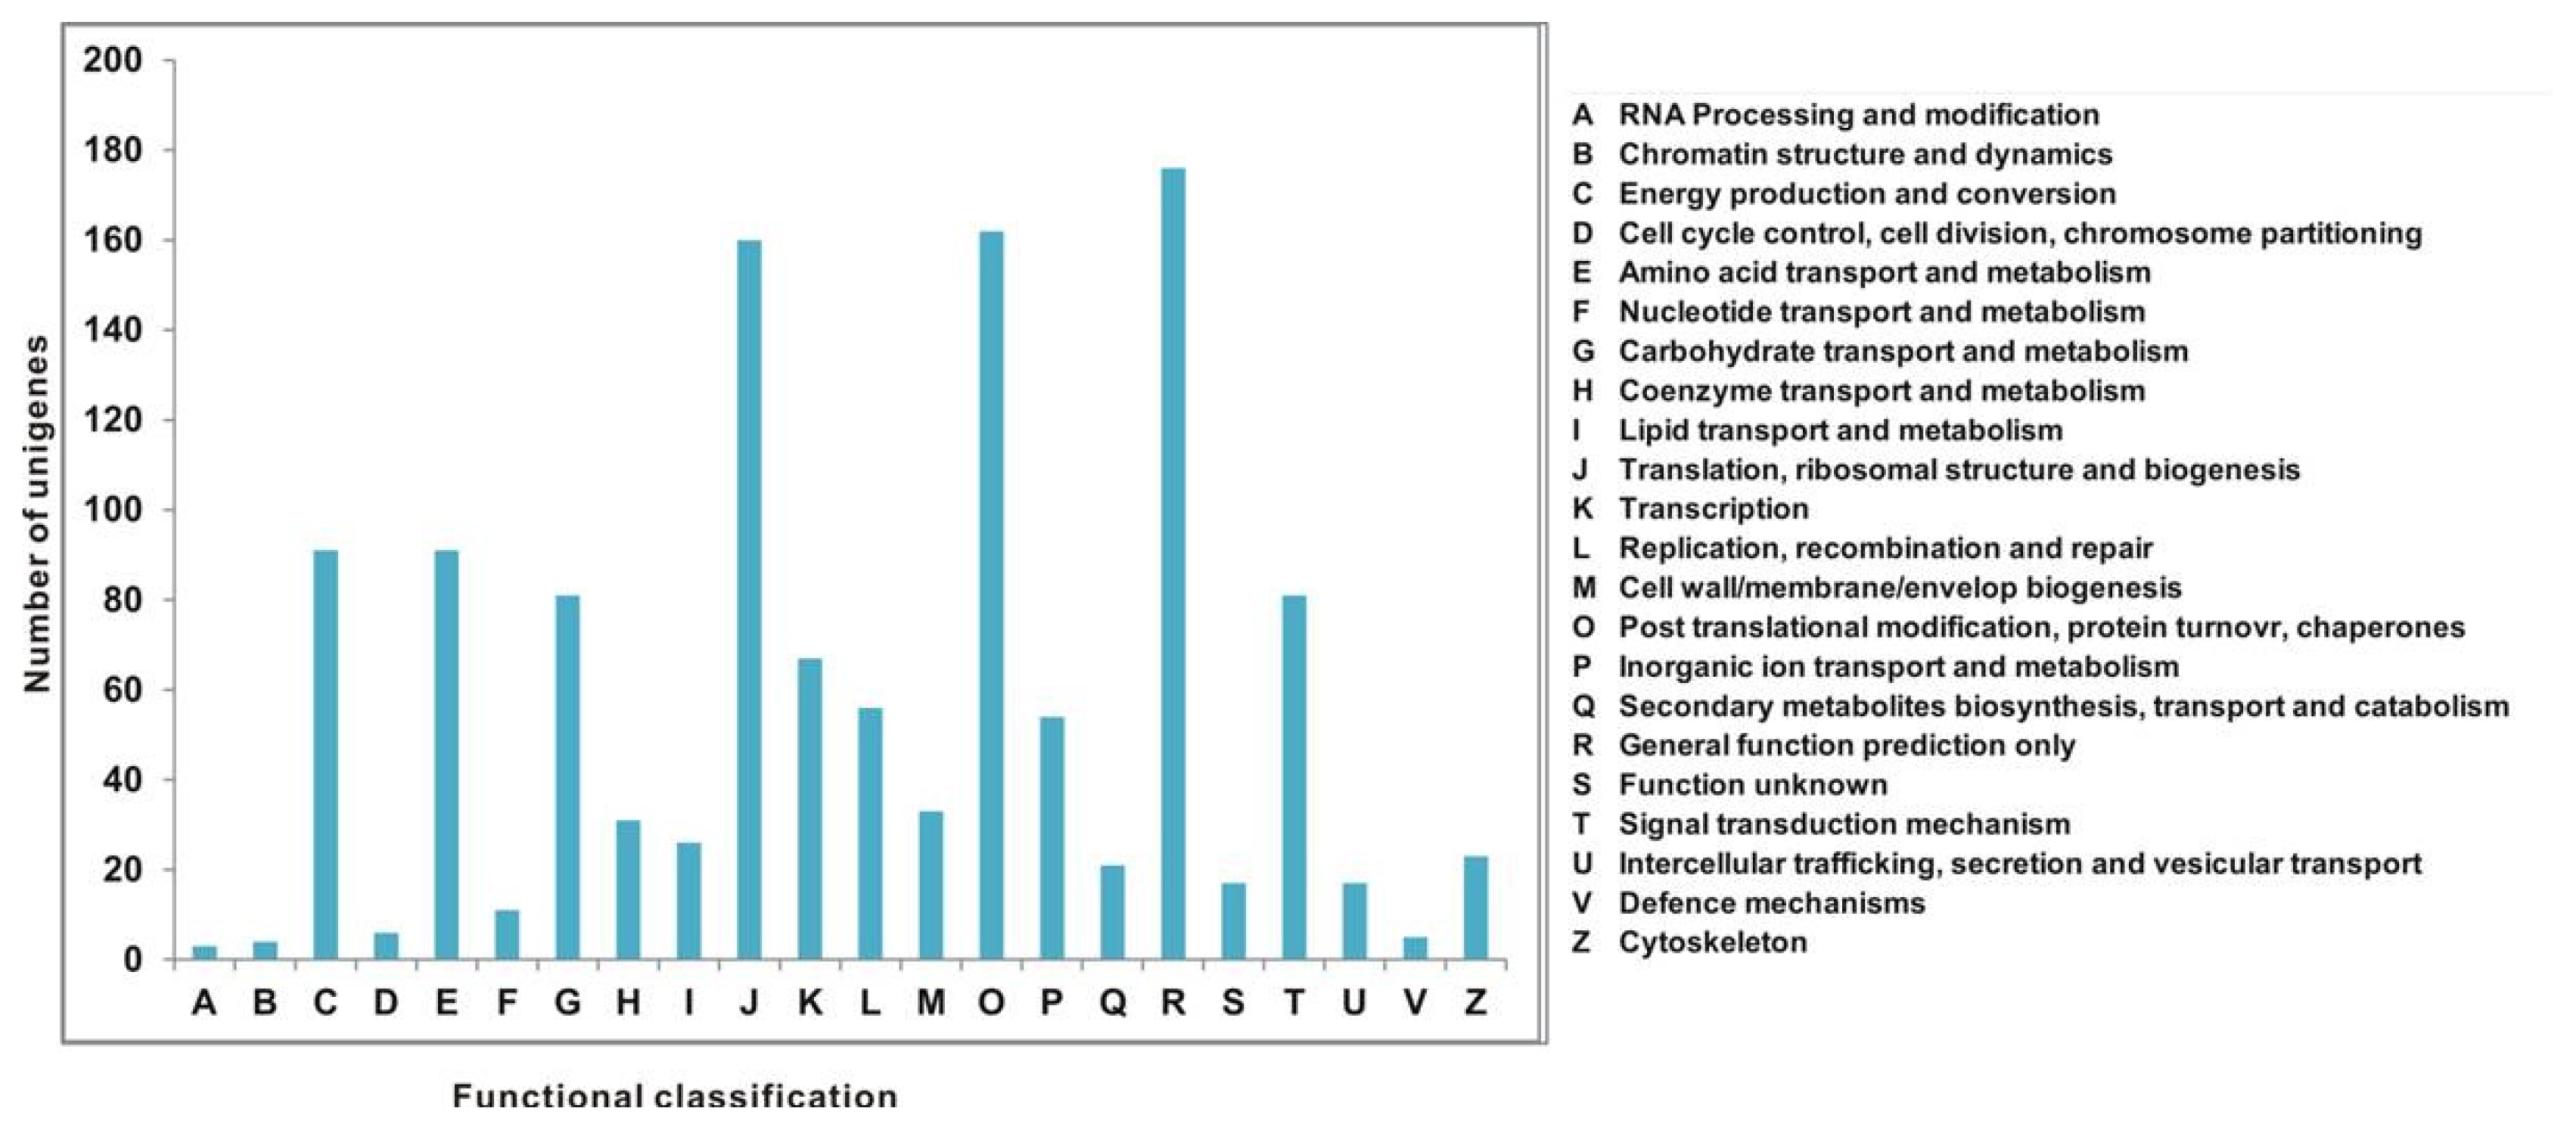
All unigenes were aligned to the COG database to predict and classify possible functions. Out of 7167 Nr hits, 1216 sequences were assigned to the COG classifications (
Fig. 4). Among the 22 COG categories, the cluster for “general function prediction only” (176, 14.47%) represented the largest group followed by “posttranslational modification, protein turnover, and chaperones” (162, 13.32%); “translation, ribosomal structure, and biogenesis” (160, 13.15%); “energy production and conversion” (91, 7.48%); “amino acid transport and metabolism” (91, 7.48%); “carbohydrate transport and metabolism” (81, 6.66%); “signal transduction mechanisms” (91, 7.48%); “transcription” (67, 5.51%); “replication, recombination, and repair” (56, 4.60%); and “inorganic ion transport and metabolism” (54, 4.44%), whereas only a few unigenes were assigned to “cell wall/membrane/envelope biogenesis,” “coenzyme transport and metabolism,” “lipid transport and metabolism,” “cytoskeleton, secondary metabolites biosynthesis,” “transport and catabolism,” “intercellular trafficking, secretion and vesicular transport,” “functions unknown,” “nucleotide transport and metabolism,” “cell cycle control, cell division, chromosome partitioning,” “defense mechanisms,” “chromatin structure and dynamics,” and “RNA processing and modification” (Table S2).
A total of 12,656 putative variants in 24,959 contigs were identified, including 10,585 SNPs, 1513 indels, and 558 multiple nucleotide changes. From the high confidence differences (HCDs), 2383 putative variants were detected and these variants contained 2226 SNPs, 72 indels, and 85 multiple nucleotide changes (
Fig. 5). The highest number detected in A/G was 1783 (14.09%) in all SNP type, followed by 1688 T/C (13.34%), 1611 G/A (12.73%), and 1578 C/T (12.47%), with the remaining SNP types being detected at ≤ 5.33%. The HCDs comprised 408 detected A/G (17.12%) SNP types, followed by 352 C/T (14.77%), 339 G/A (14.23%), and 331 T/C (13.89%), with the rest of the SNP types detected at less than 6.25% (
Fig. 5). Among the detected SNP transitions 4121 (63.66%) were much more common than the transversion manifestation at 2352 (36.33%;
Table 2). Higher rates of transition (almost double) in comparison with the rate of transversions were identified. A set of SNPs could be accurately located with respect to putative initiation and termination codons.
DISCUSSION
The increasing capacity of DNA sequencing technologies has permitted substantial increases in genomic resource availability for several underdeveloped legume crops. Recently, large-scale transcriptome characterization using the GS FLX platform has been performed for the lentil (
Lens culinaris) and pigeonpea (
Cajanus cajan) (
Dutta et al. 2011;
Kaur et al. 2011). This technology can deliver large amounts of data at considerably reduced costs compared to traditional sequencing methods, and so provides an effective means to expedite analysis of less-studied species (
Zeng et al. 2010). In the present study, transcriptome characterization using the GS FLX platform was applied to
V. amurensisr to develop a transcribed sequence database and to identify SNP markers.
We used the 454 technology for transcriptome sequencing in
V. amurensis. A total of 71,197 reads produced 26,702 unigenes with an average length of 680 bp for
V. amurensis. The results from this study are comparable to those observed in other studies on
Pisum sativum, 454 bp (
Franssen et al. 2011);
Pinus contorta, 500 bp (
Parchman et al. 2010);
Lens culinaris, 770 bp (
Kaur et al. 2011);
Ipomoea batatas, 790 bp (
Schafleitner et al. 2010); and
Vigna radiata, 843 bp (
Moe et al. 2011). Our results from the
de novo assembly of singletons (24,959) were obtained in
V. amurensis.
Kaur et al. (2012) reported in their study on transcriptome sequencing
de novo assembly that large numbers of singletons were obtained for
Pisum sativum (86,476),
Vicia faba (79,657), and some other species (
Meyer et al. 2009;
Wang et al. 2009;
Parchman et al. 2010;
Franssen et al. 2011). While some singletons may arise as contaminating sequences or artifacts, the majority probably originate from transcripts expressed at low levels, and consequently retained in the data set. Many singleton sequences exhibited high read quality due to the matching of protein-encoding genes in the existing genic databases, and hence provided valuable sources of information. The remaining singletons may have resulted due to various reasons such as the incompleteness of known databases, sequencing errors, or short read lengths leading to a difficulty in assembly (
Zeng et al. 2010;
Kaur et al. 2011).
In our study, all unique matches were annotated and GO terms were assigned. In the biological process categories not classified, metabolic process and response to stimulus (19%) constituted the major categories. The cellular component classes were most abundantly assigned GO terms, followed by the cell part (60%), unclassified (20%), and organelle (14%) subcategories. The molecular function subcategories catalytic activity (43%), binding (30%), and unclassified (14%) constituted the major subcategories.
Hiremath et al. (2011) reported similar results in
Cicer arietinum with GO results of 20,634 (19.9%) tentative unique sequences (TUSs) assigned to three principal categories: molecular function (10,963 TUSs), biological process (8099 TUSs), and cellular component (6662 TUSs). The highest number of TUSs fell into metabolic process (28.19%), followed by the cell part (47.12%), binding (46.35%), catalytic activity (37.92%), cellular process (27.62%), and organelle (28.17%) subcategories. GO classifications were also used to identify the genes related to stress responses. A large number of TUSs (7.29%) was found under the “response to stimulus” subcategory.
In the present study, all unigenes were assigned COG classifications, which mainly represented cellular processing and signaling (group O), information storage and processing (group J), and the second largest representation subcategory metabolism (groups C, E, G, and P).
Gomes et al. (2012) reported that all identified proteins were distributed across 15 COG functional categories; six fit into the category of general prediction (R), one was classified in the category of unknown function (S), and only one was assigned as “not in COG” (
Table 1). Among the differentially expressed proteins, 25 were related to metabolic functions, the majority of them associated with amino acid transport and metabolism (group E;
Table 1), corroborating the proteomic reference map of
Bradyrhizobium japonicum strain CPAC 15, a microsymbiont of soybean (
Batista et al. 2010).
In the present study, 15,039 SNPs were identified, representing 12,656 SNPs and 2383 HCDs that were detected (
Fig. 5). Among the detected SNPs, we found transition nucleotide substitutions with 4121 among the transition the A-G 2191 and C-T 1930, and in total, 2352 transversions were identified, within transversions A-T 849, G-T 513, C-G 430, and A-C 558. Our results indicated that transitions were more numerous than transversions in terms of nucleotide substitutions.
Gaur et al. (2012) conducted a similar study on chickpea and identified 1022 SNPs that were classified as transitions or transversions based on nucleotide substitutions. Higher rates of transition (almost double) in comparison with the rate of transversions were found, since 650 (63.65%) transitions were found in comparison with 372 (36.4%) transversions. The frequency of transitions and transversions was comparable to that observed in other plant species (
Picoult-Newberg et al. 1999;
McNally et al. 2009;
Nelson et al. 2011). For the deep and redundant coverage produced over many genes, pyrosequencing of cDNA is ideal for SNP discovery and characterization (
Barbazuk et al. 2007;
Vera et al. 2008;
Meyer et al. 2009). In conclusion, we sequenced and characterized the transcriptome of
V. amurensis using an NGS platform. Transcriptome sequencing is important for gene discovery and the identification of large numbers of informative SNPs. This approach provides a cost-effective and efficient method for the optimization of transcriptome assembly. This study will therefore aid in the functional and comparative genomics of
V. amurensis.
ACKNOWLEDGMENTS
This study was carried out with the support of the ‘Research Program for Agricultural Science & Technology Development (Project No. PJ008623)’, National Academy of Agricultural Science, RDA, Republic of Korea.
Fig. 1Gene Ontology (GO) annotation results from V. amurensis consensus sequences in the biological process category.
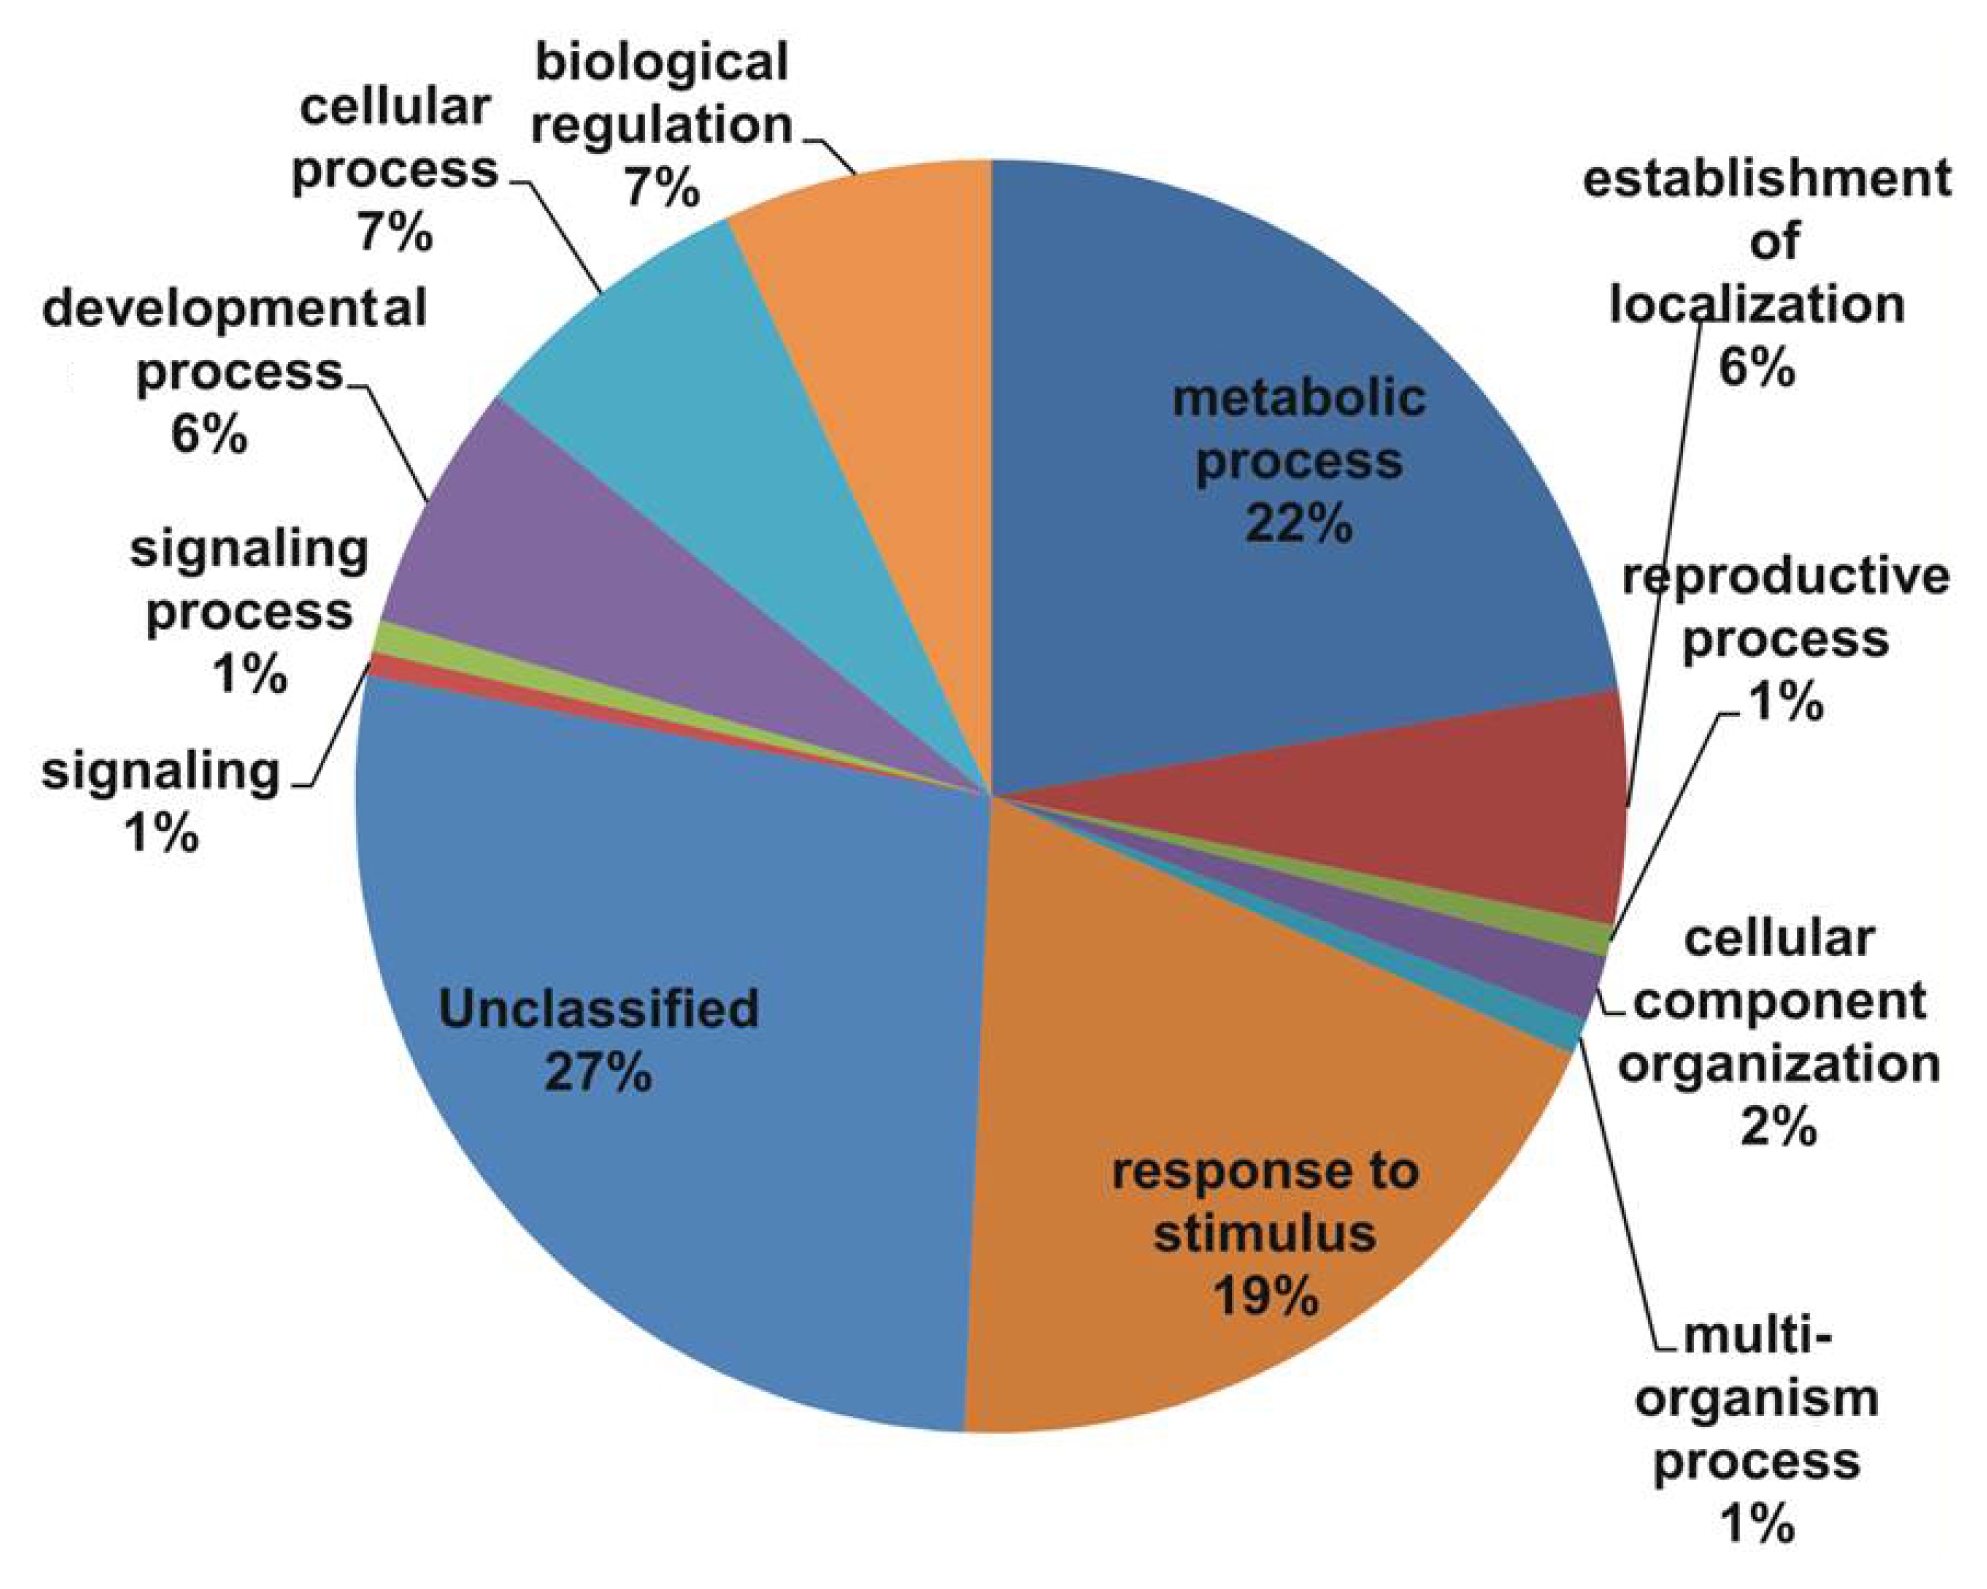
Fig. 2Gene Ontology (GO) annotation results from the V. amurensis consensus sequences in the cellular processes category.

Fig. 3Gene Ontology (GO) annotation results from the V. amurensis consensus sequences in the molecular processes category.

Fig. 4Cluster of orthologous groups (COG) classifications assigned to 22 COG classifications.

Fig. 5Graphic representation of all variation types and high confidence variation types of single nucleotide polymorphisms (SNPs).
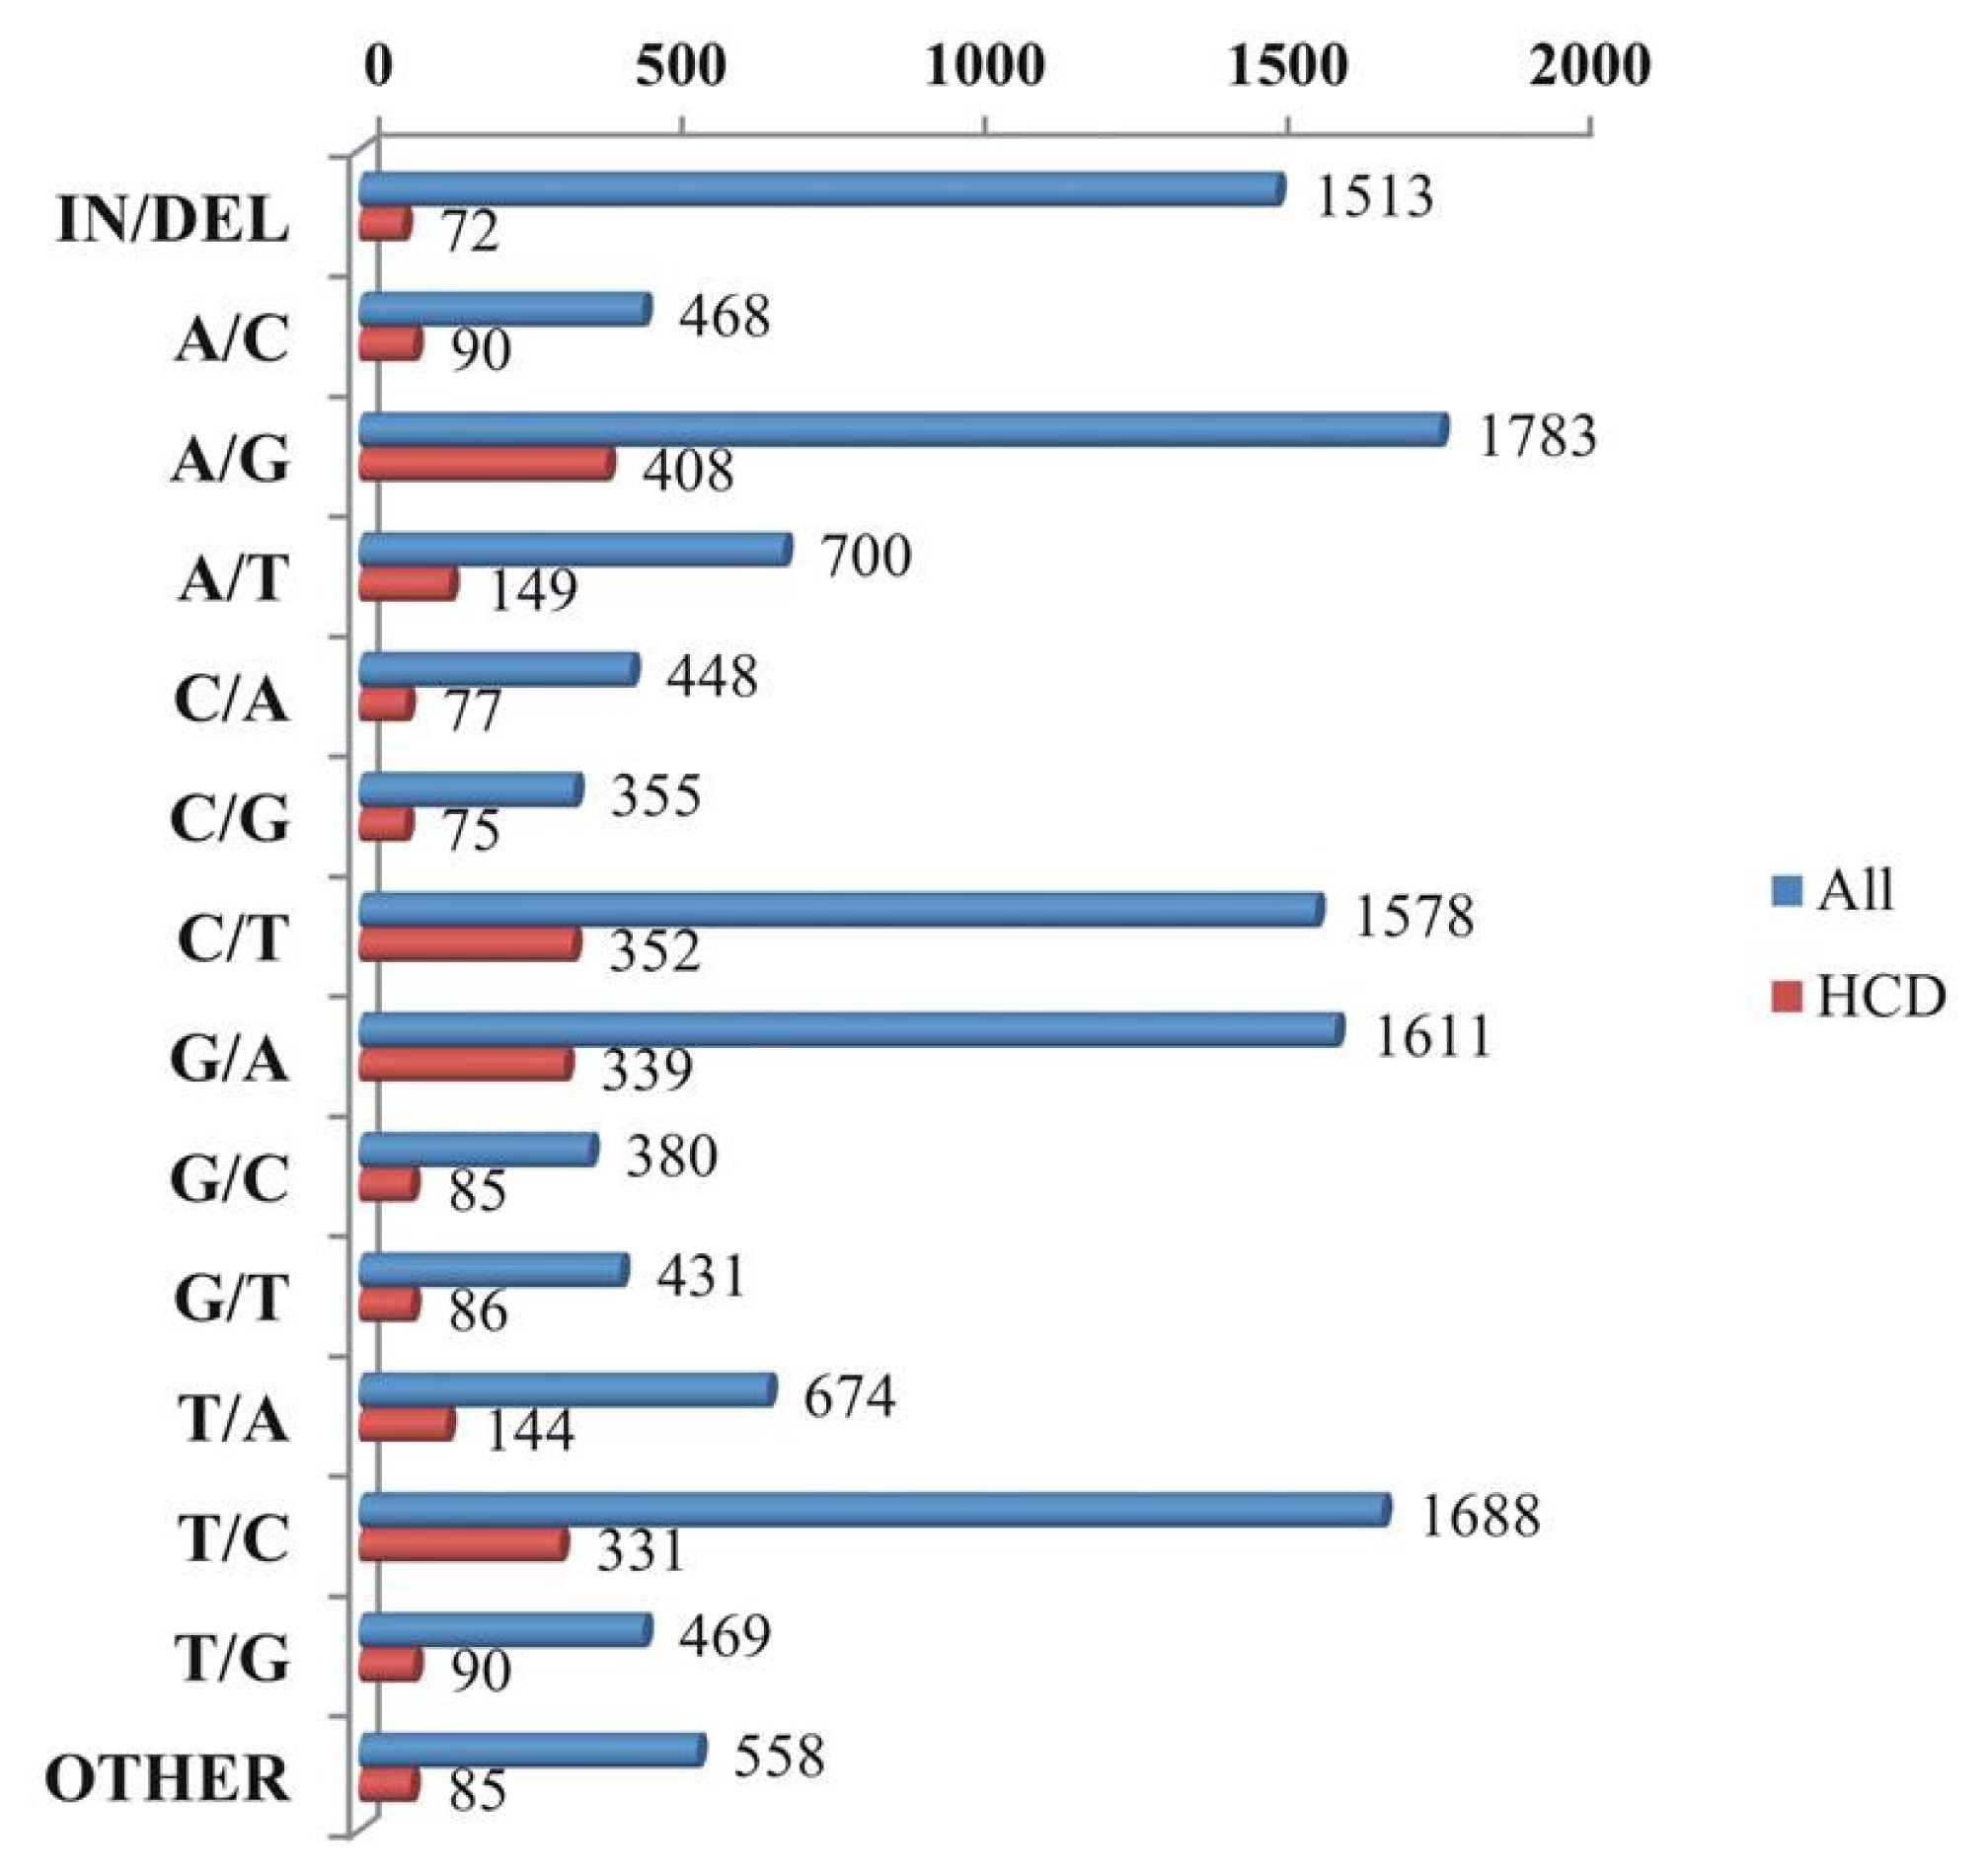
Table 1Summary of 454 sequencing and assembly for Vicia amurensis transcriptomes
Table 1
|
Sample |
Large contig (length ≥ 100 bp)
|
Singletons after sequence cleanings (SeqClean, Lucy) |
Total valid unigenes (isotigsc + singletons) |
|
Contigs |
Bases |
ACZa
|
N50 Contig Sizeb
|
Largest contig size |
|
V. amurensis
|
1743 |
1,186,399 |
680.665 |
716 |
3534 |
24,959 |
26,702 |
|
Sample (V. amurensis) |
Total No. of Reads |
Total No. of Bases |
Assembled |
Partial |
Singleton |
Repeat |
Singletons after SeqClean |
Singletons after Lucy |
|
V. amurensis
|
71,197 |
26,415,815 |
39,295 |
3738 |
26,707 |
71 |
26,087 |
24,959 |
Table 2Single nucleotide polymorphism (SNP) statistics
Table 2
|
SNPs |
Number |
|
Transition |
|
|
A-G |
2191 |
|
C-T |
1930 |
|
Total |
4121 |
|
Transversion |
|
|
A-T |
849 |
|
G-T |
513 |
|
C-G |
430 |
|
A-C |
558 |
|
Total |
2352 |
References
- Allkin R, Goyder DJ, Bisby FA, White RJ. 1986. Names and synonyms of species and subspecies in the Vicieae. Issue 3. Vicieae Database Project. 7: 0263-8517.
- Barbazuk WB, Emrich SJ, Chen HD, Li L, Schnable PS. 2007. SNP discovery via 454 transcriptome sequencing. Plant J. 51: 910-918.
- Batista JSS, Torres AR, Hungria M. 2010. Towards a two- dimensional proteomic reference map of Bradyrhizobium japonicum CPAC 15: spotlighting “hypothetical proteins”. Proteomics. 10: 3176-3189.
- Bouck A, Vision T. 2007. The molecular ecologist’s guide to expressed sequence tags. Mol Ecol. 16: 907-924.
- Cannon SB, Sterck L, Rombauts S, Sato S, Cheung F, Gouzy J, Wang X, Mudge J, Vasdewani J, Schiex T, Spannagl M, Monaghan E, Nicholson C, Humphray SJ, Schoof H, Mayer KFX, Rogers J, Quétier F, Oldroyd GE, Debellé F, Cook DR, Retzel EF, Roe BA, Town CD, Tabata S, Peer YV, Young ND. 2006. Legume genome evolution viewed through the Medicago truncatula and Lotus japonicus genomes. Proc Natl Acad Sci USA. 103: 14959-14964.
- Cheung F, Haas BJ, Goldberg SM, May GD, Xiao Y, Town CD. 2006. Sequencing Medicago truncatula expressed sequenced tags using 454 Life Sciences technology. BMC Genomics. 7: 272
- Dutta S, Kumawat G, Singh BP, Gupta DK, Singh S, Dogra V, Gaikwad K, Sharma TR, Raje RS, Bandhopadhya TK, Datta S, Singh MN, Bashasab F, Kulwal P, Wanjari KBK, Varshney R, Cook DR, Singh NK. 2011. Development of genic-SSR markers by deep transcriptome sequencing in pigeonpea [Cajanus cajan (L.) Millspaugh]. BMC Plant Biol. 11: 17
- Elahi E, Ronaghi M. 2004. Pyrosequencing: a tool for DNA sequencing analysis. Methods Mol Biol. 255: 211-219.
- Ellwood SR, Phan HTT, Jordan M, Hane J, Torres AM, Avila CM, Cruz-Izquierdo S, Oliver RP. 2008. Construction of a comparative genetic map in faba bean (Vicia faba L.); conservation of genome structure with Lens culinaris. BMC Genomics. 9: 380
- Franssen SU, Shrestha RP, Bräutigam A, Bornberg-Bauer E, Weber APM. 2011. Comprehensive transcriptome analysis of the highly complex Pisum sativum genome using next generation sequencing. BMC Genomics. 12: 227
- Frediani M, Maggini F, Gelati MT, Cremonini R. 2004. Repetitive DNA sequences as probes for phylogenetic analysis in Vicia genus. Caryologia. 57: 379-386.
- Gaur R, Azam S, Jeena G, Khan AW, Choudhary S, Jain M, Yadav G, Tyagi AK, Chattopadhyay D, Bhatia S. 2012. High-throughput SNP discovery and genotyping for constructing a saturated linkage map of Chickpea (Cicer arietinum L.). DNA Res. 19: 357-373.
- Gomes DF, Batista JSDS, Schiavon AL, Andrade DS, Hungria M. 2012. Proteomic profiling of Rhizobium tropici PRF 81: identification of conserved and specific responses to heat stress. BMC Microbiol. 12: 84
- Hiremath PJ, Farmer A, Cannon SB, Woodward J, Kudapa H, Tuteja R, Kumar A, Bhanuprakash A, Mulaosmanovic B, Gujaria N, Krishnamurthy L, Gaur PM, Kavikishor PB, Shah T, Srinivasan R, Lohse M, Xiao Y, Town CD, Cook DR, May GD, Varshney RK. 2011. Large-scale transcriptome analysis in chickpea (Cicer arietinum L.), an orphan legume crop of the semi-arid tropics of Asia and Africa. Plant Biotechnol J. 9: 922-931.
- Jaaska V. 2005. Isozyme variation and phylogenetic relationships in Vicia subgenus Cracca (Fabaceae). Ann Bot. 96: 1085-1096.
- Kaur S, Pembleton LW, Cogan NO, Savin KW, Leonforte T, Paull J, Materne M, Forster JW. 2012. Transcriptome sequencing of field pea and faba bean for discovery and validation of SSR genetic markers. BMC Genomics. 13: 104
- Kaur SK, Cogan NOI, Pembleton LW, Shinozuka M, Savin KW, Materne M, Forster JW. 2011. Transcriptome sequencing of lentil based on secondgeneration technology permits large-scale unigene assembly and SSR marker discovery. BMC Genomics. 12: 265
- Li Y, Wu Q, Luo H, Sun Y, Song J, Lui EM, Chen S. 2010. De novo sequencing and analysis of the American ginseng root transcriptome using a GS FLX Titanium platform to discover putative genes involved in ginsenoside biosynthesis. BMC Genomics. 11: 262
- Margulies M, Egholm M, Altman WE, Attiya S, Bader JS, Bemben LA, Berka J, Braverman MS, Chen YJ, Chen Z, Dewell SB, Du L, Fierro JM, Gomes XV, Godwin BC, He W, Helgesen S, Ho CH, Ho CH, Irzyk GP, Jando SC, Alenquer ML, Jarvie TP, Jirage KB, Kim JB, Knight JR, Lanza JR, Leamon JH, Lefkowitz SM, Lei M, Li J, Lohman KL, Lu H, Makhijani VB, McDade KE, McKenna MP, Myers EW, Nickerson E, Nobile JR, Plant R, Puc BP, Ronan MT, Roth GT, Sarkis GJ, Simons JF, Simpson JW, Srinivasan M, Tartaro KR, Tomasz A, Vogt KA, Volkmer GA, Wang SH, Wang Y, Weiner MP, Yu P, Begley RF, Rothberg JM. 2005. Genome sequencing in microfabricated high-density picolitre reactors. Nature. 437: 376-380.
- Maxted N . 1993. A phenetic investigation of Vicia L. subgenus Vicia (Leguminosae-Vicieae). Bot J Linn Soc. 111: 155-182.
- McNally KL, Childs KL, Bohnert R, Davidson RM, Zhao K, Ulat VJ, Zeller G, Clark RM, Hoen DR, Bureau TE, Stokowski R, Ballinger DG, Frazer KA, Cox DR, Padhukasahasram B, Bustamante CD, Weigel D, Mackill DJ, Bruskiewich RM, Rätsch G, Buell CR, Leung H, Leach JE. 2009. Genome wide SNP variation reveals relationships among landraces and modern varieties of rice. Proc Natl Acad Sci USA. 106: 12273-12278.
- Meyer E, Aglyamova GV, Wang S, Buchanan-Carter J, Abrego D, Colbourne JK, Willis BL, Matz MV. 2009. Sequencing and de novo analysis of a coral larval transcriptome using 454 GSFlx. BMC Genomics. 10: 219
- Moe KT, Chung JW, Cho YI, Moon JK, Ku JH, Jung JK, Lee J, Park YJ. 2011. Sequence information on simple sequence repeats and single nucleotide polymorphisms through transcriptome analysis of mungbean. J Integr Plant Biol. 53: 63-73.
- Moore MJ, Dhingra A, Soltis PS, Shaw R, Farmerie WG, Folta KM, Soltis DE. 2006. Rapid and accurate pyroseq-uencing of angiosperm plastid genomes. BMC Plant Biol. 6: 17
- Nelson JC, Wang S, Wu Y, Li X, Antony G, White FF, Yu J. 2011. Single-nucleotide polymorphism discovery by high-throughput sequencing in sorghum. BMC Genomics. 12: 352
- Novaes E, Drost DR, Farmerie WG, Pappas GJ, Grattapaglia D, Sederoff RR, Kirst M. 2008. High-throughput gene and SNP discovery in Eucalyptus grandis, an uncharacterized genome. BMC Genomics. 9: 312
- Parchman TL, Geist KS, Grahnen JA, Benkman CW, Buerkle CA. 2010. Transcriptome sequencing in an ecologically important tree species: assembly, annotation, and marker discovery. BMC Genomics. 11: 180
- Pearce SR, Harrison G, Li D, Heslop-Harrison JS, Kumar A, Flavell AJ. 1996. The Ty1-copia group retrotransposons in Vicia species: copy number, sequence heterogeneity and chromosomal localization. Mol Gen Genet. 250: 305-315.
- Picoult-Newberg L, Ideker TE, Pohl MG, Taylor SL, Donaldson MA, Nickerson DA, Boyce-Jacino M. 1999. Mining SNPs from EST databases. Genome Res. 9: 167-174.
- Rafalski JA. 2002. Novel genetic mapping tools in plants: SNPs and LD-based approaches. Plant Sci. 162: 329-333.
- Raina SN, Rees H. 1983. DNA variation between and within chromosome complements of Vicia species. Heredity. 51: 335-346.
- Ronaghi M. 2001. Pyrosequencing sheds light on DNA sequencing. Genome Res. 11: 3-11.
- Schafleitner R, Tincopa LR, Palomino O, Rossel G, Robles RF, Alagon R, Rivera C, Quispe C, Rojas L, Pacheco JA, Solis J, Cerna D, Kim JY, Hou J, Simon R. 2010. A sweet potato gene index established by de novo assembly of pyrosequencing and Sanger sequences and mining for gene-based microsatellite markers. BMC Genomics. 11: 604
- Schilmiller AL, Miner DP, Larson M, McDowell E, Gang DR, Wilkerson C, Last RL. 2010. Studies of a Biochemical Factory: Tomato Trichome Deep EST Sequencing and Proteomics. Plant Physiol. 153: 1212-23.
- Vera JC, Wheat CW, Fescemyer HW, Frilander MJ, Crawford DL, Hanski I, Marden JH. 2008. Rapid transcriptome characterization for a nonmodel organism using 454 pyrosequencing. Mol Ecol. 17: 1636-1647.
- Wall PK, Leebens-Mack J, Chanderbali AS, Barakat A, Wolcott E, Liang H, Landherr L, Tomsho LP, Yi Hu, Carlson JE, Ma H, Schuster SC, Soltis DE, Soltis PS, Altman N, dePamphilis CW. 2009. Comparison of next generation sequencing technologies for transcriptome characterization. BMC Genomics. 10: 347
- Wang W, Wang Y, Zhang Q, Qi Y, Guo D. 2009. Global characterization of Artemisia annua glandular trichome transcriptome using 454 pyrosequencing. BMC Genomics. 10: 465
- Wicker T, Schlagenhauf E, Graner A, Close TJ, Keller B, Stein N. 2006. 454 sequencing put to the test using the complex genome of barley. BMC Genomics. 7: 275
- Young ND, Mudgeand J, Ellis THN. 2003. Legume genomes: more than peas in a pod. Curr Opin Plant Biol. 6: 199-204.
- Zeng S, Xiao G, Guo J, Fei Z, Xu Y, Roe BA, Wang Y. 2010. Development of a EST dataset and characterization of EST-SSRs in a traditional Chinese medicinal plant, Epimedium sagittatum (Sieb. Et Zucc.) Maxim. BMC Genomics. 11: 94