Abstract
A total of 310 BC2F2 lines derived from the cross of OM5930/N22 were evaluated for heat stress at flowering. Genetic map was set up with 264 polymorphic SSRs to detect linkage to the target traits. The map covers 2,741.63 cM with an average interval of 10.55 cM between two marker loci. Markers associated with heat tolerance were located mostly on chromosomes 3, 4, 6, 8, 10 and 11. The proportion of phenotypic variation explained by each QTL ranged from 17.1% for RM160 to 36.2% for RM3586. Four QTLs were detected for filled grains per panicle on chromosome 4 at the interval of RM468 - RM7076 and RM241 - RM26212, explaining 13.1 and 31.0% of the total phenotypic variation, respectively. Two QTLs controling unfilled grain percentage was also detected at loci RM554 and RM3686 on chromosome 3 explaining 25.0 and 11.2% of the total phenotypic variance. One QTL was detected for 1,000-grain weight located at the locus RM103 on chromosome 6, explaining 30.6% of the total phenotypic variance. Also, a QTL at the locus RM5749 on chromosome 4 was identified which explained 10.8% of the total phenotypic variance of grain yield. A single QTL at the interval of RM3586- RM160 on chromosome 3 was detected in conformity with the QTL findings for heat tolerance in previous studies.
-
Key words: Heat tolerance, Interval mapping (IM), Single marker analysis (SMA), QTL
INTRODUCTION
To overcome the challenges presented by climate change, it is important to understand how crops perceive and respond to high temperatures (
Jung et al. 2012). Heat is a serious problem in many areas in the world (
Wahid et al. 2007). Because of the global ‘greenhouse effect’, heat temperature stress has become increasingly important as a yield-limiting factor, and the increased frequency of short-term but extremely high temperatures is particularly damaging. In the Southern part of Vietnam, particularly in Central Coast, heat stress at flowering stage has become a big problem in recent years.
The most sensitive growth stage of rice to heat stress is flowering time (
Mackill et al. 1982;
Kuang et al. 2002). Heat stress occurring at this stage results in low seed setting rate and loss of grain yield (
Morita et al. 2005;
Peng et al. 2004). A high temperature, 35°C beyond threshold level, at flowering can induce floret sterility and consequently high yield losses (
Osada et al. 1973;
Stake and Yoshida 1978;
Matsushima et al. 1982), with occasionally up to 80% loss (
Li 2003). It has been reported that heat stress significantly reduced anther dehiscence and pollen fertility rate in heat-sensitive varieties, whereas its effects were much smaller in heat tolerant cultivars (
Cao et al. 2008). Moroberekan, the most heat-sensitive genotype showed 18% spikelet fertility at 38°C, while IR64, a moderately heat tolerant and N22, a highly tolerant genotype showed 48 and 71% spikelet fertility, respectively (
Jagadish et al. 2010). This is the main reason why research on the genetic mechanism of heat tolerance is critical for efficient utilization of the genes and for developing new rice varieties with such trait.
In spite of considerable research in the last several years, the genetic basis of tolerance to heat stress in rice is still largely unknown (
Xiao et al. 2011). Molecular mapping efforts on heat tolerance QTLs have been conducted at booting, flowering, and grain filling to ripening stages in rice. A QTL identified to explain the largest phenotype variance for spikelet fertility/seed setting is contributed by IR64 (
Cao et al. 2002). The QTL located in the C1100–R1783 region of chromosome 4 derived from Kasalath reduced 3.31% of the grain weight loss under heat stress. Two more QTLs, one located between R1613–C970 on chromosome 1 and the other between C1226–R1440 on chromosome 7, have 2.38 and 2.92% additive effects, respectively (
Zhu et al. 2005,
2006).
The heat tolerance during flowering stage in rice was controlled by multiple genes. Previously, it was reported that SSR markers RM3735 on chromosome 4 and RM3586 on chromosome 3 showed significant association with heat tolerance which respectively accounted for 17 and 3% of the total variation (
Zhang et al. 2009). Likewise, two major QTLs affecting seed set percentage in the field and growth chamber conditions were detected in the interval between RM5687 and RM471 on chromosome 4, and between RM6132 and RM6100 on chromosome 10 (
Xiao et al. 2011). The QTL located on chromosome 4 explained 21.3% and 25.8% of the total phenotypic variation in SSP, respectively in both conditions. The second QTL located on chromosome 10 explained 11.5% in field and 11.6% in growth chamber of the total phenotypic variation in SSP (
Xiao et al. 2011). Additional QTL associated with heat tolerance during flowering have been recently identified from RIL populations developed from indica/japonica or indica/indica crosses (
Zhang et al. 2008;
Chen et al. 2008). Also, a major dominant locus
OsHTAS on chromosome 9 was detected to confer tolerance to 48°C at seedling stage (
Wei et al. 2013). This locus was mapped on rice chromosome 9 within an interval of 420 kb between markers of InDel5 and RM7364 (
Wei et al. 2013).
Breeding for tolerance to high temperature (>35°C) during the reproductive stage in rice (Oryza sativa L.) is one adaptation strategy for mitigating the negative effects of global warming.
The objective of this study was to identify potential QTLs associated with heat tolerance and related traits in the OM5930/N22 BC2F2 population and identify markers that could potentially be applied in the molecular marker-aided breeding for heat tolerance in rice under Southern Vietnam conditions.
MATERIALS AND METHODS
Plant materials
According to the result by
Zhang et al. (2009), markers RM3586 linked to major QTL on chromosome 3 and RM3735 on chromosome 4 were used to develop BC
1 and BC
2 via marker-assisted backcrossing of OM5930/N22. Three hundred-ten lines at BC
2F
2 generation were used for QTL mapping. The BC lines evaluated for heat stress at flowering stage (HFS), unfilled grains/panicle, 1,000 grain weight and grain yield were genotyped using SSR markers. The indica genotypes, OM5939 (high yielding, susceptible to heat) and N22 (heat tolerance under phytotron treatments) were used as parents (
Buu et al. 2012).
The 310 BC2F2 plants and their parents were planted during dry season in 2012 at the experimental field in Cuu Long Delta Rice Research Institute (CLRRI) for evaluation of heat tolerance during the reproductive period. To ensure the lines head at the same time all were exposed to the same high temperature stress (HTS) conditions at heading. Daily temperature average was automatically monitored via meteorological tool in the rice field.
Heat tolerance (HT) scoring under field condition was based on percentage of unfilled grains as follows: 0 (0–10%), 1 (10–15%), 3 (15–20%), 5 (20–25%), 7 (25–30%) and 9 (>30%).
DNA extraction
Genomic DNA were extracted using CTAB method as described in
Lang (2002). The young leaf was ground using a polished glass rod in well of a Spot Test plate (Thomas Scientific) after adding 400 μl of extraction buffer (50 mM tris-HCl pH 8.0, 25 mM EDTA, 300mM NaCl and 1% SDS). Additional 400 μl of the extraction buffer was added and mixed into the well by pipetting. Thereafter, 400 μl of lysate was transferred to the original tube of leaf sample. The aqueous supernatant was transferred to a new 1.5 ml tube and DNA was precipitated using absolute ethanol. DNA was then air-dried and resuspended in 50 μl of TE buffer. An aliquot of 1 μl was used for PCR analysis. DNA quality and quantity were spectrophotometrically determined.
PCR amplification was performed in 10 mM Tris-HCl (pH=8.3), 50 mM KCl, 1.5 mM MgCl2, 1 unit of TAKARA Taq, 4 nmole of dNTP, 10 pmole of primer, with 30 ng of genomic DNA per 25 μl using a thermal cycler 9,600 (Perkin-Elmer). The PCR reactions were denatured at 94°C for 4 min, followed by 35 cycles of 94°C for 1 min, 55°C for 1 min and 72°C for 2 min. The final extension was set at 72°C for 5 min. After PCR, 13 μl of loading buffer (98% formamide, 10mm EDTA, 0.025% bromophenol blue, 0.025% xylene cyanol) were added to the total volume of PCR product. The samples were electrophoresed on 3% agarose gel and consequently stained in ethidium bromide and viewed under UV light for band detection.
Construction of linkage map
A linkage map was constructed from 12-linkage groups based on the population via SSR tagging followed by
Zhang et al. (1994),
Chen et al. (1997),
Temnykh et al. (2000). To assign the linked groups to chromosomes, a set of 264 polymorphic SSR markers, with an average loci interval of 10.55 cM were employed. Linkage groups were ordered by using MAPMARKER (
Lander et al. 1987). Groups were then reconfirmed using the “GROUP” with map unit of centiMorgan (cM) via Kosambi function (
Kosambi 1944).
Single-marker QTL analysis using linear regression was employed (
Tanksley 1993). The marker alleles linked to heat were coded 1; and in contrast, a code 0 for conducting regression analysis.
To analyze markers-QTLs association for each trait, single-point (single marker) analysis of QGene version 4.0.2 (
Nelson 1997) was performed. This analysis served as the primary method of detecting association between markers and the target traits. A group of two or more closely linked markers that showed significant association were assumed to identify the same QTL. To determine the precise location of the putative QTLs, interval mapping of the MAPMAKER/EXP version 3.0 (
Paterson et al. 1988;
Lincoln et al. 1992) was conducted. Interval mapping analysis was also used to confirm the results of the single marker analysis. A LOD score of 3.0 was used as the threshold for detecting QTLs location. LOD peaks for significant QTLs were used to position the QTL on the linkage map. Both the gene action (additive effect, free of dominance) and the percent variation attributable to individual QTLs were estimated at the peaks. The proportion of the total phenotypic variation explained by each QTL was calculated as R
2 value. Amount of phenotypic variation explained together by all the putative QTLs was estimated by fitting a multiple QTL model under Mapmaker/QTL program and Windows QTL Cartographer 2.5 for each trait.
RESULTS
Phenotyping
Fig. 1 indicated that from midday to 17:00 pm, temperature varied from 36°C to 44°C at heading to maturing period (pink curve). The heat response observed for parents were 1–3 for N22 (heat tolerant) and 7–9 for OM5930 (susceptible) (
Buu et al. 2012).
Fig. 2 showed continuous distribution of heat tolerance among the BC
2F
2 lines. This brings a good recombination for heat reaction in the population.
Heat tolerance (HT) distribution skewed to donors as 86.6% and to recurrent as 15.3% in BC
2F
2 of OM5930/N22. A score of 9 accounted for 74.8% among the BC
2F
2 segregrants (
Fig. 2). The transgressive segregation facilitated rice breeders in selecting acceptable progenies. And this was exhibited in the case of grain filling properties (
Fig. 3).
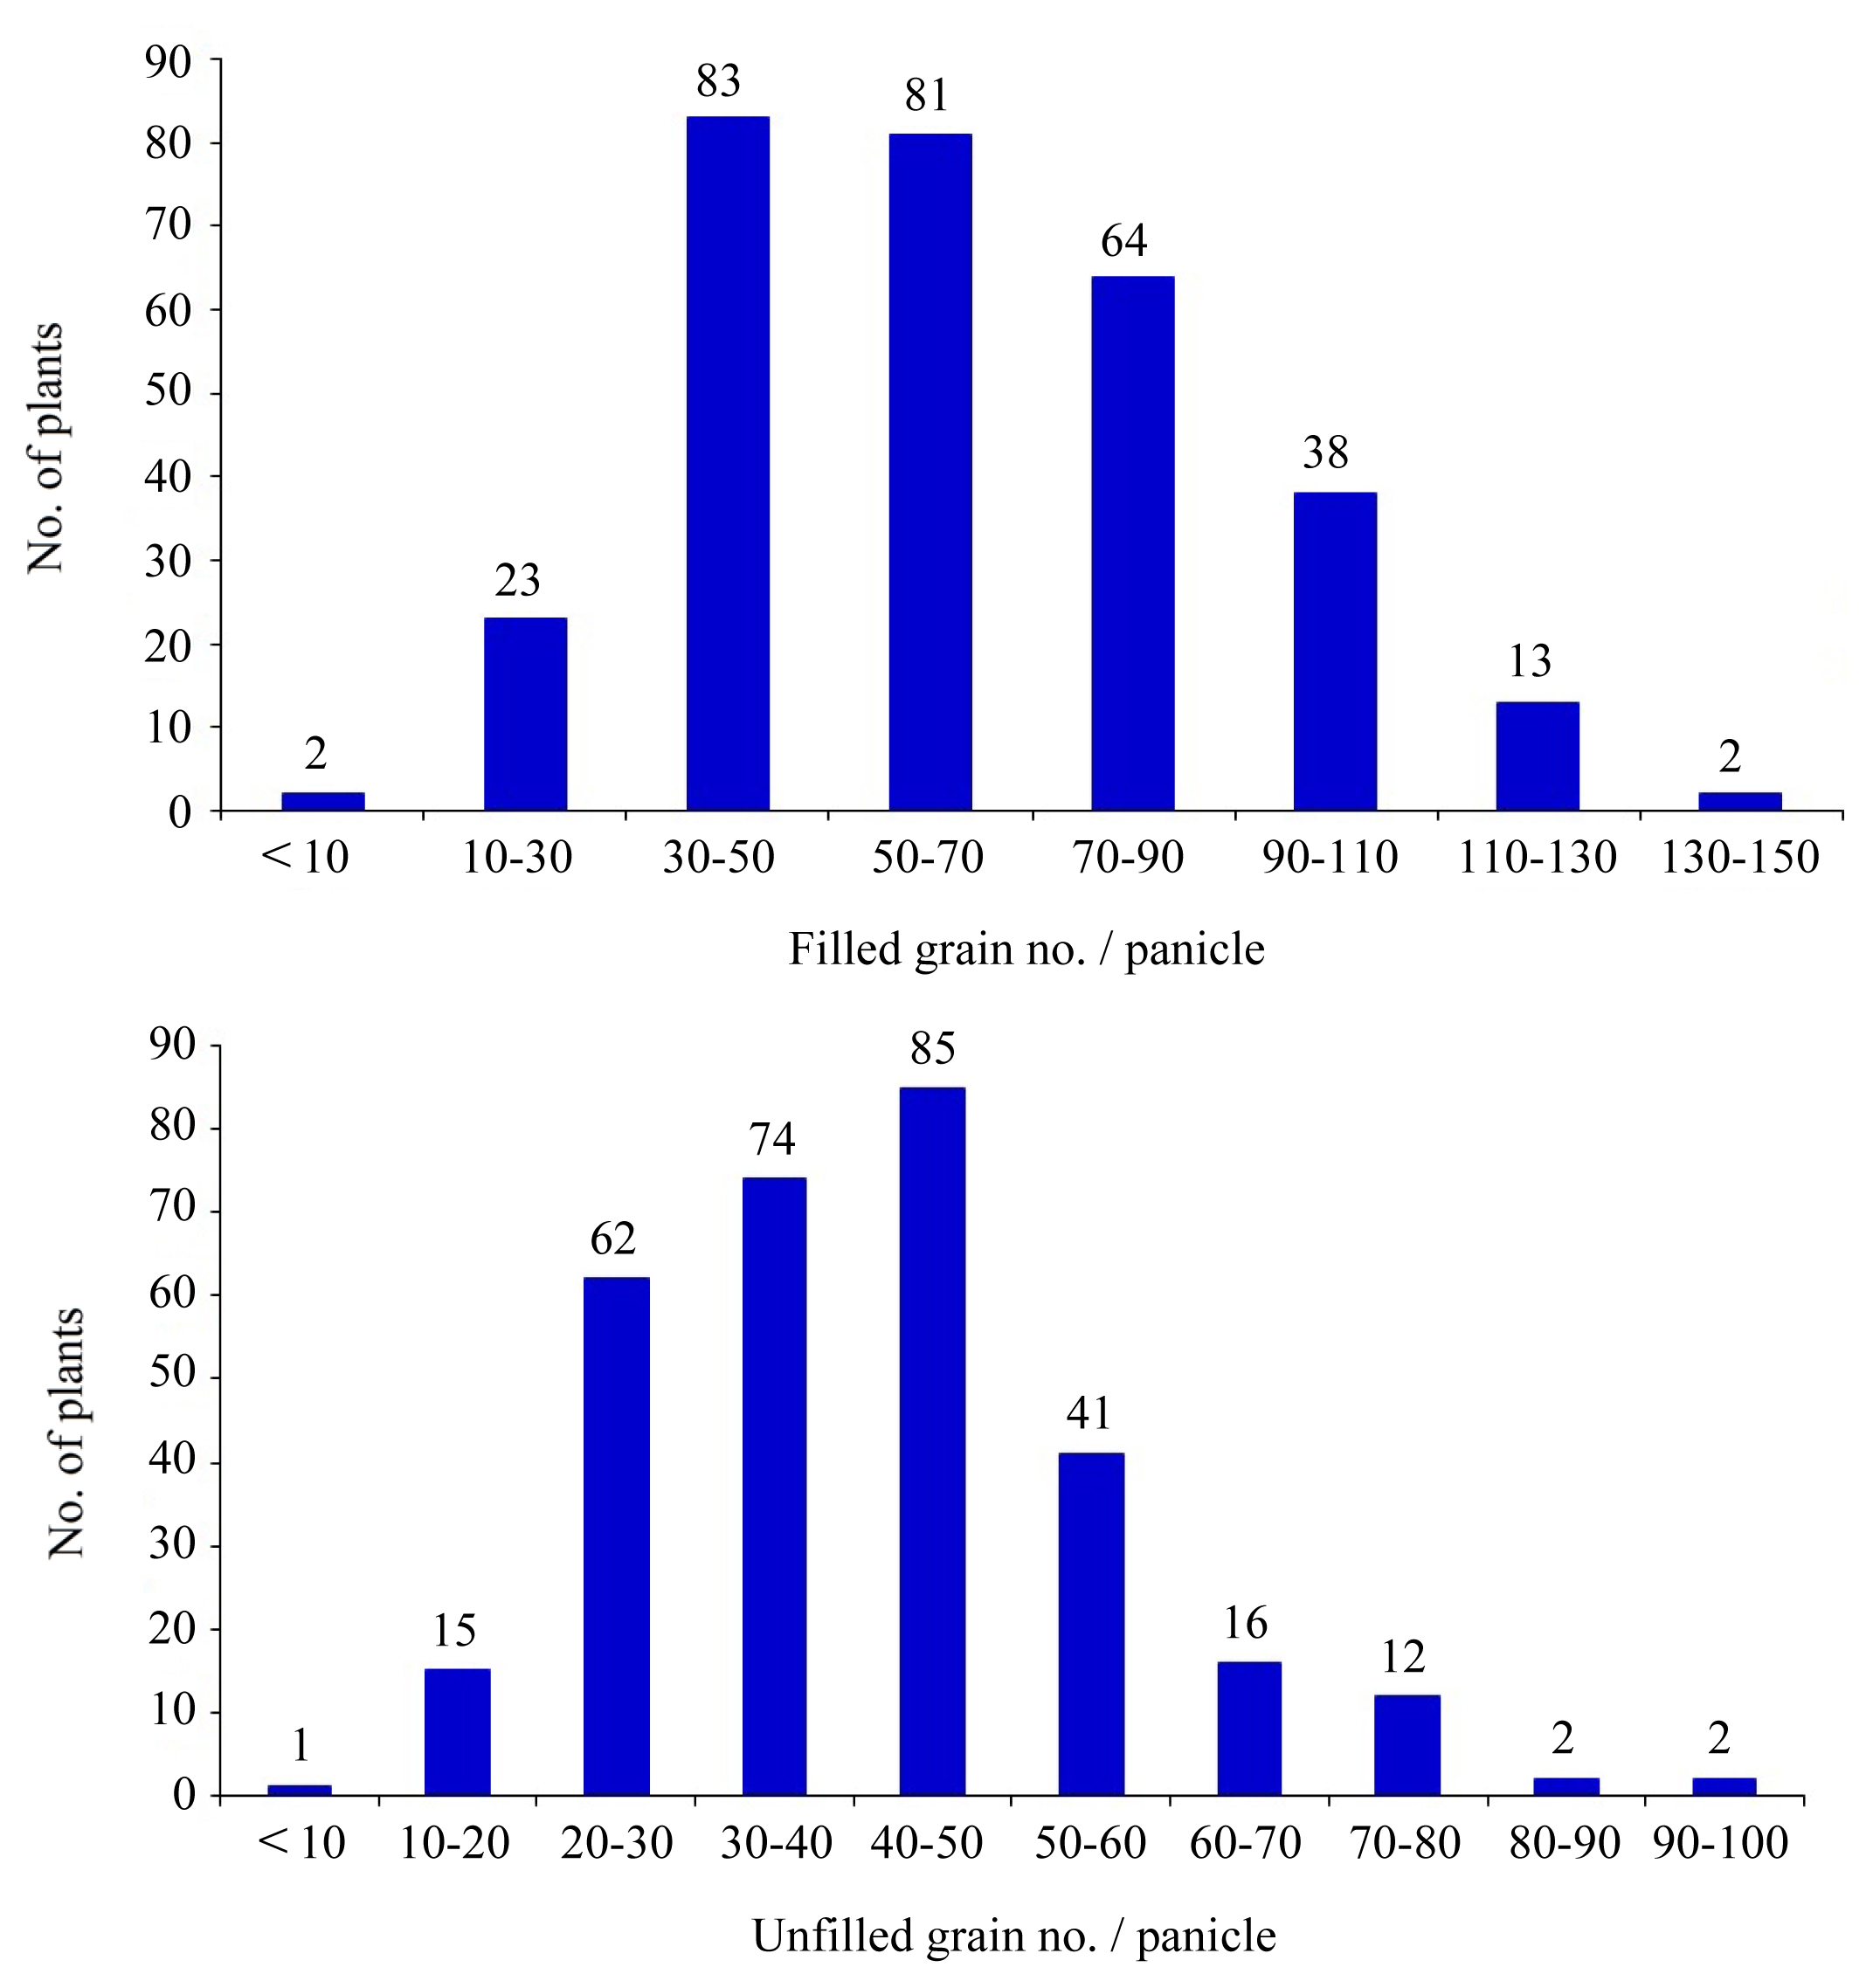
The percentage of filled grains among BC
2F
2 normally distributed with the mean of 72.9%. The low percentage of filled grains may be attributed, at least partially, to a heat activity during grain filling. The percentage of unfilled grains skewed to donor as 5.16%; transgressive progenies accounted for 13.3 %. Heterozygosity was noted at 81.6% (
Fig. 4,
5).
The grain yield of most progenies were significantly higher than both parents. Data show that majority were 13% higher than that of OM5930 and 21% higher than that of N22. This was mainly due to larger sink size such as increased spikelet number per panicle and larger panicle. Grain yield was strongly affected by low fertility percentage under heat condition via unfilled grain percentage. High yielding transgressive progenies accounted for 39.35%, low yielding ones were about 17.74%, while heterozygous progenies were about 56.45%. Selection based on the phenotypes alone will be limited by low advantages of transgressive progenies for given traits (2.0–6.7%).
Genotyping
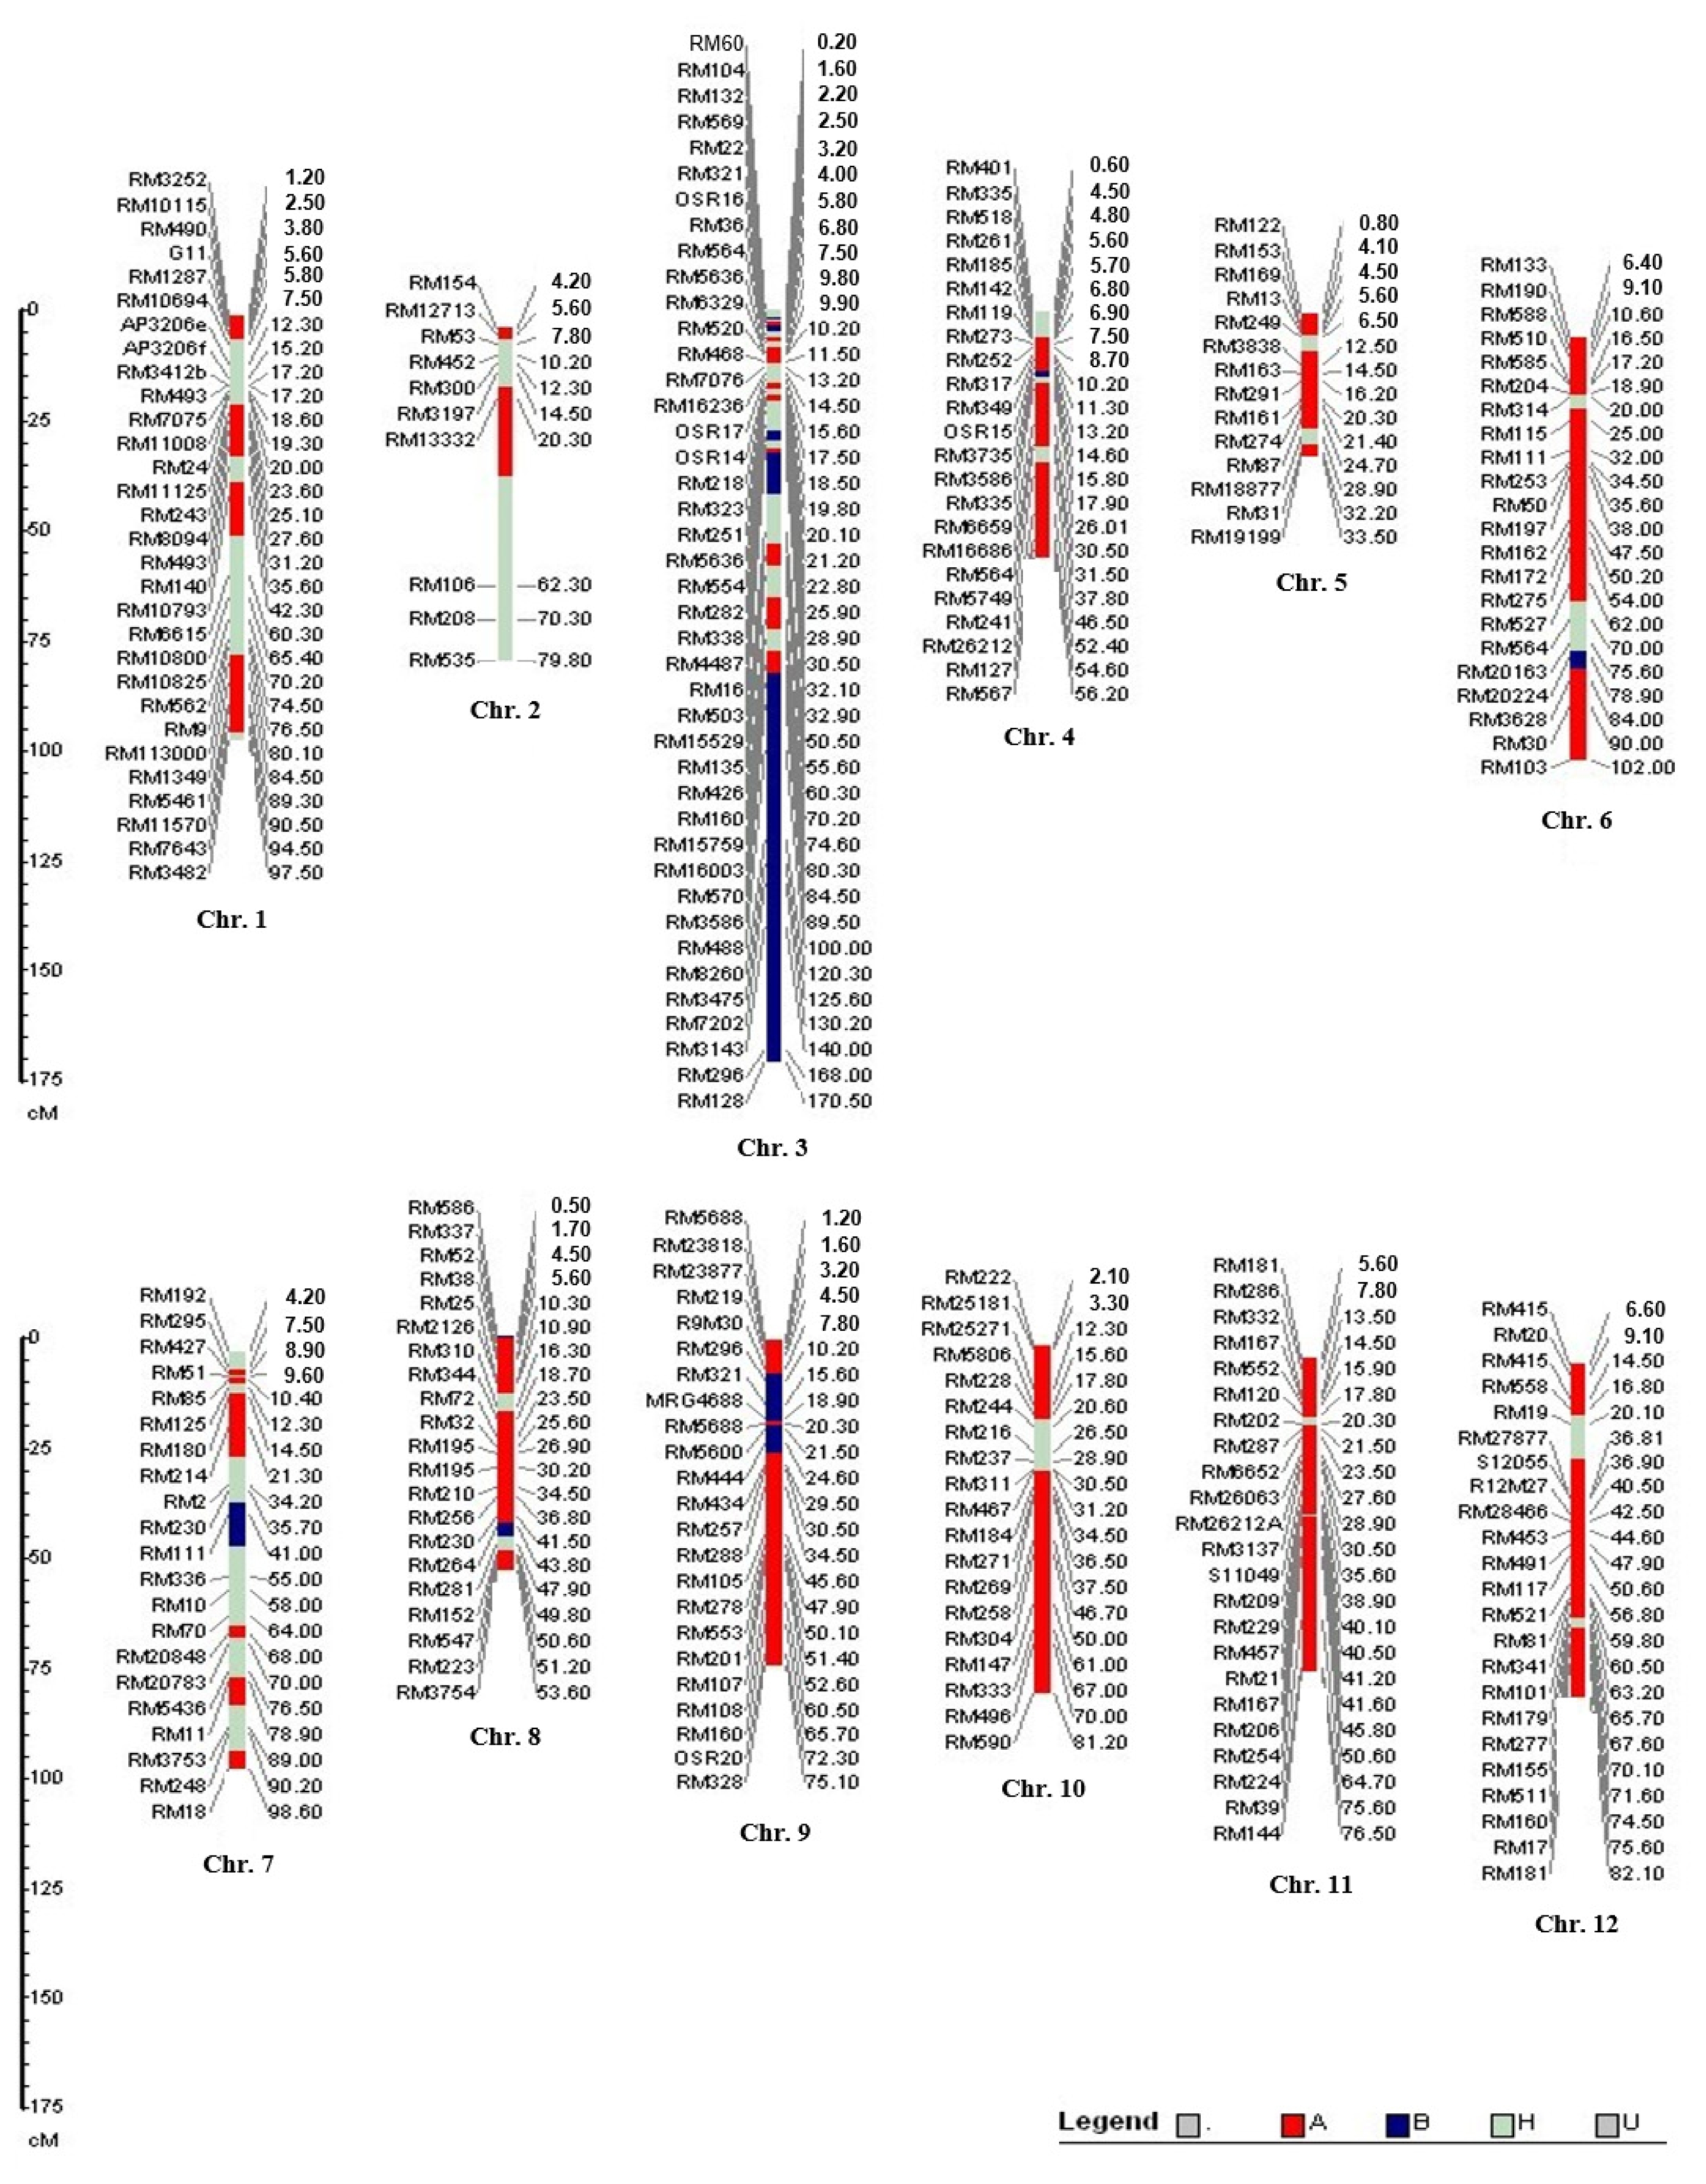
Of the 501 SSRs tested, 264 markers produced polymorphism which showed clear and scorable bands between the two parents. These were subsequently used to genotype the BC
2F
2 population. A linkage map based on BC
2F
2 population was then constructed. It covered a total of 2741.63 cM with an average two loci interval of 10.55 cM (
Table 1). The total phenotypic variation explained by all QTLs was estimated by fitting a multiple regression model in the MAPMARKER/QTL program.
A molecular map was constructed according to published microsatellites from Cornell University. MapMarker version 3.0 software was used to generate microsatellite map for each linked group.
Fig. 6 shows the linkage map for 264 SSR markers employed in this study. Markers associated with heat tolerance were located mostly on chromosomes 3, 4, 8, and 9.
QTLs were identified for all five traits in the study (
Fig. 6). All QTLs were detected above an empirically determined experiment-wise significance threshold equivalent to P < 0.01 (corresponding to an interval mapping LOD > 3.6 or a composite interval mapping LOD > 3.9). An experiment-wise significance threshold of P < 0.05 was used to declare a QTL significant for supporting environments if a QTL was already established at the same position in at least one environment at P < 0.01. For the traits measured in multiple environments, 47% of the QTLs (28 out of 60) were detected in at least two environments. The alleles were favorable for heat tolerance score QTLs (
Table 2) at reproductive stage. As shown in
Fig. 6, the homozygous alleles from N22, which are related to heat tolerance traits, predominantly populated the putative regions in chromosome 3.
The linkage relationship between the SSR markers RM3586 and RM160 as indicators for heat tolerance genes were estimated. The respective genetic distance between SSR markers RM3586, RM160 and HT genes were determined as 1.2 and 4.5 cM (with LOD scores of 3.4 and 3.9) in single marker analysis (SMA).
Results in interval mapping verified the findings of SMA only in the case of RM3586 - RM160 on chromosome 3 at the 8.1 cM interval (LOD = 3.4, R2 = 11.52%, additive effect = 5.64). On chromosome 4, none of the interval conformed with QTLs found between RM3735 and RM5749 from the single marker analysis, as the value of LOD obtained was low.
One-way ANOVA was carried out using marker genotypes as groups. The ANOVA on RM3586 and genotypes as groups for unfilled grain no./panicle and HT score established high significant association between SSR marker on chromosome 3 and phenotype (
Table 4).
Single marker analysis revealed RM3735 and RM310 linked QTLs on chromosomes 4 and 8 respectively which explained 32.6% and 28% of the total phenotypic variation for heat tolerance (
Table 2,
3,
4). While another locus between RM26212 - RM127 on chromosome 4 spanning at 14.5 cM was detected using interval mapping.
For grain filling trait, two QTLs were detected through SMA at the loci RM25181 and RM167 on chromosome 10 and 11, respectively explaining 15.3 and 13.1% of the total phenotypic variance (
Table 2). None of the two QTLs conformed with the three significant loci identified through interval mapping between RM468 – RM7076 on chromosome 3, and RM241 – RM26212 and RM16686 – RM564 on chromosome 4 (
Table 3).
A QTL for unfilled grain no. per panicle was also mapped at the locus RM554 on chromosome 3 which showed major effect. This QTL explained 25.0% of the total phenotypic variance showing overdominance effect for increased heat tolerance (
Table 2).
For 1,000-grain weight, a single QTL found at the locus RM103 on chromosome 6 also showed major effects on unfilled grain/panicle. This QTL likewise explained 30.6% of the total phenotypic variance showing overdominance effect for increased heat tolerance (
Table 2).
In the case of grain yield, two QTLs were detected through SMA at the loci RM5749 on chromosome 4 and RM337 on chromosome 8 explaining 10.8% and 21.72% of the total phenotypic variance, respectively. These QTLs exhibited partial dominance effects for decreased yield grain (
Table 2). While under interval mapping, a single QTL was identified at the interval of RM241 - RM26212 with a putative region of 16.5 cM.
DISCUSSION
Genetic variation of the quantitative traits is often due to some loci that greatly influenced in addition of smaller effects by others (
Paterson et al. 1988). Data from statistical analysis combined to QTL alleles could be used to indirectly select promising progenies with high efficiency (
Stuber et al. 1982;
Soller and Beckmann 1983).
In the present study, an attempt has been made to understand the genetic basis of rice heat tolerance with molecular markers. The analysis of OM5930/N22 BC
2F
2 population showed that the heat tolerance was nuclearly inherited. Estimating inheritance of heat tolerance from their overall response to high temperature is difficult because of the low precision due to effects of plant development status and interactions of environmental factors with genes for the trait (
Ottaviano et al. 1991). However, in this study extraneous effects were minimized by exposing the plants to the temperature treatments at exact stages of flowering. This is crucial because high temperatures have impacts on pollination and fertilization that could result in low seed set rate during flowering stage. Consequently, the difference of seed set rate was used as an index of heat tolerance in rice.
Phenotypic measurement is very important in tagging QTL, because quantitative traits, such as heat tolerance are largely affected by environment. Phenotyping for heat tolerance is rather difficult due to complications in simulating the stress under field condition. In this study, the phenotypic frequency distributions reflect the complexity of heat tolerance genes inheritance. Some lines are highly tolerant to heat, while others are very sensitive. This was measured as the number of unfilled grain per panicle and grain yield among others. The correlation coefficient between HT score and unfilled grains obtained the most significant value of r = 0.929
** and df = 166 (
Buu et al. 2012).
Grain yield largely belongs to quantitative characteristics, indicating the polygenic control of traits and interactions of environmental factors, and its genetic basis is fairly complex. This is evident for the QTL detected for grain yield between RM241-RM26212 interval on chromosome 4 through interval mapping which did not matched with the two significant loci RM337 and RM5479 on chromosomes 8 and 4 analyzed through SMA.
The QTLs underlying tolerance to high tolerance stress were identified using the BC2F2 derived from a cross between N22 (heat tolerant rice cultivar) and the sensitive indica cultivar OM5930 (derived from a soma clonal line of OM3636 (TD8 × OM1738). Identified major QTLs contributing heat tolerance and its related traits under field conditions were detected on chromosome 4 in the intervals between RM26212 - RM127 and RM241 - RM26212, and RM468 - RM7076 on chromosome 3.
Four QTLs were detected for filled grains per panicle on chromosome 4 at the interval of RM468-RM7076 and RM241 – RM26212, explaining 13.1% and 31.0% of the total phenotypic variation, respectively. Two QTLs controling unfilled grain percentage was also detected at loci RM554, RM3686 on chromosome 3 explaining only 25.0% and 11.2% of the total phenotypic variance. One QTL was detected for 1,000-grain weight located at the locus RM103 on chromosome 6, explaining 30.6% of the total phenotypic variance. A single QTL at the locus RM5749 on chromosome 4 was identified explaining 10.8% of the total phenotypic variance of grain yield.
As shown in
Fig. 6, the blue regions which populated in chromosome 3, 6, 7, 8 and 9 indicate the loci containing homozygous alleles for heat tolerance from N22. The red regions indicate homozygous alleles from susceptible genotype OM5930, while the pale green regions depicts heterozygous alleles as a result of recombination.
On the chromosome 4, RM3735 was found to be highly linked to the heat tolerance gene which accounted for 32.6% of the total variance in heat tolerance in BC2F2 population via single marker analysis. Another two SSR markers, which were potentially linked to heat tolerant genes in rice, were identified. By testing with the 310 BC2F2 individuals, genetic linkage analysis indicated that two SSR markers, RM3586 and RM160 on chromosome 3 were highly putatively linked to the heat tolerant gene, accounting for 36.2 and 17.1% of the total variance in heat tolerance in BC2F2 population, respectively. These loci can be used as potential markers for application in molecular-assisted selection breeding techniques for improving heat tolerance of rice.
ACKNOWLEDGMENTS
The authors thank the Ministry of Agriculture and Rural Development of Vietnam and the project of Heat Tolerance Rice Breeding, RDA Korea for the support.
Fig. 1Temperature dynamics (°C) from heading to harvesting of 310 BC2F2 lines (OM5930/N22) developed in 2012 dry season (CLRRI meteorological data).
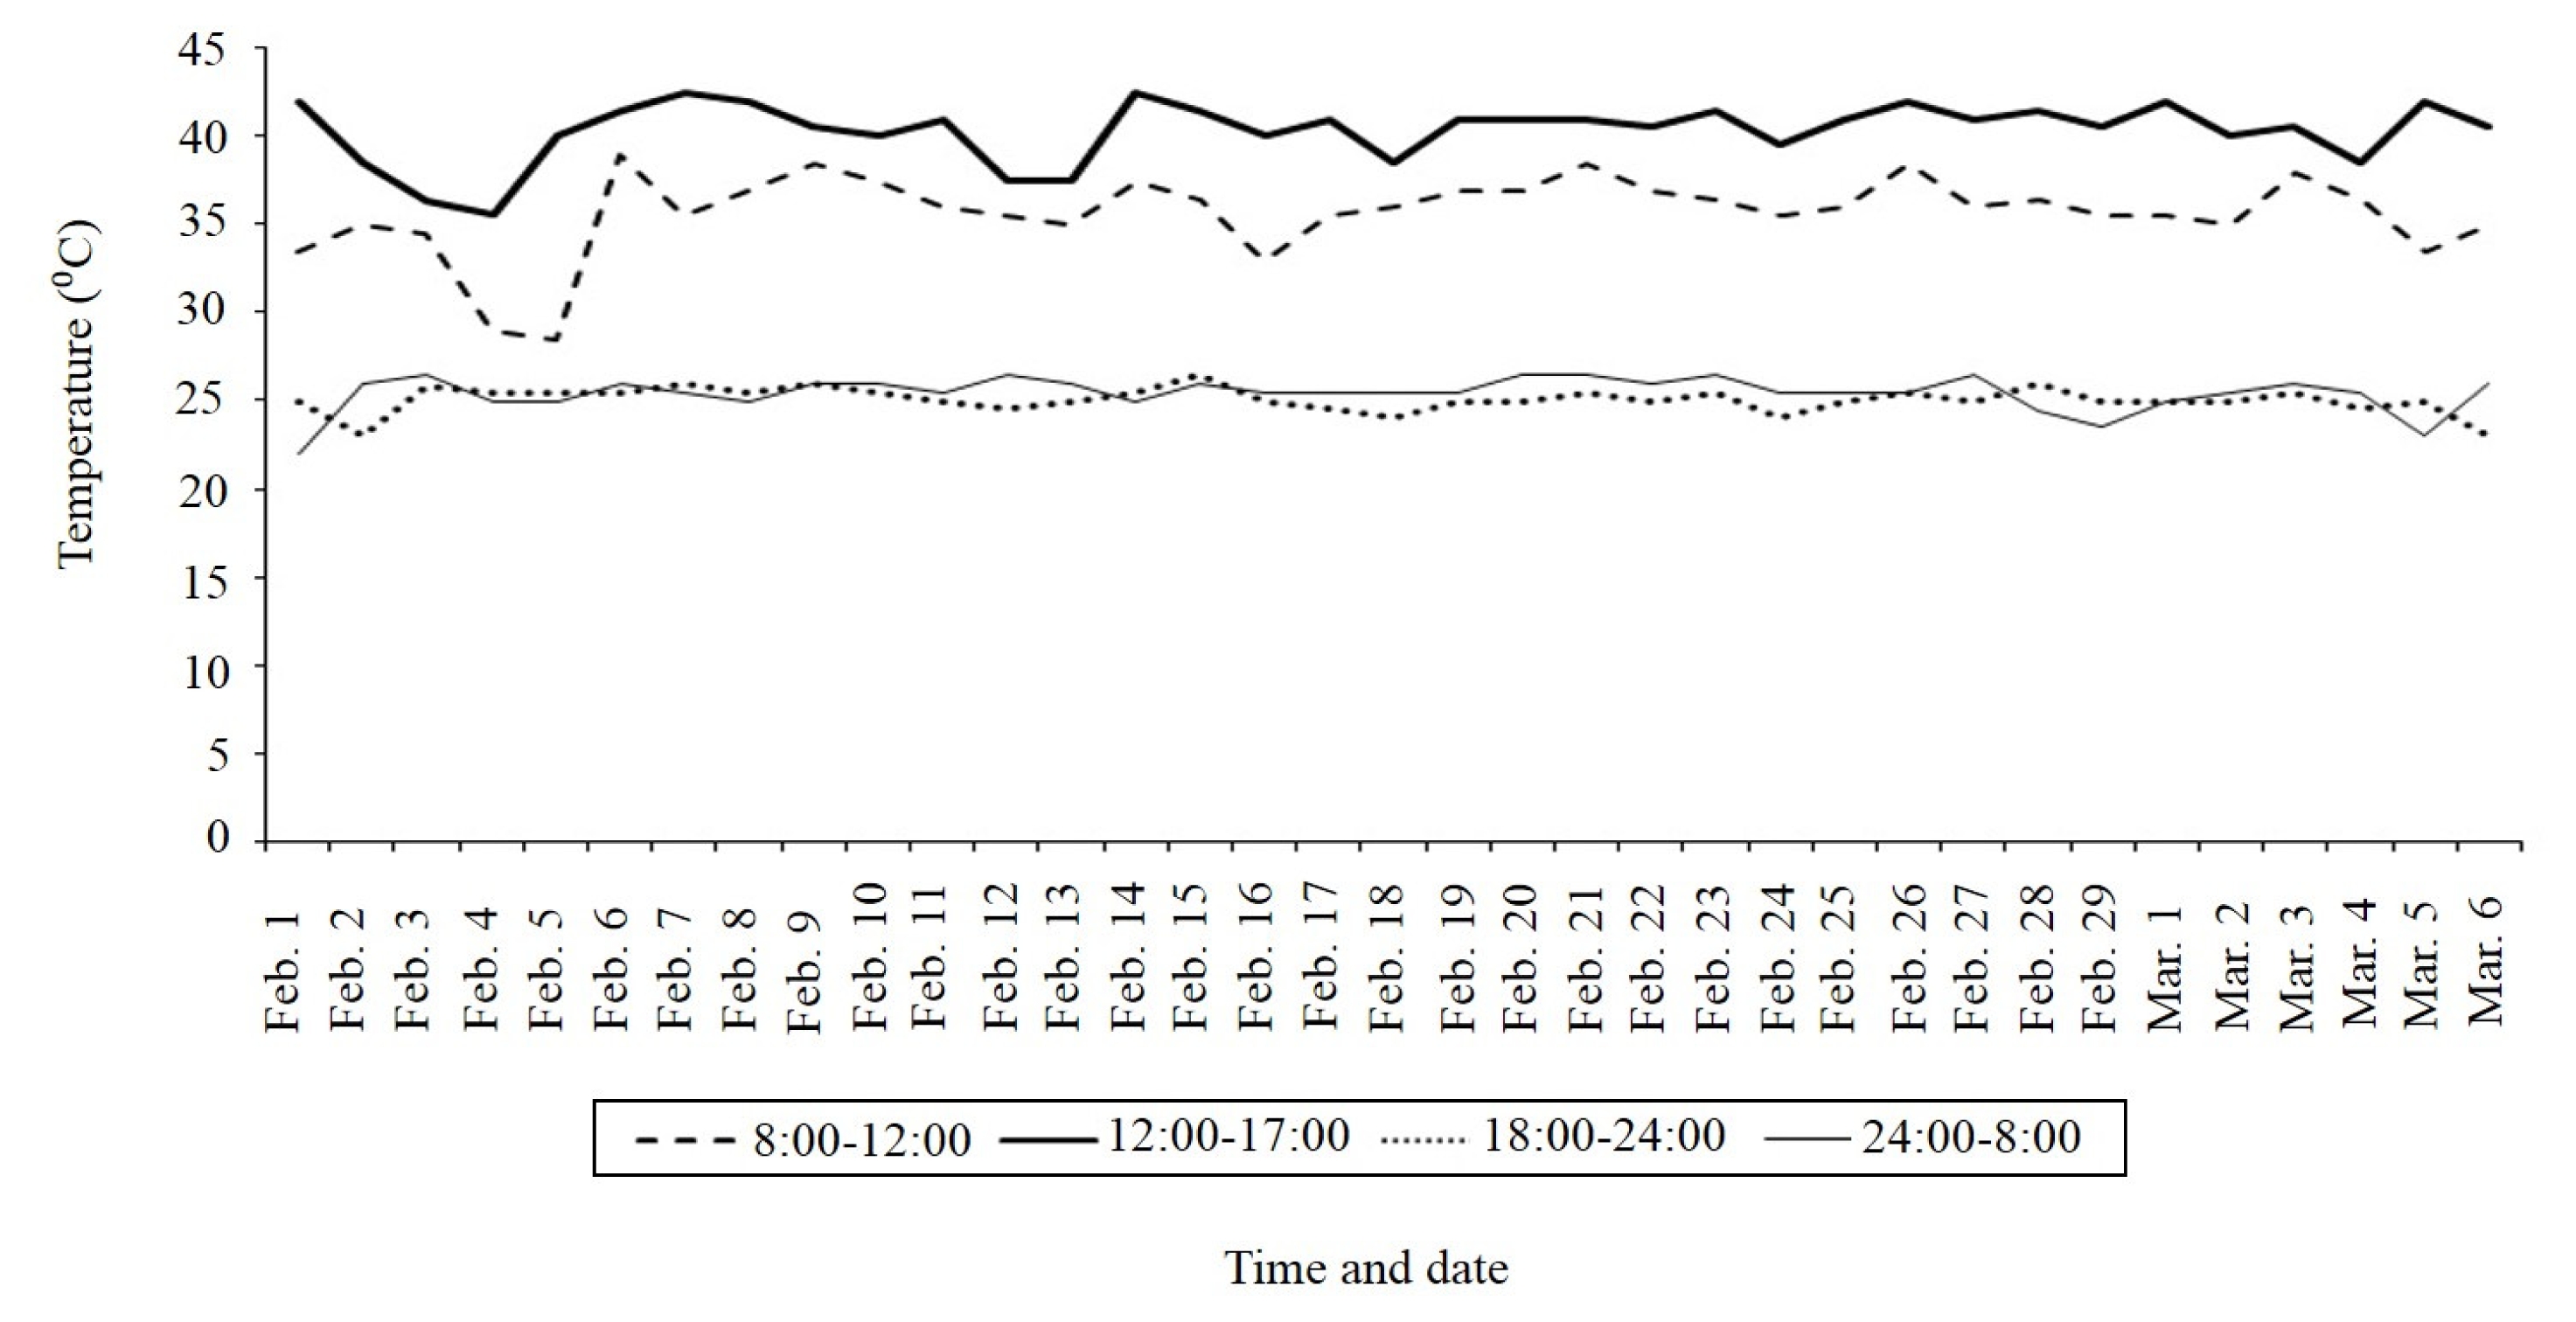
Fig. 2Frequency distribution of heat tolerance score at heading stage in 310 individuals of BC2F2 population under heat stress.
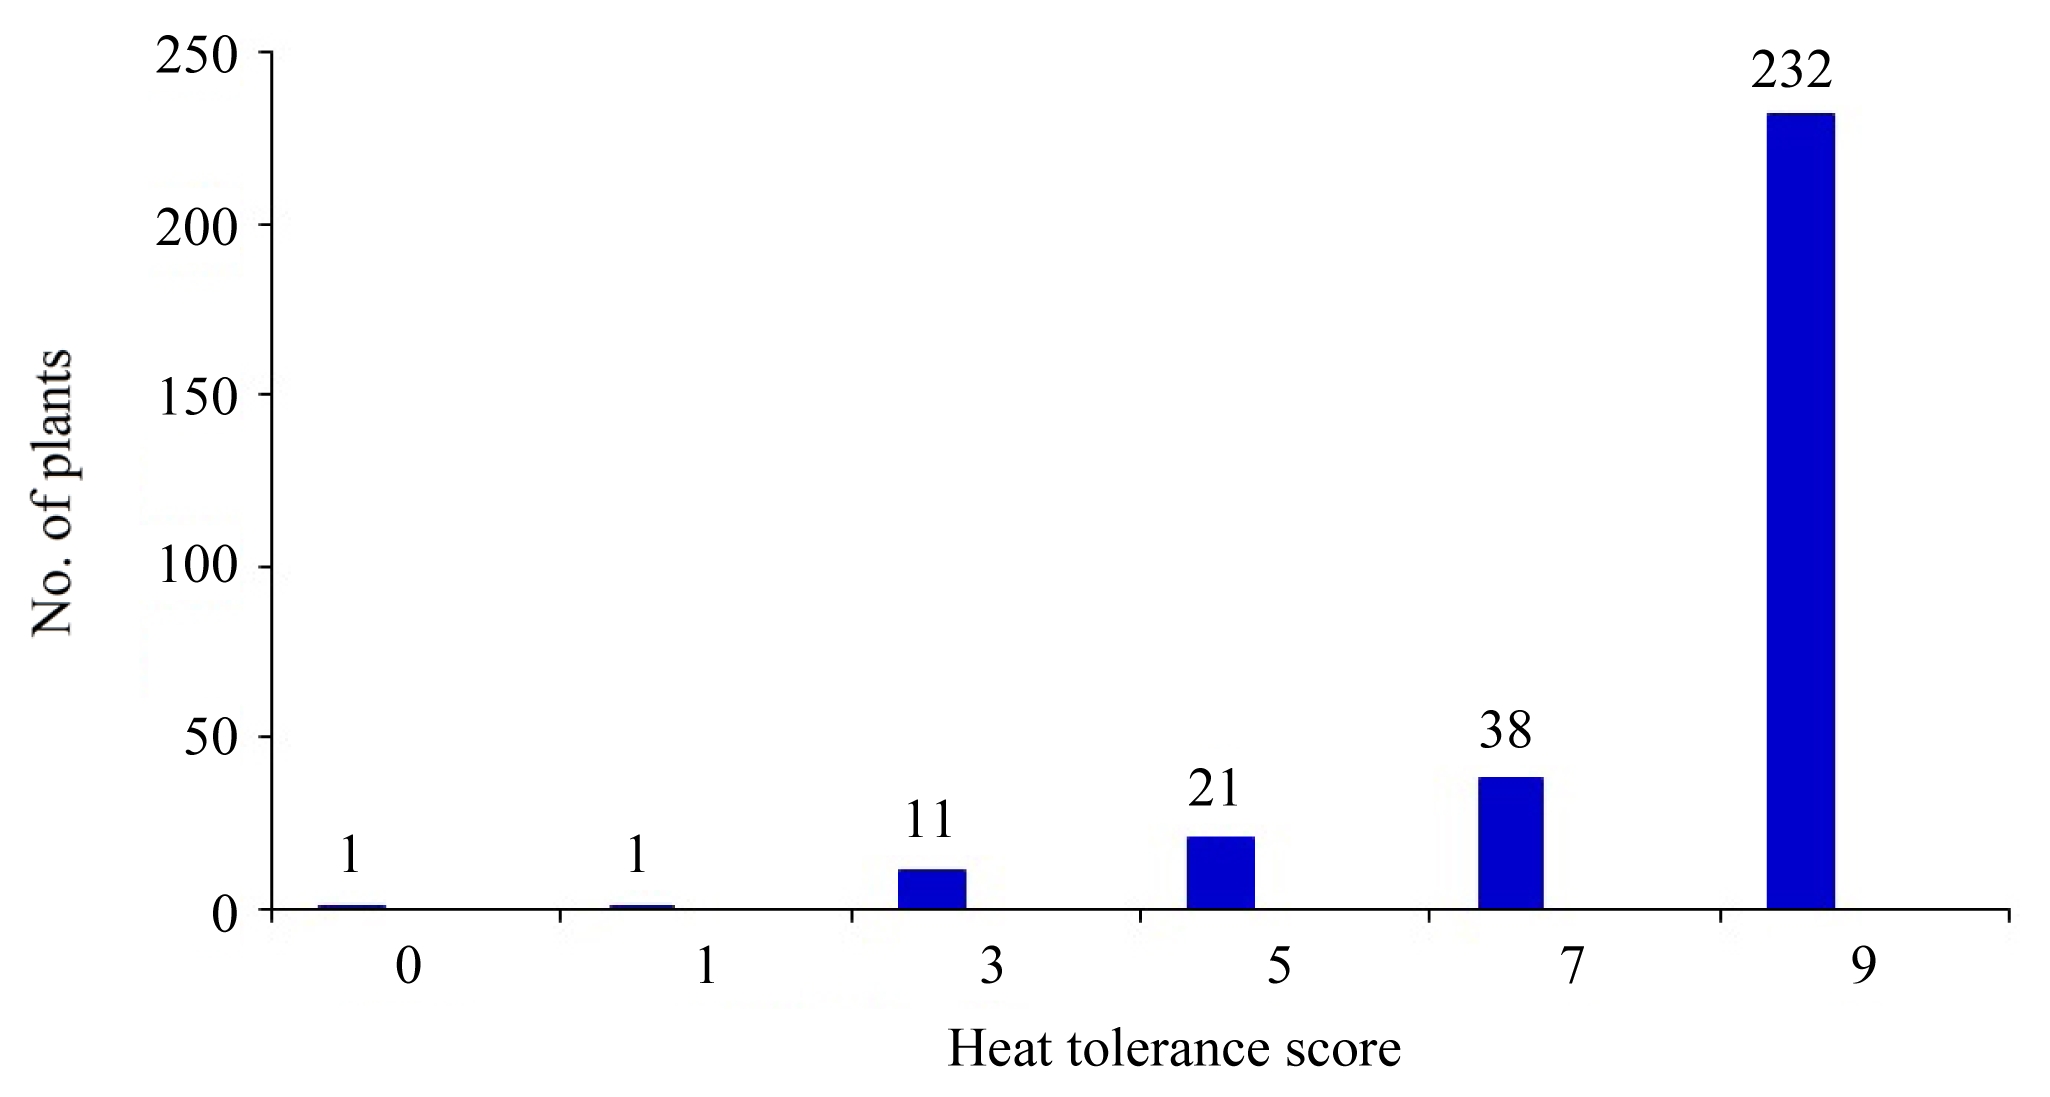
Fig. 3Filled grain no./panicle (left) and unfilled grain no./panicle (right) distribution in 310 individuals of BC2F2 population under heat stress.

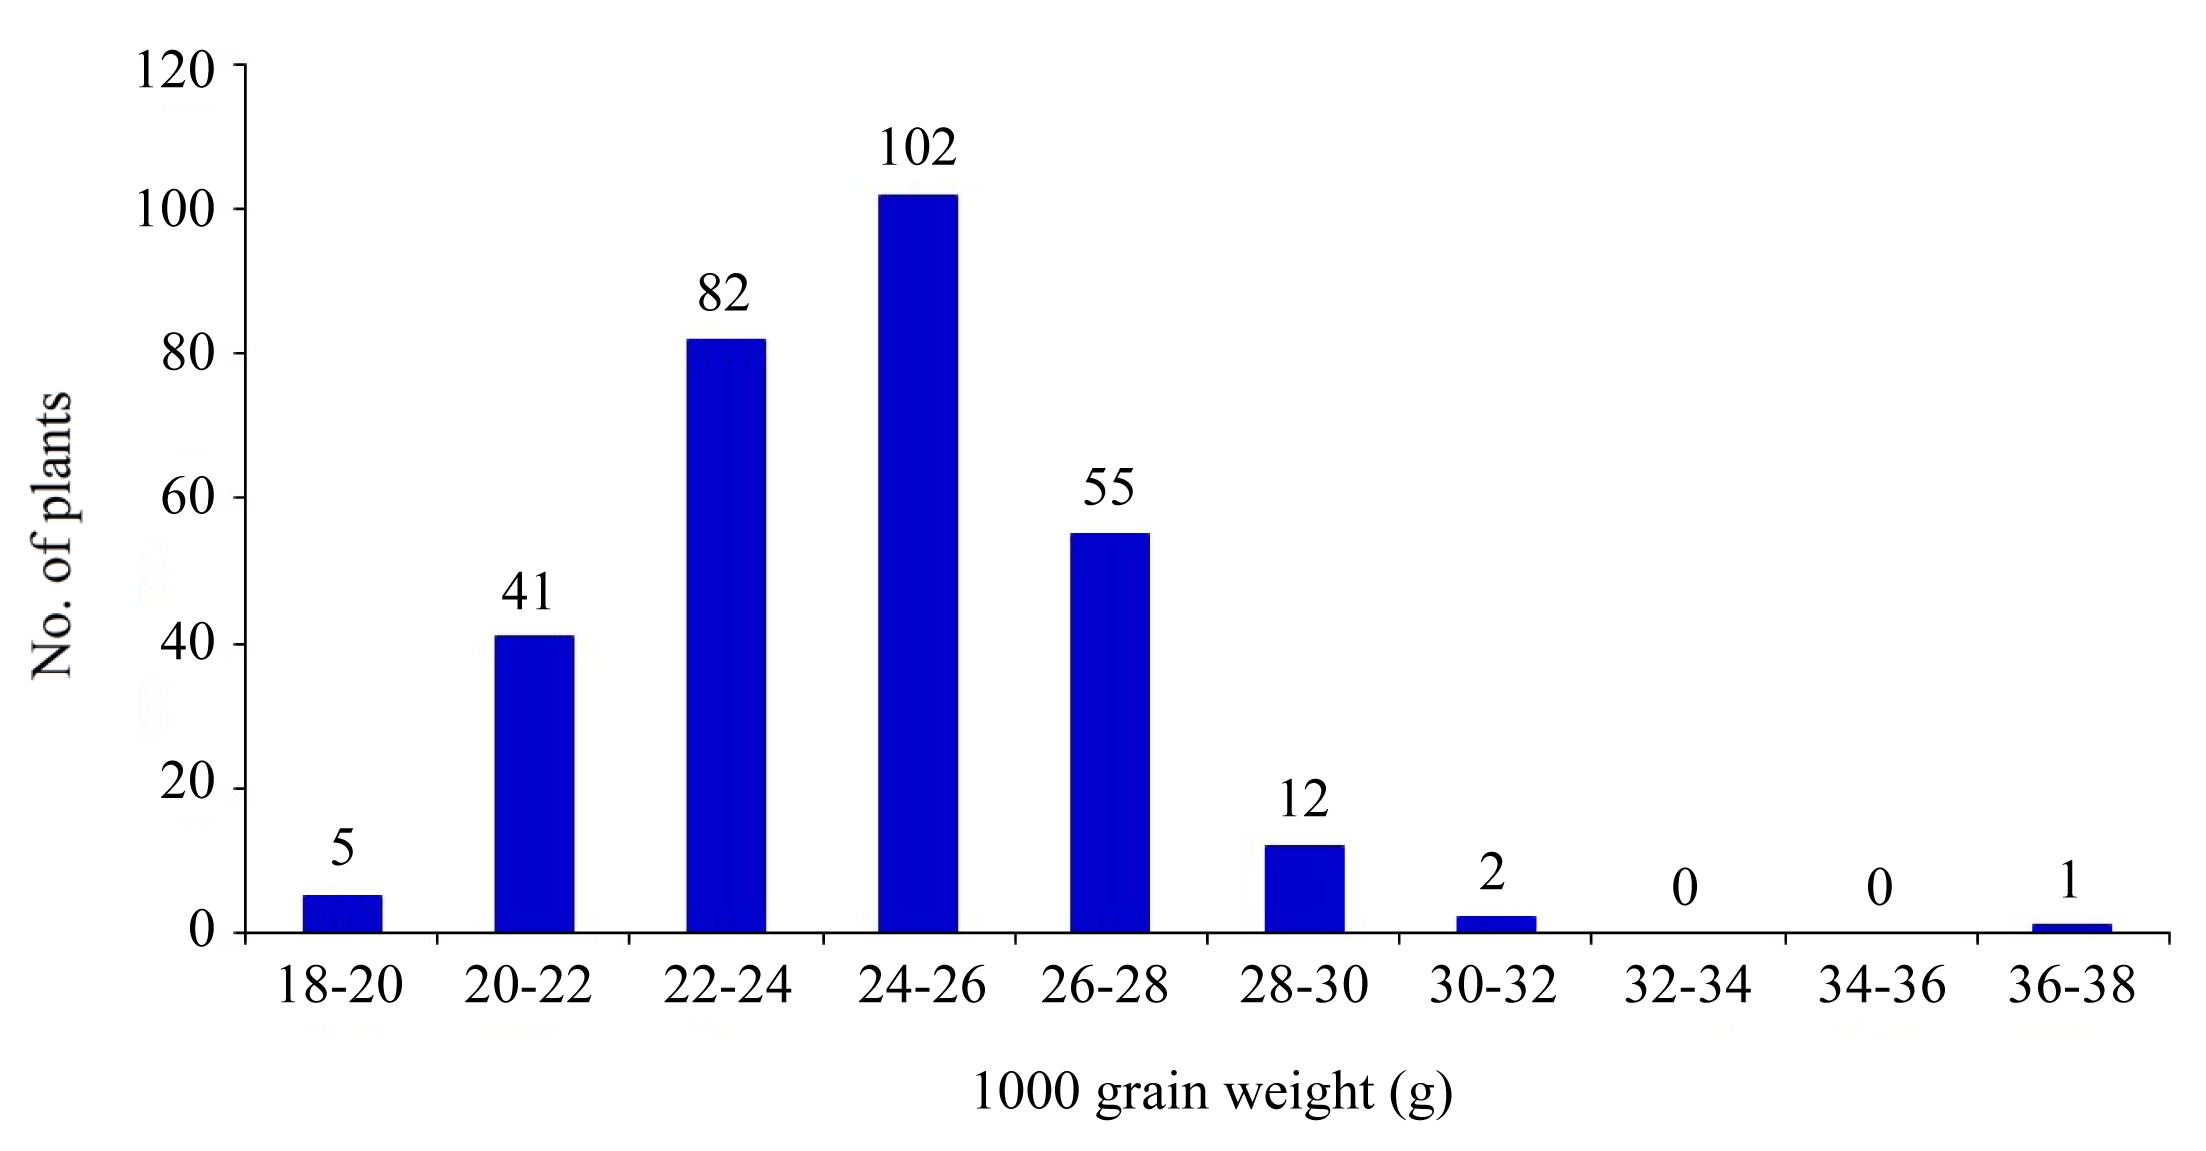
Fig. 41,000-grain weight distribution in 310 individuals of BC2F2 population under heat stress.

Fig. 5Grain yield distribution in 310 individuals of BC2F2 population under heat stress.
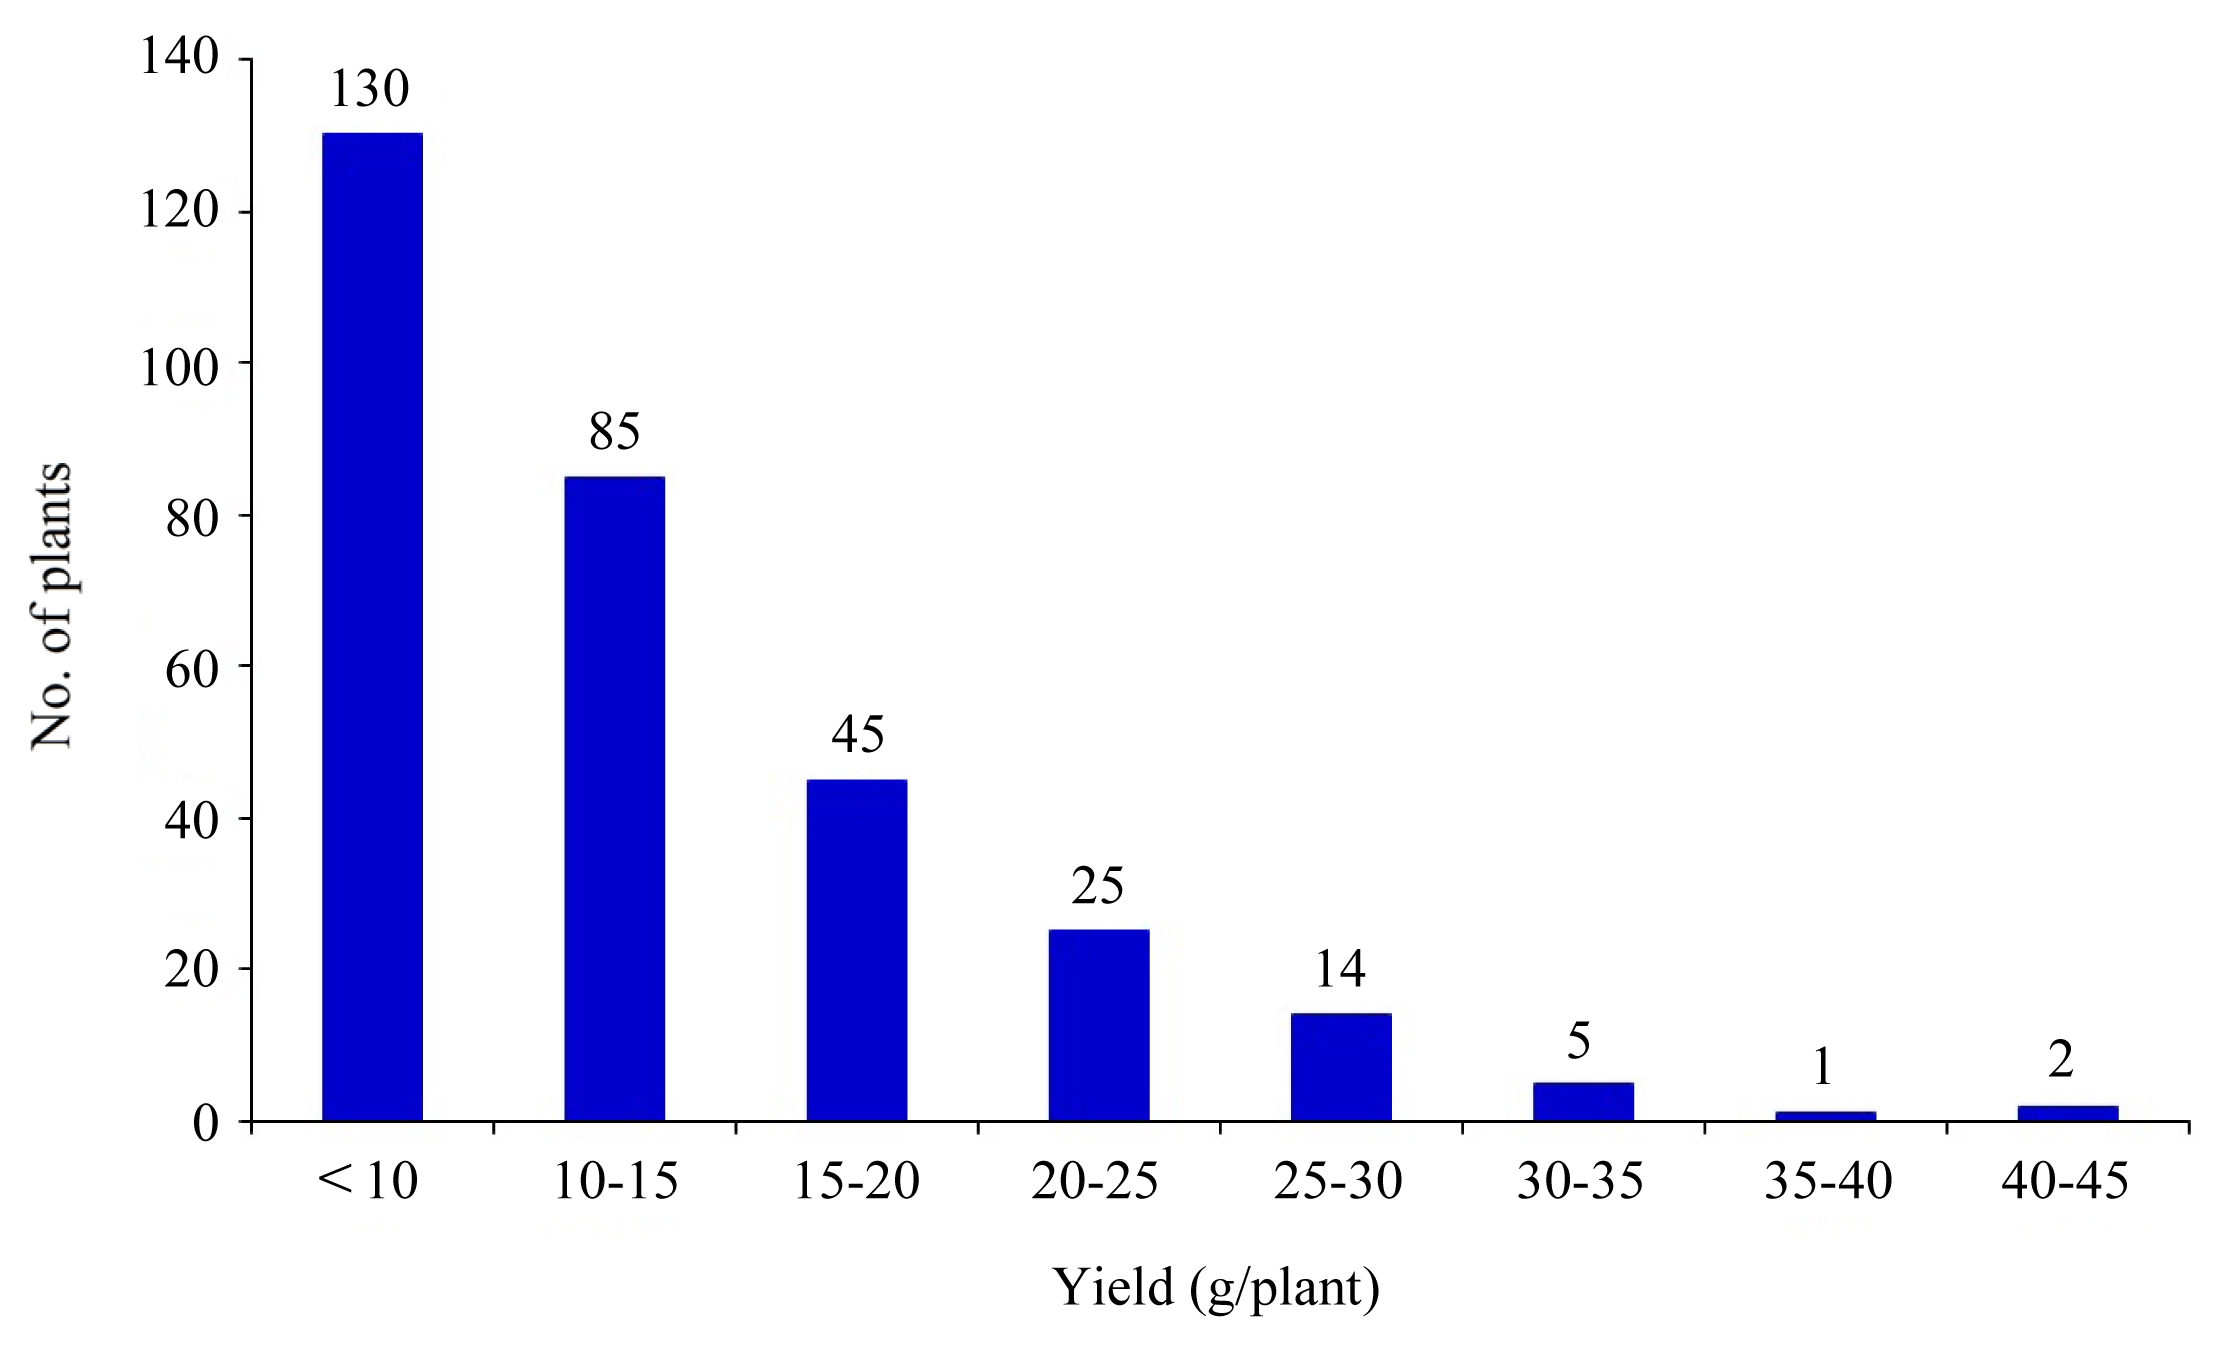
Fig. 6Molecular linkage map (graphic genotyping) on 12 chromosomes in BC2F2 population of OM5930/N22. Blue: homozygous alleles from N22 (tolerance), Red: homozygous alleles from OM5930 (susceptible), Pale green: heterozygotes, Brown: unidentified.

Table 1Genetic map for heat tolerance on 12 chromosomes of BC2F2 derived from OM5930/N22.
Table 1
|
Chromosome |
Marker numbers |
Length (cM) |
Average (cM) |
|
1 |
31 |
367.4 |
11.85 |
|
2 |
12 |
56.9 |
4.74 |
|
3 |
42 |
296.1 |
7.05 |
|
4 |
23 |
279.6 |
12.15 |
|
5 |
14 |
111.9 |
7.99 |
|
6 |
22 |
290.2 |
13.19 |
|
7 |
21 |
352.0 |
16.76 |
|
8 |
21 |
189.5 |
9.02 |
|
9 |
13 |
231.8 |
17.83 |
|
10 |
19 |
159.5 |
8.40 |
|
11 |
23 |
182.1 |
7.92 |
|
12 |
23 |
224.6 |
9.77 |
|
|
Total |
264 |
2741.6 |
10.55 |
Table 2QTL analysis on yield and yield-related characters under heat stress through single marker analysis among 310 BC progenies of OM5930/N22; LOD > 3.0.
Table 2
|
Marker |
Chr. |
Trait |
Av. of allele |
F |
P |
R2 (%) |
DPE |
|
RM3586 |
3 |
HT score |
4.150 ± 0.44 |
10.60 |
0.000 |
36.2 |
B |
|
RM3735 |
4 |
5.40 ± 0.44 |
9.16 |
0.000 |
32.6 |
B |
|
RM160 |
3 |
0.42 ± 0.44 |
4.25 |
0.004 |
17.1 |
A |
|
RM310 |
8 |
5.40 ± 0.44 |
3.73 |
0.011 |
28.0 |
A |
|
|
RM25181 |
10 |
Filled grain no./panicle |
4.40 ± 0.44 |
3.80 |
0.014 |
15.3 |
A |
|
RM167 |
11 |
5.40 ± 0.44 |
3.19 |
0.010 |
13.1 |
A |
|
|
RM554 |
3 |
Unfilled grain no./panicle |
4.40 ± 0.44 |
7.80 |
0.001 |
25.0 |
A |
|
RM3586 |
3 |
6.40 ± 0.40 |
4.59 |
0.001 |
11.2 |
B |
|
|
RM103 |
6 |
1,000 grain weight |
4.40 ± 0.44 |
7.80 |
0.001 |
30.6 |
A |
|
|
RM5749 |
4 |
Grain yield |
4.80 ± 0.44 |
7.80 |
0.005 |
10.8 |
A |
|
RM337 |
8 |
5.8 ± 0.47 |
2.95 |
0.005 |
21.7 |
A |
Table 3QTL analysis on related characters at flowering stage through interval mapping analysis among 310 BC progenies of OM5930/N22; LOD > 3.0.
Table 3
|
Trait |
Interval |
Chromosome |
P |
Position (cM) |
|
Filled grain no./panicle |
RM468 - RM7076 |
3 |
0.000 |
3.7 |
|
RM241 - RM26212 |
4 |
0.000 |
16.5 |
|
RM16686 - RM564 |
4 |
0.000 |
9.7 |
|
|
Grain yield |
RM241 - RM26212 |
4 |
0.000 |
16.5 |
|
|
HT score |
RM26212 - RM127 |
4 |
0.002 |
14.5 |
|
RM3586- RM160 |
3 |
0.004 |
10.1 |
Table 4ANOVA of single marker at the locus RM3586 related to the characters among 310 BC progenies of OM5930/N22.
Table 4
|
Trait |
Error MS |
F-RATIO |
F-PROB |
|
HT score |
1.6825 |
148.99 **
|
0.000 |
|
Unfilled grain |
197.62 |
27.01 **
|
0.000 |
|
1,000 grain weight |
5.0692 |
2.78 ns |
0.062 |
|
Grain yield |
55.012 |
0.73 ns |
0.487 |
References
- Buu BC, Hieu NV, Toan VT, Tam BP, Tra My VT, Nha CT, Lang NT. 2012. Assessment of breeding materials for heat tolerance rice breeding (Oryza sativa L.). J Agric Rural Dev (Vietnamese). 12: 38-46.
- Buu BC, Thu Ha PT, Tam BP, Nha CT, Lang NT. 2013. Study on genetic variation of heat tolerance trait in BC population of rice (Oryza sativa L.). J Agric Rural Dev (Vietnamese). 2: 10-15.
- Cao LY, Zhu J, Zhao ST, He LB, Yan QC. 2002. Mapping QTL for heat tolerance in a DH population from indica-japonica cross of rice (Oryza sativa L.). J Agric Biotech. 10: 210-214.
- Cao YY, Duan H, Yang LN, Wang ZQ, Zhou SC, Yang JC. 2008. Effect of heat stress during meiosis on grain yield of rice cultivars differing in heat tolerance and its physiological mechanism. Acta Agron Sin. 34: 2134-2142.
- Cao YY, Zhang Q, Chen YH, Zhao H, Lang YZ, Yu CM, Yang JC. 2013. Identification of differential expression genes in leaves of rice (Oryza sativa L.) in response to heat stress by cDNA-AFLP analysis. BioMed Res Int. Epub 2013 Feb 17. 2013: Article ID 576189, 11pages http://dx.doi.org/10.1155/2013/576189
- Chen QQ, Yu SB, Li CH, Mou TM. 2008. Identification of QTLs for heat tolerance at flowering stage in rice. Sci Agric Sin. 41: 315-321.
- Chen X, Temnykh S, Xu Y, Cho YG, McCouch SR. 1997. Development of a microsatellite framework map providing genome-wide coverage in rice (Oryza sativa L.). Theor Appl Genet. 95: 553-567.
- Jagadish SVK, Muthurajan R, Oane R, Wheeler TR, Heuer S, Bennett J, Craufurd PQ. 2010. Physiological and proteomic approaches to address heat tolerance during anthesis in rice (Oryza sativa L.). J Exp Bot. 61: 143-156.
- Jung KH, Ko HJ, Nguyen MX, Kim SR, Ronal DP, An G. 2012. Genome-wide identification and analysis of early heat stress responsive gene in Rice. J Plant Biol. 55: 458-468.
- Kosambi DD. 1944. The estimation of map distances from recombination values. Ann Engen. 12: 172-175.
- Kuang HC, Wen SS, Liu GM. 2002. Studies on the heat tolerance of Luhui 17 and its cross II You 7 at head sprouting. SW China J Agric Sci (Chinese). 15: 106-108.
- Lander ES, Green P, Abrahamson J, Barlow A, Daly MJ, Lincoln SE, Newburg L. 1987. MapMarker: an interactive computer package for constructing primary linkage maps of experimental and natural populations. Genomics. 1: 174-181.
- Lang NT. 2002. Protocol for basic biotechnology. Agricultural Publisher. Ho chi Minh City, Vietnam.
- Li CD. 2003. Analysis on a large of empty grains of rice due to high temperature. Shanxi J Agric Sci. 49: 45-47.
- Liao JL, Zhang HY, Liu JB, Zhong PA, Huang YJ. 2012. Identification of candidate genes related to rice grain weight under high-temperature stress. Plant Sci. 196: 32-43.
- Lincoln S, Daley M, Lander E. 1992. Constructing genetic maps with MAPMAKER/EXP 3.0. 3rd edn. Whitehead Institute Technical Report. Cambridge.
- Mackill DJ, Coffman WR, Rutger JN. 1982. Pollen shedding and combining ability for high temperature tolerance in rice. Crop Sci. 22: 730-733.
- Matsushima S, Ikewada H, Maeda A, Honma S, Niki N. 1982. Studies on rice cultivation in the tropics 1: yielding and ripening responses of the rice plant to the extremely hot and dry climate in Sudan. Japan J Trop Agric. 26: 19-25.
- Morita S, Yonemaru JI, Takanashi JI. 2005. Grain growth and endosperm cell size under high night temperatures in rice (Oryza sativa L.). Ann Bot. 95: 695-701.
- Nelson JC. 1997. QGene: Software for marker-based genomic analysis and breeding. Mol Breed. 3: 239-245.
- Osada A, Sasiprapa V, Rahong M. 1973. Abnormal occurrence of empty grains of indica rice-plants in the dry, hot season in Thailand. Proc Crop Sci Japan. 42: 103-109.
- Ottaviano EMS, Gorla EP, Frova C. 1991. Molecular marker (RFLP and HSPs) for the genetic dissection of thermo-tolerance in maize. Theor Appl Genet. 81: 713-719.
- Paterson AH, Lander ES, Hewitt JD, Paterson S, Lincoln SE, Tanksley SD. 1988. Resolution of quantitative traits into Mendelian factors by using a complete linkage map of restriction fragment length polymorphism. Nature. 335: 721-726.
- Peng SB, Huang JL, Sheehy JE, Laza RC, Visperas RM, Zhong XH, Centeno GS, Khush GS, Cassman KG. 2004. Rice yields decline with high temperature from global warming. Proc Natl Acad Sci USA. 101: 9971-9975.
- Soller M, Beckman JS. 1983. Genetic polymorphism in varietal identification and genetic improvement. Theor Appl Genet. 67: 25-23.
- Stake T, Yoshida S. 1978. High temperature induced sterility in indica rice at flowering. Japan J Crop Sci. 47: 6-17.
- Stuber CW, Goodman MM, Moll RH. 1982. Improve of yield and ear number resulting from selection at allozyme loci in maize population. Crop Sci. 22: 737-740.
- Tanksley SD. 1993. Mapping polygenes. Annu Rev Genet. 27: 205-233.
- Temnykh S, Park WD, Ayres N, Cartinhour S, Hauck N, Lipovich L, Cho YG, Ishii T, McCouch SR. 2000. Mapping and genome organization of micro-satellite sequences in rice (Oryza sativa L.). Theor Appl Genet. 100: 697-712.
- Wahid A, Gelani G, Ashraf M, Foolad MR. 2007. Heat tolerance in plants: An overview. Envi Exp Bot. 61: 199-223.
- Wei H, Liu JP, Wang Y, Huang NR, Zhang XB, Wang LC, Zhang JW, Tu JM, Zhong XH. 2013. A dominant major locus in chromosome 9 of rice (Oryza sativa L.) confers tolerance to 48°C high temperature at seedling stage. J Hered. 104: 287-294.
- Xiao YH, Pan Y, Luo LH, Deng HB, Zhang GL, Tang WB, Chen LY. 2011. Quantitative trait loci associated with seed set under high temperature stress at the flowering stage in rice (Oryza sativa L.). Euphytica. 178: 331-338.
- Zhang T, Yang L, Jang KF, Huang M, Sun Q, Chen WF, Zheng JK. 2008. QTL mapping for heat tolerance of the tassel period of rice. Mol Plant Breed. 6: 867-873.
- Zhang GL, Chen LY, Xiao GY, Xiao YH, Chen XB, Hang ST. 2009. Bulked segregant analysis to detect QTL related to heat tolerance in rice (Oryza sativa L.) using SSR markers. Agric Sci China. 8: 482-487.
- Zhang Q, Shen BZ, Dai XK, Mei MH, Saghai Maroof MA, Li ZB. 1994. Using bulked extremes and recessive class to map genes for photoperiod-sensitive genic male sterility in rice. Proc Natl Acad Sci USA. 91: 8675-8679.
- Zhu CL, Jiang L, Zhang WW, Wang CM, Zhai HQ, Wan JM. 2006. Identifying QTLs for thermo-tolerance of amylose content and gel consistency in rice. Chinese J Rice Sci. 20: 248-252.
- Zhu CL, Xiao YH, Wang CM, Jiang L, Zhai HQ, Wan JM. 2005. Mapping QTL for heat-tolerance at grain filling stage in rice. Rice Sci. 1: 33-38.