Abstract
-
There is a rising interest of moving towards hybrid breeding in outcrossing species. Self-compatibility (SC), which occurs at low rates in self-incompatible species, could be used to develop inbred lines, a key requirement for hybrid breeding programs. In perennial ryegrass, the existence of SC independent from the self-incompatibility (SI) loci S and Z has been reported.
In this study, we used 98 F2 individuals from a cross between a self-compatible ecotype and an individual of the VrnA mapping population that were tested with markers for two candidate linkage groups 3 and 5 as well as markers for candidate regions at the S and Z locus. We were able to determine a tentative location of a SC locus and tested the possible interaction to other loci involved in SI and SC. This information will help to fine map the SC locus, and for marker-assisted selection.
-
Key words: Self-fertility, Mapping, Perennial ryegrass, Self-incompatibility, Pollination tests, Segregation analysis
INTRODUCTION
Increasing interest of moving towards hybrid breeding in several outcrossing species requires manipulation of mechanisms preventing or allowing self-fertilization. Species that are forced to outcross display a strong inbreeding depression, which suggests the possibility of exploiting heterosis in hybrid breeding. One key factor for moving from population or synthetic to hybrid breeding is the ability to develop inbred lines (
Arias Aguirre et al. 2011). This is a particular challenge in self-incompatible (SI) species.
Self-compatibility (SC) is not unusual in self-incompatible species. Mutations at SI loci have been determined to be involved in self-fertility and have been mapped in rye (
Secale cereale L.) (
Fuong et al. 1993;
Voylokov et al. 1993;
Voylokov et al. 1998). In
Phalaris coerulescens Desf
., mutations at S and Z as well as an independent locus have been identified (
Hayman and Richter 1992). Finally, a recent study in switchgrass (
Panicum virgatum L.) reported a genotype with a high rate of selfing (61.3%), suggesting presence of a major QTL controlling this trait (
Liu and Wu 2012).
In perennial ryegrass, a locus causing SC that segregates independently from S and Z has been reported (
Thorogood et al. 2005). This locus (T) is located on linkage group (LG) 5. It has been speculated, whether the product of (T) prevents transcription of S or Z, or the interaction occurs at the post-transcriptional level.
Thorogood et al. (2005) also found an additional effect of S at LG 1, but segregation of SS/tt genotypes did not always fit the expected compatibility. In that same study, segregation distortion on LG 7 suggested the interaction of the SC locus on this LG. However, no major significant QTL was detected in this region. In addition, there is also a high rate of segregation distortion reported in several mapping populations for LG 3 which may be involved in SC or related traits, such as flowering and vernalization response (
Anhalt 2008).
Thorogood et al. (2005) observed a 1:1 phenotypic segregation between 50% self-compatible and full self- compatible plants in a bi-parental F
2 population, and concluded that SC is controlled by a major gene. We have established a self-compatible perennial ryegrass genotype which is independent of the one characterized by
Thorogood et al. (2005). Our question was, whether SC in our population will be controlled by the same major gene located in LG 5, and whether the 1:1 phenotypic ratio could also be observed in our F
2 population. The objectives of our study were to i) determine which gene model best describes the phenotypic segregation found in our F
2 population; ii) find a relationship between phenotypic data and marker data for candidate chromosomes and loci; and iii) map SC loci in a F
2 population obtained by crossing a potential new source of SC and an individual of the VrnA mapping population (
Jensen et al. 2005).
MATERIALS AND METHODS
Plant materials
To characterize loci affecting SC, a self-compatible genotype obtained after five generations of selfing by single seed descent (with an expected average homozygosis of 96.9%) was crossed to a self-incompatible individual of the VrnA mapping population (
Jensen et al. 2005). The self-compatible genotype is assumed to be homozygous for both the S and the Z locus, whereas the VrnA plant has one and two alleles segregating for Z and S, respectively (Studer, unpublished data). A single F
1 individual was selfed during summer 2011. Ninety-eight F
2 plants were vernalized for five weeks at 5ºC with a 10 h light per day photoperiod in a growth chamber during winter 2011. All plants were grown in the Horticulture greenhouse at Iowa State University, Ames, IA, in a 16 h light per day photoperiod and 20ºC for flowering.
In vitro pollination tests were made to classify the genotypes according to compatibility of pollen grains by analyzing the pollen reaction on stigma under an ultraviolet light microscope (
Martin 1959;
Kho and Baer 1968;
Thorogood et al. 2002) slightly modified for better results. Flowering tillers were harvested prior to anthesis. Stigma were collected on a 2% agar, 10% sucrose and 100 ppm Boric acid medium, and incubated at 25ºC for 24 h (
Lundqvist 1961). Stigma were self-pollinated and incubated for 4 h at 25ºC. Ovaries were cut using razor blades and placed on microscope slides. A drop of staining solution (0.2% aniline blue in 2% K
3PO
4) was placed over pollinated stigma and covered with a slide. Pollinated stigma were inspected under a Zeiss Axioplan 2 Imaging UV light microscope and images were analyzed with the Axiovision software (Zeiss, Germany) at the Microscope and Imaging Facility at Iowa State University. Each plate contained at least six self- pollinated stigma. Each genotype was analyzed in two independent replications. Pollen compatibility classification was based on observation of all the stigma collected in each replication. If most of the pollen grains were uncolored and showed long pollen tubes, the pollen/stigma donor was classified as self-compatible. If about half of the pollen grains developed strongly stained but short pollen tubes, the pollen/stigma donor individual was classified as half-compatible (
Martin 1959;
Lundqvist 1961;
Kho and Baer 1968;
Thorogood et al. 2002).
Phenotypic segregation analysis
Chi-square tests were used to evaluate, which genetic model is consistent with observed segregation data. Four phenotypic segregation models for SC were tested, assuming it is controlled by a single gene: a) additivity in which three distinguishable phenotypic classes are expected in a 1:2:1 ratio (Model I); b) dominance in which two distinct phenotypic classes are expected in a 3:1 segregation (Model II); c) homozygote class lethality in which one of the homozygote classes is completely missing and the two remaining genotypic classes are expected in a 2:1 ratio (Model III); and d) gametic selection in which one of the gametes carrying a recessive allele is not transmitted to the next generation (either as male or female gamete) and, therefore, only two phenotypic classes are expected in a 1:1 ratio (Model IV).
Marker data
Thirty-five markers for LG 3 and 5 were randomly selected from EST-SSR derived markers (
Studer et al. 2010) and tested for polymorphism. In addition, three markers closely linked to Z (
Manzanares et al. 2011), as well as four markers closely linked with a region segregating for S (Studer, unpublished data) were used in this study (
Table 1).
The first step of marker screening was to evaluate for presence of bands on 2% agarose gels, using F
1 DNA as template. Markers with at least a single band were tested for polymorphisms in a sample of 16 individuals of the F
2. Polymorphic markers were used for genotyping using high resolution melting (
Studer et al. 2009). PCR reactions contained 1x LCGreen dye (Idaho Technology, Inc., UT, USA), 0.1 mM of dNTPs, 10 μM of each forward and reverse primer, 20 mM of magnesium chloride, and 20 ng of sample DNA. In addition, 15 μL of mineral oil were added to the PCR mix to avoid evaporation. PCR amplification was conducted in a PTC-200 Thermal Cycler (MJ Research Inc., Watertown, MA, USA) following the protocol by
Studer et al. (2009). Annealing temperatures for each primer were standardized, using gradient PCR. A final cycle of 30 seconds at 94ºC and at 25ºC was added for heteroduplex formation. The LightScanner Instrument (96-well plate format) as well as the LightScanner software Version 2 (Idaho Technology, Inc., Utah, US) were used for melting analysis. Melting temperatures used across markers ranged from 68–98ºC in the auto exposure setting.
Twenty-one markers were used to cover the two LGs 3 and 5, 9 markers for LG3 and 12 for LG5. Each marker was anchored to its corresponding LG using the consensus map for ryegrass as a reference (
Studer et al. 2010). Map positions were obtained using the Haldane mapping function in the Onemap package of R (
Margarido et al. 2007). A two-point analysis with minimum likelihood of the odds (LOD) of 3.0 and a maximum recombination fraction of 0.5 was applied for all markers on each LG and for two polymorphic markers near the S and three polymorphic markers near the Z loci on LG 1 and 2, respectively. Marker order was obtained using the rapid chain delineation (
Doerge 1996) and the ripple algorithm (
Lander et al. 1987) in a seven marker window. The TRY algorithm was used to determine the most likely position of the remaining markers on each LG. MapChart v2.2 (
Voorrips 2002) was used to generate graphs for each LG.
Chi-square tests for goodness of fit were used to compare observed phenotypic data and expected segregation under the same four models proposed at the phenotypic level. All markers with a p-value <0.05 were considered significantly different from expected segregation ratios.
Hypothesis testing
Single gene models
We used Model IV, which was consistent with the observed data (p-value >0.05) at the phenotypic level to test for marker-trait associations using Chi-square tests of independence. We tested for statistical associations between phenotypic segregation and any given marker on LG 3, LG 5 as well as for candidate markers at the S and Z region. Markers and phenotypes were considered associated for p-values <0.05.
RESULTS
Phenotypic data
From the 98 plants obtained initially, 18 died along the course of the experiment. Those 18 plants were generally smaller and had a lower growing rate compared to the rest of the population. Some of them died before vernalization, but the majority died during or right after vernalization. A total of 80 plants survived the vernalization process, but only 68 produced flowering tillers. The number of flowering tillers ranged from one to eight among the surviving plants (data not shown). Only 45 plants were useful for pollination tests. The remaining 23 plants had fewer than two flowering tillers, presented non-dehiscent anthers or had a low pollen shedding rate, and were not included in pollination tests. Based on the assumption of a major gene controlling SC in this population, we considered the 45 remaining F2 plants sufficient for genetic analyses.
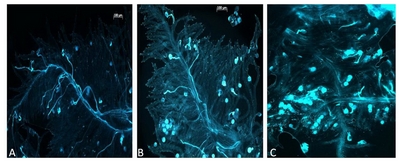
In vitro pollination tests used to assign plants to phenotypic classes showed two distinct characteristics of pollen that were used to determine SC. One is staining of the pollen grain which was bright for inhibited pollen and light for the compatible pollen. The second is the pollen tube length, which is long in the compatible case, as it has grown towards the ovary, and short in the incompatible case, as it has been arrested soon after germination. Plants with nearly 100% germinated pollen grains with long pollen tubes on self-stigma were counted as fully compatible (
Fig. 1A). Plants that showed a majority of bright pollen grains with a pollen tube smaller than the pollen grain diameter were considered semi-compatible (
Fig. 1B). Estimation of compatibility was done accounting for non-viable pollen grains that looked unstained, raisin shaped or empty. A SI reaction is shown in
Fig. 1C. Among the 45 plants, 22 were classified as fully compatible and 23 were classified as semi-compatible. No plant displayed a 100% SI phenotype, as did one of the parents of the mapping population (VrnA genotype).
Our observations fell into only two major categories, fully and semi-compatible. Chi-square tests indicated that phenotypic segregation data were inconsistent with single gene Models I, II (p<0.01), and III (p <0.05). By contrast, observed segregation data were consistent with Models IV (p >0.05) (
Table 2).
Linkage mapping resulted in markers grouped into expected linkage groups compared to the consensus map as published by
Studer et al. (2010). In terms of length, LG 3 is 13.1 cM larger than the reference map (123.6 cM). Similarly, the length of LG 5 is 10.4 cM larger compared to the 101.7 cM of the same LG in the reference map. Moreover, the marker order in LG 3 was slightly different compared to the reference map, especially for markers G07_071 and G02_075, which mapped distant from neighboring markers in the reference map. By contrast, LG5 marker order is conserved for closely linked markers with a few exceptions such as G03_052, G07_065 and G05_094, which differed from their position on the reference map (
Fig. 2). Genetic linkage maps for LG 1 and LG 2 were only created to determine marker order and distance for the candidate regions for S and Z, respectively. Their lengths were shorter than the reference map.
All the candidate markers at S and Z were significantly different from a 1:2:1 expectation for co-dominance (p<0.05,
Table 3). Moreover, all markers at S and Z were lacking one homozygote class, except for SBH2. This suggests that markers may be dominant inherited. However, only SBC1 and ZB2 were consistent with that mode of inheritance. The remaining markers at Z segregated consistent with model IV, the model that was consistent with the observed phenotypic segregation (see
Table 2).
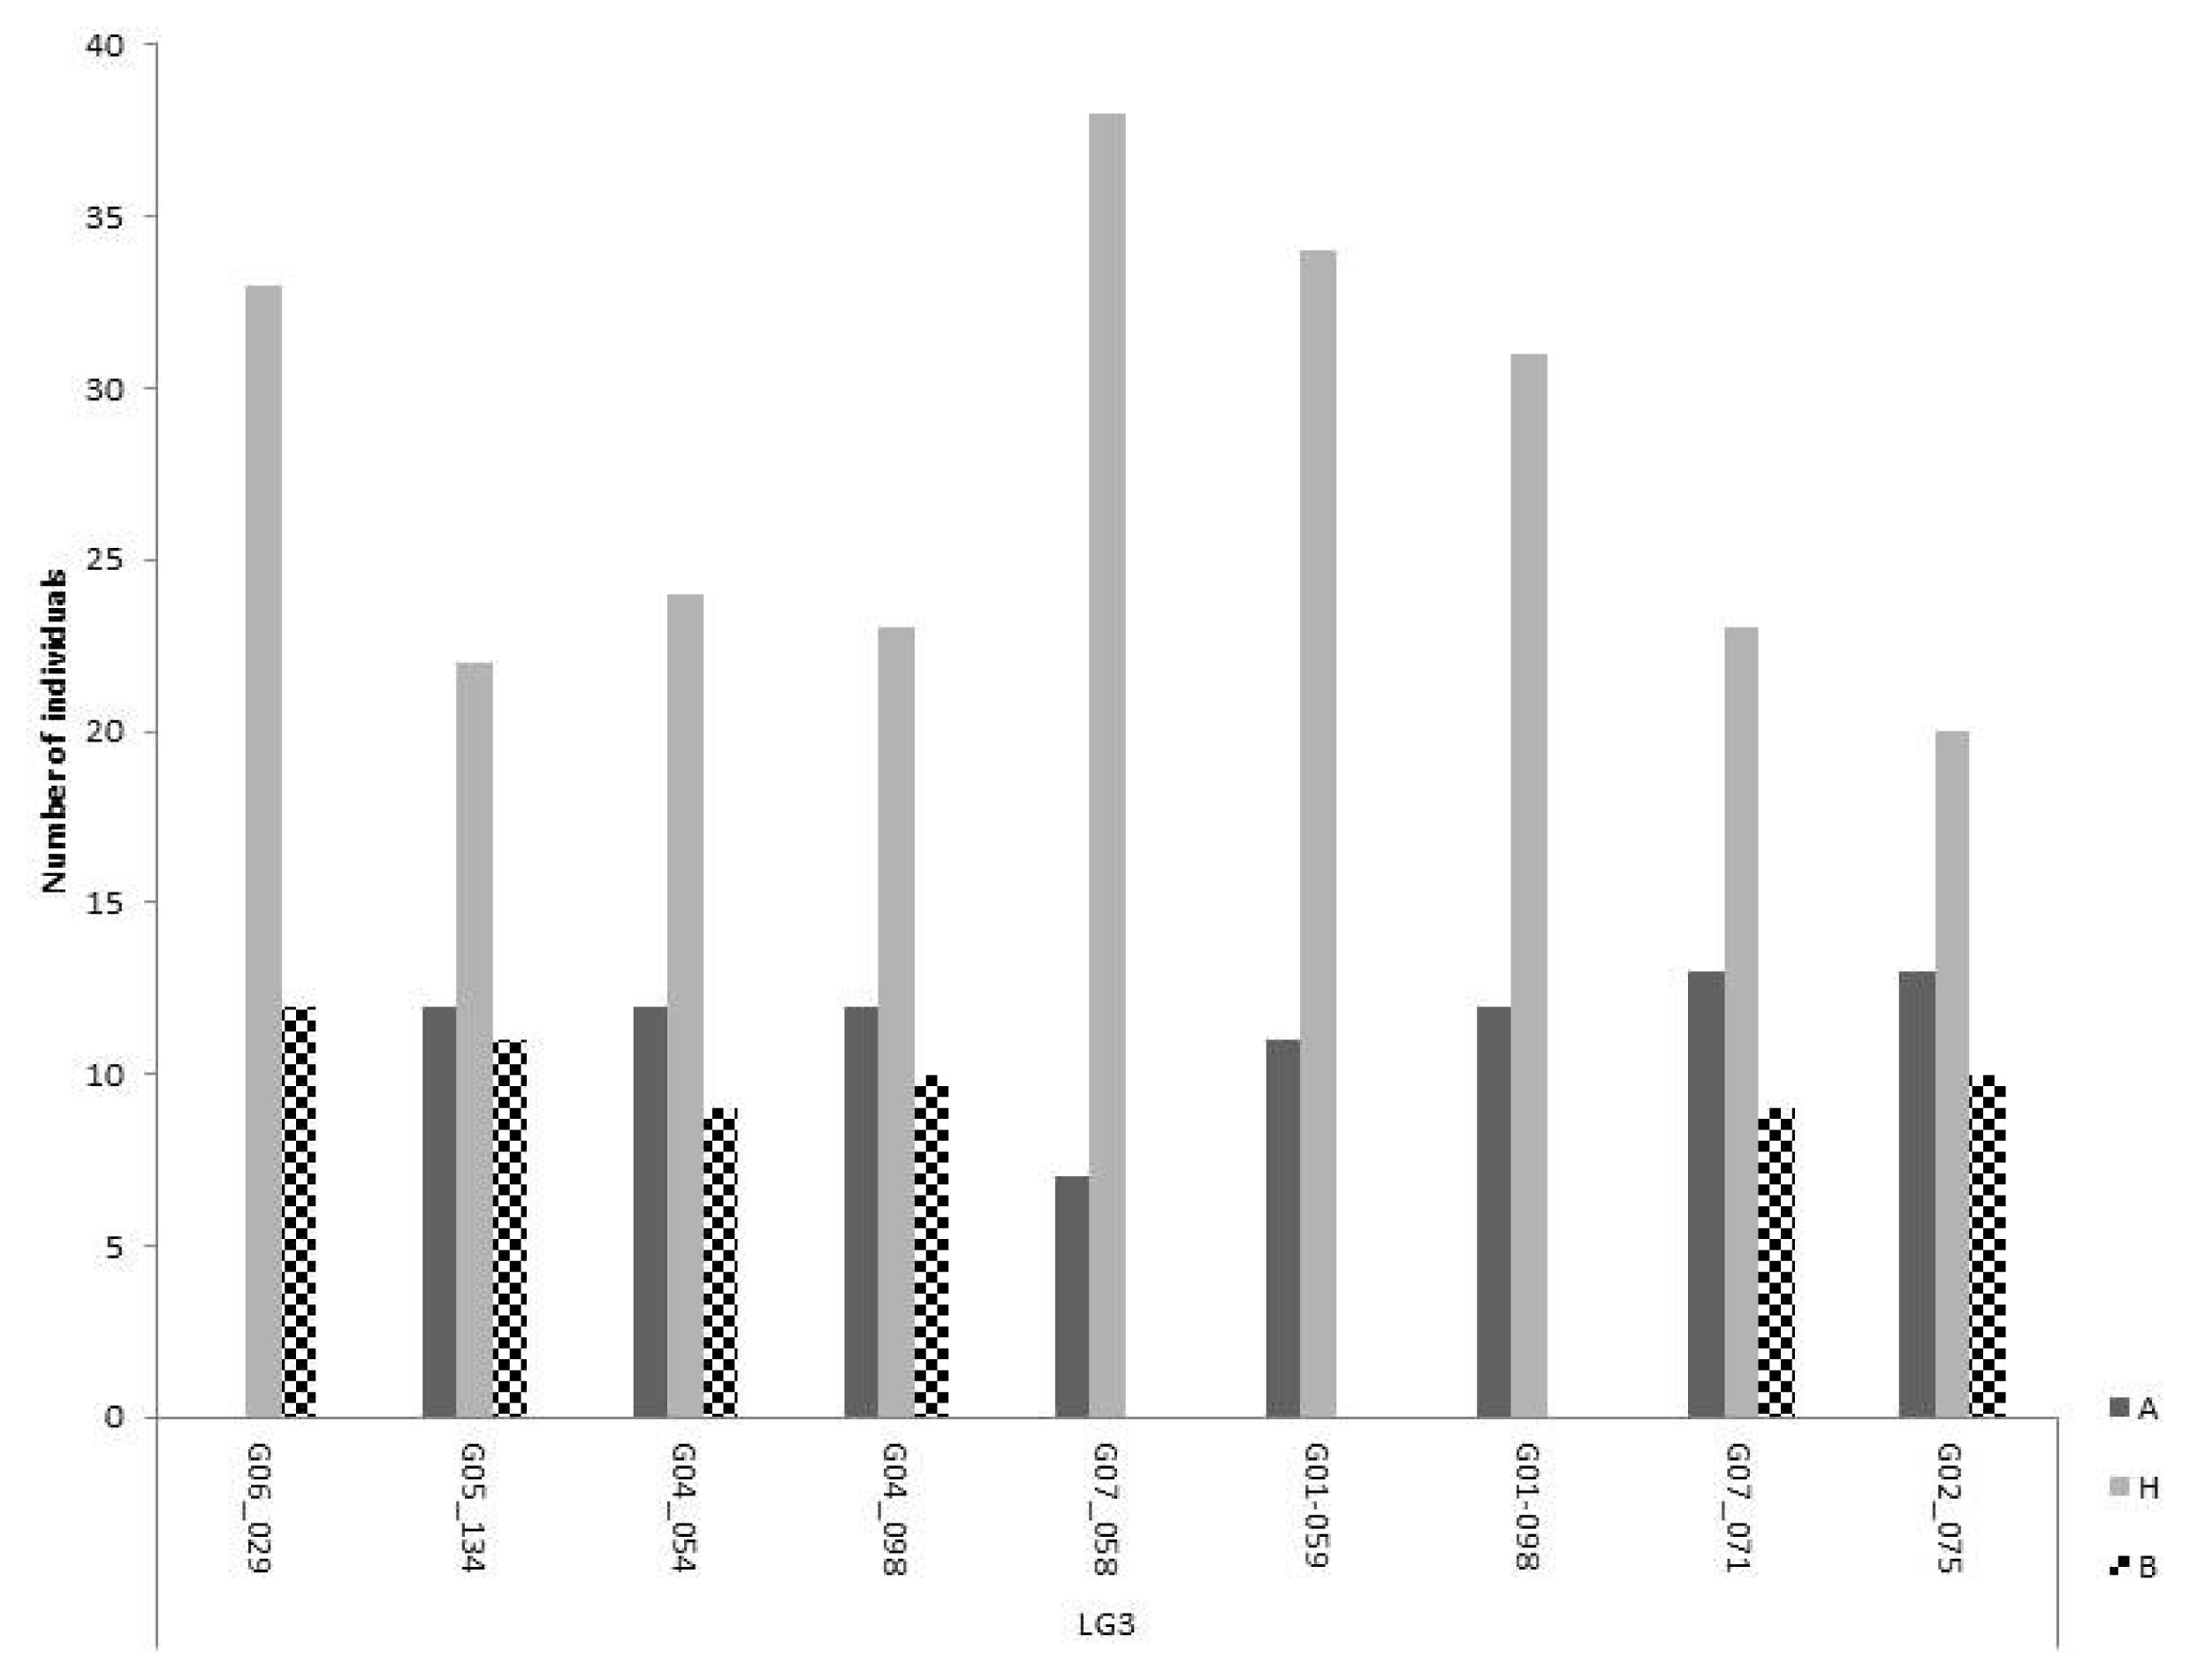
Close to 50% of the markers on LG 3 were significantly distorted from the expected 1:2:1 ratio for co-dominance. However, most of the markers that were considered distorted from a 1:2:1 segregation ratio fitted the dominant inheritance Model II, or the lethality Model III. Most markers showed all expected genotypic classes, some of them distorted from expectation but still present (
Fig. 3). However, there is a region of approximately 40 cM between markers G07_058 and G01_098, with one of the homozygote classes completely missing (
Fig. 3).
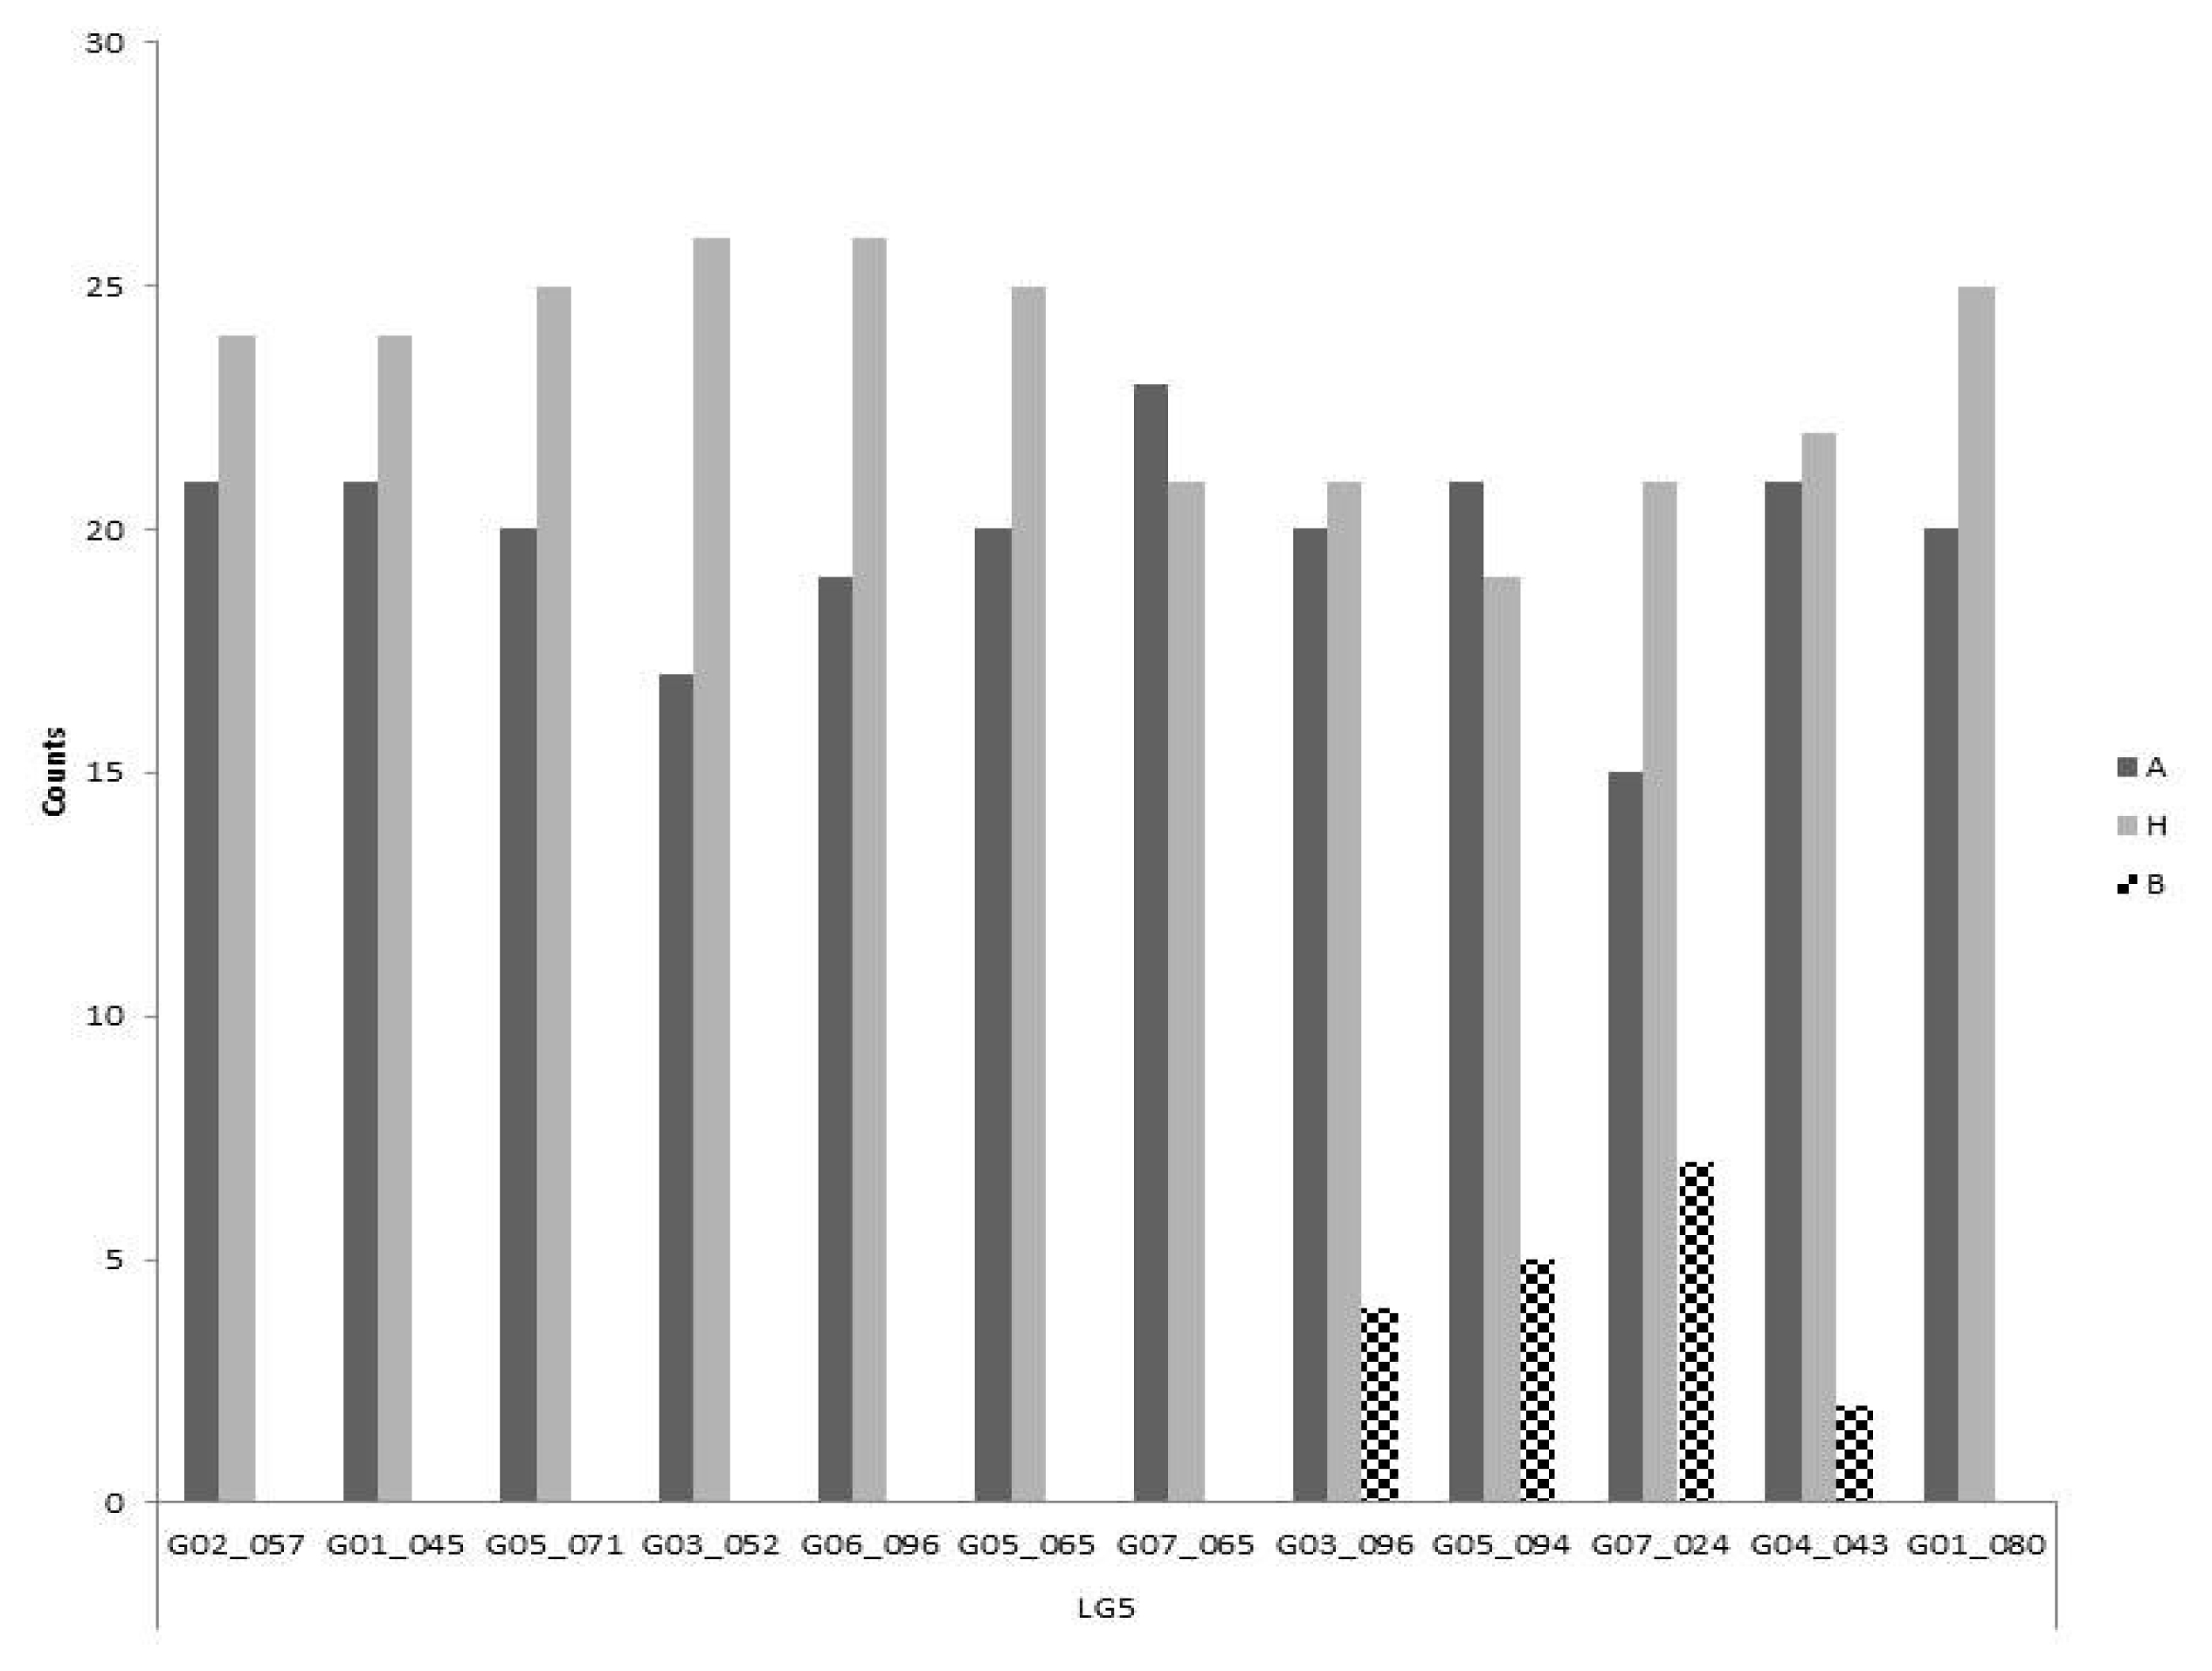
By contrast, all markers except one differed significantly on LG 5 from both the expected ratios for co-dominant (1:2:1) and dominant marker segregation (3:1) (p<0.05). Furthermore, there is a clear absence of one homozygote class for all markers except G03-096, G05-094, G07-024 and G04-043 (
Fig. 4) which behave as codominant markers. The remaining markers had a similar frequency in the other two genotypic classes.
Even though the candidate markers for S and Z showed clear segregation distortion from the 1:2:1 model, marker segregation was not associated with phenotypic segregation. Both markers for S and the three markers for Z were independent from the phenotypic observations (
Table 5) (p >0.05).
Markers with only two genotypic classes on LG 3 were not consistent with observed phenotypic segregation ratios (
Table 5). For markers on LG 5, a region of approximately 14 cM between the markers G05-071 and G05-065 was significantly associated with the phenotypic classification (
Table 5).
DISCUSSION
In this study, we considered two linkage groups of interest for self-compatibility and also used markers for the S and Z loci to unravel interactions between these loci in relation to self-compatibility.
Population size, genetic map and segregation distortion
In our study, map lengths were slightly different than the ones obtained for the reference map (
Studer et al. 2010). The small population size obtained for this research resulted from the presence of non-dehiscent anthers, which was also observed by
Thorogood et al. (2005). In addition to this limitation, our population exhibited a high mortality rate that may be caused by recessive lethality genes segregating in the population.
There have been several reports of segregation distortion for this linkage group 3 in different mapping populations and it has been suggested that it may be associated with a SC locus (
Armstead et al. 2008). However, we were not able to statistically associate any marker in this linkage group to SC. The great amount of unexplained distortion can be due to LD between markers in LG3 and LG5. Additional analysis show that there is correlation between markers in both linkage groups ranging from r=0 to 0.49 and that markers G05-134, G04-054, G04-098, G07-058, G01-059 and G01-098 in LG3 are statistically associated with markers G02-057, G05-071, G03-052, G06-096, G05-065, G07-065 and G01-080 in LG5 (r=0.27 to 0.49 pvalue<0.05).
Comparative genetics of map regions involved in flowering and fertility show that those regions are distributed over all linkage groups (
Armstead et al. 2008). Therefore, the analysis of related traits, i.e., self-compatibility is always confounded with the effects of these regions as well as with the effect of both self-incompatibility loci. The segregation distortion observed in both linkage groups 3 and 5 is in agreement with observations obtained in other mapping populations in perennial ryegrass (
Anhalt 2008).
The markers with a significant association with the phenotype (p<0.05) are located between 19.6 and 33.3 cM on chromosome 5 and are flanked by markers G01-054 and G07-065. This region of approximately 14 cM is the most likely position for the SC loci in this population. Moreover, as there are four markers in this interval (G05-071, G03-052, G06-096 and G05-065) it is possible that there is more than a single SC locus on LG5. Thus, we refer to the SC haplotype.
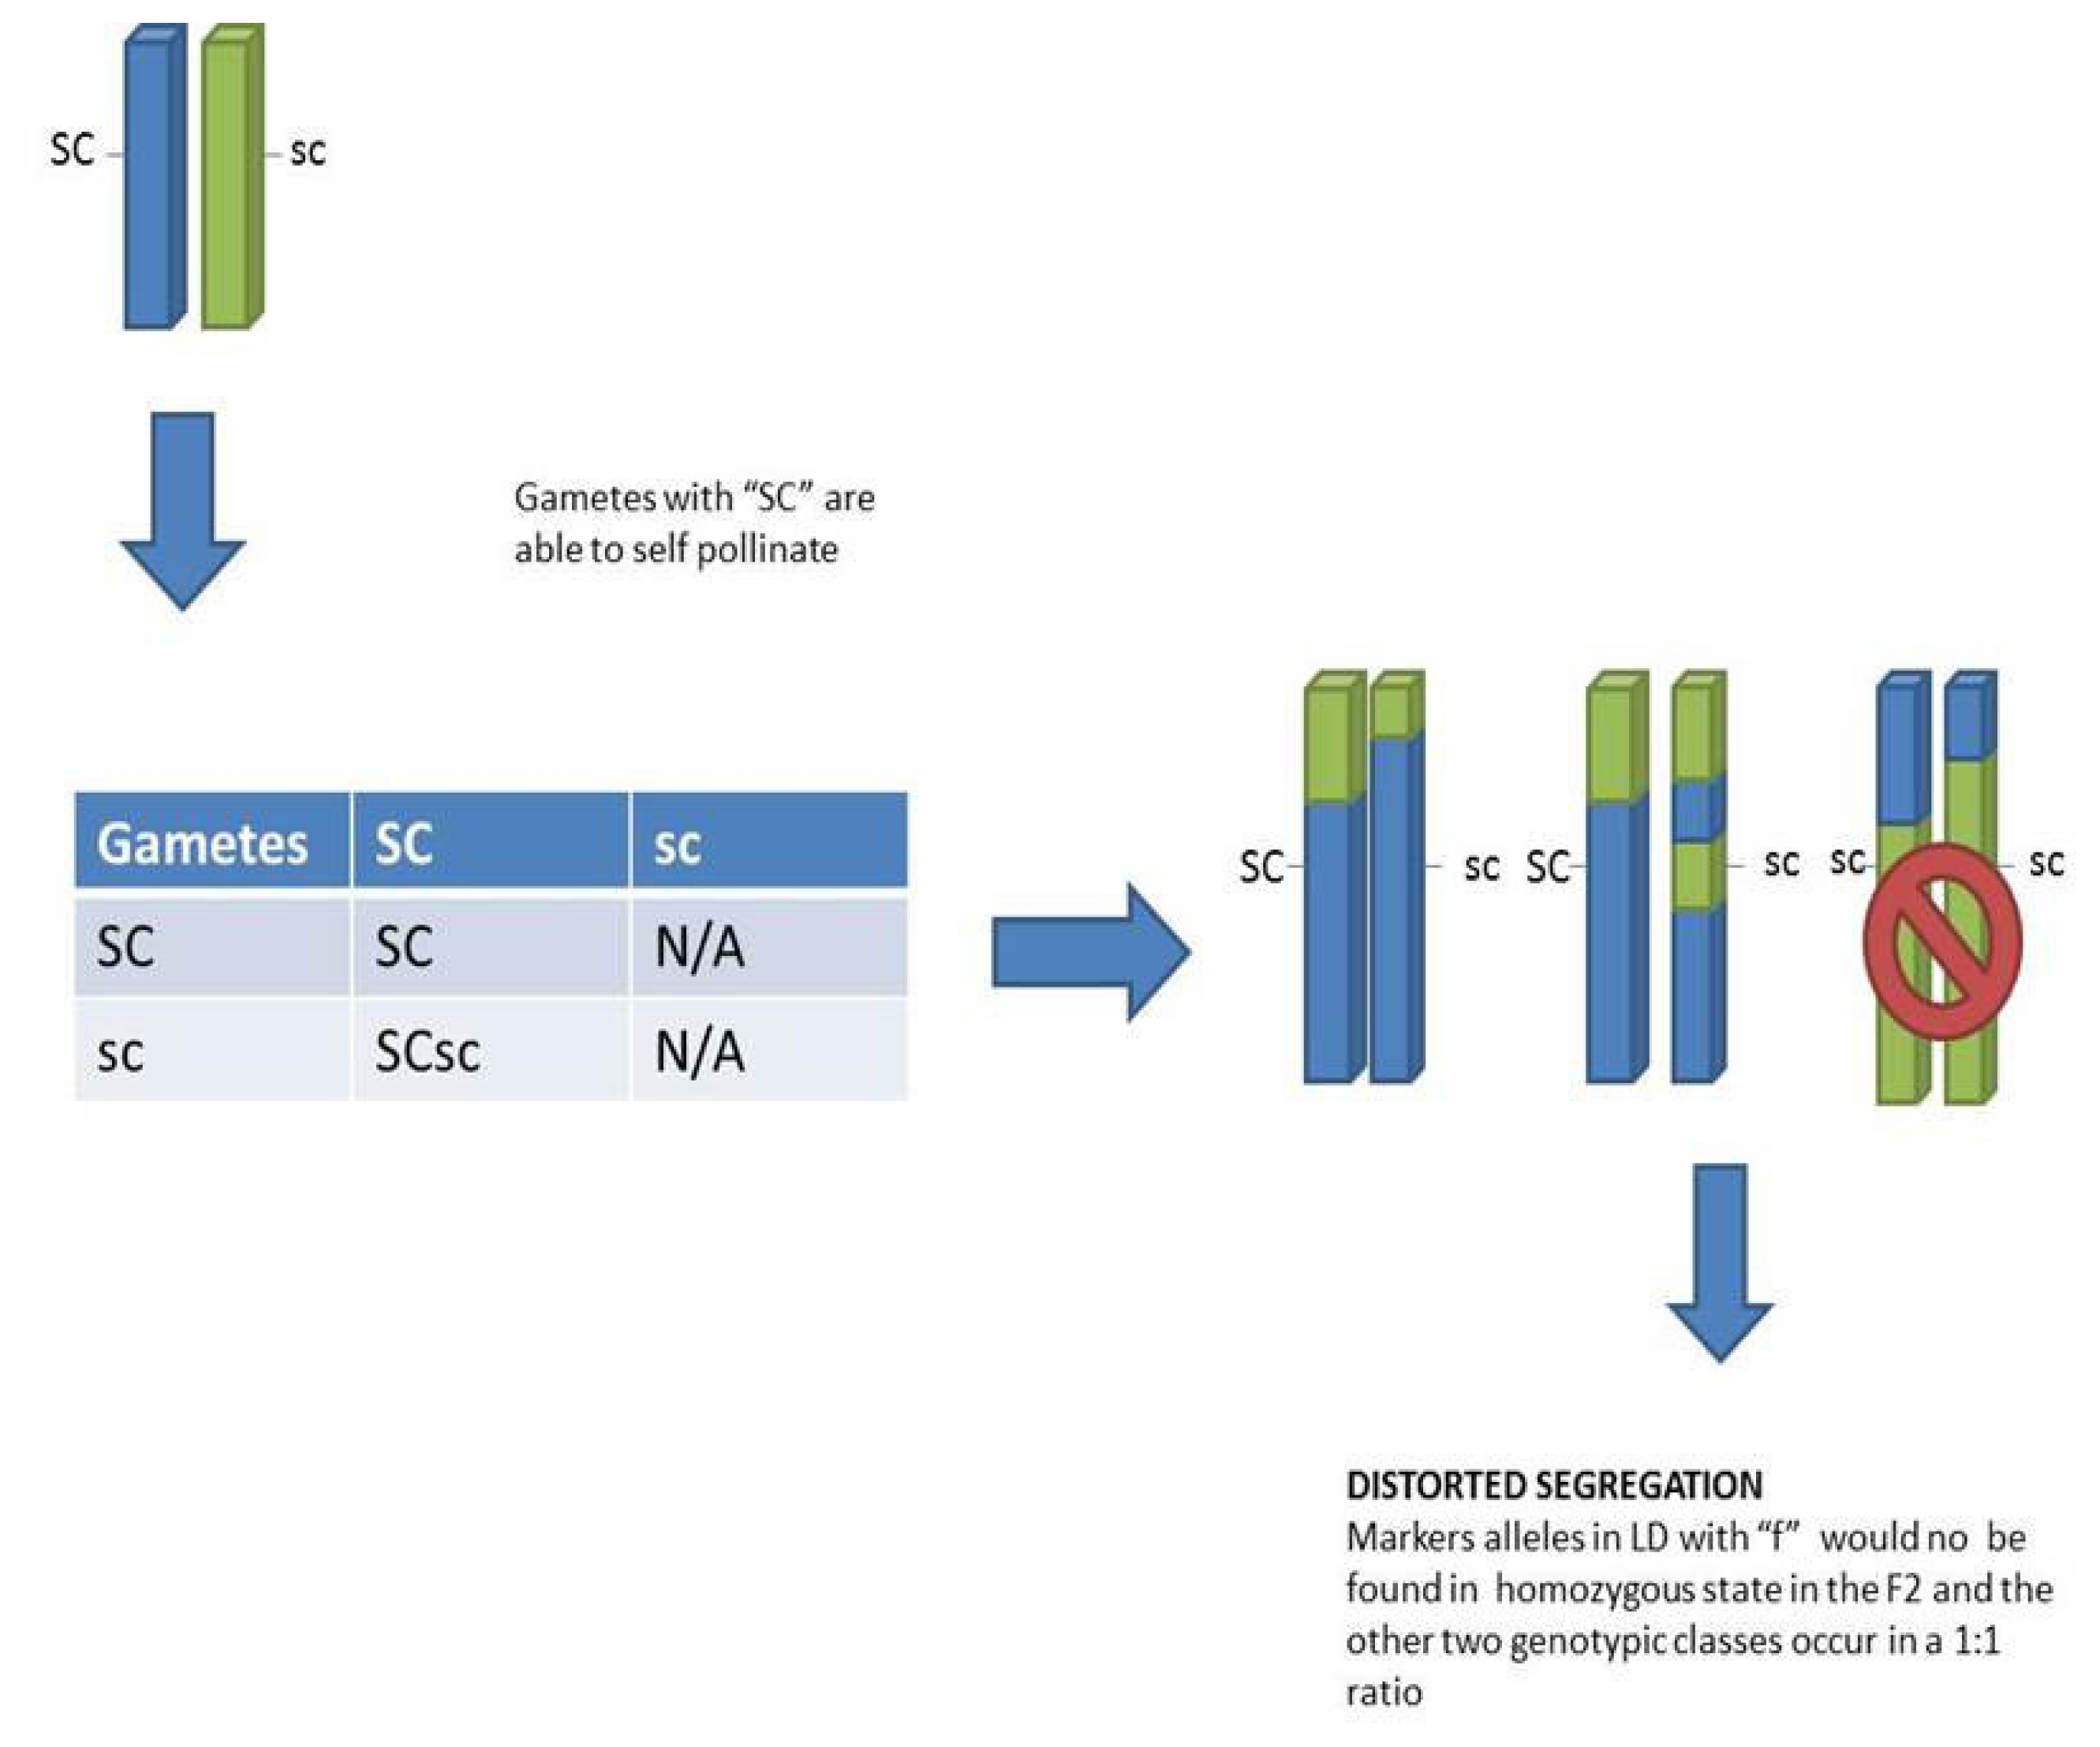
In a model with fully functional self-incompatibility, no progeny are expected after selfing. By contrast, in this study there was a substantial number of SC F2 plants with seed set, and there was no distortion of S or Z markers genotypes in the resulting F2. Our observations provide evidence of a single region on LG 5 controlling SC but with more than one significant marker. The region show a dominant gene action with epistastic effects over S and Z, as there is no SI in case of presence of at least one dominant SC haplotype. We were not able to recover any genotype without at least one SC haplotype. Since up to now our SC gene or genes have not been fine mapped in any population and given the evidence of a few markers with a high correlation to the phenotype, more work is needed to narrow down the candidate genes.
Most likely the SC determinant(s) show gametophytic expression, since all progeny derived from a single F1 plant and selfed F2 genotypes showed two different phenotypic classes (half and fully fertile). In contrast to that, if the expression would have been sporophytic, all homozygous SCSC and heterozygous SCsc progeny would be expected to have the same genotype.
Gametes probably on the male side carrying the recessive alleles (sc) are likely less competitive compared to gametes carrying the dominant (SC) allele. This insufficiency in the gametes carrying the recessive allele explains the underrepresentation of homozygous recessive individuals in the F
2 (
Fig. 5). This distortion can be extended to neighboring markers on linkage group 5, where the SC gene or genes are located.
The distortion observed in LG5 was also reported and attributed to self-compatibility in a previous study (
Thorogood et al. 2005). As expected distortion of markers in LG5 covers a large region including one of the distal ends of the linkage group. It is also noticeable that the distortion increases closer to the SC region and decreases for markers that map further away. This extended distortion may be explained by the large LD blocks present in an F
2 population. However, the high LOD scores obtain for markers in the 32.3 and 33.3 cM region provide evidence that at least one major SC gene is located in this region. The position of this major SC locus in our study differs from the location of the SC locus T reported by
Thorogood et al. (2005), who found a significant QTL (LOD 6.08) for a marker at 19.8 cM. Unfortunately, due to different markers used in the previous study, it is not possible to assess the difference in position between their QTL and our significant markers. To reach further confirmation, new HRM markers need to be designed or an allelism test need to be performed to confirm whether it is the same gene.
The segregation of S and Z markers showed that there are no effects of the SI haplotypes on self-fertility. In the study by
Thorogood et al. (2005) a slight evidence of interaction between a combination of marker genotypes at the SC loci and a marker in the S region was reported. However, this marker combination did not predict the phenotype a hundred percent of the times (
Thorogood et al. 2005). With the present study we corroborated that there is no marker combination between the linked marker for SC and the SI linked marker able to predict the phenotype. Therefore, it is possible to say that the presence of a single SF allele overrides the effect of the SI loci. Nevertheless, despite the absence of an association at the genotypic level, it is possible that the SC determinant interacts with the products of S and Z either by forming complexes or destroying them to present the effective functionality of the SI system.
In species with a single SI gene, the most common source of SC is a mutation and, therefore, a loss of function SI allele. In grasses, at least three different sources have been identified. One locus named T in
Phalaris coerulescens (
Hayman and Richter 1992). In rye there are two mutations directly related to S and Z and an additional locus in chromosome 5 that is also a source of SC (
Fuong et al. 1993). Both studies provide evidence that there are genes in other species independent of S and Z that can contribute to self-compatiblity.
This study renders a potential new source of SC that can be used as a starting point to understand the interaction between SI and SC genes. The understanding of this interaction is crucial to enable the use of SC genes in a line development program.
For instance, it is possible to use SC haplotypes to develop inbred lines. However, at the end the SC haplotype would be fixed and limit the ability to use SI for hybrid seed production (
Arias Aguirre et al. 2011). Therefore it is important to broaden the understanding of the interaction between the SC and SI loci.
The population used in this study is a potential new source of SC haplotype that can be introgressed to different genetic backgrounds with different S and Z haplotypes to better understand the interaction between these loci.
Fig. 1In vitro pollination tests for pollen-stigma interaction. A) Fully compatible reaction after self-pollination, B) is showing a semi-compatible reaction, C) an incompatible reaction showing pollen grain stained and short pollen tubes.

Fig. 2Genetic linkage maps for markers on linkage groups 1, 2, 3, and 5 in the F2 population. For linkage groups 1 and 2, only the genetic distances between candidate markers are given.
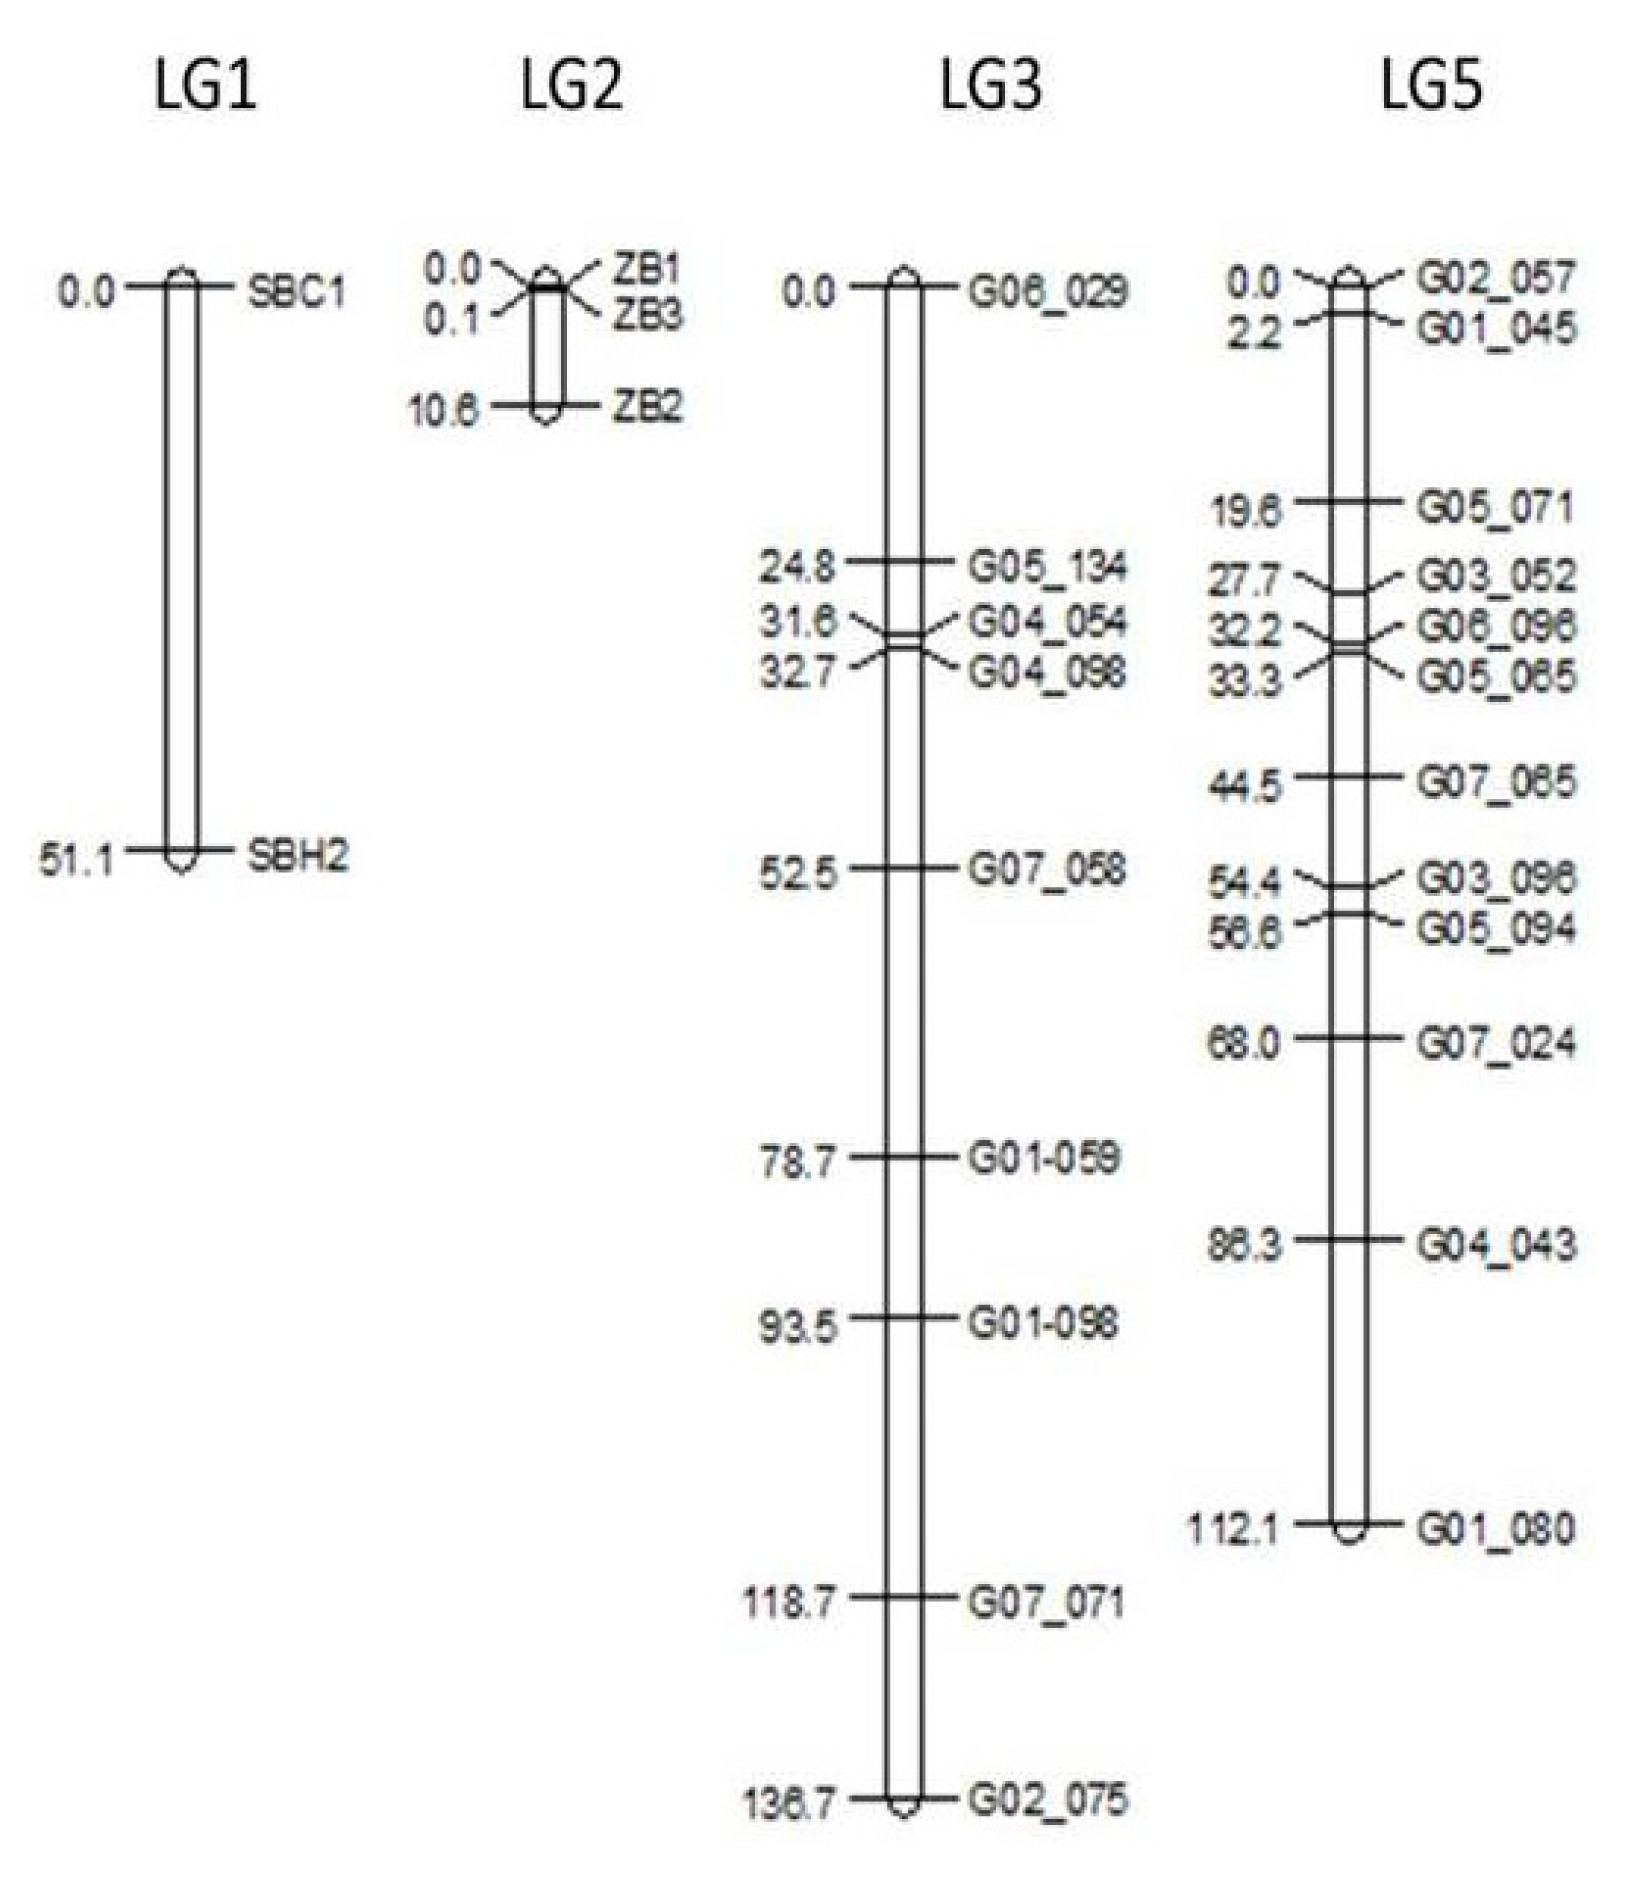
Fig. 3Segregation of polymorphic markers on linkage group 3. Markers are shown in ascending order of their chromosome position. The three bars for each marker are representing the two homozygous and the heterozygous class. The most abundant homozygous class (A) comes from the self-compatible line.

Fig. 4Segregation of polymorphic markers on linkage group 5. Markers are shown in ascending order of their chromosome position. The three bars for each marker are representing the two homozygous and the heterozygous classes. The most abundant homozygous class (A) comes from the self-compatible line.

Fig. 5Proposed gene action model. There is gametic selection against male gametes carrying the “sc” alleles therefore “scsc” genotypes do not exist in F2. As a result alleles in LD with “sc” will be distorted and they behave as 1:1 segregation at the phenotypic level.

Table 1Markers used for mapping of chromosome regions affecting self-compatibility. Markers are organized by name, linkage group, and reference for sequence information.
Table 1
|
Marker names |
Linkage group |
|
SBA, SBF, SBC1, SBH2 |
1a
|
|
ZB1, ZB2, ZB3 |
2b
|
|
G06-029, G05-134, G04-054, G04-098, G07-058, G01-059, G01-098, G07-071, G02075 |
3c
|
|
G02-057, G01-045, G05-071, G03-052, G06-096, G05-065, G03096, G07-065, G05-094, G07-024, G04-043, G01-080 |
5c
|
Table 2Observed and expected counts used in chi-square test for goodness of fit for different one gene models. P >0.05 means there is no significant difference between the observed and expected segregation.
Table 2
|
Phenotypic Class |
Observed counts |
Model I |
Model II |
Model III |
Model IV |
|
|
1:2:1 |
3:1 |
2:1 |
1:1 |
|
Fully compatible |
22 |
11.25 |
33.75 |
30 |
22.5 |
|
Half incompatible |
23 |
22.5 |
15 |
22.5 |
|
Incompatible |
- |
11.25 |
11.25 |
N/A |
N/A |
|
|
P<0.001 |
P<0.001 |
p=0.0114 |
p=0.88 |
Table 3Deviation from expected segregation ratios under the four single gene models. Significance is shown at the 0.05 level.
Table 3
|
Marker |
Chromosome |
Model I |
Model II |
Model III |
Model IV |
|
|
1:2:1 |
3:1 |
2:1 |
1:1 |
|
SBC1 |
1 |
S |
NS |
NS |
S |
|
SBH2 |
1 |
S |
S |
S |
S |
|
ZB1 |
2 |
S |
S |
S |
NS |
|
ZB3 |
2 |
S |
S |
S |
NS |
|
ZB2 |
2 |
S |
NS |
NS |
S |
Table 4Deviation from expected segregation ratios under four single gene models. Significant differences are shown at p = 0.05 level.
Table 4
|
Model I |
Model II |
Model III |
Model IV |
|
Marker |
1:2:1 |
3:1 |
2:1 |
1:1 |
|
G06_029 |
S |
NS |
NS |
S |
|
G05_134 |
NS |
S |
S |
S |
|
G04_054 |
NS |
S |
S |
S |
|
G04_098 |
NS |
S |
S |
S |
|
G07_058 |
S |
NS |
S |
S |
|
G01-059 |
S |
NS |
NS |
S |
|
G01-098 |
S |
NS |
NS |
S |
|
G07_071 |
NS |
S |
S |
S |
|
G02_075 |
NS |
S |
S |
S |
Table 5Test for independence between marker segregation and phenotypic segregation for markers in all linkage groups.
Table 5
|
Linkage group |
Marker |
genotype |
Half Compatible |
Full Compatible |
P value |
|
1 |
SBC1 |
A |
4 |
5 |
0.94 |
|
H |
19 |
17 |
|
SBH2 |
A |
6 |
5 |
0.99 |
|
H |
4 |
5 |
|
B |
13 |
12 |
|
|
2 |
ZB1 |
A |
12 |
11 |
0.88 |
|
H |
11 |
11 |
|
ZB3 |
A |
12 |
11 |
0.88 |
|
H |
11 |
11 |
|
ZB2 |
A |
7 |
7 |
0.82 |
|
H |
16 |
15 |
|
|
3 |
G07_058 |
A |
5 |
2 |
0.44 |
|
H |
18 |
20 |
|
G01-059 |
A |
7 |
4 |
0.52 |
|
H |
16 |
18 |
|
G01_098 |
A |
7 |
5 |
0.66 |
|
H |
14 |
17 |
|
|
5 |
G02_057 |
A |
8 |
13 |
0.18 |
|
H |
15 |
9 |
|
G01_045 |
A |
8 |
13 |
0.18 |
|
H |
15 |
9 |
|
G05_071 |
A |
6 |
14 |
0.03** |
|
H |
17 |
8 |
|
G03_052 |
A |
3 |
14 |
0.002* |
|
H |
18 |
8 |
|
G06_096 |
A |
3 |
16 |
0.0002* |
|
H |
20 |
6 |
|
G05_065 |
A |
4 |
16 |
0.0006* |
|
H |
19 |
6 |
|
G07_065 |
A |
9 |
14 |
0.23 |
|
H |
13 |
8 |
|
G03_096 |
A |
6 |
14 |
0.06 |
|
H |
13 |
8 |
|
B |
4 |
0 |
References
- Anhalt UCM. 2008. Segregation distortion in Lolium: evidence for genetic effects. Theor Appl Genet. 117: 297-306.
- Arias Aguirre A, Studer B, Frei U, Lubberstedt T. 2011. Prospect for hybrid breeding in bioenergy grasses. Bio-Energy Res. 5: 10-19.
- Armstead IP, Turner LB, Marshall AH, Humphreys MO, King IP, Thorogood D. 2008. Identifying genetic components controlling fertility in the outcrossing grass species perennial ryegrass (Lolium perenne) by quantitative trait loci analysis and comparative genetics. New phytol. 178: 559-571.
- Doerge RW. 1996. Constructing genetic maps by rapid chain delineation. J Agric Genomics. 2.
- Fuong F, Voylokov A, Smirnov V. 1993. Genetic studies of self-fertility in rye (Secale cereale L.). 2. The search for molecular marker genes linked to self-incompatibility loci. Theor Appl Genet. 87: 619-623.
- Hayman DL, Richter J. 1992. Mutations affecting self-incompatibility in Phalaris coerulescens Desf. (Poaceae). Heredity. 68: 495-503.
- Jensen LB, Andersen JR, Frei U, Xing Y, Taylor C, Holm PB, Lübberstedt T. 2005. QTL mapping of vernalization response in perennial ryegrass (Lolium perenne L.) reveals co-location with an orthologue of wheat VRN1. Theor Appl Genet. 110: 527-536.
- Kho YO, Baer J. 1968. Observing pollen tubes by means of fluorescence. Euphytica. 17: 298-302.
- Lander ES, Green P, Abrahamson J, Barlow A, Daly MJ, Lincoln SE, Newburg L. 1987. MAPMAKER: An interactive computer package for constructing primary genetic linkage maps of experimental and natural populations. Genomics. 1: 174-181.
- Liu L, Wu Y. 2012. Identification of a selfing compatible genotype and mode of inheritance in switchgrass. Bio-Energy Res. 5: 662-668.
- Lundqvist A. 1961. A rapid method for the analysis of incompatibility in the grasses. Hereditas. 47: 705-707.
- Manzanares C, Studer B, Hayes R, Barth S, Thorogood D. 2011. Population genetics of the grass self-incompatibility-practical implications for grass breeding programs. Barth S, Milbourne D, editors. Breeding strategies for sustainable forage and turf grass improvement. Springer. pp. 55-62.
- Margarido GRA, Souza AP, Garcia AAF. 2007. OneMap: software for genetic mapping in outcrossing species. Hereditas. 144: 78-79.
- Martin FW. 1959. Staining and observing pollen tubes in the style by means of fluorescence. Stain Technol. 34: 125-128.
- Studer B, Kolliker R, Muylle H, Asp T, Frei U, Roldan-Ruiz I, Barre P, Tomaszewski C, Meally H, Barth S, Skot L, Armstead I, Dolstra O, Lübberstedt T. 2010. EST-derived SSR markers used as anchor loci for the construction of a consensus linkage map in ryegrass (Lolium spp.). BMC Plan Biol. 10: 177
- Studer B, Jensen L, Fiil A, Asp T. 2009. “Blind” mapping of genic DNA sequence polymorphisms in Lolium perenne L. by high resolution melting curve analysis. Mol Breed. 24: 191-199.
- Thorogood D, Kaiser WJ, Jones JG, Armstead I. 2002. Self-incompatibility in ryegrass 12. Genotyping and mapping the S and Z loci of Lolium perenne L. Heredity. 88: 385-390.
- Thorogood D, Armstead I, Turner LB, Humphreys MO, Hayward MD. 2005. Identification and mode of action of self-compatibility loci in Lolium perenne L. Heredity. 94: 356-363.
- Voorrips RE. 2002. MapChart: software for the graphical presentation of linkage maps and QTLs. J Heredity. 93: 77-78.
- Voylokov AV, Fuong FT, Smirnov VG. 1993. Genetic studies of self-fertility in rye (Secale cereale L.). 1. The identification of genotypes of self-fertile lines for the Sfalleles of self-incompatibility genes. Theor Appl Genet. 87: 616-618.
- Voylokov AV, Korzun V, Börner A. 1998. Mapping of three self-fertility mutations in rye (Secale cereale L.) using RFLP, isozyme and morphological markers. Theor Appl Genet. 97: 147-153.