Abstract
Grain development has been shown to involve a complex series of physiological and molecular events. In order to provide information on molecular events during grain development, we isolated four noble genes, HvSAMS1, 2, 3 and 4 (Hordeum vulgare S-AdenosylMethionine Synthetase1, 2, 3 and 4). The four HvSAMS genes were closely related based on peptide comparisons and sequence homologies that ranged from 89% to 99%. To determine the developmental expression of HvSAMS genes, Northern blot analysis and RT-PCR were performed with the kernels of −3 to 30 days after fertilization (DAF). The transcripts of HvSAMS1 and 3 genes peaked at −3 DAF that lasted until 7 DAF, and started to reduce at 10 DAF. A strong expression signal of HvSAMS2 was detected from −3 DAF and reached the maximum level at 3 DAF, then decreased until 30 DAF. The expression of HvSAMS4 initially elevated from −3 DAF, reaching the peak at 10 DAF, and decreased gradually until 30 DAF. The HvSAMS gene transcripts were accumulated abundantly in grains, stems and leaves. To evaluate subcellular localization molecular functions of HvSAMS1 gene, we transformed the HvSAMS1 gene into onion epidermal cell and Arabidopsis. Expression of HvSAMS1 recognized by 35S::HvSAMS1::GFP was detected in the nucleus and slightly in the cytosol, whereas 35S::GFP expressed throughout the cell. The transgenic lines showed slightly early germination on MS-medium containing 1 μM GA3 coupled with accelerated extension of bolts. The HvSAMS genes were dominantly expressed in grains during grain development (3 DAF). The HvSAMS genes showed various transcript accumulations in response to the abiotic stresses and exogenous application of phytohormones. Especially, HvSAMS genes were regulated by exogenous GA3. The subcellular localization of HvSAMS1 and histochemical localization of HvSAMS2 promoter provided opportunities to elucidate their possible cellular functions. The phenotypic attributes displayed by HvSAMS1 overexpressing transgenic plants suggested the role of HvSAMS1 in the germination and GA3 response mechanism.
-
Key words: Barley, Eam10, Differential expression, S-adenosylmethione synthetase, HvSAMS
INTRODUCTION
Developing cereal grain which consists of several organs such as embryo, endosperm, and pericarp undergoes very important processes that determine its quality and quantity. After fertilization, embryo and endosperm were developed via cell division followed by grain filling. During the grain filling process, cellularization, differentiation and deposition of protein and starch were accelerated. After completion of accumulation of storage materials followed by dehydration, the grain entered seed dormancy (
Schütz 1997). Many genes involved during dormancy cycling were profiled (
Han et al. 1999;
Cadman et al. 2006).
Colucci et al (2002) reported that overexpression of
GCR1, the G protein – coupled receptor gene, could abolish the seed dormancy.
Plants are sources of secondary metabolites that often have high value (
Belbahri. et al. 2000). Plant secondary metabolites are defined as compounds that have not exactly recognized roles in the maintenance of fundamental life processes in the plants, but they do have important roles in the interaction of the plant with its environments grown (
Oksman-Caldentey and Inzé 2004). The plant secondary metabolites are reported with poor productivity because of their extremely low level of accumulation in plants species (
Goossens et al. 2003). Plenty of secondary metabolites possess a methyl group involving S-adenosylmetionine (SAM) in the biosynthetic pathway (
Kutchan 1995;
Belbahri et al. 2000).
S-adenosylmethionine synthetase (SAMS) catalyzes the biosynthesis of S-adenosylmethionine (SAM) from ATP and L-methionine (
Cantoni 1953). As SAMS is an important methyl donor (
Schlenk and DePalma 1957), it plays a role in transmethylation of proteins, nucleic acids, polysaccarides and fatty acids. Decarboxylated SAMS serves as an aminepropyl donor in polyamine synthesis (
Kumar et al. 1997) and SAM is a precursor in the synthesis of ethylene (
Yang and Hoffman 1984). SAM was produced in the cycle of active methyl groups via S-adenosylhomocysteine hydrolase (SAHH) (
Schröder et al. 1997). SAHH hydrolyzed homocysteine and adenine from S-adenosylhomocysteine (SAH). Homocysteine was methylated by methionine synthase (MS) to yield methionine and finally regenerated SAM using SAMS (
Heim et al. 2006).
In this paper, we isolated a gene family encoding SAMS in the barley (GSHO 2504) which has a characteristic of early maturity; and their expression modes in the early stage of kernel development were evaluated. Furthermore, transcripts accumulations of the HvSAMS genes in response to the exogenous elicitors were investigated.
MATERIALS AND METHODS
Plant materials and elicitor treatment
Early maturing barley germplasm “GSHO 2504” provided by USDA-ARS, National Small Grains Research Facility, Barley Genetic Stocks Collection, was grown at the Korea University research field. Procedures for the determination of days after fertilization (DAF) and sampling of grain materials were described by
Jang et al (2003). The grain tissues used in the experiments were collected at −3, 1, 3, 7, 10, 20 and 30 DAF. Different tissue parts including grain, stem, leaf and root parts were harvested from plants at 10 DAF.
Transcriptional analyses were performed on the leaves of 4-week-old plants after spraying each with 100 μM of ABA, GA3, and spermidine, as well as ABA in combination with GA3. Each spray contained 0.05% Tween 20. For the NaCl treatment, the leaves of 4-week-old plants were sprayed with 100 mM NaCl solution with 0.05% Tween 20. For the ethephon treatment, ethephon gas was inserted into a transparent plastic bag, which was used to cover 4-week-old plants. Because ethephon releases ethylene with HCl and H3PO4, separate 4-week-old plants were treated with 10 mM HCl and 10 mM H3PO4. For the mock treatment, non-treated plants were covered with a transparent plastic bag for 24 h. In the case of mechanical wounding treatment, the leaves were pierced using a surface-sterilized needle. Treated leaves were subsequently harvested at 1, 6, 12, 24 and 48 h after each treatment except for the wounded-plant treatment which was sampled after 0.5, 1, 6, 12 and 24 h.
Isolation of HvSAMS gene family
A cDNA library was constructed from barley grains of 3 DAF and 7 DAF using Uni-ZAP XR vector (Stratagene, Cedar Creek, TX, USA) described by
Jang et al (2003). The plasmid DNAs were prepared from 800 randomly selected colonies using the QIAprep Spin Miniprep kit (Qiagen, Germantown, MD, USA). About 300 ng of individual plasmid DNA was blotted onto a positive nylon membrane (GE Osmonics, Minnetonka, MN, USA) using a 96-well vacuum dot blot apparatus (Invitrogen, Garlsbad, CA, USA). After aspiration, the membrane was washed with 2× SSC buffer for 2 min, air-dried and then fixed with UV cross-linking. In order to isolate
HvSAMS genes, total RNA extracted from 3 DAF grains was reverse-transcribed into cDNA using the First Strand cDNA Synthesis kit (Roche, Florence, SC, USA). Among the four
HvSAMS clones, one was obtained by DH analysis as described by
Lee et al (2006), while the other three were isolated using PCR amplification with gene specific primers (cDNA isolation in
Table 1). The amplified fragments were cloned into pGEM easy vector (Promega, Madison, WI, USA), and DNA sequencing analysis was performed using an ABI PRISM 310 Genetic analyzer (Applied Biosysems, Foster City, CA, USA). Amino acid homology between isolated
HvSAMS clones was analyzed using BLASTX alignment (
Altschul et al. 1997) and CLUSTAL W (
Thompson et al. 1994).
Genomic DNA was extracted from 1 g of fresh leaf tissue of barley germplasm “GSHO 2504” using a modified CTAB protocol described by
James et al (2008). A total of 10 μg of genomic DNA was digested using restriction enymes
EcoRI, or
XbaI, which do not cut the coding sequence of
HvSAMS1,
2,
3, and
4. Following digestion, genomic DNA fragments were separated by gel electrophoresis on a 0.8% (w/v) agarose gel and blotted onto a Hybond-N membrane (Amersham Pharmacia Biotech, Piscataway, NJ, USA). The full-length of
HvSAMS 1 coding sequence was amplified by PCR and purified with the QIAquik PCR purification kit (Qiagen, Germantown, MD, USA). Following amplification, the coding sequence was used as a probe for Southern blot analysis. Probe labeling, hybridization, and signal detection were performed as described by
Kim et al (2011).
Total RNA was extracted using the Trizol reagent (Invitrogen, Garlsbad, CA, USA). A total of 10 μg total RNA from each plant sample was separated on 1% (w/v) formaldehyde agarose gel, and then transferred onto a Magna charge nylon membrane (GE Osmonics, Minnetonka, MN, USA). Using the Biotin-dCTP and PCR method with each gene specific primer, the full-length cDNA, which contained 5′ and 3′ untranslated regions were labeled and used as a probe. After membrane transfer, the membrane was equilibrated in 250 mM sodium phosphate for 5 min, prehybridized with hybridization buffer [0.1 mM EDTA, 7% SDS, 250 mM sodium phosphate (pH 7.2), and 5% dextran sulfate] for 1 h at 65°C. The hybridization procedure was performed with membrane using a Biotin-labeled probe in fresh hybridization buffer for 16 h at 65°C. The hybridized membrane was washed twice with 2× SSC and 1% SDS for 5 min at room temperature, followed by washing twice with 0.1× SSC and 1% SDS for 15 min at 65°C. An additional washing procedure was carried out with 1× SSC for 5 min at room temperature. The detection procedure was performed with Southern-Light and Southern- stat system (Applied Biosystems, Foster City, CA, USA) according to manufacturer’s instruction. Analysis was done in triplicate.
RT-PCR
For RT-PCR, 5 μg of total RNA was reverse-transcribed into cDNA using the First Strand cDNA Synthesis kit (Roche, Florence, SC, USA) following the manufacturer’s instructions. The transcript of barley
Actin gene served as an endogenous expression control. The gene-specific primers for RT-PCR were designed from 5′ and 3′ UTR region of cDNA sequence of
HvSAMS1,
2,
3, and
4 (
Table 1) based on comparison of UTR sequences. The first strand cDNA product was diluted five times for use as a template for the synthesis of second strand cDNAs with gene- specific primers or
Actin primer (sense; 5′-AGACCTTC AACACCCCTGCTATGT-3′, antisense; 5′-CCAATCCA GACACTGTACTTCCTT-3′). The PCR reactions (25 μl) were denatured at 94°C for 1 min, followed by 27 cycles for
HvSAMS1,
2,
3, and
4 or 24 cycles for
Actin at 94°C for 1 min, 60°C for 45 sec, 72°C for 1 min 30 sec, and a final extension cycle of 72°C for 4 min. The PCR products were analyzed by electrophoresis on 1% agarose gel (w/v) with 1× TAE buffer and visualized by ethidium bromide staining. The set up was done in triplicate.
Genomic DNA was extracted from barley germplasm “GSHO 2504” and genome walker construction was performed as described by
Kim et al (2007) using the Universal GenomeWalker kit (Clontech, Mountain View, CA, USA). Genome walker construction was used to isolate the promoter regions of
HvSAMS 1,
2,
3, and
4 after digestion with seven restriction enzymes forming blunt end (
DraI,
EcoRV,
PvuII,
StuI,
BbrPI,
SmaI,
SnaBI). The gene-specific primers (
Table 1) were designed based on the alignment of nucleotide homology between
HvSAMS1,
HvSAMS2,
HvSAMS3, and
HvSAMS4 genomic DNA sequences. PCR products amplified from Genome walker library were cloned into the pGEM easy vector (Promega, Madison, WI, USA). After sequence analysis, the
cis-elements in each UTR region of
HvSAMS1,
2,
3, and
4 were analyzed with the BLAST alignment (
Altschul et al. 1997), PLACE Web Signal Scan (
Higo et al. 1999) and PlantCARE (
Lescot et al. 2002).
Transient GUS plasmid, pBI101::HvSAMS(−1459), pBI101::HvSAMS(−301), and pBI101::HvSAMS(−211), containing GUS reporter gene under control of the 1,459 bp, 301 bp, and 211 bp of upstream regions of
HvSAMS2 gene (
Kim et al. 2007) were introduced into the
Agrobacterium tumefaciens strain (GV3101) via freeze-thaw method as described by
Chen et al (1994).
For GFP expression vector,
HvSAMS1 cDNA that codes for the full-length HvSAMS1 protein without stop codon was amplified with 5′-TCTAGAATGGCGGCCGAGAC GTTCCT-3′ containing
XbaI (forward primer) and 5′-GGATCCGGCAGATGCCTTGTCGAACTTG-3′ containing
BamHI (reverse primer). The
35S::smGFP:: HvSAMS1 plasmid was constructed by subcloning into the 326 GFP vector (
Lee et al. 2001) after
XbaI and
BamHI digestion.
For transformation binary vector, the full-length cDNA HvSAMS1 gene under the control of maize ubiquitin promoter and first intron were subcloned into the pCAMBIA 3301 binary vector after digestion with EcoRI and HindIII.
Histochemical staining
In order to identify the localization of
HvSAMS2 expression, histochemical staining was conducted on pBI101::HvSAMS (−1459), pBI101::HvSAMS(−301), and pBI101::HvSAMS (−211). The
Arabidopsis (Col-0) transformation was performed with
A. tumefaciens (GV3101) as described by
Clough and Bent (1998). To select transformed plants, sterilized seeds were sown on kanamycin (50 mg/l) selection plates, and then allowed to grow for 1–2 weeks in a controlled environment at 22°C under 16 h light photoperiod. Some transformants were tested in a X-gluc solution {1 mg/ml X-Gluc (5-bromo-4-chloro-3-indolyl-β-D-glucuronide), 100 mM phosphate buffer, pH 7.0, 5 mM K
3[Fe(CN)
6], and 10 mM EDTA} for 16 h at 37°C. After staining, the tissues were fixed in a solution consisting of 5% formaldehyde, 5% acetic acid and 50% ethanol for 4 h at room temperature, and then cleared by sequential incubation in 60, 80, and 100% ethanol for 1 h at room temperature. Analysis was done twice.
To identify the subcellular localization of HvSAMS1, onion epidermal cells were sterilized and incubated on MS medium (
Murashige and Skoog 1962) for 1 day at 25°C without light. After incubation,
35S::smGFP::HvSAMS1 or
35S::smGFP were precipitated on 1.0 μm gold particle and bombarded by a biolistic particle delivery system, PDS-1100 (Bio-Rad, Hercules, CA, USA). After incubation of transformed onion epidermis cells for 16 h at 22°C, subcellular localization of the
35S::smGFP::HvSAMS1 or
35S::smGFP fusion constructs was monitored using a Bio-Rad MRC-1024 confocal laser scanning microscope (Bio-Rad, Hercules, CA, USA). All photographs were taken at the same magnification. Analysis was done in duplicate.
The
A. thaliana plant used in this study is descendant of Columbia (Col-0) ecotype. Plants were grown in a soil mixture (loam soil/perlite/vermiculite, 3/1/1) or on MS salt medium (
Murashige and Skoog, 1962) at 22°C, 16 h photoperiod. The recombinant plasmid was introduced into an
A. tumefaciens strain GV3101 via the freeze-thaw method (
Chen et al. 1994) which was then transformed into
A. thaliana (Col-0) following the protocol described by
Clough and Bent (1998).
Seeds collected from the transformed plants were sterilized with Clorox bleach for 5 min, and washed eight times with sterile distilled water. After surface sterilization, T
1 seeds were plated on MS medium (
Murashige and Skoog 1962) with phosphinothricin (15
μg/L) and stored at 4°C for 2 days for vernalization. The vernalized seeds were transferred to a growth chamber under a controlled environment at 22°C, 16 h photoperiod. Eight individual phosphinothricin resistant plants (T
1) were transplanted to a soil mixture (loam soil/perlite/vermiculite, 3/1/1), and T
2 seeds were harvested. The T
2 seeds were further advanced to T
3 generation.
RESULTS
Isolation and identification of HvSAMS1, 2, 3, and 4
The kernel-specific expressed genes during early stage of grain development were isolated via DH from randomly selected 800 cDNA clones. A total of 61 individual cDNA clones showed significant degree of homology to sequences registered in NCBI (
Appendix Table 1). One clone whose transcripts were highly expressed at 3 DAF kernel and showed high homology to S-adenosylmethionine synthetase was identified and designated as
HvSAMS1 (
Hordeum vulgare S-AdenosylMethionine Synthetase1). Another 3
SAMS genes were isolated from cDNA of 3 DAF kernels and designated as
HvSAMS2,
3 and
4. The cDNAs encoding
HvSAMS1,
2,
3 and
4 contained 1,185 bp, 1,185 bp, 1,185 bp and 1,191 bp open reading frames that code 394, 394, 394 and 396 amino acids, respectively (
Table 2). All
HvSAMS1,
2,
3 and
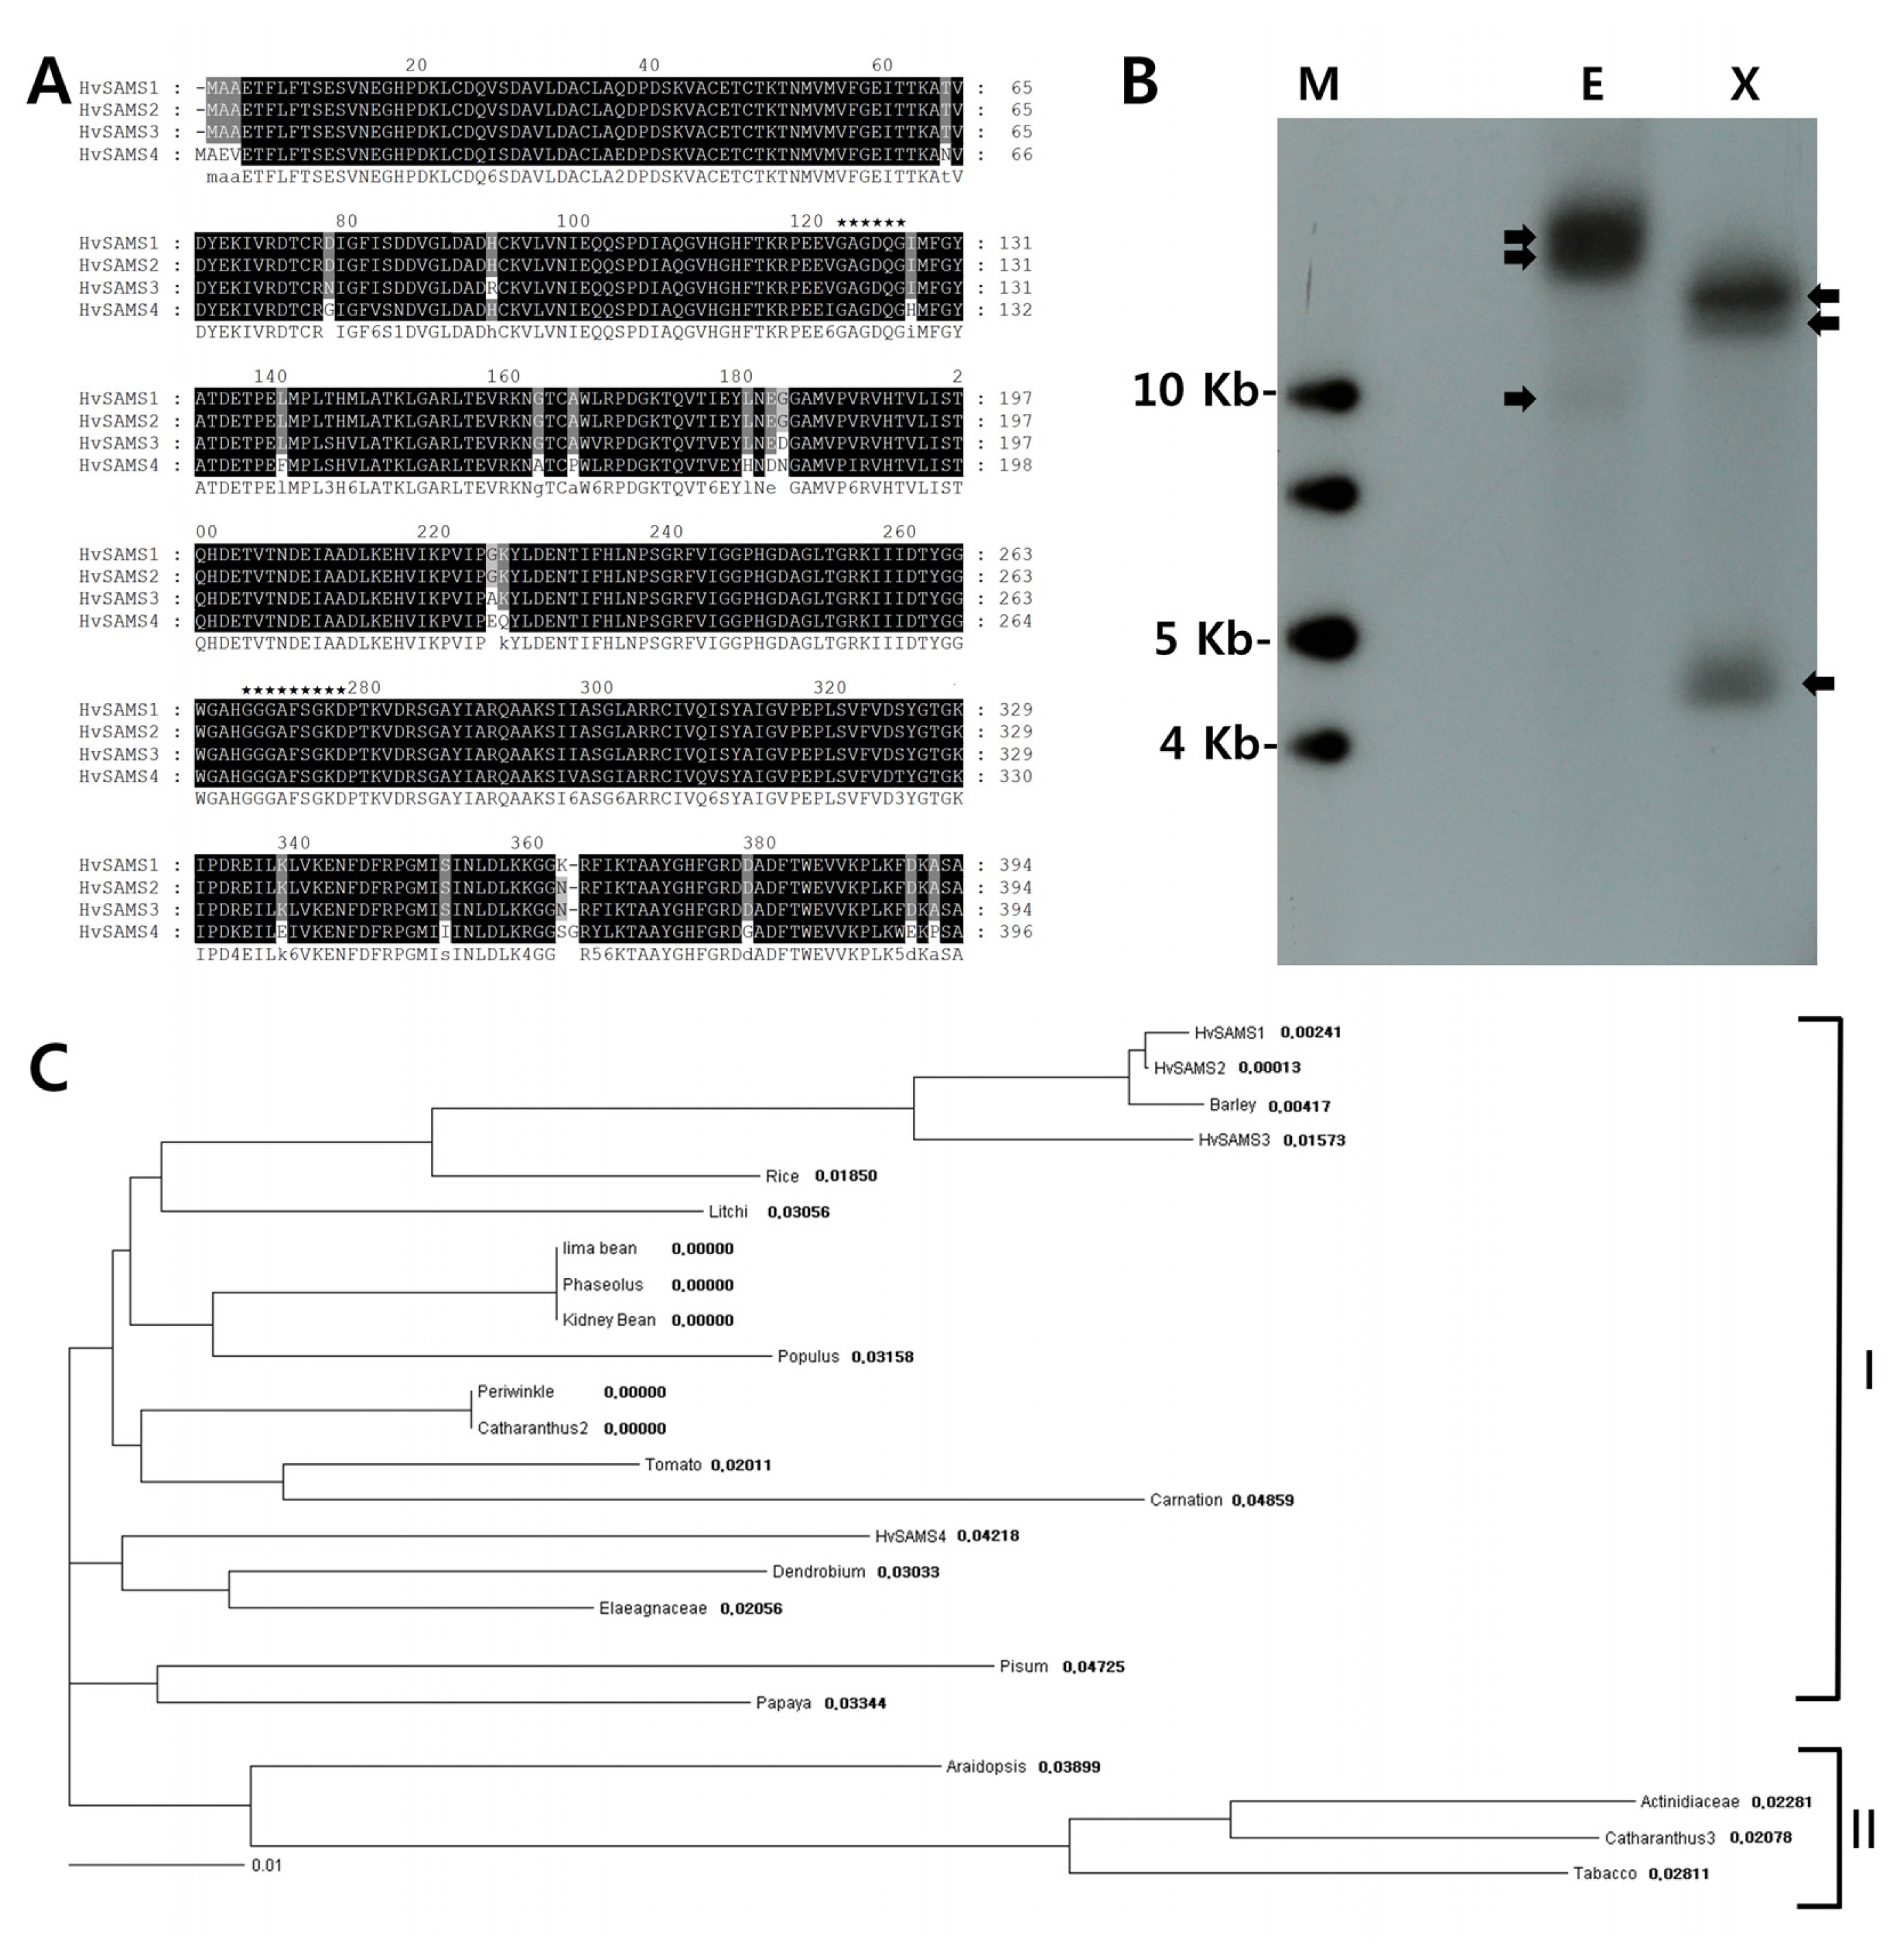
4 did not contain intron region in protein coding region. The N-terminal of all deduced HvSAMS family sequences did not contain any potential cleavage site and their predicted isoelectric points ranged from 5.40 to 5.58, and molecular weights were from 42.7 to 43.2 kDa. Amino acid sequence homologies among HvSAMS1, 2, 3, and 4 ranged from 89% to 99% (
Table 2).
HvSAMS1 and
HvSAMS2 showed the closest relationship with 99% sequence similarity with only one amino acid difference (K to N) at the 361
st amino acid position. The four deduced amino acids sequences contained highly conserved two domains. One was the ATP-binding site hexapeptide, GAGDQG, and the other was phosphate-binding P-loop, glycine-rich nonapeptide, GGGAFSGKD (
Fig. 1A). A phylogram for the phylogenetic relationship of the HvSAMS and other plant SAMS were constructed (
Fig. 1C). It could be observed that 23 SAMS proteins were clustered in two groups. HvSAMS1, 2, 3 and 4 belonged to the same group (type I).
Genomic Southern blots were performed by hybridization of
EcoRI or
XbaI digested barley genomic DNA using a
32P labeled full-length
HvSAMS1 gene as a probe. Three bands were detected with
EcoRI and
XbaI digestion (
Fig. 1B). The sizes of hybridization signals were approximately 20 kb and 10 Kb for
EcoRI digestion and approximately 14 kb, 13.5 kb and 4.5 kb for
XbaI digestion. Two hybridization signals of approximately 20 kb in size were detected in
EcoRI digestion. However, they were detected as two hybridization signals on short expose period x-ray film (data not shown).
Northern blot analysis and RT-PCR were performed using kernels at −3, 0, 3, 7, 10, 20 and 30 DAF to determine the developmental expression of
HvSAMS genes. The transcripts of
HvSAMS1 and
HvSAMS3 reached highest levels at −3 DAF which continued until 7 DAF, and then started to decrease at 10 DAF (
Fig. 2A). A strong expression of
HvSAMS2 was detected from −3 DAF which further intensified at 3 DAF, and subsequently decreased until 30 DAF.
HvSAMS4 expression was notably high from −3 DAF and reached the peak at 10 DAF, and decreased gradually until 30 DAF. Additional transcript signals were detected in northern blots for
HvSAMS1,
2 and
3 (
Fig. 2A). Except for
HvSAMS4, additional transcript signals of higher molecular size than the major transcripts of
HvSAMS1,
2 and
3 were observed. These additional detected transcripts exhibited similar expression pattern with those of
HvSAMS.
The RT-PCR was also carried out with RNA isolated from kernels at different developmental stages to confirm
HvSAMS genes expression. Because
HvSAMS genes had very high sequence homology in their open reading frame, the gene-specific primers were designed from 5′UTR and 3′UTR region (
Table 1 and
Table 2). The amplified RT-PCR products were detected at molecular sizes of 1,704 bp (
HvSAMS1), 1,328 bp (
HvSAMS2), 1,449 bp (
HvSAMS3) and 1,389 bp (
HvSAMS4).
HvSAMS transcripts predominantly accumulated at early and intermediate time points (from −3 DAF to 10 DAF) with highest accumulation frequency observed at 3 DAF. However, the additional transcript accumulations were not detected in RT-PCR analysis (
Fig. 2B).
Tissue-specific expression of
HvSAMS genes were also analyzed using tissues of grains, roots, leaves and stems at 10 DAF. The results of RT-PCR showed that the transcripts of all
HvSAMS genes accumulated abundantly in grains, stems, and leaves. The lowest transcript level was observed in the roots for all
HvSAMS genes. Expression of
HvSAMS2,
3 and
4 were similar in grains, stems and leaves, but at level relatively lower than that of
HvSAMS1 (
Fig. 2C).
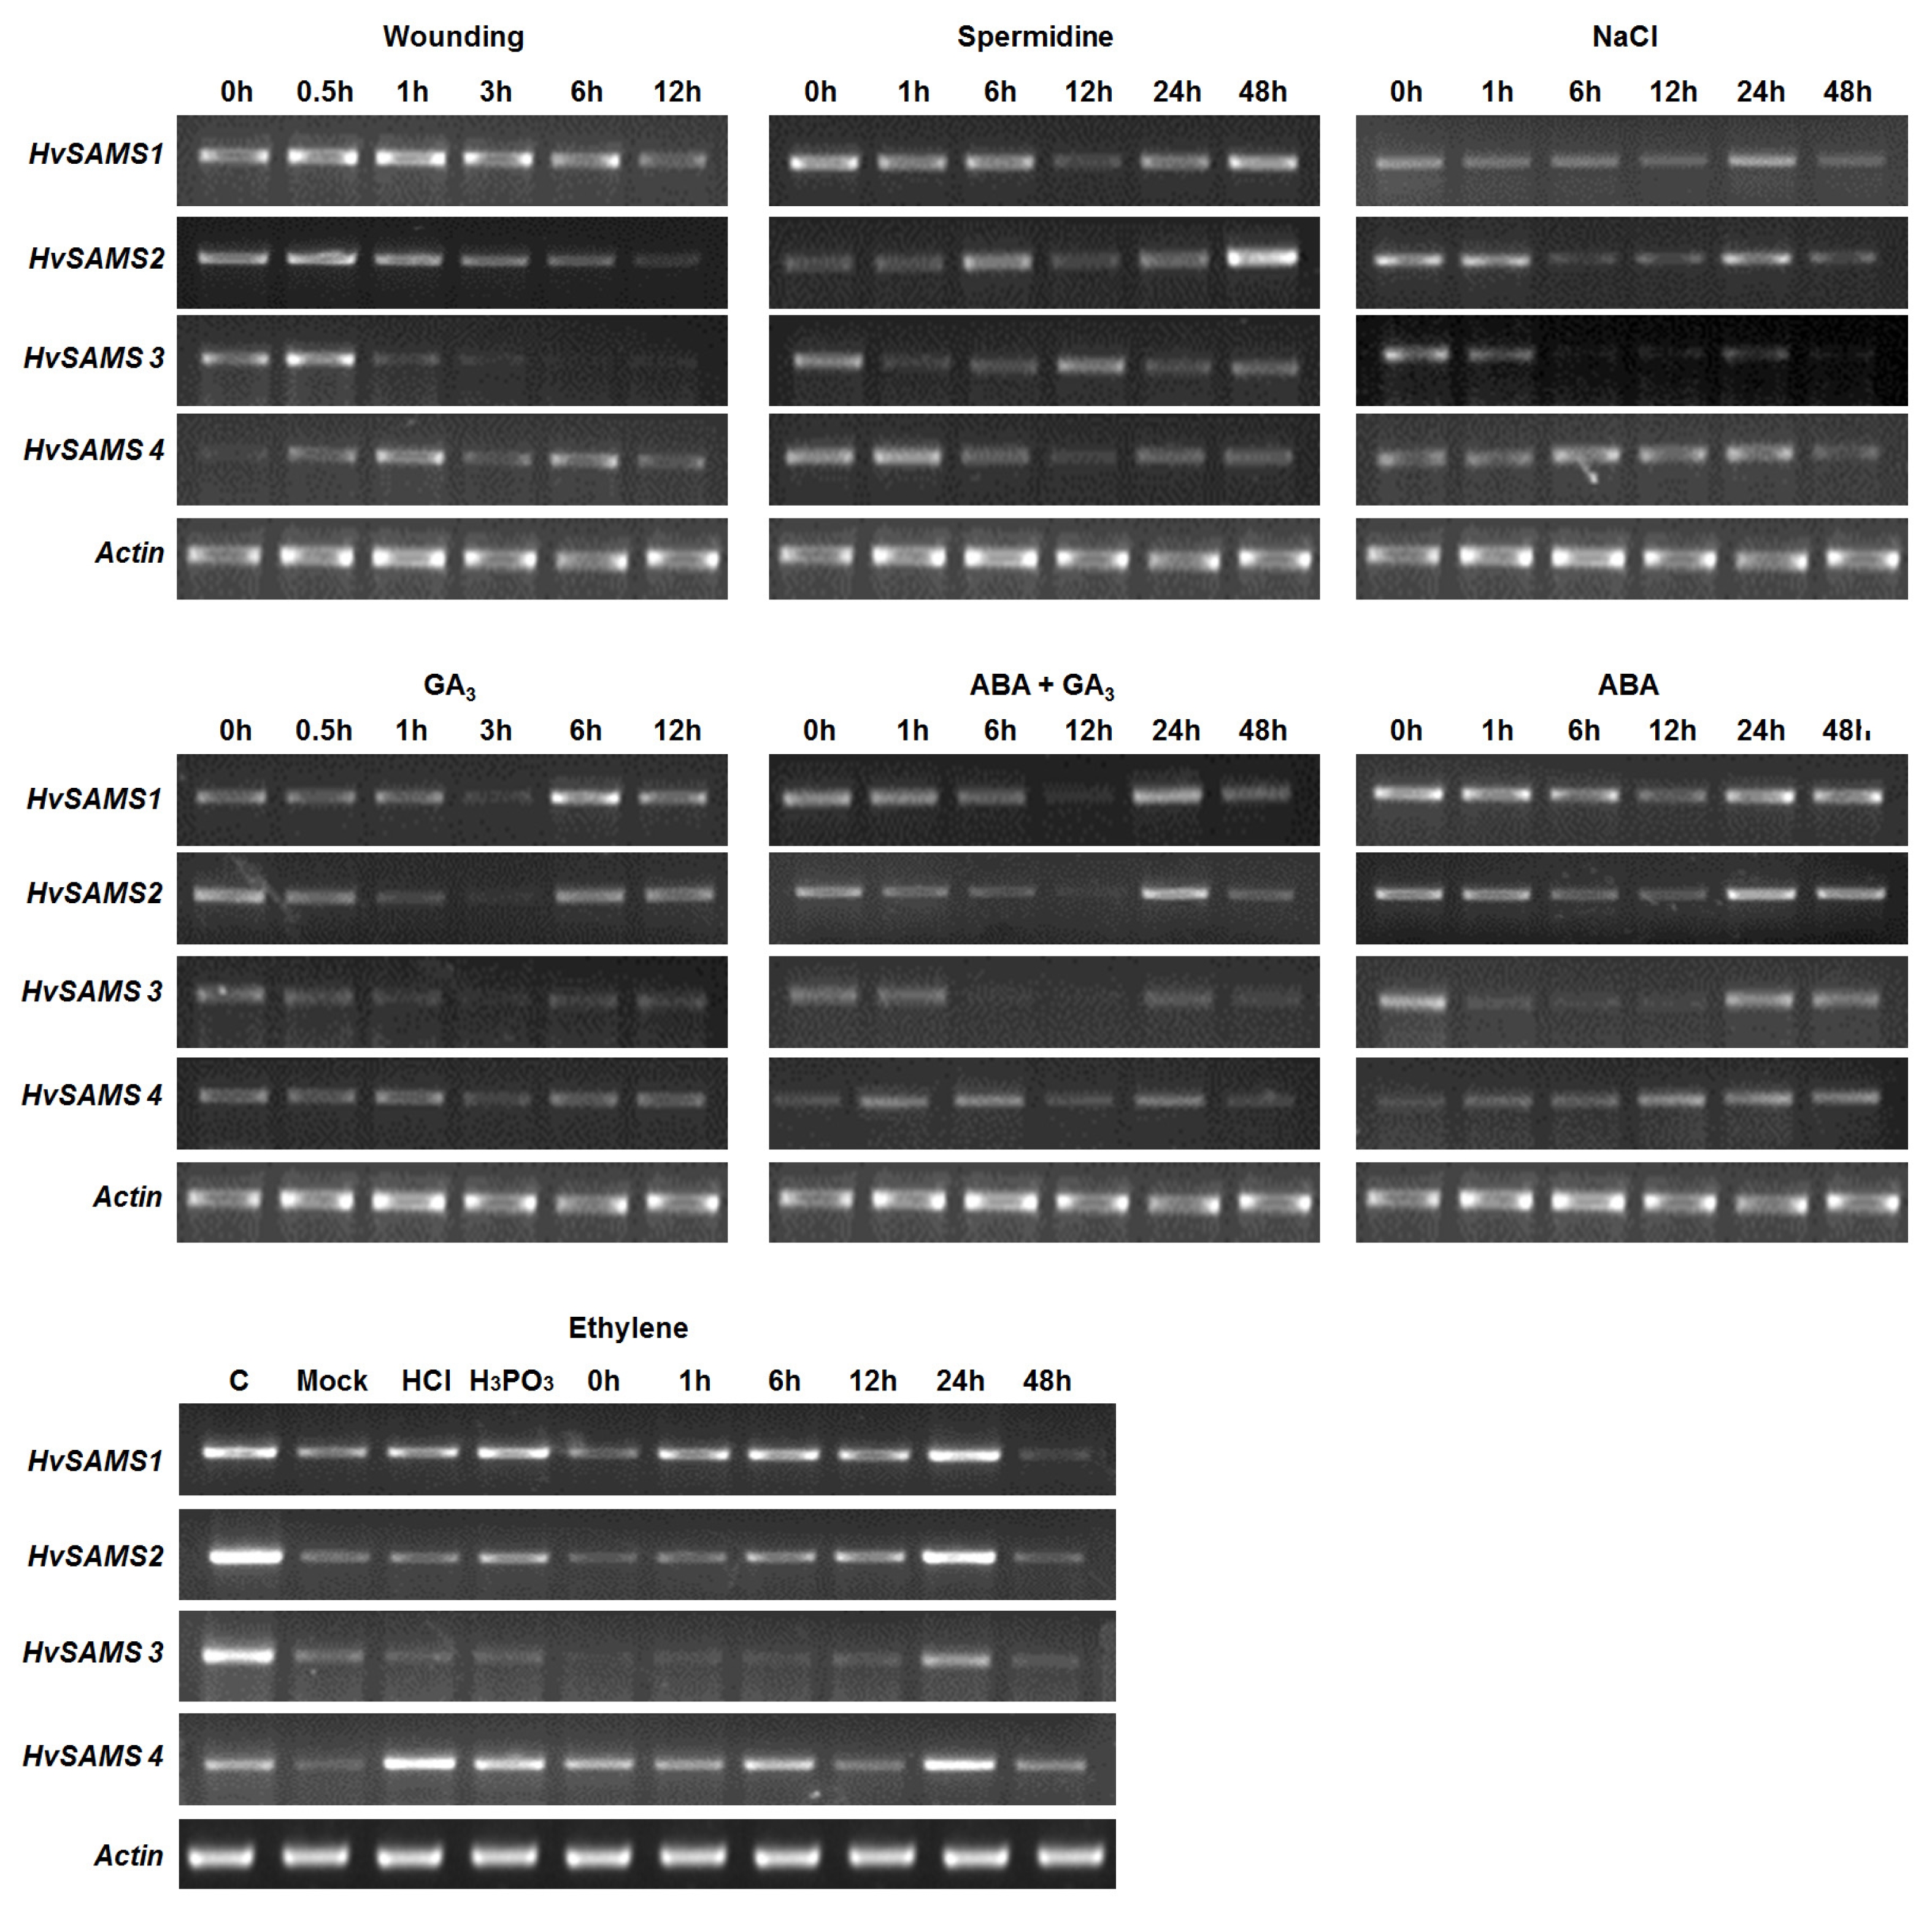
RT-PCR was used to investigate the accumulation of
HvSAMS transcripts in response to the abiotic stress and exogenous application of phytohormones. Various expression patterns of
HvSAMS genes showing up- and down-regulation by each treatment were noted (
Fig. 3). Transcripts of
HvSAMS1 were present at all-time points in wounding, NaCl, ABA and spermidine treatments.
HvSAMS1 transcripts accumulations were elevated from 24 h in GA
3 and GA
3 together with ABA treatment. Accumulation of
HvSAMS1 transcripts were also increased from 24 h in ethylene treatment, but subsequently decreased at 48 h.
HvSAMS2 transcripts were present at all-time points in NaCl treatment and were highly accumulated in GA3 and GA3 - ABA treatment. Similar to HvSAMS1, mRNA levels of HvSAMS2 were at highest level at 24 h. For spermidine treatment, the strongest signal of HvSAMS2 was detected at 48 h. However, HvSAMS2 transcript level was particularly low in ABA, and wounding treatments, as well as in ethylene treatment (except the transcript profile at 24 h).
The transcripts of HvSAMS3 were present at all-time points in spermidine treatment. HvSAMS3 gene transcript was less abundant in response to wounding, NaCl, GA3 alone and GA3 - ABA. A low transcript accumulation during ethylene treatment was observed except at 24 h after treatment. Accumulation of HvSAMS3 mRNA transcripts continuously dropped until 12 h showing similar level as 0 h in ABA treatment.
HvSAMS4 transcripts accumulation was at steady state and was present at all-time points in spermidine, NaCl, GA3 and ethylene treatment. HvSAMS4 showed that its transcripts were slightly increased by wounding and ABA treatment. In case of GA3 - ABA treatment, the transcripts were negligible at 0 h treatment and increased after 1 h.
Isolation of the HvSAMS genes promoter and expression
The genome walker strategy was used to isolate the
HvSAMS gene promoter region from the genomic DNA of barley. Because
HvSAMS genes contained no intron region in their ORF, a couple of nested gene-specific primers were designed using the
HvSAMS gene cDNA sequence (
Table 1). The amplified promoter region was 1,788 bp for
HvSAMS1, 1,698 bp for
HvSAMS2, 1,916 bp for
HvSAMS3, and 1,537 bp for
HvSAMS4. After sequence confirmation, the putative
cis-acting elements in each promoter region were analyzed using PlantCARE (
Appendix Table 2).
In order to determine the spatial regulation of
HvSAMS2 gene expression, the transgenic plants harboring
pBI101:: HvSAMS(−1459),
pBI101::HvSAMS(−301), and
pBI101:: HvSAMS(−211) constructs were investigated using histochemical GUS assay (
Fig. 4A).
Fig. 4B showed histochemical staining analysis for the GUS activity in 1-, 2-, and 3-week-old T
2 transgenic
Arabidopsis plants. The GUS activity was only detected in 2-week-old plants, particularly in
pBI101::HvSAMS - and
pBI101::HvSAMS - containing transgenic plants which showed expression in the stem. The GUS expression in
pBI101::HvSAMS transgenic plants lasted until 3 weeks (
Fig. 4B).
The localization of HvSAMS1 was examined in onion epidermal cells using the HvSAMS 1::GFP fusion protein. Onion cells transformed with a plasmid containing GFP alone showed fluorescence dispersed throughout the cell. In contrast, the fluorescence was localized in the nucleus of the cells and slightly in the cytosol transformed with the plasmid expressing HvSAMS 1::GFP fusion protein (
Fig. 5).
In order to determine the
HvSAMS1 gene function, we generated the
Arabidopsis transgenic plant overexpressing the coding sequence for the entire
HvSAMS1 under the control of an ubiquitin promoter. A total of 24 putative T
1 plants were produced via
Agrobacterium-mediated transformation, 19 of which were selected through PCR screening (
Appendix Fig. 2). Subsequent selections were carried out for T
2 and T
3 plants. In the T
3 generation, three homozygous lines for
HvSAMS1 were obtained.
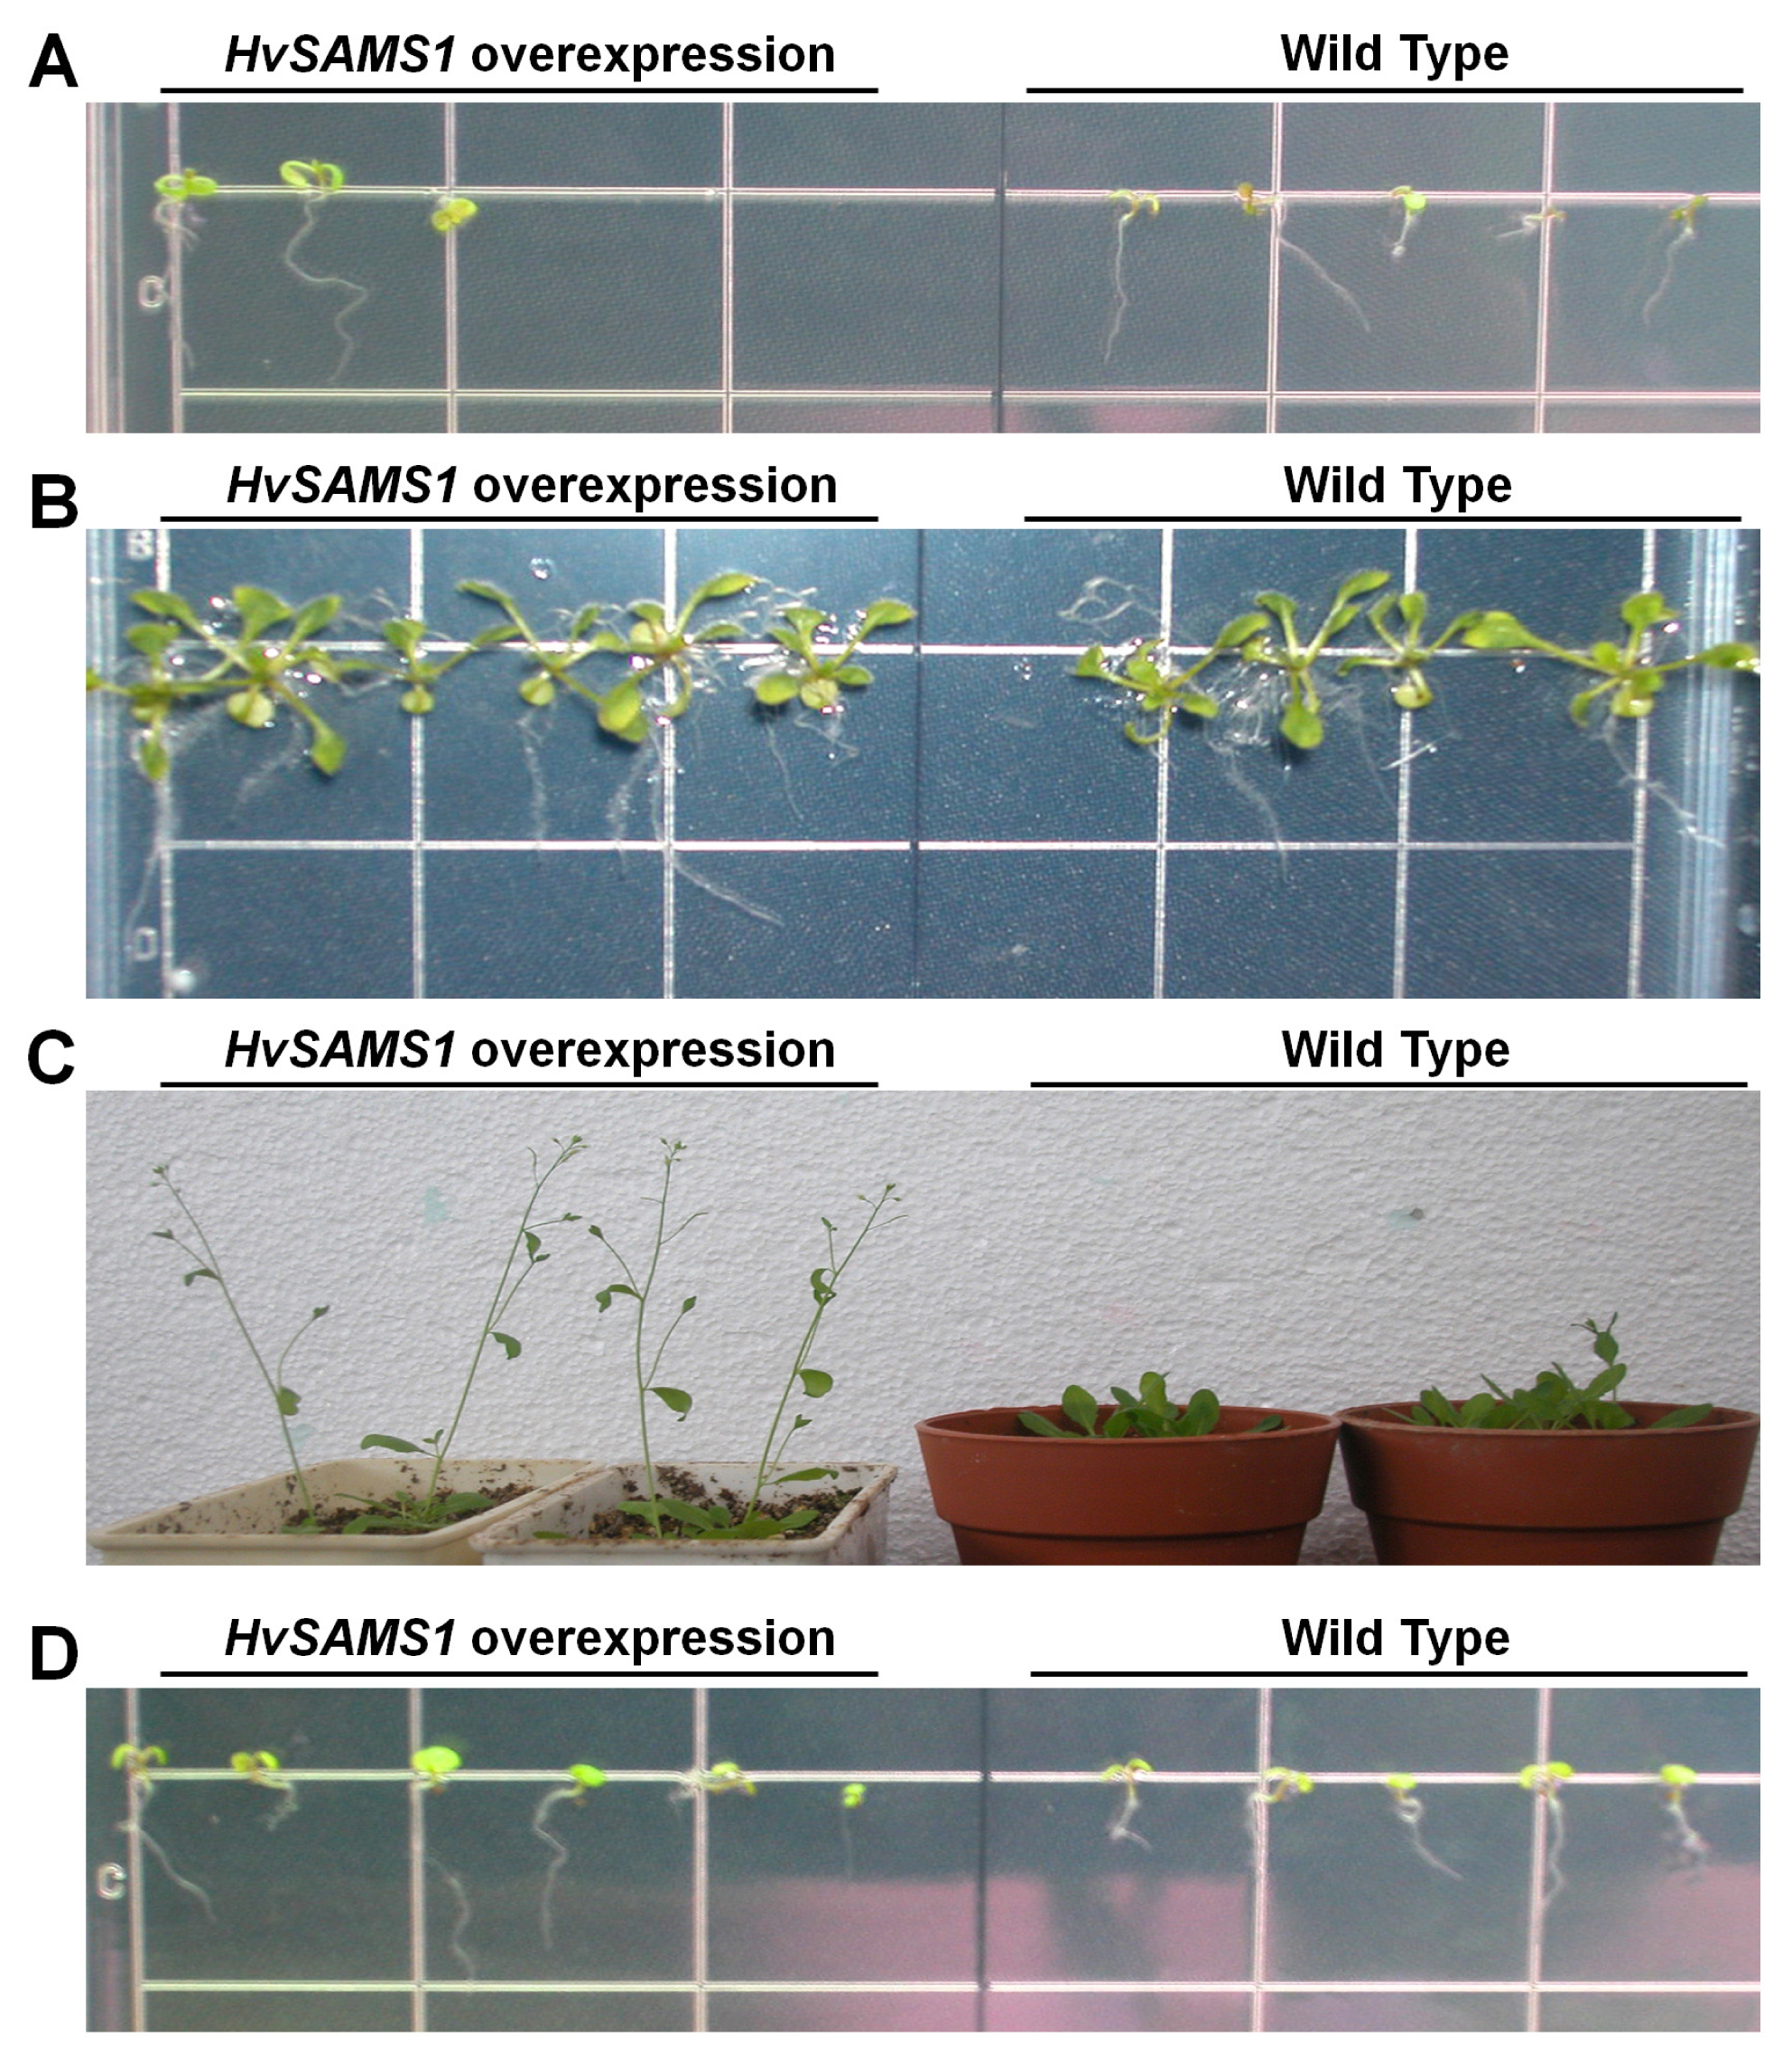
The T
3 homozygous lines did not exhibit distinct phenotypic differences with wild-type for the color, leaf shape and plant height. Germination rate was significantly different between the
HvSAMS1 transgenic lines and wild-type plants (
Fig. 6A). Transgenic plants showed faster growth for an initial two weeks, after which no difference in growth rate between transgenic lines and wild-type plants was observed (
Fig. 6B). The transgenic lines exhibited slightly faster bolting than the wild-type plants (
Fig. 6C). However, there was no significant difference in maturity between transgenic lines and wild-type. The transgenic lines vigorously grew on MS medium containing 1 μM GA
3 (
Fig. 6D).
DISCUSSION
The barley germplasm “GSHO 2504” known as an early maturity 10, has an
eam10 gene and provided a good source for the barley breeding (
Börner et al. 2002). The Barley lines possessing such early maturity related major genes (
eam8,
eam9 and
eam10) also provide sources for genetic mapping using RFLP (Restriction Fragment Length Polymorphysm) and SSR (Single Sequence Repeat) (
Gallagher et al. 2001;
Börner et al. 2002). In our previous paper, the DH method was used for the isolation of grain-specific genes during the middle phase of grain development (
Lee et al. 2006).
We isolated the four cDNAs that had high sequence homologies and designated as
HvSAMS genes. Southern blot analysis of genomic DNA revealed the presence of at least 3 copies of
SAMS genes in barley (
Fig. 1B). Because
HvSAMS1 has only 79% sequence homology with
HvSAMS4, the probe could not be hybridized with
HvSAMS4 gene. Nevertheless, this study demonstrates that barley has four copies of
HvSAMS genes. This has been demonstrated in
Arabidopsis (
Peleman et al. 1989), periwinkle (
Schröder et al. 1997), pea (
Gómez-Gómez and Carrasco 1998) and tomato (
Espartero et al. 1994). But this does not apply to all plant species. Only one
SAMS gene was identified in petunia (
Gómez-Gómez and Carrasco 1998) and soybean (
Kim et al. 1995). To date, four
SAMS genes were identified in barley endosperm (
Radchuk et al. 2005).
HvSAMS gene family shared highly conserved two domains. One was ATP-binding domain, GAGDQG, and the other was P-loop-like domain, GGGAFSGKD. The traditional SAMS domain, ATP-binding domain, was involved with SAMS activity, SAM concentration and free methionine concentration (
Shen et al. 2002). A P-loop-like sequence has been found in the
HvSAMS genes sequence around the ATP-binding site (
Fig. 1A) (
Chiang et al. 1999). The typical P-loops were composed of the serine/threonine [S/T] residue, but
HvSAMS genes were replaced by an aspartate [D]. This replacement was not an unusual phenomenon. There are two consecutive β-turns in the P-loop-like sequence in SAMS, instead of only a single turn in the typical P-loop. The first β-turns consist of four residues, F-S-G-K, and the second β-turns consist of another four residues, D-P-S-K (
Takusagawa et al. 1996). The serine [S] in the second β-turns was replaced by threonine [T] in
HvSAMS genes. Because serine and threonine are classified as polar amino acids with uncharged residue groups, the P-loop-like region of
HvSAMS genes might consist of two consecutive β-turns.
Schröder et al (1997) reported that plant SAMSs were fallen into two types. Athough
HvSAMS genes belong to the same group (type I), differential gene expression for
HvSAMS1,
2,
3 and
4 were observed (
Fig. 3). This result indicated that different regulatory regions might be responsible for different responses. The
HvSAMS genes exhibited the highest expression pattern during early grain development (i.e., -3, 0 and 3 DAF) followed by a subsequent reduction as kernel development elapsed (
Fig. 2A and B). It has been reported that
SAMS genes were usually expressed in stem and root tissue (
Peleman et al. 1989;
Espartero et al. 1994). In only a few plants,
SAMS genes were predominantly expressed in reproductive tissue such as grain (
Radchuk et al. 2005) and ovary (
Gómez-Gómez and Carrasco 1998).
Radchuk et al (2005) profiled methylation cycle involved in enzymes, including
SAMS genes, in different developmental stage of barley endosperm.
SAMS genes from barley (
HvAMS1,
2,
3 and
4) were highly expressed during pre-storage and intermediate phage, considerably low near 12 DAF, and eventually high at 20 DAF. Although the sequence of
HvSAMS genes and
HvAMS genes showed high similarity, the transcriptional modes of
HvSAMS genes and
HvAMS genes observed by Northern blotting and RT-PCR were different (
Fig. 2A and B).
With high sequence homology among
HvSAMS1,
2 and
3, we speculated that the different expression pattern of these genes were unlikely the result of sequence differences.
Radchuk et al (2005) reported expression profiling of
HvAMS gene family using
in silico analysis and microarray. The hybridized probe used was prepared using poly(A)+ RNA of cDNA sequence. Non-specific cross-hybridization could occur by cross-hybridization resulting in sequence similarity of probes because
HvAMS1 and
2 sequences differed by only one amino acid position.
HvAMS3 had also 12 amino acids that were different from
HvAMS1. When homology of gene sequences were very high, designing gene-specific (e.g. Northern hybridization) primers would be difficult. Alternatively, Ciaffi et al (2006) used RT-PCR to avoid non-specific hybridizaiton. Gene-specific primers for each
HvSAMS gene cloning and RT-PCR (
Table 1) showed low sequence homology (5.1% ~ 50%) to each other. RT-PCR suggested that
HvSAMS1,
2 and
3 transcripts were abundant at early stage (from −3 DAF to 3 DAF) and
HvSAMS4 expression remained at steady state throughout the observation time used in this study.
Plant genes are up- and down-regulated by a variety of growth regulatory hormones during plant development (
Kende and Zeevaart 1997). The
SAMS gene has been regarded as housekeeping gene involving methyl donor in numerous methylation systems. But abundant plant
SAMS genes were significantly stimulated by an elicitor treatment (
Gowri et al. 1991). In petunia,
SAMS gene was examined by means of the temporal-, special-regulation against exogenous phytohormones (
Izhaki et al. 1996).
Espartero et al (1994) investigated differential transcripts accumulation of three
SAMS genes in response to salt, ABA and wounding treatment in tomato. In our study, a low transcripts accumulation for
HvSAMS2 and
3, and no significant change for
HvSAMS1 and
4 were observed. This finding was in accordance with the previous work with tomato leaves where the
SAMS genes expression was low under wounding stress (
Esparteto et al. 1994). Transcript accumulations of
SAMS genes in periwinkle were increased in response to salt stress at seedling stage (
Schröder et al. 1997). However, the expression was merely detected in 5- or 6- leaf stage of tomato plants under the salt stress (
Espartero et al. 1994).
HvSAMS family genes might follow similar regulation process as seen in tomato leaves.
Exogenous application of spermidine induced up-regulated
ADC transcripts in mustard leaves (
Mo and Pua 2002). However,
HvSAMS genes were not significantly stimulated by exogenous application of spermidine. In kiwifruit, the
SAMS genes and ACC oxidase gene family were induced by the application of exogenous ethylene, but ACC synthetase gene was not affected by ethylene treatment (
Whittaker et al. 1997). They also suggested that the regulation of
SAMS transcripts by ethylene could occur as the methionine salvage pathway. As shown in
Fig. 3,
HvSAMS2 and
3 genes showed minimum level of transcripts, whereas
HvSAMS1 and
4 genes displayed stable expressions. It can be deduced that
HvSAMS genes might be involved in some parts of the methionine salvage pathway at 4-week-old barley leaves.
SAMS isozymes from dwarf pea was stimulated in GA
3 treatment, and stimulatory response of GA
3 was nullified by ABA treatment (
Mathur and Sachar 1991). GA
3 might control the induction of isozymes of SAMS in wheat aleurones (
Mathur et al. 1992).
HvSAMS transcripts were slightly elevated at the late observation time (24 – 48 h). Although ABA is a known antagonistic regulator of GA
3, we did not observe any inverse expression of
HvSAMS genes. Interestingly, the
HvSAMS1,
2 and
3 genes showed similar expression pattern in response to GA
3 and GA
3 - ABA treatment, but not in ABA.
Robertson (2003) reported that
HvSPY was up-regulated in ABA treatment whereas the
HvSPY expression was not affected by GA
3 when ABA was also present. He explained that
HvSPY expression was influenced by
cis-element (G box, GC rich element). It was observed that expression of
HvSAMS1,
2 and
3 can be triggered in both GA
3 and ABA treatments through enhanced GA
3 signal. Hence we suggested that
HvSAMS1,
2 and
3 were regulated by the GA
3-dependent signal pathway, although they might as well carry different regulatory elements as their responses to GA
3 treatment varied.
HvSAMS4 transcripts on the other hand were not regulated by GA
3 and ABA. This finding suggested that the
HvSAMS4 gene might be driven by another regulative pathway that is unique from the other
HvSAMS genes.
HvSAMS family shared sequence identity that ranged from 89% to 99%. Expressions were tissue-specific, and were found similar throughout the grain development stage. However, the transcripts accumulations of
HvSAMS gene family showed significant differences to each treatment. One possible explanation for the difference expression is that
HvSAMS family can be regulated by other elements. We speculate that 5′ untranslated regions (5′UTRs) of
HvSAMS genes play key roles in the transcription regulation.
SAM decarboxylase of plants was strongly suggested that uORF regulated the translation mechanism (
Franceschetti et al. 2001).
Chung et al (2006) reported that an intron in the 5′UTR significantly enhanced the gene expression, and the length of intron also influenced the gene expression. Northern blot analysis of
HvSAMS1,
2 and
3 showed two signals, including a major signal and an additional weak signal (
Fig. 2A). The minor signal corresponded to the expression pattern of major signal, but this signal was not detected in
HvSAMS4.
Waxy gene led to an aberrant splicing in intron of 5′UTR from rice (
Cai et al. 1998).
Fujikake et al (2005) identified new alternative splicing transcription factors and detected their isoforms using RT-PCR. Possible hybridization of gene-specific probe with alternatively spliced transcripts in Northern blotting resulted in the presence of an additional band which contained 5′UTR intron as well as
HvSAMS transcript. However, RT-PCR using 5′ gene specific primer that was designed in compliance with upstream region of 5′ UTR showed expected mature
HvSAMS transcript.
In previous study, we reported
HvSAMS1 promoter expression (
Kim et al. 2007). But according to present study, the reported promoter was not that of
HvSAMS1 upstream region but that of
HvSAMS2 upstream region. The promoters of
HvSAMS1,
2,
3, and
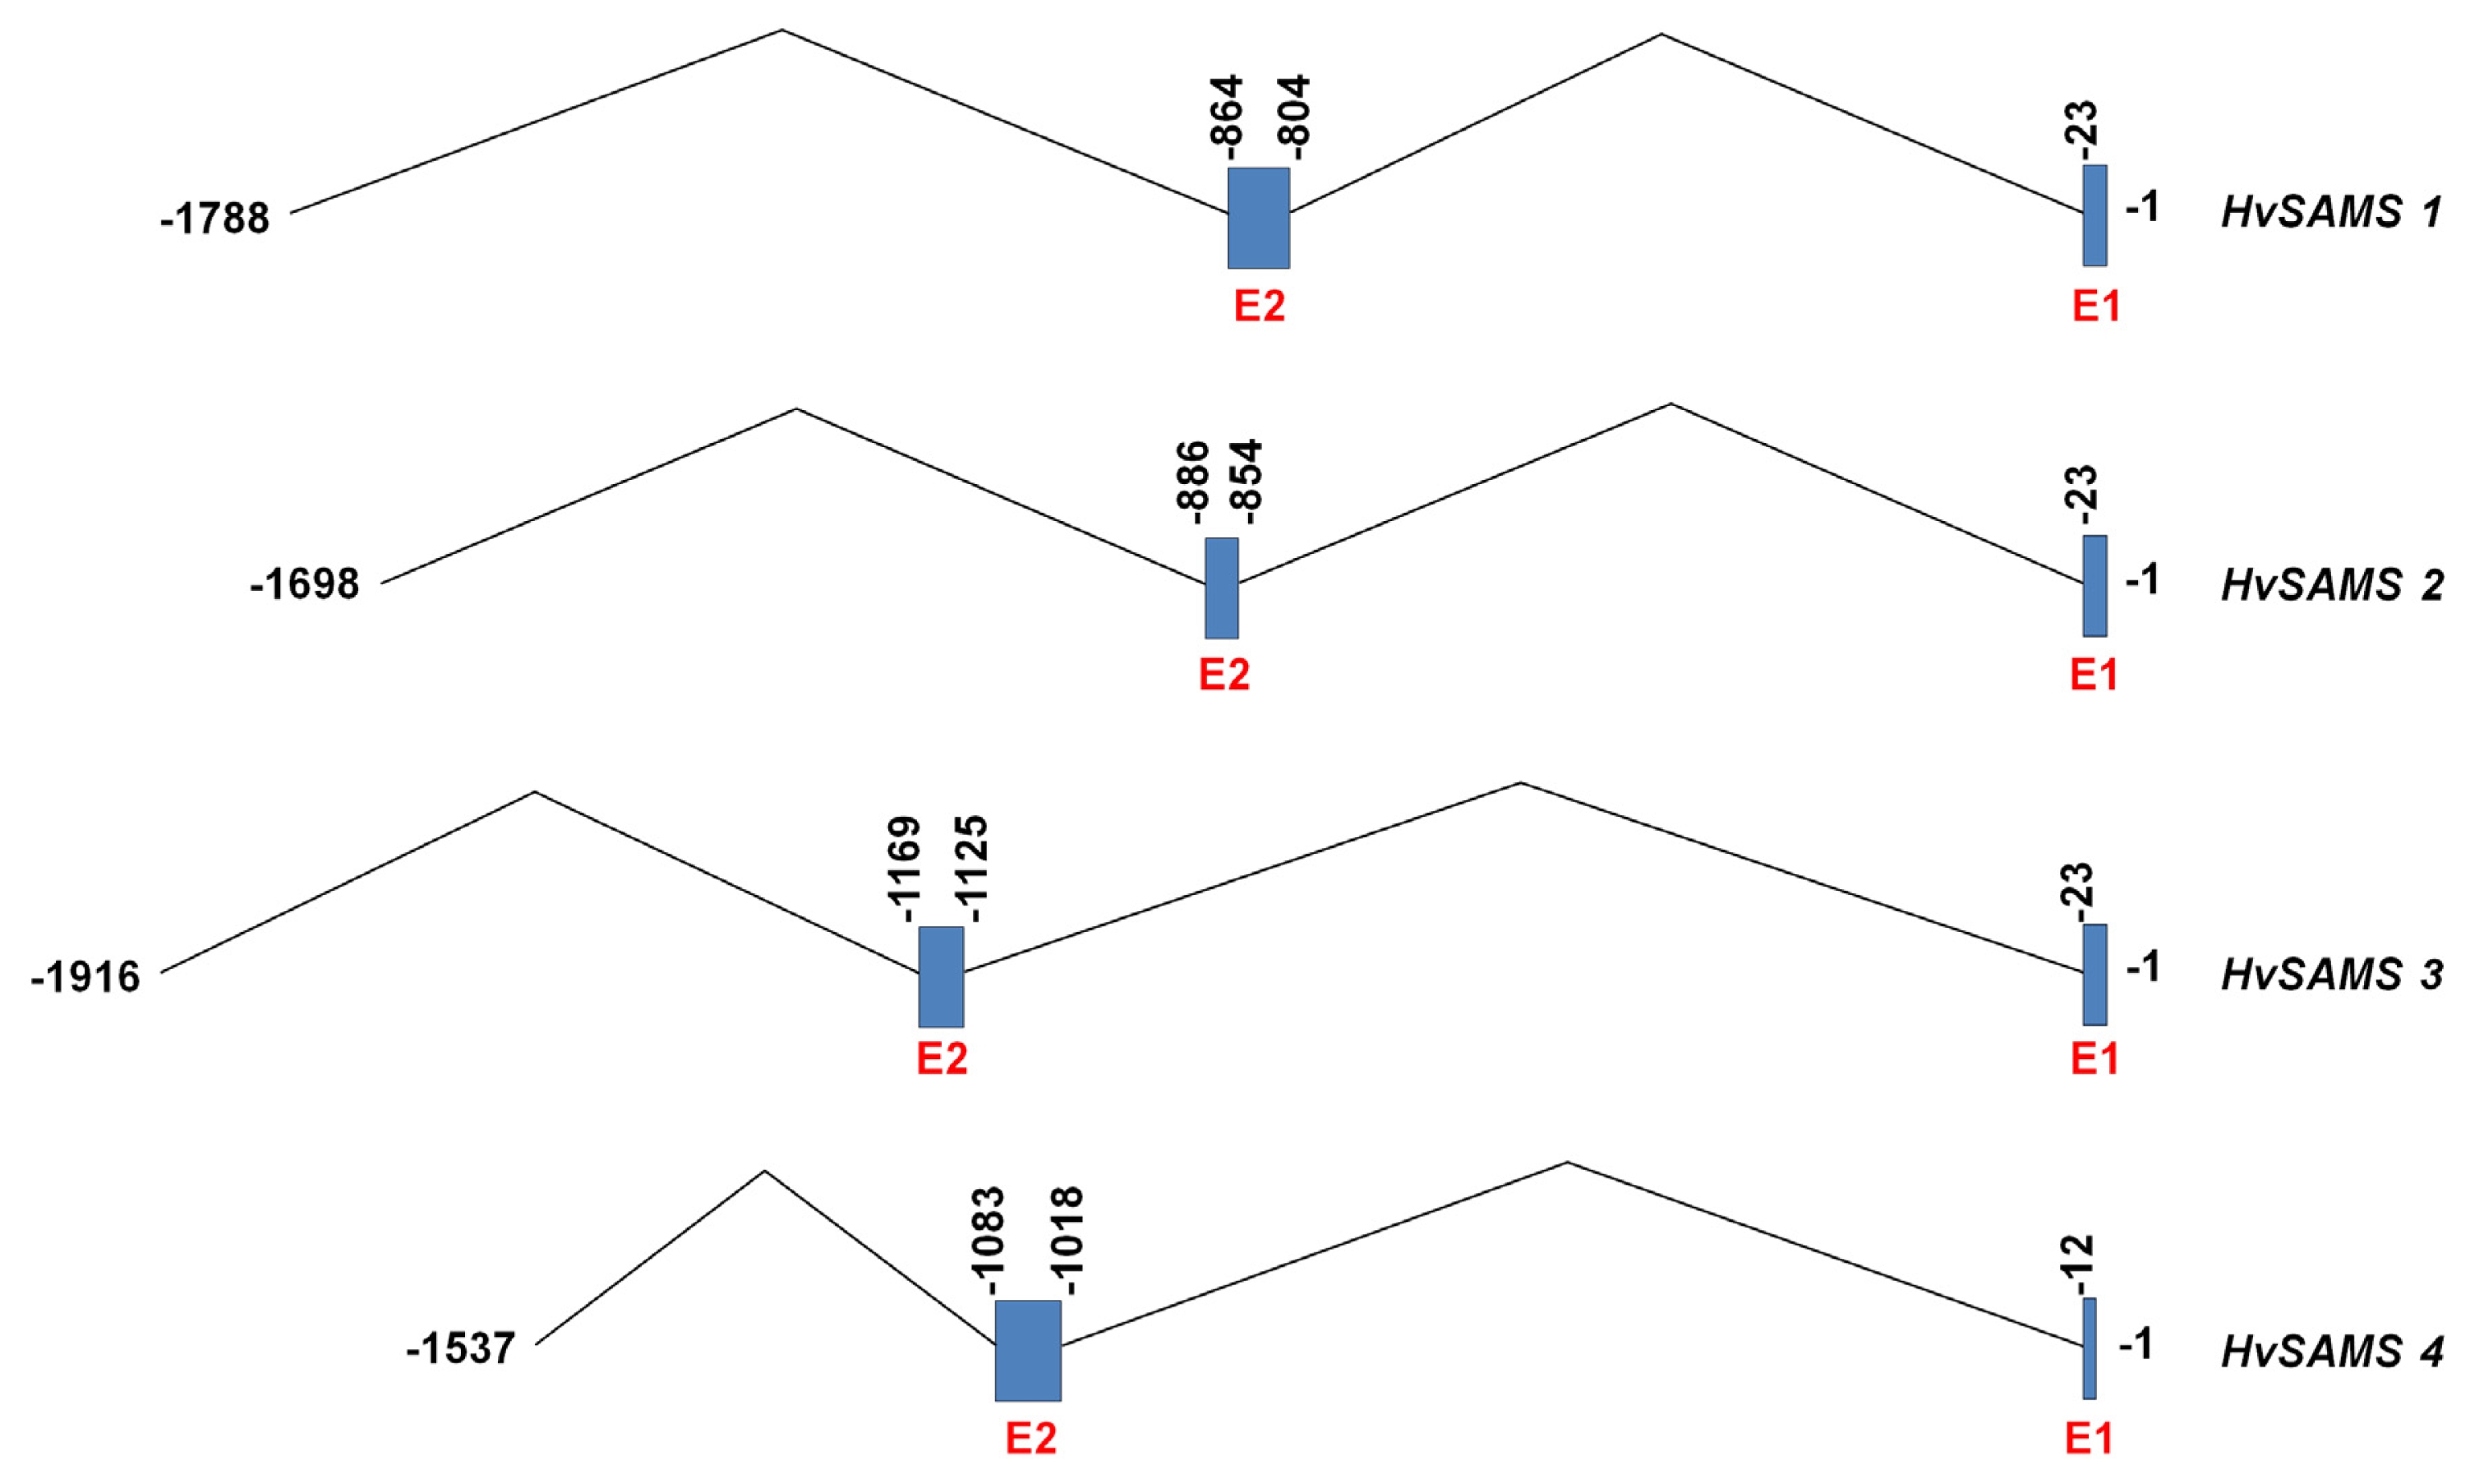
4 contains two introns (
Appendix Fig. 1). The first exon of
HvSAMS1,
2,
3 were located immediately before the start codon which was exactly 23 bp, while that of
HvSAMS4 was 12 bp away from the start codon. Further study on the molecular characterization using promoters of
HvSAMS genes is highly recommended for better understanding of the
HvSAMS gene expression mechanisms.
As shown in
Fig. 5, the
HvSAMS1 was expressed in nucleus and slightly in cytosol.
Ravanel et al (1998) suggested three possibilities in the integration of the methionine and SAM biosynthetic/recycling pathways in the plant cell. The first and second models proposed that SAMS or SAM synthesis occurred in the cytosol. Whereas, the third model proposed that methionine and SAM biosynthesis reacted autonomously, with methinone recycling and SAM metabolism occurred both in the cytosol. Results in this study might be in accordance with the third model. The
HvSAMS1 transgenic
Arabidopsis plants initially exhibited faster growth than the wild-type plants. In addition, the
HvSAMS1 transgenic
Arabidopsis plants responded vigorously to high GA
3 concentration. These results suggested that overexpression of
HvSAMS1 might play roles in the germination and in GA
3 response mechanism.
In order to elucidate the molecular mechanisms inherent to grain development in the extra early maturing barley, we identified early maturity grain enriched genes, HvSAMS family, and characterized their extent of regulation by several phytohormones and stresses. However, further studies on the molecular characterization of HvSAMS genes together with other plant SAMS genes are still needed to better understand their roles during grain development.
ACKNOWLEDGEMENT
This work was supported by a grant from the Next-Generation BioGreen 21 Program (Plant Molecular Breeding Center No. PJ008031012013), Rural Development Administration, Republic of Korea. Jae Yoon Kim was supported by a Korea University Grant.
Fig. 1(A) Comparison of amino acid sequence of the HvSAMS. The numbers at the end of right side in each line are the cumulative total number of amino acids sequence in each line. The conserved domains were indicated by asterisks. Black shading indicated the same amino acid at that position among all amino acids. Gray shading indicated the conserved amino acid residues. Dashes showed gaps in the amino acid sequences that were presented to optimize alignment. (B) Southern blot detection of HvSAMS genes in barley. Each lane contained 40 μg of genomic DNA digested with EcoRI or XbaI. The digested DNA fragments were separated by 0.8% agarose gel, electrophoresis, transferred onto nylon membrane and hybridized with 32P labeled full-length HvSAMS1 probe. Arrows indicate hybridization signal, M, molecular size marker; E, EcoRI; X, XbaI. (C) Phylogram of the relationship between HvSAMS proteins and various plant SAMS proteins. The scale bar represented 0.1 unit.

Fig. 2Transcript profiling of
HvSAMS genes during grain development. (A) Northern blot hybridization of the
HvSAMS genes during the grain development in barley. Total RNAs of different stage grains were fractionated on a 1% denaturing agarose gel. The grain materials were harvested at −3, 0, 3, 7, 10, 20 and 30 DAF. 1, −3 DAF; 2, 0 DAF; 3, 3 DAF; 4, 7 DAF; 5, 10 DAF; 6, 20 DAF; 7, 30 DAF. (B) RT-PCR analysis of the barley grain with same RNA in
Fig. 2A. (C) RT-PCR analysis of the
HvSAMS genes in different tissues. Total RNAs of four tissues from the barley (cv. K800) at 10 DAF were fractionated on a 1% denaturing agarose gel. G, grain; R, root; S, stem; L, leaf.
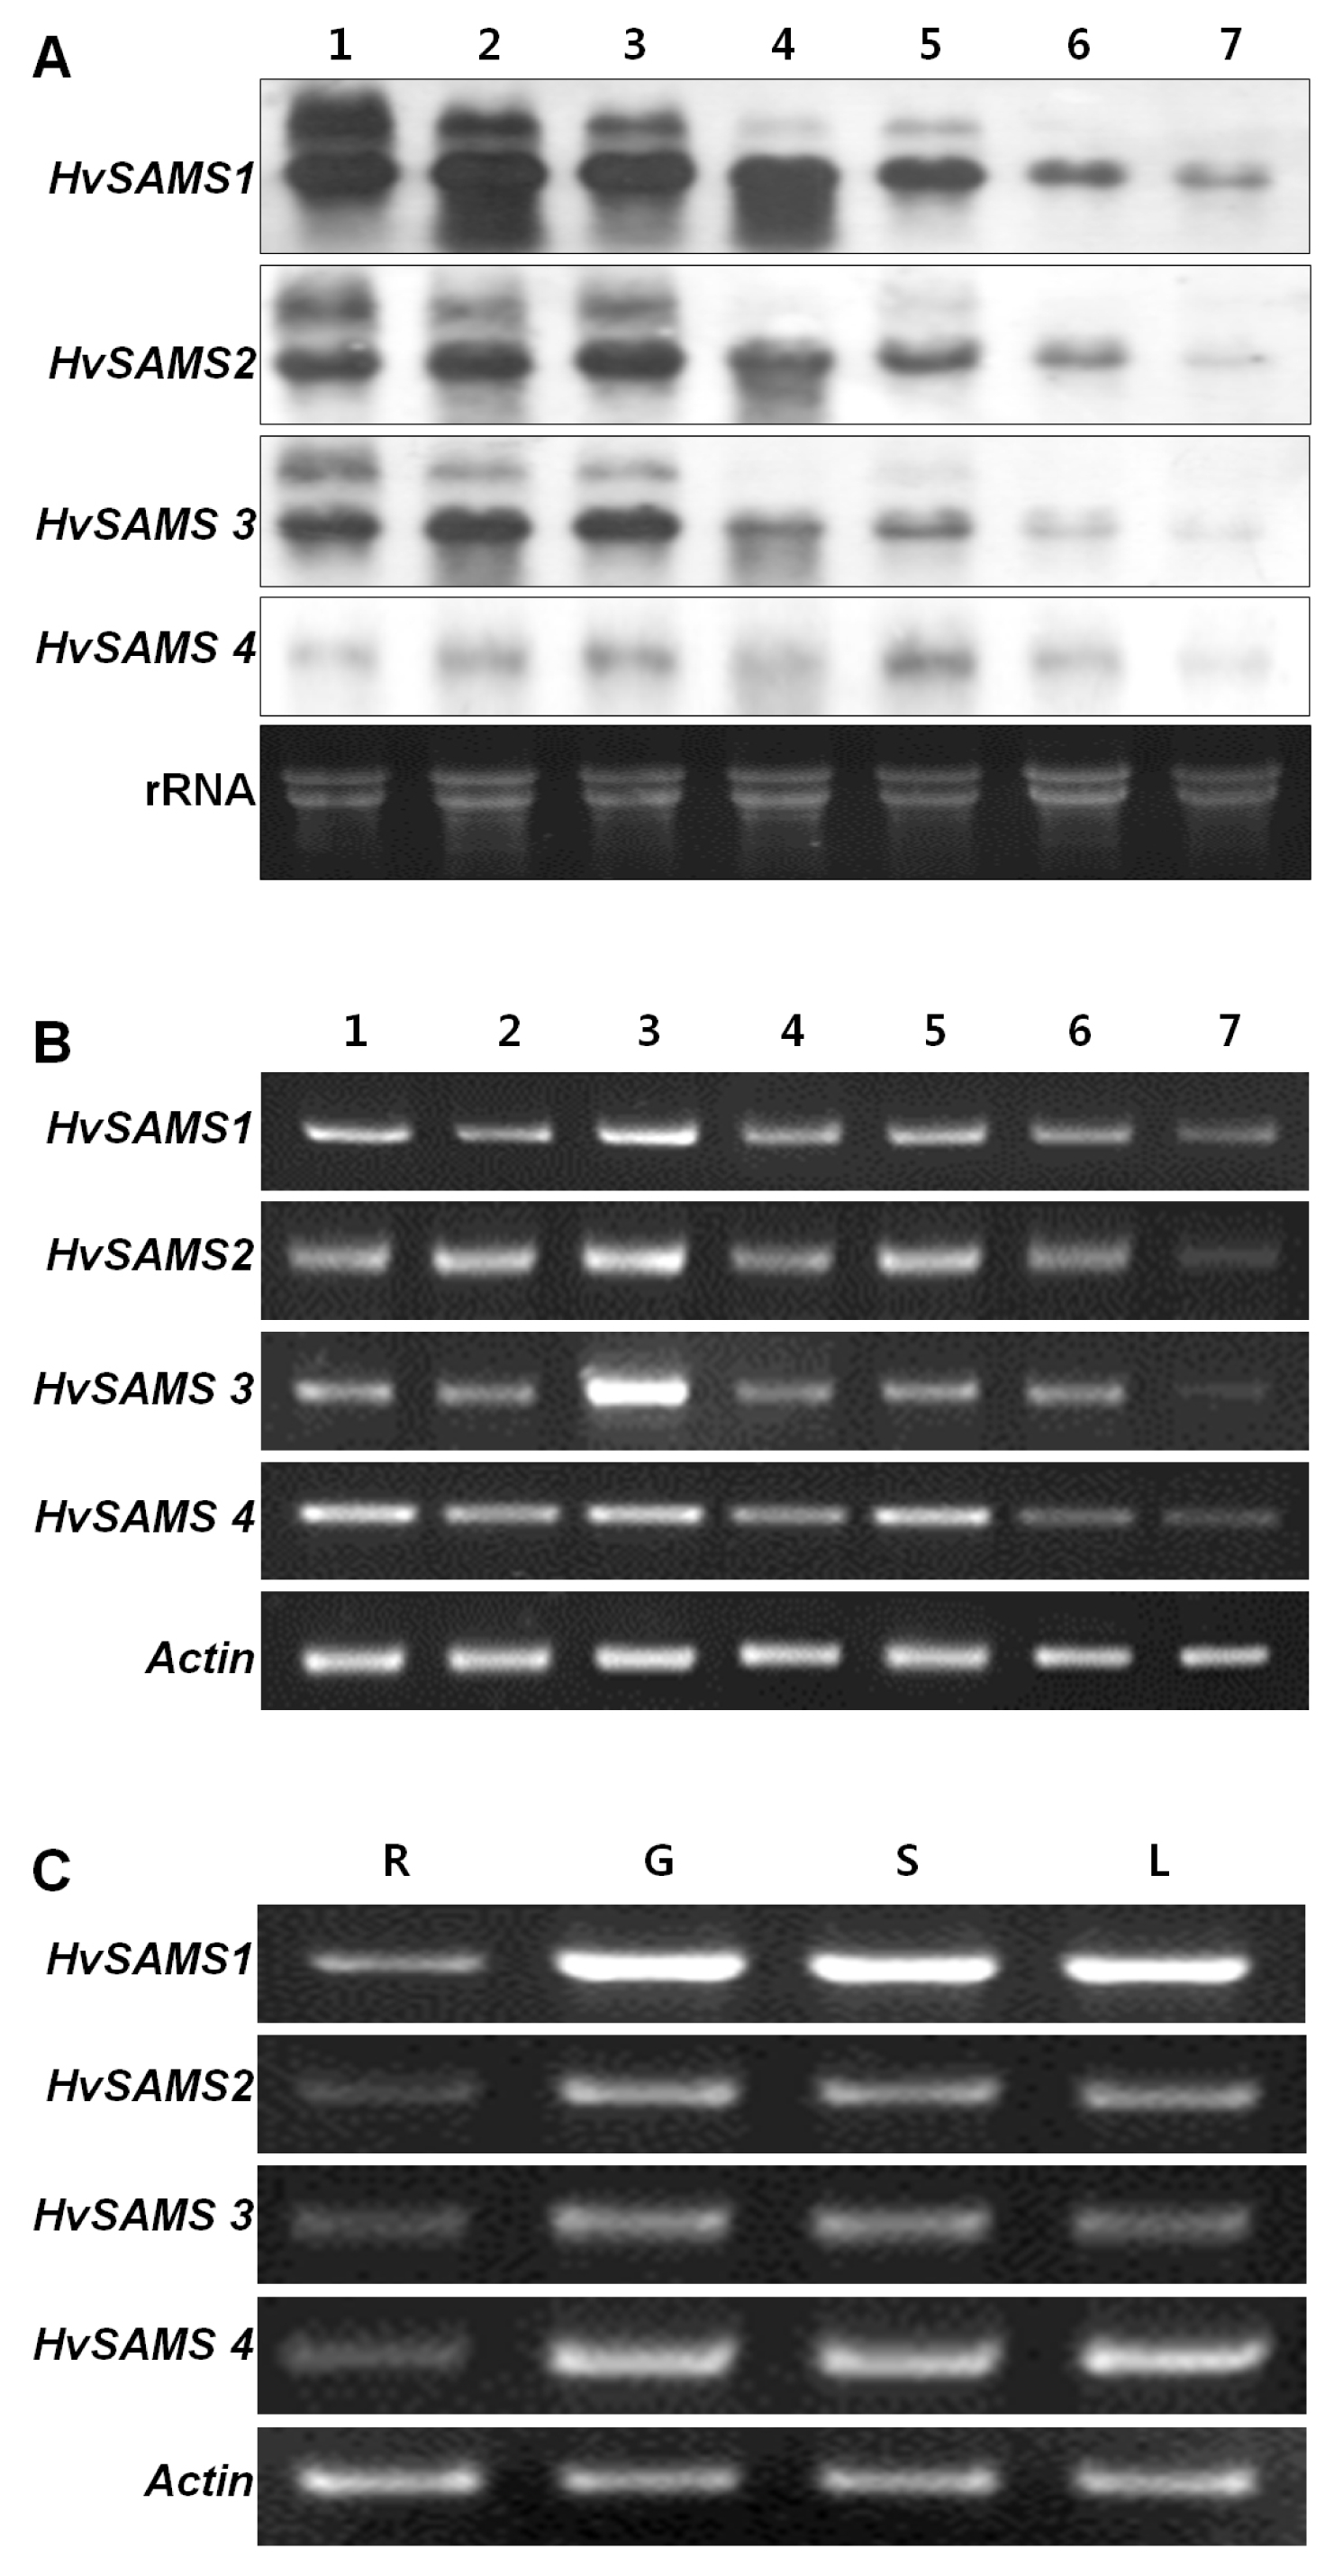
Fig. 3Transcript accumulation profiles of HvSAMS genes expressed in response to exogenous phytohormones and abiotic stress treatment using RT-PCR analysis. Plant material was 4-week-old leaves of barley treated with a solution of 100 μM each of ABA, GA3, spermidine, ethephon and 100 mM NaCl; C, non-treated; M, mock treatment (24 hrs).

Fig. 4Histochemical localization of GUS activity in transgenic Arabidopsis seedlings. (A) Schematic diagram of different HvSAMS 2 promoter::GUS fusions. The different length promoter fragments were subcloned into pBI 101. The putative cis-acting elements were represented by symbols. (B) Arabidopsis Columbia was transformed with transformation vectors. i, iv, vii, and x were introduced with pBI101::HvSAMS (−1459); ii, v, viii were introduced pBI101::HvSAMS (−301); iii, vi, ix were introduced pBI101::HvSAMS (−211) GUS fusion vector. I, ii, iii were 1- week-old transgenic plants (T2); iv, v, vi were 2-week-old transgenic plants (T2); vii, viii, ix, x were 3-week-old transgenic plants (T2); x magnified to 3 times vii.
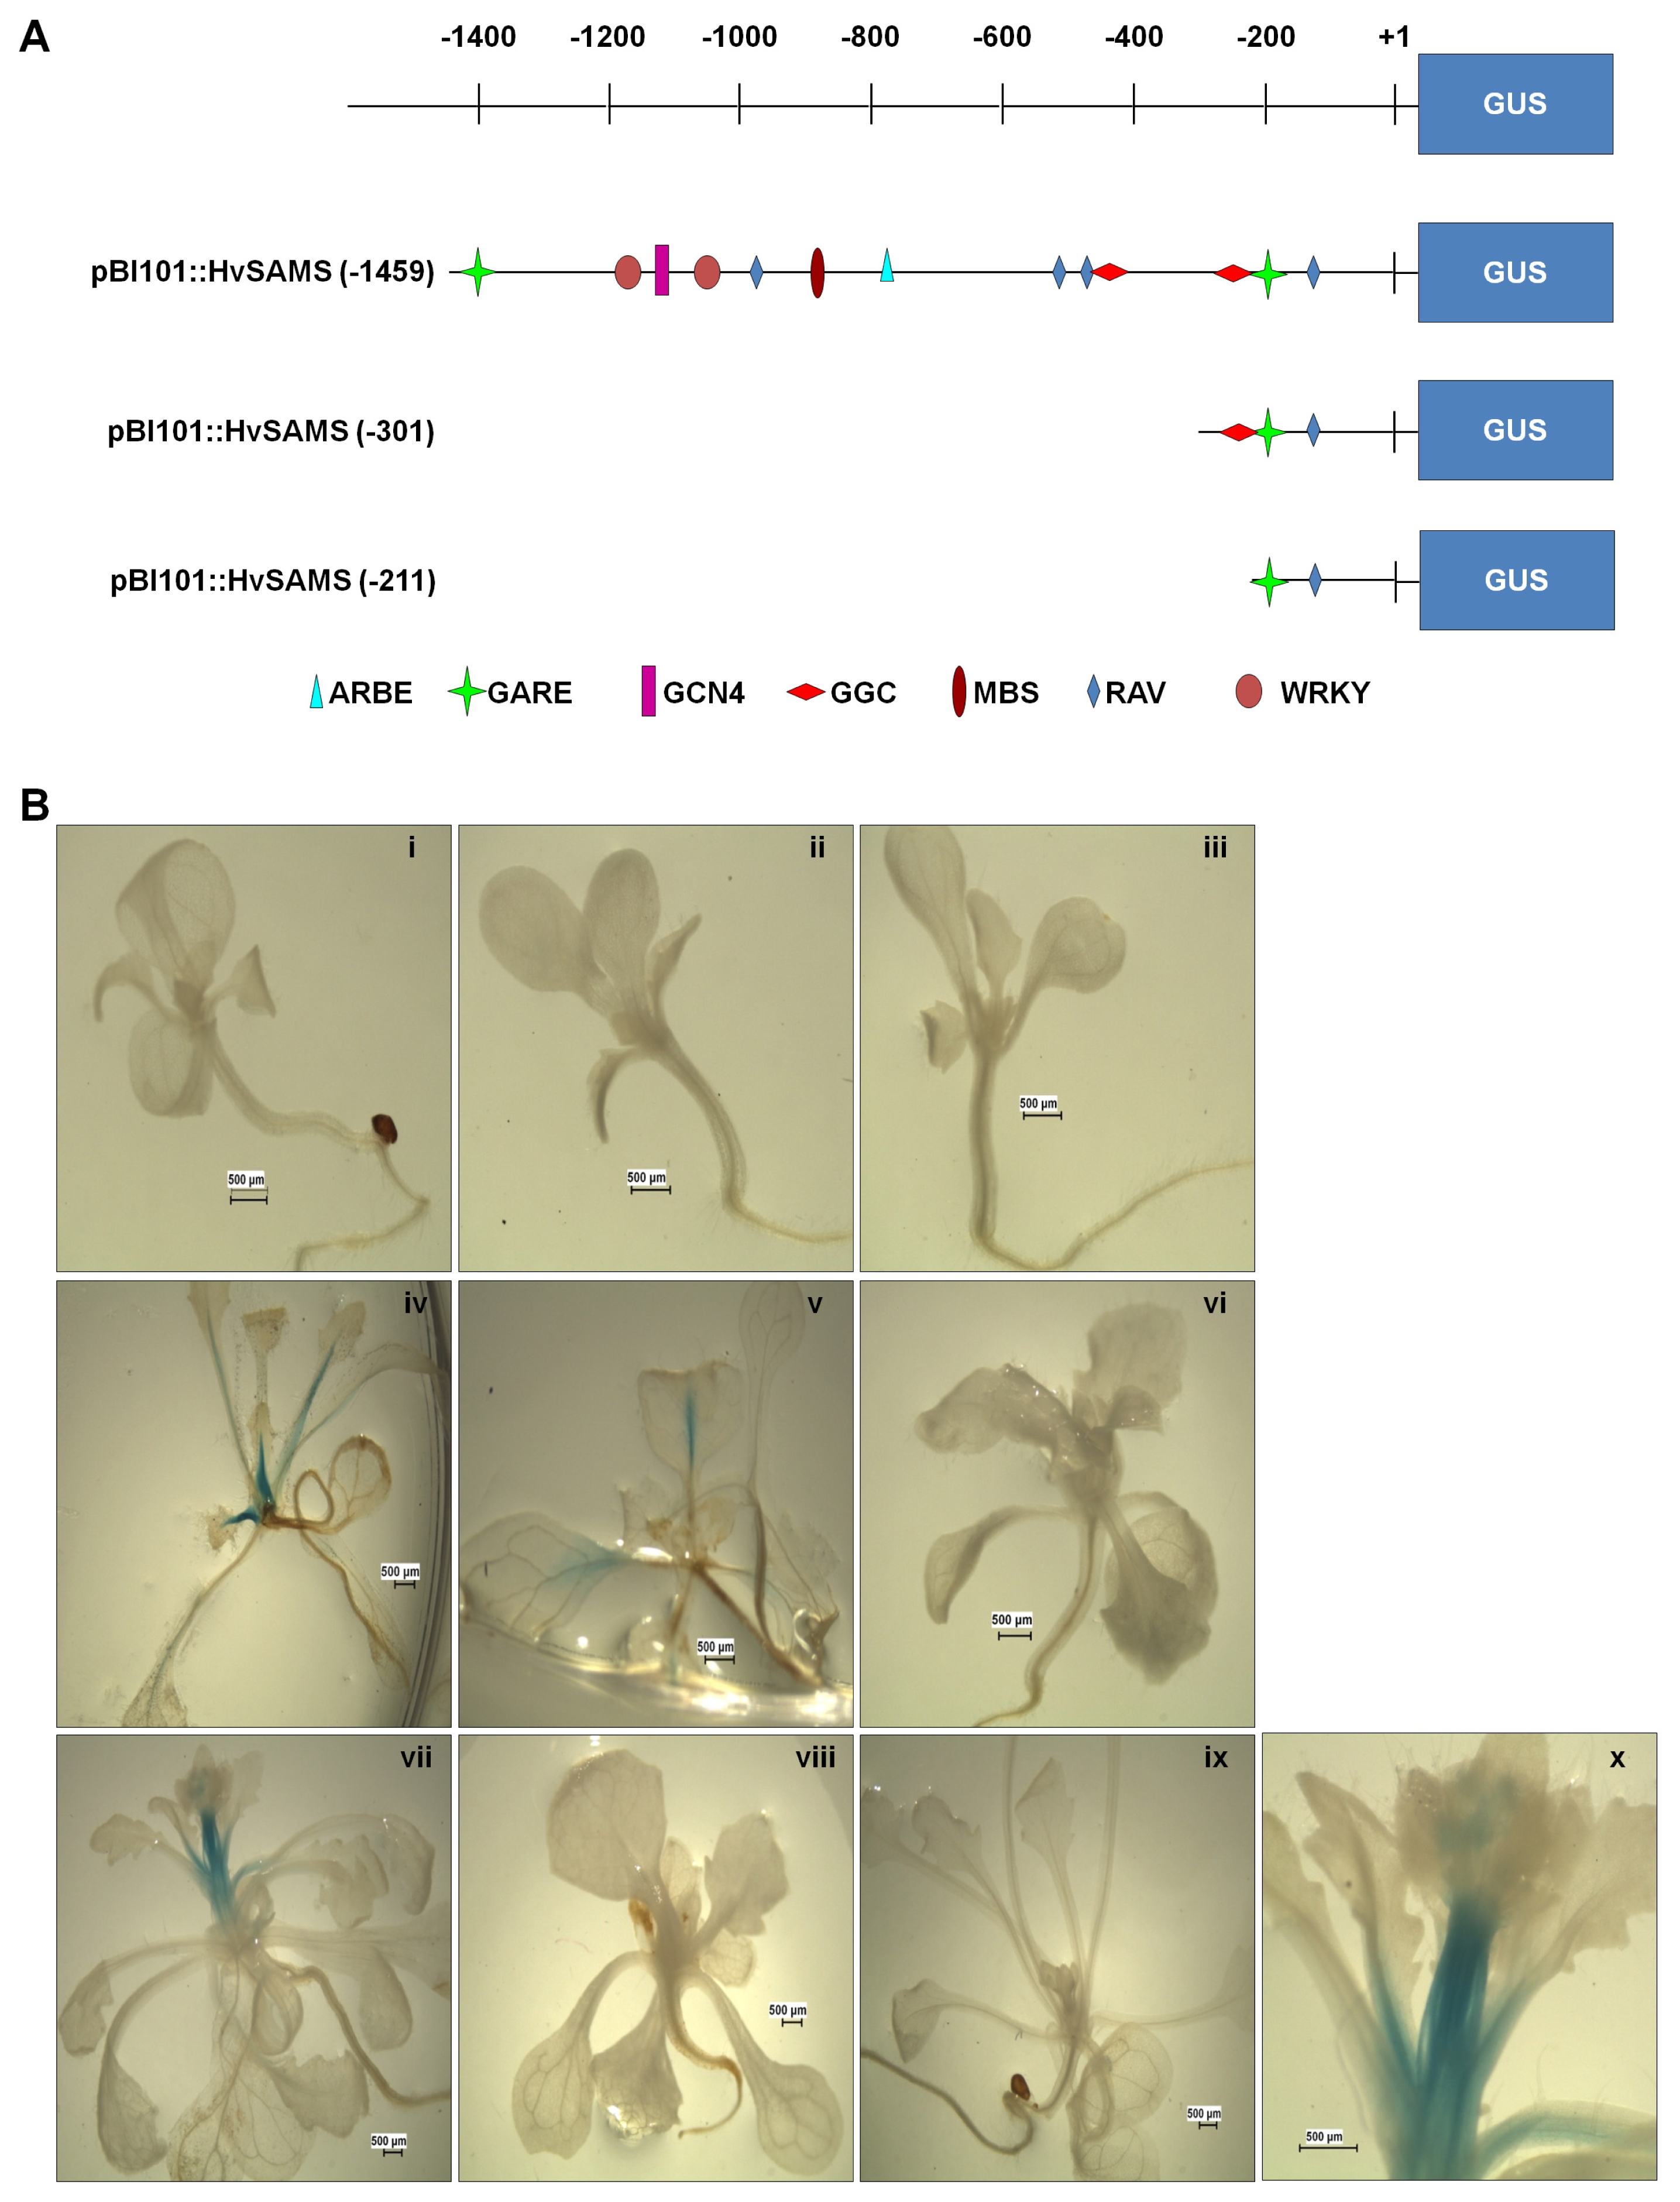
Fig. 5Subcellular localization of the HvSAMS1 protein in onion cells. Onion epidermal cells expressing cytosolic GFP marker and HvSAMS1 :: GFP fusion protein were examined at 24 h after transformation under a confocal laser scanning microscope (Bio-Rad MRC-1024) fitted with filters (excitation filter, 450–490 nm; emission filter, 520 nm).
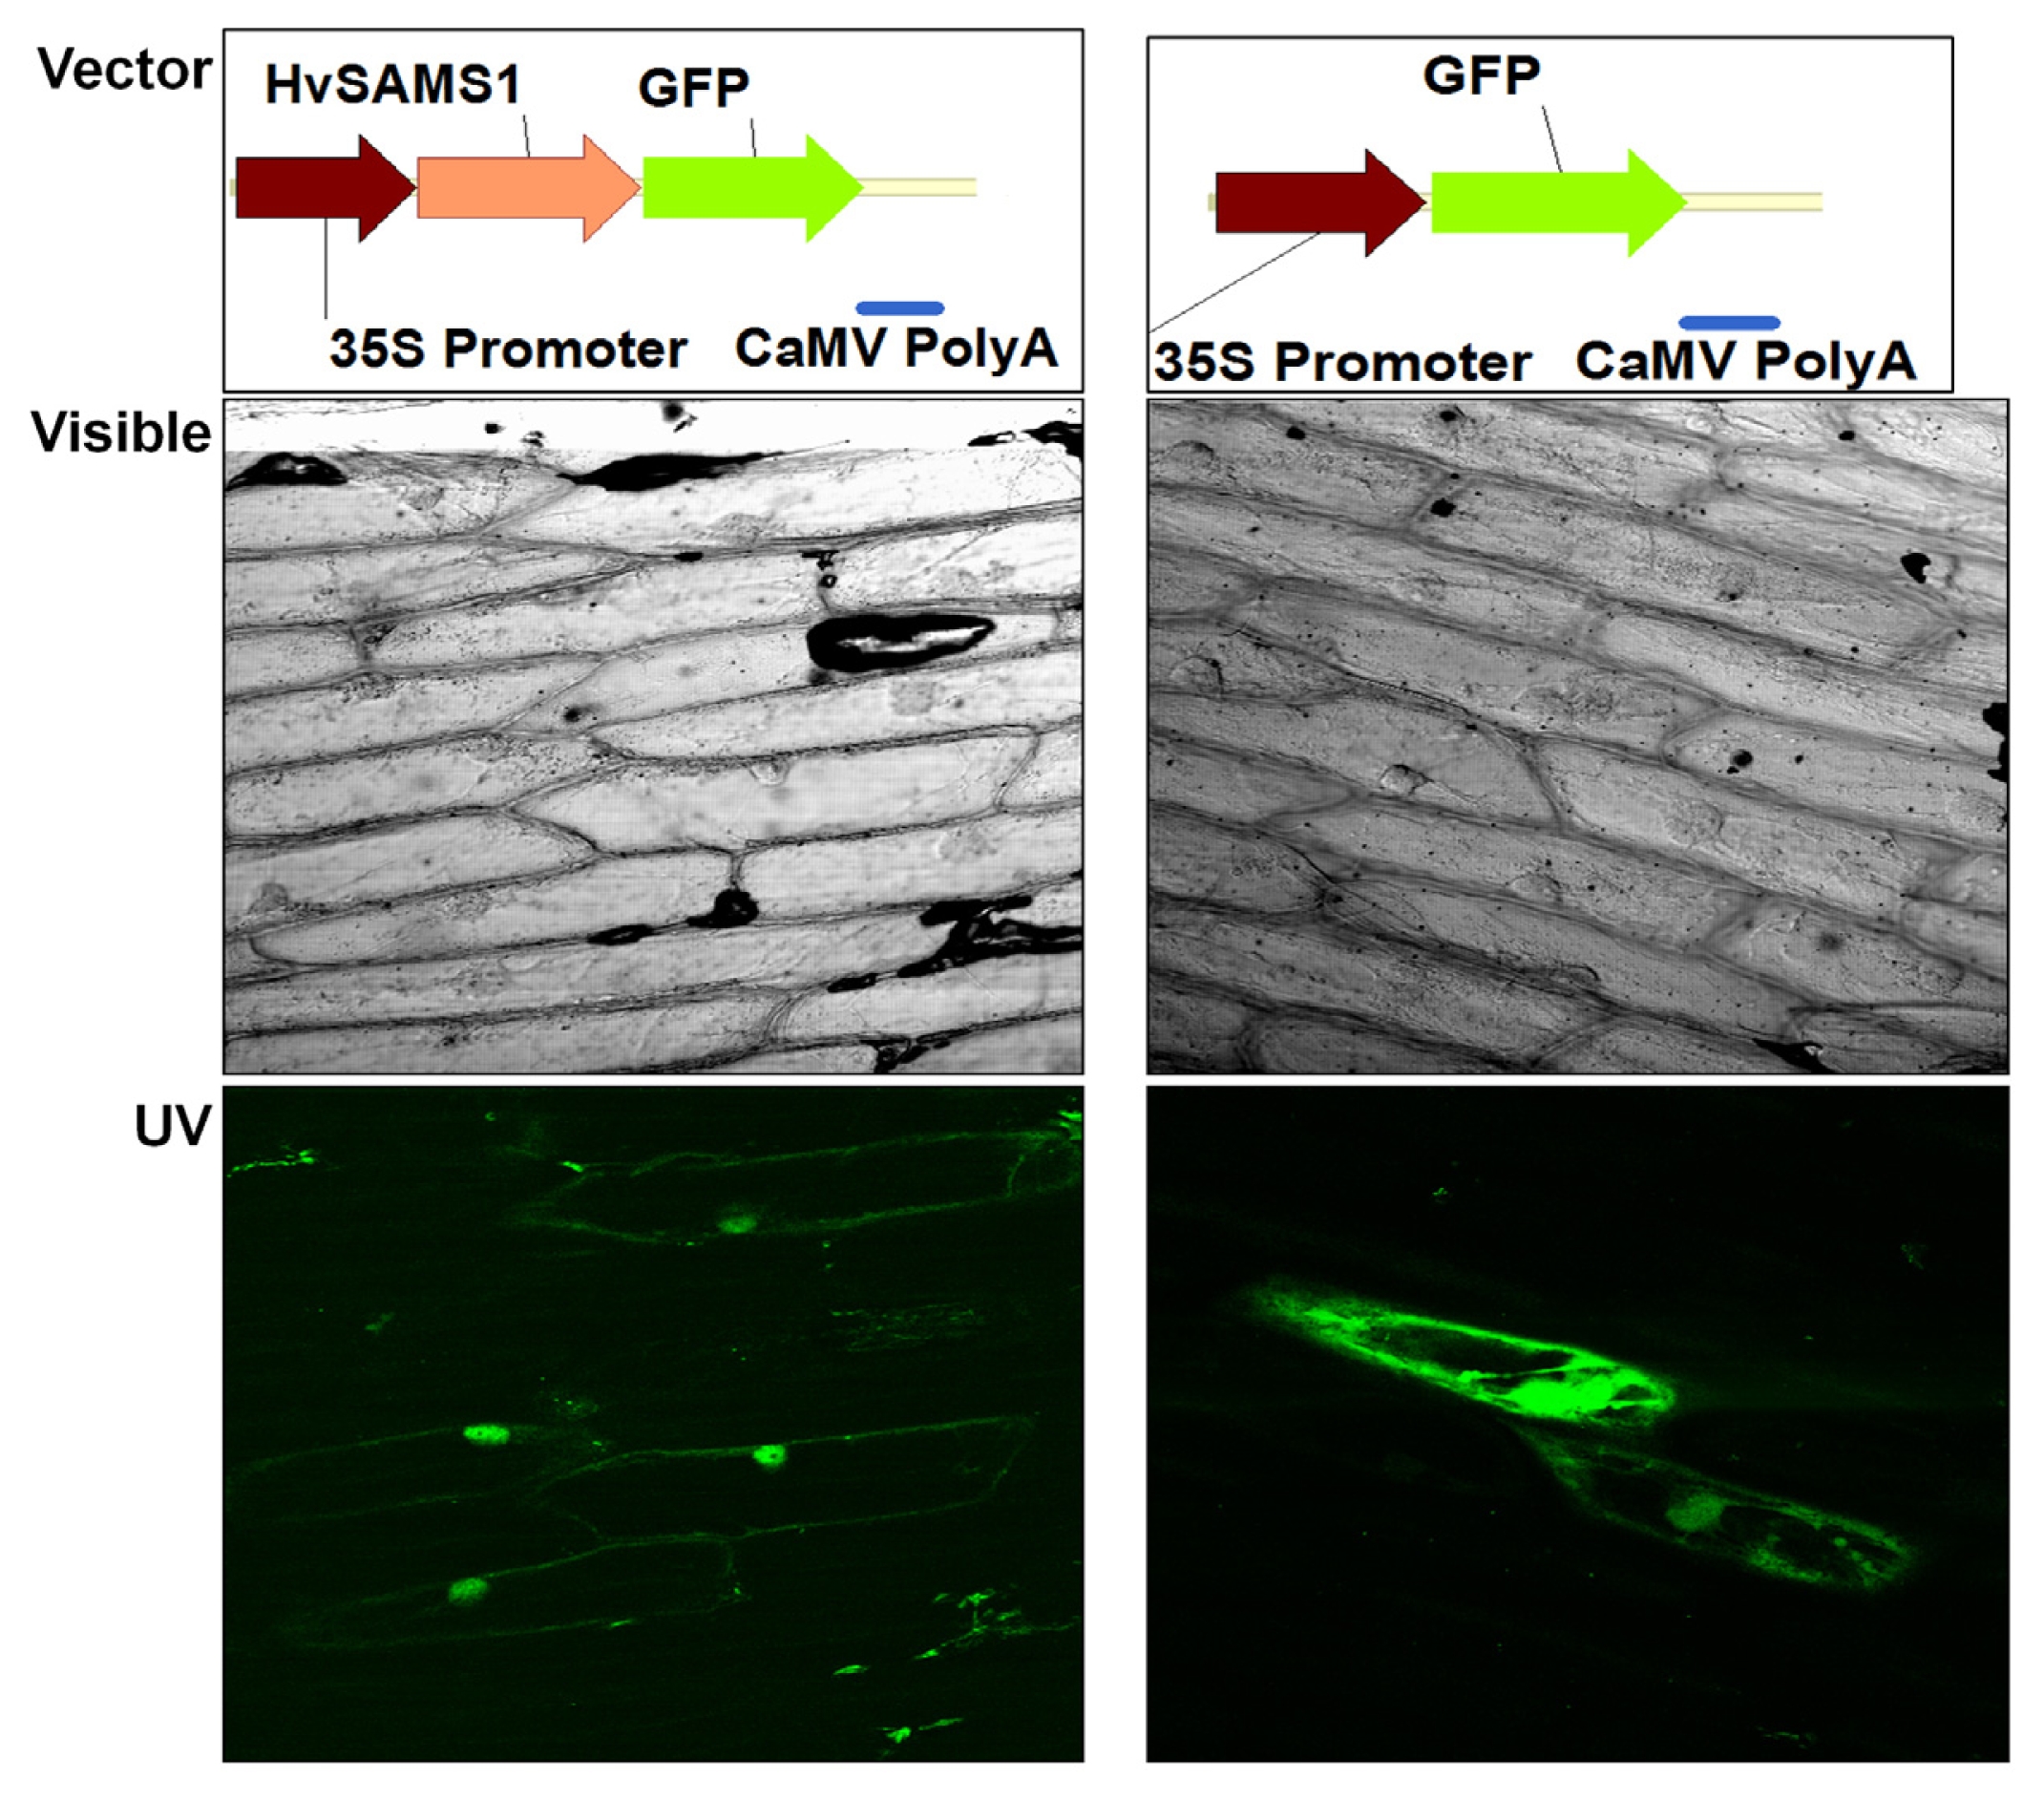
Fig. 6Growth characteristics of Arabidopsis transgenic plants overexpressing HvSAMS1. (A) comparison of the phenotypes of 1-week-old transgenic line (T3) and wild-type. (B) comparison of the phenotypes of 2-week-old transgenic line (T3) and wild-type. (C) bolt appearance and extension of 4-week-old transgenic line (T3) and wild-type. (D) comparison of seed germination phenotypes of 1-week-old transgenic line (T3) and wild-type on MS medium which contained 1μM of GA3.

Appendix Fig. 1Schematic representation of the 5′ UTRs of the HvSAMS1, 2, 3, and 4. Solid bars represent exons (E1 and E2), whereas introns were indicated by the straight/“Λ” lines. The nucleotide of the ATG translation initiation codon was assigned as position 1 in the nucleotide sequence, and the nucleotide positions upstream of position 1 were presented as negative numbers.
Appendix Fig. 2PCR screening of transgenic HvSAMS lines. Lane 1–24 represents putative transgenic plants that survived on selection medium. M, molecular size marker; NC, negative control (wild-type); PC, HvSAMS1 overexpression plasmid DNA.
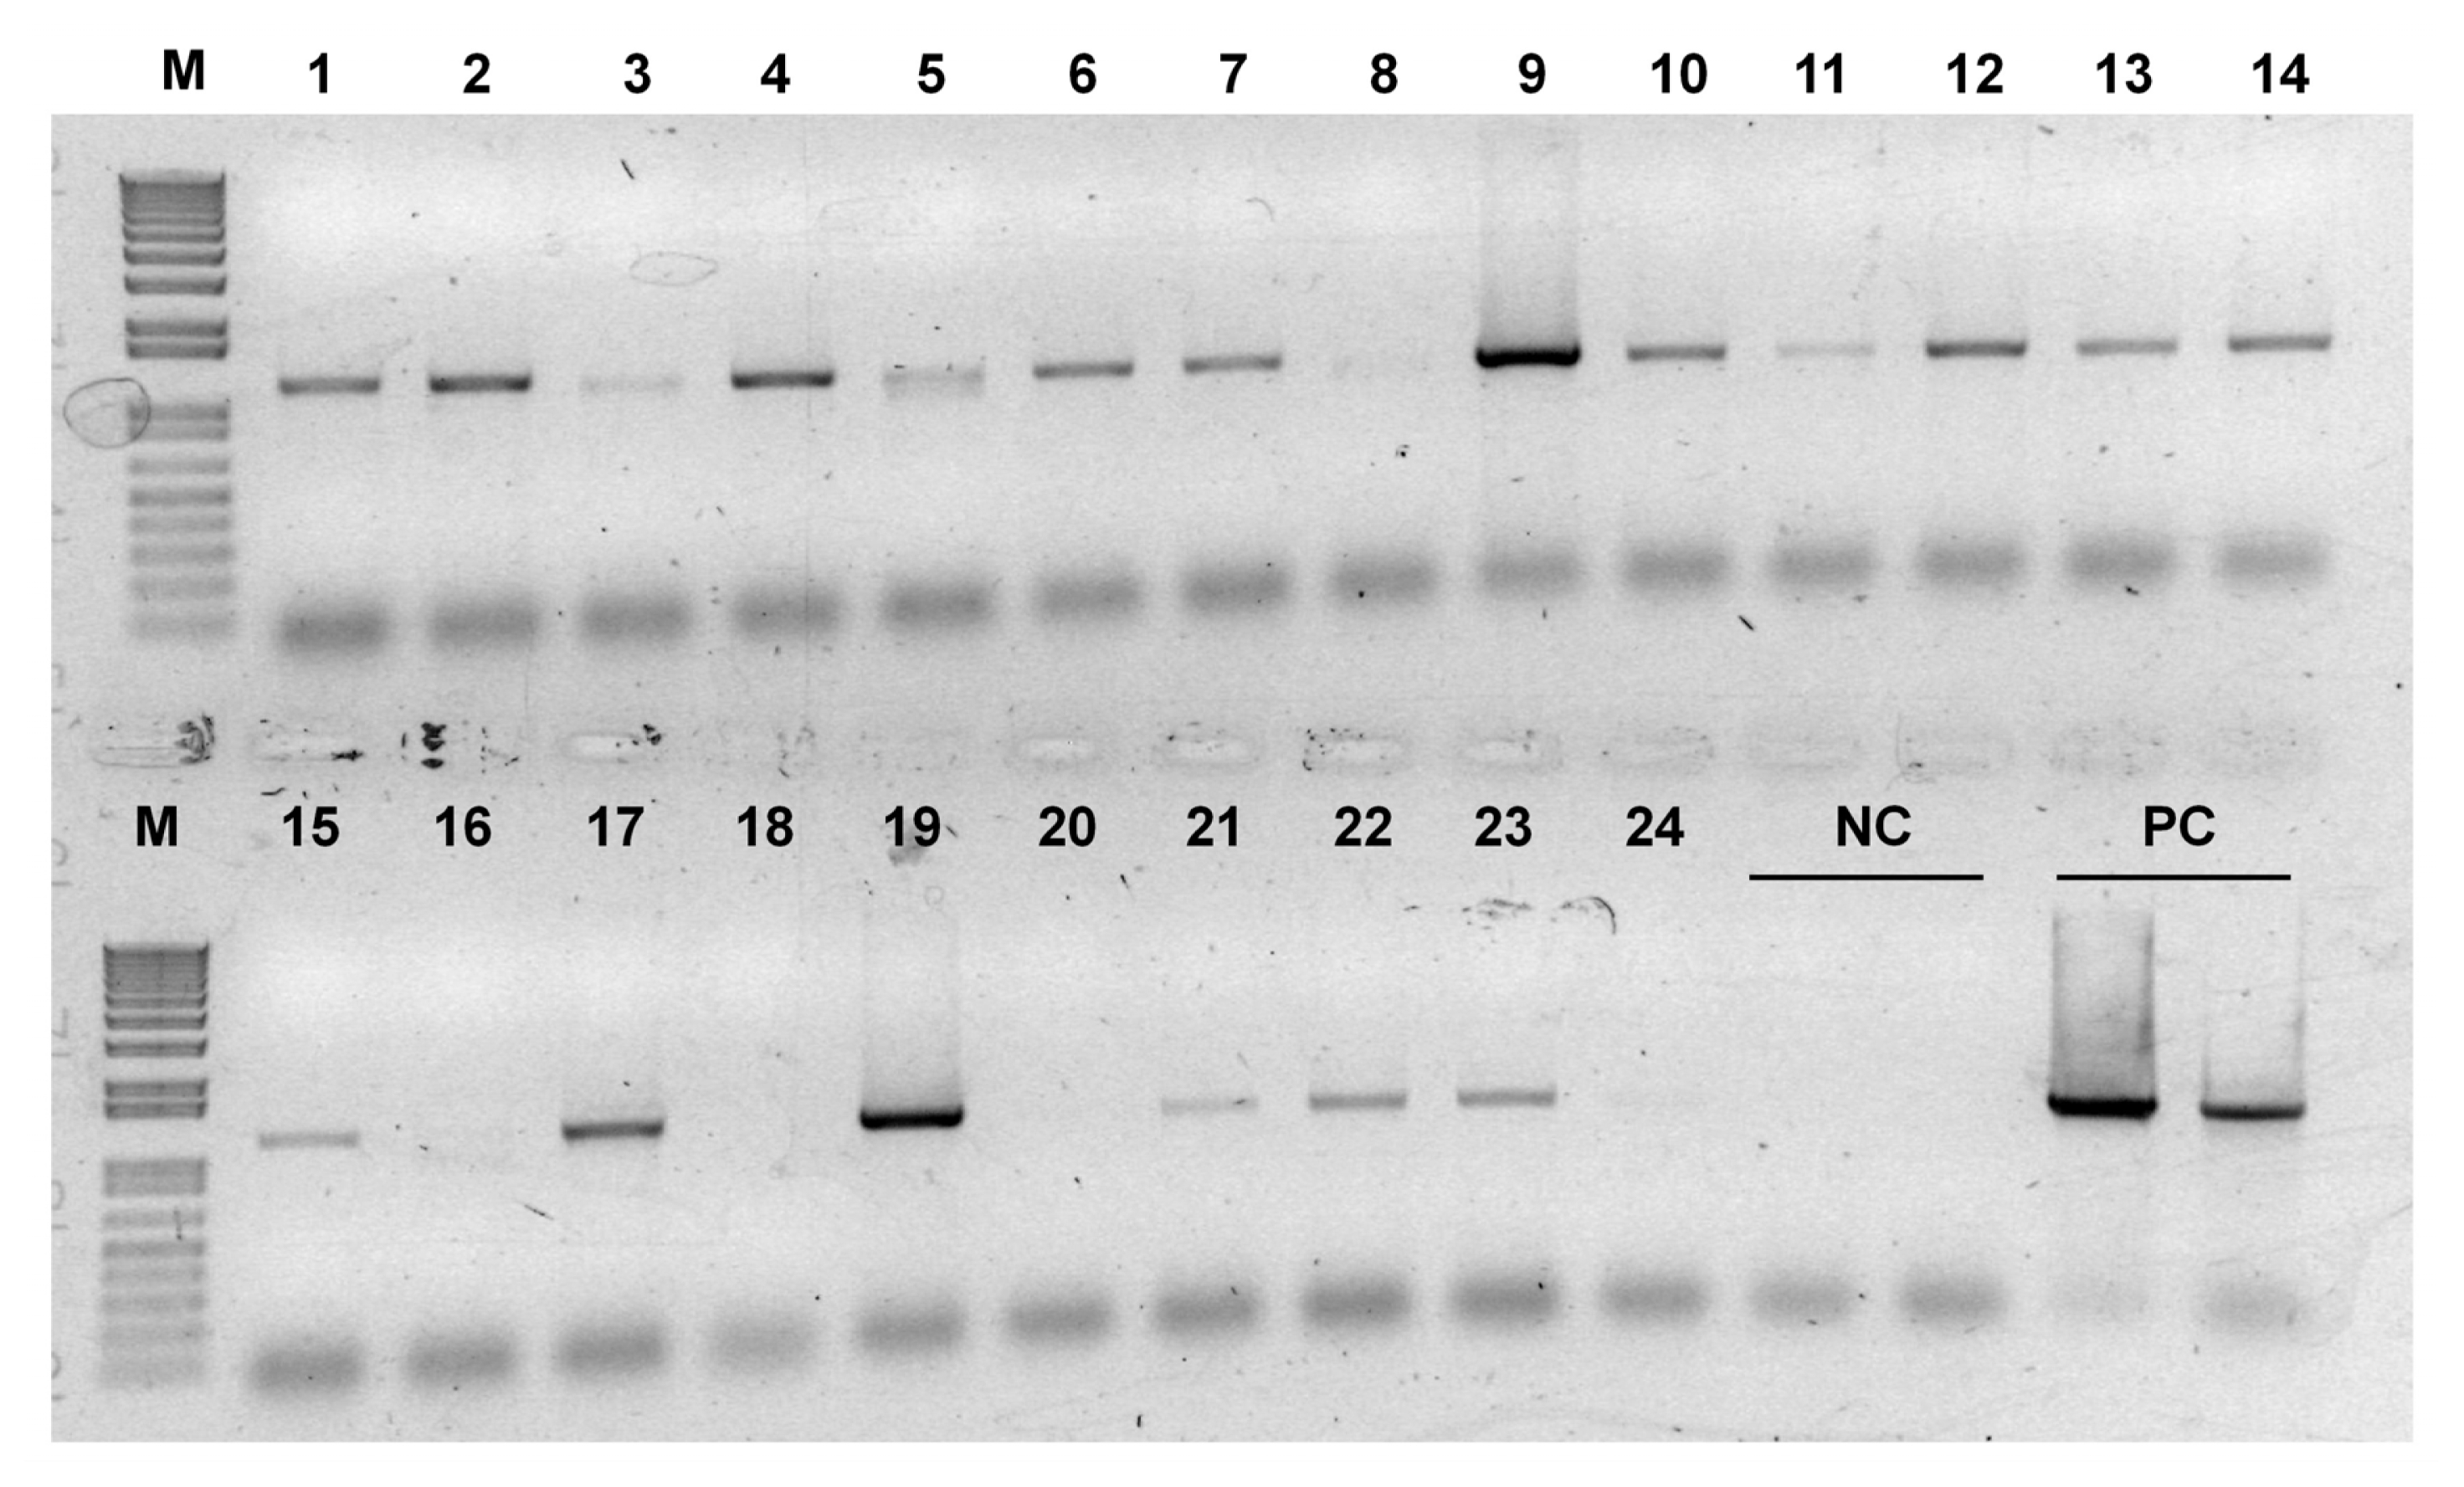
Table 1List of primers used for gene cloning from cDNA and genomic DNA, promoter isolation, and RT-PCR.
Table 1
|
Gene |
Sequence |
Direction |
Purpose |
|
HvSAMS1
|
5′-CGGCCTCCTGAACAATAGCATCAGCAC-3′ |
sense |
C |
|
5′-GGATTGTTGAACTAGAGTGGCAGCAGAC-3′ |
antisense |
|
5′-GATTCGACCTCTTTCGGTTCG-3′ |
sense |
R |
|
5′-CAGCACACTCAAAAAGAAAATGAA-3′ |
antisense |
|
5′-CCACGAAAGAAATGGCGG-3′ |
sense |
G |
|
5′-CCAATTGCACAAACCATGAT-3′ |
antisense |
|
5′-AAATTTGCAACGTTCATGGGCGGCATGGG-3′ |
antisense |
P |
|
5′-TAGTCGCTTGGATGCGTGTCTTACGG-3′ |
antisense |
|
|
HvSAMS2
|
5′-GAGAGCATCTCTACCACCAAAG-3′ |
sense |
C |
|
5′-CCTTGCCGAACTTGAGAGGCAT-3′ |
antisense |
|
5′-CGACCTCTTCCTTTCGGTTTCTC-3′ |
sense |
R |
|
5′-GAGGAGCAAAAGGATCCCGCCT-3′ |
antisense |
|
5′-AAAGAAATGGCGGCCGAGACGTTC-3′C |
sense |
G |
|
5′-TCTTGTTCTTAAGCAGATGCCTTG-3′ |
antisense |
|
5′-CCTCTCAACTGCTTCATGGCCGACGAAG-3′ |
antisense |
P |
|
5′-GTAATTTTGCTACATTCTTCAACCGGCATC-3′ |
antisense |
|
|
HvSAMS3
|
5′-GGAGCAATAGAAGCGGCACAAG-3′ |
sense |
C |
|
5′-CCGCCTTGCCGAACTTGAGA-3′ |
antisense |
|
5′-CGGCACGAGGTCGCCTCTTC-3′ |
sense |
R |
|
5′-CAGTGTAGCACGTCGCAGCG-3′ |
antisense |
|
5′-GAAAGAAATGGCGGCCGAGACA-3′ |
sense |
G |
|
5′-TCTTGTTCTTAGGCAGATGCCTTG-3′ |
antisense |
|
5′-GTCGACGAAAACGTCTCTTTCCACTGAAAGCACA-3′ |
antisense |
P |
|
5′-CTGAGACTTAAACTCTGGTGGGCAGTGGA-3′ |
antisense |
|
|
HvSAMS4
|
5′-ATCGTGCGGTCCGATCTGGC-3′ |
sense |
C |
|
5′-TAAAACTAATTTTATTCAGAGGCTTC-3′ |
antisense |
|
5′-CGAGGAGGCGGCTTCATTTTGC-3′ |
sense |
R |
|
5′-CAGCACTGGAGCAATGAATAGAG-3′ |
antisense |
|
5′-GGCCAAAGAAGATGGCTGAAGTTG-3′ |
sense |
G |
|
5′-GTGTTTGCTCAGGCAGAAGGCTTC-3′ |
antisense |
|
5′-GGGAGTTGAGGAAACTAATGGCTCCA-3′GC |
antisense |
P |
|
5′-GGCCGAATTAGTTGACTCAGATTTGTCTAG-3′ |
antisense |
Table 2Characteristics of HvSAMS cDNAs and proteins from Hordeum vulgare subsp. vulgare.
Table 2
|
Gene |
cDNA |
Mature Protein |
|
|
|
Length (bp) |
Identity (%) |
Length (aa) |
kDa |
pI |
Identity (%) |
|
|
|
HvSAMS1
|
HvSAMS2
|
HvSAMS3
|
HvSAMS1 |
HvSAMS2 |
HvSAMS3 |
|
|
|
HvSAMS1 |
1185 |
|
|
|
394 |
42.8 |
5.58 |
|
|
|
|
HvSAMS2 |
1185 |
95 |
|
|
394 |
42.8 |
5.49 |
99 |
|
|
|
HvSAMS3 |
1185 |
92 |
93 |
|
394 |
42.7 |
5.52 |
96 |
97 |
|
|
HvSAMS4 |
1191 |
79 |
80 |
80 |
396 |
43.2 |
5.40 |
90 |
90 |
89 |
Appendix Table 1Differentially expressed clones in grain of K800 (GSHO 2504, eam10)
Appendix Table 1
|
Clone |
Putative Identification |
origin |
E-value |
Length (A.A) |
|
EA3 |
Methionine synthase enzyme 1 |
Hordeum vulare subsp. Vulgare
|
1e-65 |
765 |
|
EA4 |
Predicted protein |
Hordeum vulare subsp. Vulgare
|
2e-82 |
679 |
|
EA5 |
Predicted protein |
Hordeum vulare subsp. Vulgare
|
4e-67 |
392 |
|
EA6 |
Predicted protein |
Hordeum vulare subsp. Vulgare
|
7e-43 |
389 |
|
EA13 |
S-adenosylmethionine synthetase |
Populus nigra
|
4e-43 |
95 |
|
EA16 |
Predicted protein |
Hordeum vulare subsp. Vulgare
|
2e-66 |
525 |
|
EA18 |
H2A2_Wheat |
Triticum aestivum
|
3e-22 |
151 |
|
EA19 |
Vacuolar proton-inorganic pyrophosphatase |
Hordeum vulare subsp. Vulgare
|
4e-65 |
771 |
|
EA24 |
Predicted protein |
Hordeum vulare subsp. Vulgare
|
8e-74 |
171 |
|
EA30 |
Putative syntaxin-related protein |
Triticum aestivum
|
5e-83 |
302 |
|
EA31 |
Predicted protein |
Hordeum vulare subsp. Vulgare
|
2e-46 |
422 |
|
EA32 |
Predicted protein |
Hordeum vulare subsp. Vulgare
|
3e-54 |
306 |
|
EA33 |
Cytosolic Cu/Zn superoxide dismutase |
Triticum aestivum
|
9e-49 |
152 |
|
EA34 |
Predicted protein |
Hordeum vulare subsp. Vulgare
|
6e-07 |
182 |
|
EA35 |
Predicted protein |
Hordeum vulare subsp. Vulgare
|
3e-85 |
324 |
|
EA36 |
Predicted protein |
Hordeum vulare subsp. Vulgare
|
2e-94 |
948 |
|
EA41 |
Predicted protein |
Hordeum vulare subsp. Vulgare
|
9e-98 |
507 |
|
EA42 |
Predicted protein |
Hordeum vulare subsp. Vulgare
|
2e-96 |
270 |
|
EA43 |
Predicted protein |
Hordeum vulare subsp. Vulgare
|
3e-80 |
333 |
|
EA44 |
S-adenosylmethionine decarboxylase |
Triticum monococcum
|
0.034 |
388 |
|
EA45 |
70 kDa heat shock protein |
Sandersonia aurantiaca
|
2e-67 |
336 |
|
EA46 |
Predicted protein |
Hordeum vulare subsp. Vulgare
|
2e-90 |
507 |
|
EA47 |
Predicted protein |
Hordeum vulare subsp. Vulgare
|
4e-82 |
128 |
|
EB5 |
Predicted protein |
Hordeum vulare subsp. Vulgare
|
2e-101 |
509 |
|
EB7 |
Hypothetical protein ZAEMMB73_626728 |
Zea mays
|
1e-07 |
280 |
|
EB25 |
Predicted protein |
Hordeum vulare subsp. Vulgare
|
4e-04 |
963 |
|
EF49 |
Predicted protein |
Hordeum vulare subsp. Vulgare
|
2e-111 |
581 |
|
EB97 |
Predicted protein |
Hordeum vulare subsp. Vulgare
|
3e-20 |
257 |
|
EF51 |
Predicted protein |
Hordeum vulare subsp. Vulgare
|
1e-94 |
272 |
|
EB100 |
OSIGBa0096P03.8 |
Oryza sativa indica Group
|
2e-30 |
381 |
|
EF52 |
Predicted protein |
Hordeum vulare subsp. Vulgare
|
7e-112 |
563 |
|
EC13 |
Predicted protein |
Hordeum vulare subsp. Vulgare
|
2e-54 |
293 |
|
EF54 |
Os02g0615800 |
Oryza sativa Japonica Group
|
1e-71 |
1001 |
|
EB43 |
Non-specific lipid-transfer protein 3 |
Hordeum vulgare
|
2e-06 |
118 |
|
ED4 |
RuBisCO large subunit-binding protein beta |
Secale cereal
|
6e-50 |
499 |
|
ED14 |
Vacuolar processing enzyme 2d |
Hordeum vulare subsp. Vulgare
|
4e-91 |
493 |
|
EB58 |
Hypothetical protein Osl_10238 |
Oryza sativa indica Group
|
2e-14 |
156 |
|
EE65 |
Predicted protein |
Hordeum vulare subsp. Vulgare
|
1e-57 |
129 |
|
EB61 |
Elongation factor 1-alpha |
Triticum aestivum
|
5e-36 |
447 |
|
EE99 |
Lipoxygenase 2 |
Hordeum vulare subsp. Vulgare
|
4e-58 |
864 |
|
EF67 |
Predicted protein |
Hordeum vulare subsp. Vulgare
|
1e-88 |
436 |
|
EE100 |
Chain K |
Triticum aestivum
|
3e-24 |
206 |
|
EF68 |
Predicted protein |
Hordeum vulare subsp. Vulgare
|
5e-67 |
694 |
|
EF69 |
Predicted protein |
Hordeum vulare subsp. Vulgare
|
3e-54 |
226 |
|
EB76 |
Predicted protein |
Hordeum vulare subsp. Vulgare
|
4e-31 |
447 |
|
EF3 |
Probable galaturonosyltransferase-like 7-like |
Brachypodium distachyon
|
3e-79 |
367 |
|
EF72 |
Hypothetical protein OsJ_18634 |
Oryza sativa Japonica Group
|
1e-82 |
586 |
|
EB77 |
QM |
Triticum aestivum
|
2e-08 |
178 |
|
EF82 |
Predicted protein |
Hordeum vulare subsp. Vulgare
|
1e-146 |
388 |
|
EF29 |
Gene X-like protein |
Brachypodium distachyon
|
2e-26 |
813 |
|
EF84 |
Putative carbonic anhydrase |
Secale cereale x Triticum durum
|
2e-117 |
259 |
|
EB82 |
Predicted protein |
Hordeum vulare subsp. Vulgare
|
2e-11 |
487 |
|
EF33 |
Papin-like cysteine proteinase |
Hordeum vulare subsp. Vulgare
|
8e-82 |
381 |
|
EF88 |
Predicted protein |
Hordeum vulare subsp. Vulgare
|
1e-86 |
219 |
|
EB92 |
Predicted protein |
Hordeum vulare subsp. Vulgare
|
2e-48 |
538 |
|
EF34 |
Predicted protein |
Hordeum vulare subsp. Vulgare
|
1e-98 |
401 |
|
EF89 |
Root abundant factor |
Hordeum vulgare
|
7e-50 |
328 |
|
EF43 |
Predicted protein |
Hordeum vulare subsp. Vulgare
|
3e-135 |
376 |
|
EF98 |
Uncharacterized protein LOC100836267 |
Brachypodium distachyon
|
6e-84 |
1305 |
|
EF44 |
Predicted protein |
Hordeum vulare subsp. Vulgare
|
3e-64 |
253 |
|
EF99 |
Uncharacterized membrane protein At1g16860-like |
Brachypodium distachyon
|
4e-84 |
423 |
Appendix Table 2Analysis of 5′ untranslated regions of HvSAMS1, 2, 3, and 4. The PlantCare was used for each cis-elements
Appendix Table 2
|
Gene |
cDNA |
genomic DNA |
conserved sequence |
function |
|
cis-element |
location |
cis-element |
location |
|
HvSAMS1
|
AAGAA-motif |
(+)78 |
AAGAA-motif |
(−)601
(+)1825 |
GAAAGAA |
|
|
CAAT-box |
(+)37 |
CAAT-box |
(−)1553
(−)920
(−)1718
(+)1176
(−)1562 |
CAAT |
common cis-acting element in promoter and enhancer regions |
|
EIRE |
(+)5 |
EIRE |
(+)959 |
TTCGACC |
elicitor-responsive element |
|
LTR |
(−)14 |
LTR |
(−)968 |
CCGAAA |
cis-acting element involved in low-temperature responsiveness |
|
MBS |
(+)51 |
MBS |
(−)480
(+)1005 |
CAACTG |
MYB binding site involved in drought-inducibility |
|
SARE |
(+)5 |
SARE |
(+)959 |
TTCGACCTCCTT |
cis-acting element involved in salicylic acid responsiveness |
|
circadian |
(+)37 |
|
|
CAANNNNATC |
cis-acting regulatory element involved in circadian control |
|
|
A-box |
(−)515 |
CCGTCC |
cis-acting regulatory element |
|
|
C-box |
(+)1367 |
CTGACGTCAG |
cis-acting regulatory element involved in light responsiveness |
|
|
G-box |
(+)570
(+)891
(+)675
(+)1756 |
CACGTT |
cis-acting regulatory element involved in light responsiveness |
|
|
TCA-element |
(+)453 |
CCATCTTTTT |
cis-acting element involved in salicylic acid responsiveness |
|
|
TGACG-motif |
(+)898
(+)1519
(+)1368 |
TGACG |
cis-acting regulatory element involved in the MeJA-responsiveness |
|
HvSAMS2
|
|
|
CGTCA-motif |
(+)1179
(+)1472 |
CGTCA |
cis-acting regulatory element involved in the MeJA-responsiveness |
|
|
G-Box |
(−)928 |
CACGTA |
cis-acting regulatory element involved in light responsiveness |
|
CAAT-box |
(+)9 |
CAAT-box |
(+)831
(−)1585
(+)469
(+)1064
(−)589
(+)1494
(−)758
(−)289 |
CAAT |
common cis-acting element in promoter and enhancer regions |
|
GAG-motif |
(−)37 |
|
|
AGAGATG |
light responsive element |
|
MBS |
(+)23 |
MBS |
(+)845 |
CAACTG |
MYB binding site involved in drought-inducibility |
|
circadian |
(+)9 |
circadian |
(−)583
(+)831 |
CAANNNNATC |
cis-acting regulatory element involved in circadian control |
|
|
A-box |
(−)1311
(−)1626
(−)1562 |
CCGTCC |
cis-acting regulatory element |
|
|
ABRE |
(+)928 |
TACGTG |
cis-acting element involved in the abscisic acid responsiveness |
|
|
GCN4_motif |
(−)628 |
TGAGTCA |
cis-regulatory element involved in endosperm expression |
|
|
LTR |
(−)808 |
CCGAAA |
cis-acting element involved in low-temperature responsiveness |
|
|
Skn-1_motif |
(+)448
(−)461 |
GTCAT |
cis-acting regulatory element required for endosperm expression |
|
|
TGA-element |
(−)1300 |
AACGAC |
auxin-responsive element |
|
|
TGACG-motif |
(−)1179
(−)1472 |
TGACG |
cis-acting regulatory element involved in the MeJA-responsiveness |
|
HvSAMS3
|
CAAT-box |
(+)29 |
CAAT-box |
(+)1594
(−)1894
(+)781
(+)1147
(−)453 |
CAAT |
common cis-acting element in promoter and enhancer regions |
|
circadian |
(+)43 |
|
|
CAANNNNATC |
cis-acting regulatory element involved in circadian control |
|
|
ABRE |
(+)876
(−)1139 |
TACGTG |
cis-acting element involved in the abscisic acid responsiveness |
|
|
AuxRR-core |
(+)1802 |
GGTCCAT |
cis-acting regulatory element involved in auxin responsiveness |
|
|
CGTCA-motif |
(+)854 |
CGTCA |
cis-acting regulatory element involved in the MeJA-responsiveness |
|
|
G-box |
(+)678
(−)1430
(+)1141
(+)1868
(+)876
(−)1491 |
CACGTA |
cis-acting regulatory element involved in light responsiveness |
|
|
MBS |
(−)982 |
CGGTCA |
MYB Binding Site |
|
|
Skn-1_motif |
(+)855
(+)1857 |
GTCAT |
cis-acting regulatory element required for endosperm expression |
|
|
TCA-element |
(+)549 |
GAGAAGAATA |
cis-acting element involved in salicylic acid responsiveness |
|
|
TGACG-motif |
(−)854 |
TGACG |
cis-acting regulatory element involved in the MeJA-responsiveness |
|
HvSAMS4
|
CGTCA-motif |
(+)23 |
CGTCA-motif |
(−)316 |
CGTCA |
cis-acting regulatory element involved in the MeJA-responsiveness |
|
Skn-1-motif |
(+)24 |
Skn-1-motif |
(−)1364 |
GTCAT |
cis-acting regulatory element required for endosperm expression |
|
circadian |
(+)20 |
circadian |
(−)1054 |
CAANNNNATC |
cis-acting regulatory element involved in circadian control |
|
|
ABRE |
(−)220
(−)305 |
TACGTG |
cis-acting element involved in the abscisic acid responsiveness |
|
|
AuxRR-core |
(+)951 |
GGTCCAT |
cis-acting regulatory element involved in auxin responsiveness |
|
|
CAAT-box |
(−)216
(+)981
(−)987
(−)1288
(+)1350 |
CAAT |
common cis-acting element in promoter and enhancer regions |
|
|
ERE |
(+)1465 |
ATTTCAAA |
ethylene-responsive element |
|
|
G-Box |
(+)220
(+)1538
(−)270 |
CACGTA |
cis-acting regulatory element involved in light responsiveness |
|
|
GCN4_motif |
(+)96 |
TGAGTCA |
cis-regulatory element involved in endosperm expression |
|
|
LTR |
(+)157 |
CCGAAA |
cis-acting element involved in low-temperature responsiveness |
|
|
MBS |
(+)1384 |
CAACTG |
MYB binding site involved in drought-inducibility |
|
|
TCA-element |
(+)1162
(−)1500 |
GAGAAGAATA |
cis-acting element involved in salicylic acid responsiveness |
|
|
TGA-element |
(+)297 |
AACGAC |
auxin-responsive element |
|
|
TGACG-motif |
(+)316 |
TGACG |
cis-acting regulatory element involved in the MeJA-responsiveness |
References
- Altschul SF, Madden TL, Schäffer AA, Zhang J, Zhang Z, Miller W, Lipman DJ. 1997. Gapped BLAST and PSI-BLAST: a new generation of protein database search programs. Nucleic Acids Res. 25: 3389-3402.
- Belbahri L, Chevalier L, Bensaddek L, Gillet F, Flianiaux MA, Boerjan W, Inze D, Thomas D, Thomasset B. 2000. Co-suppression of S-adenosylmethionine synthetase expression in tobacco callus modifies alkaloid biosynthesis. Biotech Bioeng. 69: 11-20.
- Belny M, Hérouart D, Thomasset B, David H, Jacquin-Dubreuil A, David A. 1997. Transformation of Papaver somniferum cell suspension cultures with sam1 from A. thaliana results in cell lines of different S-adenosyl-L-methionine synthetase activity. Phygiol Plant. 99: 233-240.
- Boerjan W, Bauw G, Montagu M, Inzé D. 1994. Distinct phenotypes generated by overexpression and suppression of S-adenosyl-L-methionine synthetase reveal developmental patterns of gene silencing in tobacco. Plant Cell. 6: 1401-1414.
- Börner A, Buck-Sorin GH, Hayes PM, Malyshev S, Korzun V. 2002. Molecular mapping of major genes and quantitative trait loci determining flowering time in response to photoperiod in barley. Plant Breed. 121: 129-132.
- Cadman CSC, Toorop PE, Hilhorst HWM, Finch-Savage WE. 2006. Gene expression profiles of Arabidopsis Cvi seeds during dormancy cycling indicate a common underlying dormancy control mechanism. Plant J. 46: 805-822.
- Cai XL, Wang ZY, Xing YY, Zhang JL, Hong MM. 1998. Aberrant spicing of intron 1 leads to the heterogeneous 5′UTR and decreased expression of waxy gene in the rice cultivars of intermediate amylase content. Plant J. 14(4): 459-465.
- Cantoni GL. 1953. S-adenosylmethionine; A new intermediate formed enzymatically from L-methionine and adenosine triphosphate. J Biol Chem. 204: 403-416.
- Chen H, Nelson RS, Sherwood JL. 1994. Enhanced recovery of transformants of Agrobacterium tumefaciens after freeze-thaw transformation and drug selection. Biotechniques. 16: 664-668.
- Chiang PK, Chamberlin ME, Nicholson D, Soubes S, Su X, Subramanian G, Lanar DE, Prigge ST, Scovill JP, Miller LH. 1999. Molecular characterization of Plasmodium falciparum S-adenosylmethionine synthetase. Biochem J. 344: 571-576.
- Chung BYW, Simons C, Firth AE, Brown CM, Hellens RP. 2006. Effect of 5′UTR introns on gene expression in Arabidopsis thaliana. BMC Genomics. 7(120): 1-13.
- Ciaffi M, Paolacci AR, D’Aloisio E, Tanzarella OA, Porceddu E. 2005. Cloning and characterization of wheat PDI (protein disulfide isomerase) homeologous genes and promoter sequences. Gene. 366: 209-218.
- Clough SJ, Bent AF. 1998. Floral dip: a simplified method for Agrobacterium-mediated transformation of Arabidopsis thaliana. Plant J. 16(6): 735-743.
- Colucci G, Apone F, Alyeshmerini N, Chalmers D, Chrispeels MJ. 2002. GCR1, the putative Arabidopsis G protein-coupled receptor gene is cell cycle-regulated, and its overexpression abolishes seed dormancy and shortens time to flowering. Proc Natl Acad Sci USA. 99: 4736-4741.
- Dekeyser RA, Claes B, De Rycke R, Habets M, Van Montagu M, Caplan A. 1990. Transient gene expression in intact and organized rice tissues. Plant Cell. 2: 591-602.
- Espartero J, Pintor-Toro JA, Pardo JM. 1994. Differential accumulation of S-adenosylmethionine synthetase transcripts in response to salt stress. Plant Mol Biol. 25: 217-227.
- Franceschetti M, Hanfrey C, Scaramagli S, Torrigiani P, Bagni N, Burtin D, Michael AJ. 2001. Characterization of monocot and dicot plant S-adenosyl-L-methionine decarboxylase gene families including identification in the mRNA of a highly conserved pair of upstream overlapping open reading frames. Biochem J. 353: 403-409.
- Fujikake N, Nagai Y, Popiel HA, Kano H, Yamaguchi M, Toda T. 2005. Alternative splicing regulates the transcriptional activity of Drosophila heat shock transcription factor in response to heat/cold stress. FEBS Letters. 579: 3842-3848.
- Gallagher LW, Moktar LB. 2001. Inheritance of heading time in spring barley evaluated in multiple environments. Plant Breed. 120: 209-215.
- Gómez-Gómez L, Carrasco P. 1998. Differential expression of the S-adenosyl-L-Methionine synthetase gene during pea development. Plant Physiol. 117: 397-405.
- Goossens A, Häkkinen ST, Laakso I, Oksman-Caldentey KM, Inzé D. 2003. Secretion of secondary metabolites by ATP-binding cassette transporters in plant cell suspension cultures. Plant Physiol. 131: 1161-1164.
- Gowri G, Bugos RC, Campbell WH, Maxwell CA, Dixon RA. 1991. Stress responses in Alfalfa (Medicago sativa L.). Plant Physiol. 97: 7-14.
- Han F, Ullrich SE, Clancy JA, Romagosa I. 1999. Inheritance and fine mapping of a major barley seed dormancy QTL. Plant Sci. 143: 113-118.
- Heim WG, Lu RH, Jelesko JG. 2006. Expression of the SAM recycling pathway in Nicotiana tabacum roots. Plant Sci. 170: 835-844.
- Higo K, Ugawa Y, Iwamoto M, Korenaga T. 1999. Plant cis-acting regulatory DNA elements (PLACE) database: 1999. Nucleic Acids Res. 27(1): 297-300.
- Izhaki A, Shoseyov O, Weiss D. 1996. Temporal, spatial and hormonal regulation of the S-adenosylmethionine synthetase gene in petunia. Phys Plant. 97: 90-94.
- James VA, Neibaur I, Altpeter F. 2008. Stress inducible expression of the DREB1A transcription factor from xeric, Hordeum spontaneum L. in turf and forage grass (Paspalum notatum Flugge) enhances biotic stress tolerance. Transgenic Res. 17: 93-104.
- Jang CS, Lee MS, Kim JY, Kim DS, Seo YW. 2003. Molecular characterization of a cDNA encoding putative calcium binding protein, HvCaBP1, induced during kernel development in barley (Hordeum vulgare L.). Plant Cell Rep. 22: 64-70.
- Kende H, Zeevaart JAD. 1997. The five “Classical” plant hormones. Plant Cell. 9: 1197-1210.
- Kim DG, Park TJ, Kim JY, Cho YD. 1995. Purification and characterization of S-adenosylmethionine synthetase from soybean (Glycine max) axe. J Biochem Mol Biol. 28(2): 100-106.
- Kim JY, Kavas M, Fouad WM, Nong G, Preston JF, Altpeter F. 2011. Production of hyperthermostable GH10 xylanase Xyl10B from Thermotoga maritima in trans-plastomic plants enables complete hydrolysis of methyl-glucuronoxylan to fermentable sugars for biofuel production. Plant Mol Biol. 76: 357-369.
- Kim JY, Kim DY, Jung JH, Hong MJ, Heo HY, Johnson JW, Kim TH, Seo YW. 2007. Activation of barley S-adenosylmethionine synthetase1 gene promoter in response to phytohormones and abiotic stresses. J Crop Sci Biotech. 10: 52-58.
- Kumar A, Altabella T, Taylor MA, Tiburcio AF. 1997. Recent advances in polyamine research. Trends in Plant Sci. 2(4): 124-130.
- Kutchan TM. 1995. Alkaloid Biosynthesis-The basis for metabolic engineering of medicinal plants. Plant Cell. 7: 1059-1070.
- Lee MS, Jang CS, Lee SS, Kim JY, Lee BM, Seong RC, Seo YW. 2006. Hordoindolines are predominantly expressed in the aleurone layer in late kernel development in barley. Breed Sci. 56: 63-68.
- Lee YJ, Kim DH, Kim YW, Hwang I. 2001. Identification of a signal that distinguishes between the chloroplast outer envelope membrane and the endomembrane system in vitro. Plant Cell. 13: 2175-2190.
- Lescot M, Dehais P, Thijs G, Marchal K, Moreau Y, de Peer YV, Rouze P, Rombauts S. 2002. PlantCARE, a database of plant cis-acting regulatory elements and a portal to tools for in silico analysis of promoter sequences. Nucleic Acids Res. 30(1): 325-327.
- Li XD, Xia B, Wang R, Xu S, Jiang YM, Yu FB, Peng F. 2013. Molecular cloning and characterization of S-adenosylmethionine synthetase gene from Lycoris radiata. Mol Biol Rep. 40: 1255-1263.
- Mathur M, Sachar RC. 1991. Phytohormonal regulation of S-adenosylmethionine synthetase and S-adenosylmethionine levels in dwarf pea epicotyls. FEBS Letter. 287(1, 2): 113-117.
- Mathur M, Satpathy M, Sachar RC. 1992. Phytohormonal regulation of S-adenosylmethionine synthetase by gibberellic acid in wheat aleurones. Biochim Biophys Acta. 1137: 338-348.
- Mo H, Pua EC. 2002. Up-regulation of arginine decarboxylase gene expression and accumulation of polyamines in mustard (Brassica juncea) in response to stress. Phys Plant. 114: 439-449.
- Murashige T, Skoog F. 1962. A revised medium for rapid growth and bioassay with tobacco tissue cultures. Phys Plant. 15: 473-497.
- Oksman-Caldentey KM, Inzé D. 2004. Plant cell factories in the post-genomic era: new ways to produce designer secondary metabolites. Trends in Plant Sci. 9: 433-440.
- Peleman J, Boerjan W, Engler G, Seurinck J, Botterman J, Alliotte T, van Montagu M, Inzé D. 1989a. Strong cellular preference in the expression of a housekeeping gene of Arabidopsis thaliana encoding S-adenosylmethionine synthetase. Plant Cell. 1: 81-93.
- Peleman J, Saito K, Cottyn B, Engler G, Seurinck J, van Montagu M, Inzé D. 1989b. Structure and expression analysis of the S-adenosylmethionine synthetase gene family in Arabidopsis thaliana. Gene. 84: 359-369.
- Qi YC, Wang FF, Zhang H, Liu WQ. 2010. Overex-pression of suaeda salsa S-adenosylmethionine synthetase gene promotes salt tolerance in transgenic tobacco. Acta Physiol Plant. 32: 263-269.
- Radchuk VV, Sreenivasulu N, Radchunk RI, Wobus U, Weschke W. 2005. The methylation cycle and its possible functions in barley endosperm development. Plant Mol Biol. 59: 289-307.
- Ravanel S, Gakière B, Job D, Douce R. 1998. The specific features of methionine biosynthesis and metabolism in plants. Proc Natl Acad Sci USA. 95: 7805-7812.
- Robertson M. 2003. Increased dehydrin promoter activity caused by HvSPY is independent of the ABA response pathway. Plant J. 34: 39-46.
- Schlenk F, Depalma RE. 1957. The formation of S-adenosy-lmethionine in yeast. J Biol Chem. 229: 1037-1050.
- Schröder G, Eichel J, Breinig S, Schröder J. 1997. Three differentially expressed S-adenosylmethionine synthetases from Catharanthus roseus: molecular and functional characterization. Plant Mol Biol. 33: 211-222.
- Schütz W. 1997. Primary dormancy and annual dormancy cycles in seeds of six temperate wetland sedges. Aquatic Botany. 59: 75-85.
- Shen B, Li C, Tarczynski MC. 2002. High free-methionine and decresed lignin content result from a mutation in the Arabidopsis S-adenosyl-L-methionine synthetase 3 gene. Plant J. 29(3): 371-380.
- Takusagawa F, Kamitori S, Maekham GD. 1996. Structure and function of S-adenosylmethionine synthetase: Crystal structures of S-adenosylmethionine synthetase with ADP, BrADP, and PPi at 2.8 Å resolution. Biochem. 35: 2586-2596.
- Thompson JD, Higgins DG, Gibson TJ. 1994. CLUSTAL W: improving the sensitivity of progressive multiple sequence alignment through sequence weighting, position-specific gap penalties and weight matrix choice. Nucleic Acids Res. 22: 4673-4680.
- Whittaker DJ, Smith GS, Gardner RC. 1997. Expression of ethylene biosynthetic genes in Actinidia chinensis fruit. Plant Mol Biol. 34: 45-55.
- Yang SF, Hoffman NE. 1984. Ethylene biosynthesis and its regulation in higher plants. Ann Rev Plant Physiol. 35: 155-189.