Abstract
The present study investigated the isolation and characterization of 34 polymorphic microsatellite markers developed from Actinidia arguta (Sieb. and Zucc.) Planch. ex Miq. var arguta. These markers produced 349 alleles in eight Actinidia species, with an average of 10.3 alleles per locus. Observed heterozygosity ranged from 0.50 to 0.87 (mean = 0.72), and polymorphism information content ranged from 0.37 to 0.88 (mean = 0.69). The phylogenetic relationship obtained using microsatellite markers showed minor clustering and population differences among species while 38 A. arguta accessions fell into two subgroups. These newly developed polymorphic microsatellite markers will be very useful in sustainable genetic conservation, marker-assisted breeding, and classification of the Actinidia genus.
-
Key words: Microsatellites, Actinidia arguta, Genetic diversity
INTRODUCTION
The genus
Actinidia comprises 76 species and about 120 taxa of perennial, dioecious, viny, and deciduous fruit trees.
Actinidia species have a wide range of distribution in eastern Asia that includes tropical equatorial and temperate regions (
Ferguson and Huang 2007). Four of the 76 species have been domesticated as fruit crops:
A. deliciosa,
A. chinensis,
A. arguta, and
A. eriantha (
Cui et al. 2002;
Ferguson 1990).
A. deliciosa (A. Chev.) C. F. Liang and A. R. Ferguson var.
deliciosa is a green-fleshed kiwifruit, and
A. chinensis Planch. var.
chinensis is yellow-fleshed. Kiwifruit production has increased remarkably since the introduction of
A. deliciosa seeds to New Zealand in the early 1900s, reaching more than one million tons in 2000 (
Huang and Ferguson 2001).
Four
Actinidia species,
A. arguta,
A. kolomikta,
A. polygama, and
A. rufa, are found in Korea (
Cui et al. 2002;
Ferguson 1990;
Kim et al. 2003).
A. arguta (Sieb. and Zucc.) Planch. ex Miq. var.
arguta grows in the wild in mountainous and hilly terrain throughout Korea; it is tolerant to freezing and is resistant to various harmful insects. Because the exterior of the fruit is soft, smooth, and leathery, it can be eaten whole without peeling (
Williams et al. 2003). Given its richness in various minerals and vitamin C, this fruit is commonly used in soft drinks and jams. It is also used as an anodyne, diuretic, antifebrile, and thirst-quencher in home remedies (
Lee et al. 2004). Despite these beneficial traits and uses, commercial cultivars of
A. arguta have not been available, and most plants are growing in the wild without much improvement. Although several attempts have been made to introduce the genes from
A. arguta into
A. deliciosa (
Kim et al. 2008;
Lee et al. 2004), the hybrids have not yet been widely accepted.
The
A. arguta accessions have not been subjected to genetic diversity analysis. For the conservation and sustainable use of wild accessions, it is important to understand the genetic variation, genetic structure, and mating systems of natural populations. Given their high levels of polymorphism with codominance and their excellent reproducibility, microsatellite or simple-sequence repeat (SSR) markers have been preferred for use in the analysis of molecular diversity in conservation biology and molecular ecology (
Park et al. 2009). Although microsatellite markers have been developed in the
Actinidia species, this development has been restricted to the commercial species
A. chinensis and
A. deliciosa and has not included
A. arguta (
Huang et al. 1998;
Korkovelos et al. 2003).
Huang et al (1998) demonstrated that 40 microsatellite markers derived from the genomic library of
A. chinensis were successful in the genomic DNA of
A. arguta. Another study (
Fraser et al. 2000) found that four of nine microsatellite markers derived from the genomic library of
A. deliciosa were successful in the polymerase chain reaction (PCR) amplification of
A. arguta accessions. The same group of researchers subsequently tested cross-species amplification among 21
Actinidia species with 20 expressed sequence tag (EST)-derived microsatellite markers (
Fraser et al. 2005). Three of these markers failed in amplification, and three others were inconsistent in the amplification of
A. arguta (4x) accessions.
In an effort to preserve the genetic diversity of A. arguta in Korea, we collected wild accessions throughout the country and stored the seeds in a short-term preservation facility. The seeds were screened for genetic redundancy before they were placed in a long-term storage facility. Because microsatellite markers are preferred for genetic diversity analysis, we developed microsatellite markers from the A. arguta genomic library. This report describes the new set of markers for genetic diversity analysis in Actinidia species and possible markers for sex determination in A. arguta.
MATERIALS AND METHODS
Plant materials and genomic DNA extraction
A total of 91 accessions from eight
Actinidia species were used in this study (
Table 1). The young leaves were acquired from Namhae Sub-Station of National Institute of Horticultural & Herbal Science which conserved diverse accessions of
Actinidia species in experimental field. Total genomic DNA was extracted from grinded power of young leaves by liquid nitrogen using the Plant DNAzol
® Reagent (Invitrogen, Carlsbad, CA, USA), following the supplier’s protocols. The extracted DNA was quantified using an ultraviolet-visible (UV-Vis) spectrophotometer (ND-1000; NanoDrop, Wilmington, DE, USA).
A modified biotin-streptavidin capture method was used to construct an SSR motif-enriched library of
A. arguta (Sieb. and Zucc) Planch. ex Miq. var.
arguta genomic DNA (
Kwon et al. 2005). Genomic DNA samples (10 μg) were digested with seven blunt-end–producing restriction enzymes (
EcoRV,
DraI,
SmaI,
PvuI,
AluI,
HaeIII,
RsaI). The fully digested DNA samples were pooled and size-fractionated on 1.4% agarose gels. DNA fragments of 300 bp to 1,500 bp were eluted from the gels and were purified using a gel extraction kit (Qiagen, Hilden, Germany). Approximately 1 μg of DNA fragments was ligated with 1 μg of the double-stranded adaptor (AP11/AP12). The adaptor was prepared by mixing equal molar amounts of oligonucleotides AP11 (5′CTC TTG CTT AGA TCT GGA CTA-3′) and AP12 (5′-TAG TCC AGA TCT AAG CAA GAG CAC A-3′), heated to 94°C, then cooled to 25°C over a period of 4–5 h. Preamplification of adaptor-ligated DNA fragments was performed for 15 cycles of PCR in a 50-μl reaction volume with a single primer (AP11) and an annealing temperature of 56°C. The preamplified products were hybridized with a mixture of long (40–45 nucleotides) biotin-labeled repeat probes. Hybridization was performed for 2 h at 65°C in a reaction mixture (50 μl) that included 6× standard sodium citrate (SSC), 0.1% sodium dodecyl sulfate (SDS), ~100 ng of preamplified product, and 300 ng of each biotin-labeled oligo: (GA)
20, (CA)
20, (AGC)
15, (GGC)
15, (AAG)
15, (AAC)
15, and (AGG)
15. The hybridized DNA fragments were captured with 400 μg of streptavidin-coated magnetic beads (Promega, Madison, WI, USA) by incubating the mixture at 65°C with gentle agitation for 30 min. The beads were separated from the liquid using a magnetic stand (Promega) and were washed five times in 300 μl 6× SSC/0.1% SDS (1× SSC = 150 mM NaCl, 15 mM sodium citrate, pH 7.0) at room temperature with gentle agitation. After stringent washing, all samples were briefly washed in 5× SSC to remove the SDS, and DNA fragments were eluted with 50 μl of dH
2O at 90°C for 5 min. Final elutions (5 μl) were amplified for 15 cycles of PCR using the AP11 primer. After checking the gel, the amplified DNA products were cloned into pGEM-T Easy Vector (Promega) and were transformed into
Escherichia coli cells through electroporation. Recombinant colonies were identified by blue or white colony selection on lysogeny broth (LB) plates containing ampicillin, 5-bromo-4-chloro-3-indolyl-b-D-galactopyranoside (X-gal), and isopropyl β-D-1-thiogalactopyranoside (IPTG).
A total of 762 white colonies were randomly selected from the enriched library. Plasmid DNA was purified with the QIAprep Spin Miniprep Kit (Qiagen), and nucleotide sequencing was performed using an ABI 3100 DNA sequencer with a BigDye terminator kit (Applied Biosystems, Foster City, CA, USA). SSR motif elucidation and primer design were performed using the ARGOS program (
Kim 2004).
The “M13 tail at its 5′ end” PCR method was used to measure the size of the PCR products (
Schuelke 2000). PCR amplification was performed in a total volume of 20 μl containing 2 μl of genomic DNA (10 ng/μl), 0.2 μl of the specific primer (10 pmol/μl), 0.4 μl of M13 universal primer (10 pmol/μl), 0.6 μl of normal reverse primer, 2.0 μl of 10× PCR buffer (Takara, Tokyo, Japan), 1.6 μl of deoxynucleoside triphosphate (dNTP; 2.5 mM), and 0.2 μl of Taq polymerase (5 unit/μl; Takara). The PCR amplification conditions were as follows: 94°C for 3 min, followed by 30–33 cycles at 94°C (30 s), 50–55°C (45 s), 72°C (45 s), then 15 cycles at 94°C (30 s), 53°C (45 s), and 72°C (45 s), and final extension at 72°C for 20 min. PCR was performed in PTC-220 thermocyclers (MJ Research, Waltham, MA, USA). The PCR products of three microsatellites were mixed together in a ratio of 6-FAM:HEX:NED (fluorescent dyes) = 1:3:4, which varied depending on the amplification intensity for individual markers as determined on an ABI PRISM 3130xl genetic analyzer (Applied Biosystems). PCR products labeled with HEX and NED were added in greater amounts, and those labeled with FAM were added in lesser amounts to match the different signal intensities of these fluorescent dyes. The 1.5 μl mixed PCR product was combined with 9.2 μl of Hi-Di formamide and 0.3 μl of an internal Genescan-500 ROX (6-carbon-X-rhodamine) molecular size standard (35–500 bp). The samples were denatured at 94°C for 3 min and were analyzed with the ABI PRISM 3130xl. Base-pair molecular weights of the microsatellite products were estimated with Genescan software (ver. 3.7; Applied Biosystems) using the local Southern method. The individual fragments were assigned as alleles of the appropriate microsatellite loci with Genotyper software (ver. 3.7, Applied Biosystems).
The PowerMarker version 3.25 (
Liu and Muse 2005) and GenAlEx version 6.1 (
Peakall and Smouse 2006) programs were used to measure variability at each locus, observed heterozygosity (
HO), gene diversity/expected heterozygosity (
HE), and polymorphism information content (PIC). The number of alleles (
A) and PIC values were calculated with the equation of PIC=1−∑
P2i−∑2
P2i P2j where ∑
P2i is the sum of each squared
ith haplotype frequency (
Botstein et al. 1980). A phylogenetic dendrogram was constructed using the unweighted pair-group method with arithmetic averages (UPGMA) with PowerMarker (
Liu and Muse 2005) and MEGA4 (
Tamura et al. 2007) software.
Intra- and interpopulational levels of genetic variation identified by the cluster analysis were estimated from allelic frequencies using analysis of molecular variance (AMOVA) (
Weir 1996;
Weir and Cockerham 1984). Pairwise estimates of the correlation of alleles within subpopulations (
FST) were calculated for subpopulations using an AMOVA approach in GenAlEx (
Peakall and Smouse 2006).
RESULTS
Development of SSR markers from A. arguta
A total of 762 clones were randomly picked from the primary transformation plates and were sequenced (
Table 2). After excluding redundant clones (
n = 35) and truncated clones with SSR motifs near their ends (
n = 162), 565 clones were analyzed for primer designing. Of these, 140 clones were suitable for designing primer pairs for PCR amplification of the SSR motifs. Clones containing <12 nucleotides in the SSR motifs were not included in the primer design. Dinucleotide repeat-motif–containing clones were predominant (86.1%) among the 565 clones, with 864 dinucleotides, 87 trinucleotides (8.7%), and 53 tetranucleotides or more (5.8%) clones (
Table 3).
SSR variations were sought using the 140 selected primer pairs with a core collection of 91
Actinidia accessions representing diverse regions and species (
Table 1). This collection is maintained at the National Institute of Horticultural & Herbal Science (RDA, Korea). Intra- and interspecies accession polymorphisms were present in 34 primer pairs (
Supplementary Table 1). The number of repeating units among these polymorphic SSR loci varied from 6 to 23, and the length of the repeat region varied from 12 bp in GB-AA-017 [(CT)
6] to 174 bp in GB-AA-065 [(GA)
11(GAA)
23] (
Table 4). Whereas 26 (82.6%) polymorphic loci contained di-nucleotide repeating motifs, only three (6.5%) and five (10.9%) polymorphic loci had tri- and tetranucleotides or greater repeating motifs, respectively (
Table 3). With these 34 SSRs, a total of 349 alleles were detected among the
Actinidia species accessions, resulting in an average of 10.3 alleles per locus (
Table 4). The GB-AA-393 primer pair produced the highest number of alleles (
n = 20) and also had a high PIC value (PIC
= 0.88), whereas GB-AA-017 produced only two alleles (PIC = 0.37). The major allele frequency (MAF) ranged from 0.22 to 0.65, with a mean value of 0.39. The observed heterozygosity (
Ho) ranged from 0.50 to 0.87 (mean = 0.72), and the expected heterozygosity (
He) ranged from 0.00 to 1.00 (mean = 0.55). Considering three species (
A. arguta, A. chinensis,
A. deliciosa) individually,
A. deliciosa showed the most variation (PIC = 0.44) and
A. chinensis (PIC = 0.41) showed the least variation in all diversity denominators (data not shown).
Proportions of shared alleles were used to calculate genetic distances between all pairwise combinations among the 91
Actinidia accessions used in this study. A phylogenetic dendrogram based on the SSR profiles clearly shows two major groups at a genetic distance of 0.45 (
Fig. 1). The first group (GI) comprised
A. chinensis, A. deliciosa, A. eriantha, A. kolomikta, A. macrosperma, and
A. rufa. The accessions of the four latter species (
A. eriantha, A. kolomikta, A. macrosperma, and
A. rufa) did not form a subspecific clade, but were intermixed in each GI clade. The GII clade included
A. arguta was clearly distinguished from first group (GI) and formed two major subclades at a genetic distance of 0.25.
DISCUSSION
In this study, 762 DNA sequences of
A. arguta were retrieved from a microsatellite-enriched library, but only 140 (18.4%) were used to design the SSR primers. The majority of DNA sequences (81.6%) were not suitable for primer design; 55.8% had SSRs at the 5′ or 3′ end and fewer than 12 nucleotides in the SSR motifs; and 4.6% were duplicate or redundant DNA sequences (
Table 2). This result was consistent with those reported for
Sorghum bicolor and cassava (
Manihot esculenta Crantz), wherein 70% and 45% of the clones, respectively, had SSRs too close to the cloning sites at the 5′ or 3′ end (
Mba et al. 2001;
Taramino et al. 1997). Similarly, redundant DNA sequences consisting of the same SSR locus or showing more than 95% similarity in flanking sequences were found in 20% of cassava accessions (
Mba et al. 2001), 16% of perennial ryegrass (
Lolium perenne L.) accessions (
Jones et al. 2001) and 2.2% in avocado (
Persea americana Mill.) accessions (
Ashworth et al. 2004). Most redundancies were due to cloning, locus duplication, or allelism and were from the same microsatellite enrichment library.
Ashkenazi et al (2001) also reported that some conserved potato (
Solanum phureja Juz. & Buk.) DNA sequences flanking microsatellite regions were too short to permit the design of an appropriate primer. Earlier studies reported that the AT/TA repeat was the most frequent type of SSR in plants, followed by the AG/GA/TC/CT repeat (
Danin-Poleg et al. 2001;
Wang et al. 1994;
Yu et al. 1999). In this study, the most frequent type of microsatellite repeat was AG/GA/TC/CT (60.1%), followed by AC/CA/TG/GT (23.7%), AAG/AGA/GAA (4.4%), and AT/TA (2.2%;
Table 3). However, the frequency of a microsatellite repeat may vary with species and genus. For instance,
Ashworth et al (2004) reported that AG and ATG were the most frequent repeats in avocado.
The SSR genetic diversity observed among
Actinidia accessions in our study can be compared to the diversities among
A. chinensis and
A. deliciosa that have been measured using other SSR sets (
Korkovelos et al. 2008). The average numbers of alleles and PIC in our analysis were 10.3 and 0.69, respectively. Similarly,
Korkovelos et al. (2008) reported averages of 7.8 ± 3.2 alleles and PIC = 0.739 ± 0.158. These values are higher than those detected in cucumber (
Cucumis; average 2.4 alleles/locus, PIC = 0.28) and common buckwheat (
Fagopyrum; average 5.9 alleles/locus, PIC = 0.48) (
Danin-Poleg et al. 2001;
Ma et al. 2009). Thus, the SSR markers among 91
Actinidia accessions in the present study were effective for assessing genetic diversity and for understanding population structure.
The species relationship derived from our cluster analysis is consistent with other reports (
Huang et al. 2002;
Li et al. 2002). In particular, the clustering results confirmed the previously established close relationship between
A. deliciosa and
A. chinensis (
Cipriani et al. 1998;
Huang et al. 1997;
Testolin and Ferguson 1997), revealing
A. chinensis as a progenitor of
A. deliciosa (
Cipriani et al. 1998). Others have considered
A. arguta to be promising for the development of cultivars (
Ferguson 1999;
Nishiyama 2007). These major species were unambiguously classified into two groups in the present study. However,
A. kolomikta and
A. macrosperma were included in Group I in our analysis. This result contrasts with a previous analysis using RAPD markers that placed these species with
A. arguta (
Huang et al. 2002). This result also contrasts with a study using
matK gene and internal transcribed spacer (ITS) sequences that found a lesser genetic distance between these species and
A. arguta than with other groups (
Li et al. 2002). The morphological features of
A. kolomikta and
A. macrosperma are also more similar to those of species in the
A. arguta group (
Ferguson 1990) than to those of other groups. The grouping result may be due to the limited amplification of transferability in SSR markers. Although most
Actinidia species were successfully amplified with all 34 SSR markers, the amplifications of transferability in
A. kolomikta and
A. macrosperma were 80% and 57%, respectively. The transferability of SSRs to other
Actinida species showed average value of 77% ranged from 57% (
A. macrosperma) to 90% (
A. chinensis). A little higher transferability than other genus such as
Prunus (mean=59%) and
Allium (mean=59%) reveals that genetic distances are relatively low between tested
Actinidia species (
Lee et al. 2011;
Wang et al. 2012).
These newly developed polymorphic microsatellite markers will be very useful for selection in marker-assisted breeding, genetic conservation, and classification of the Actinidia genus. The sex-related markers identified in our study are also of major importance to kiwifruit breeders and the produce industry because they allow the distinction of female plants at the seedling stage and have great potential utilization in marker-assisted selection in this species.
Supplementary Table
ACKNOWLEDGEMENTS
This study was supported by the Rural Development Administration (RDA), a grant (Code # PJ008564) from the National Academy of Agricultural Science, RDA, Republic of Korea.
Fig. 1Phylogenetic dendrogram of the varieties and species in Actinidia based on SSR amplification profiles.
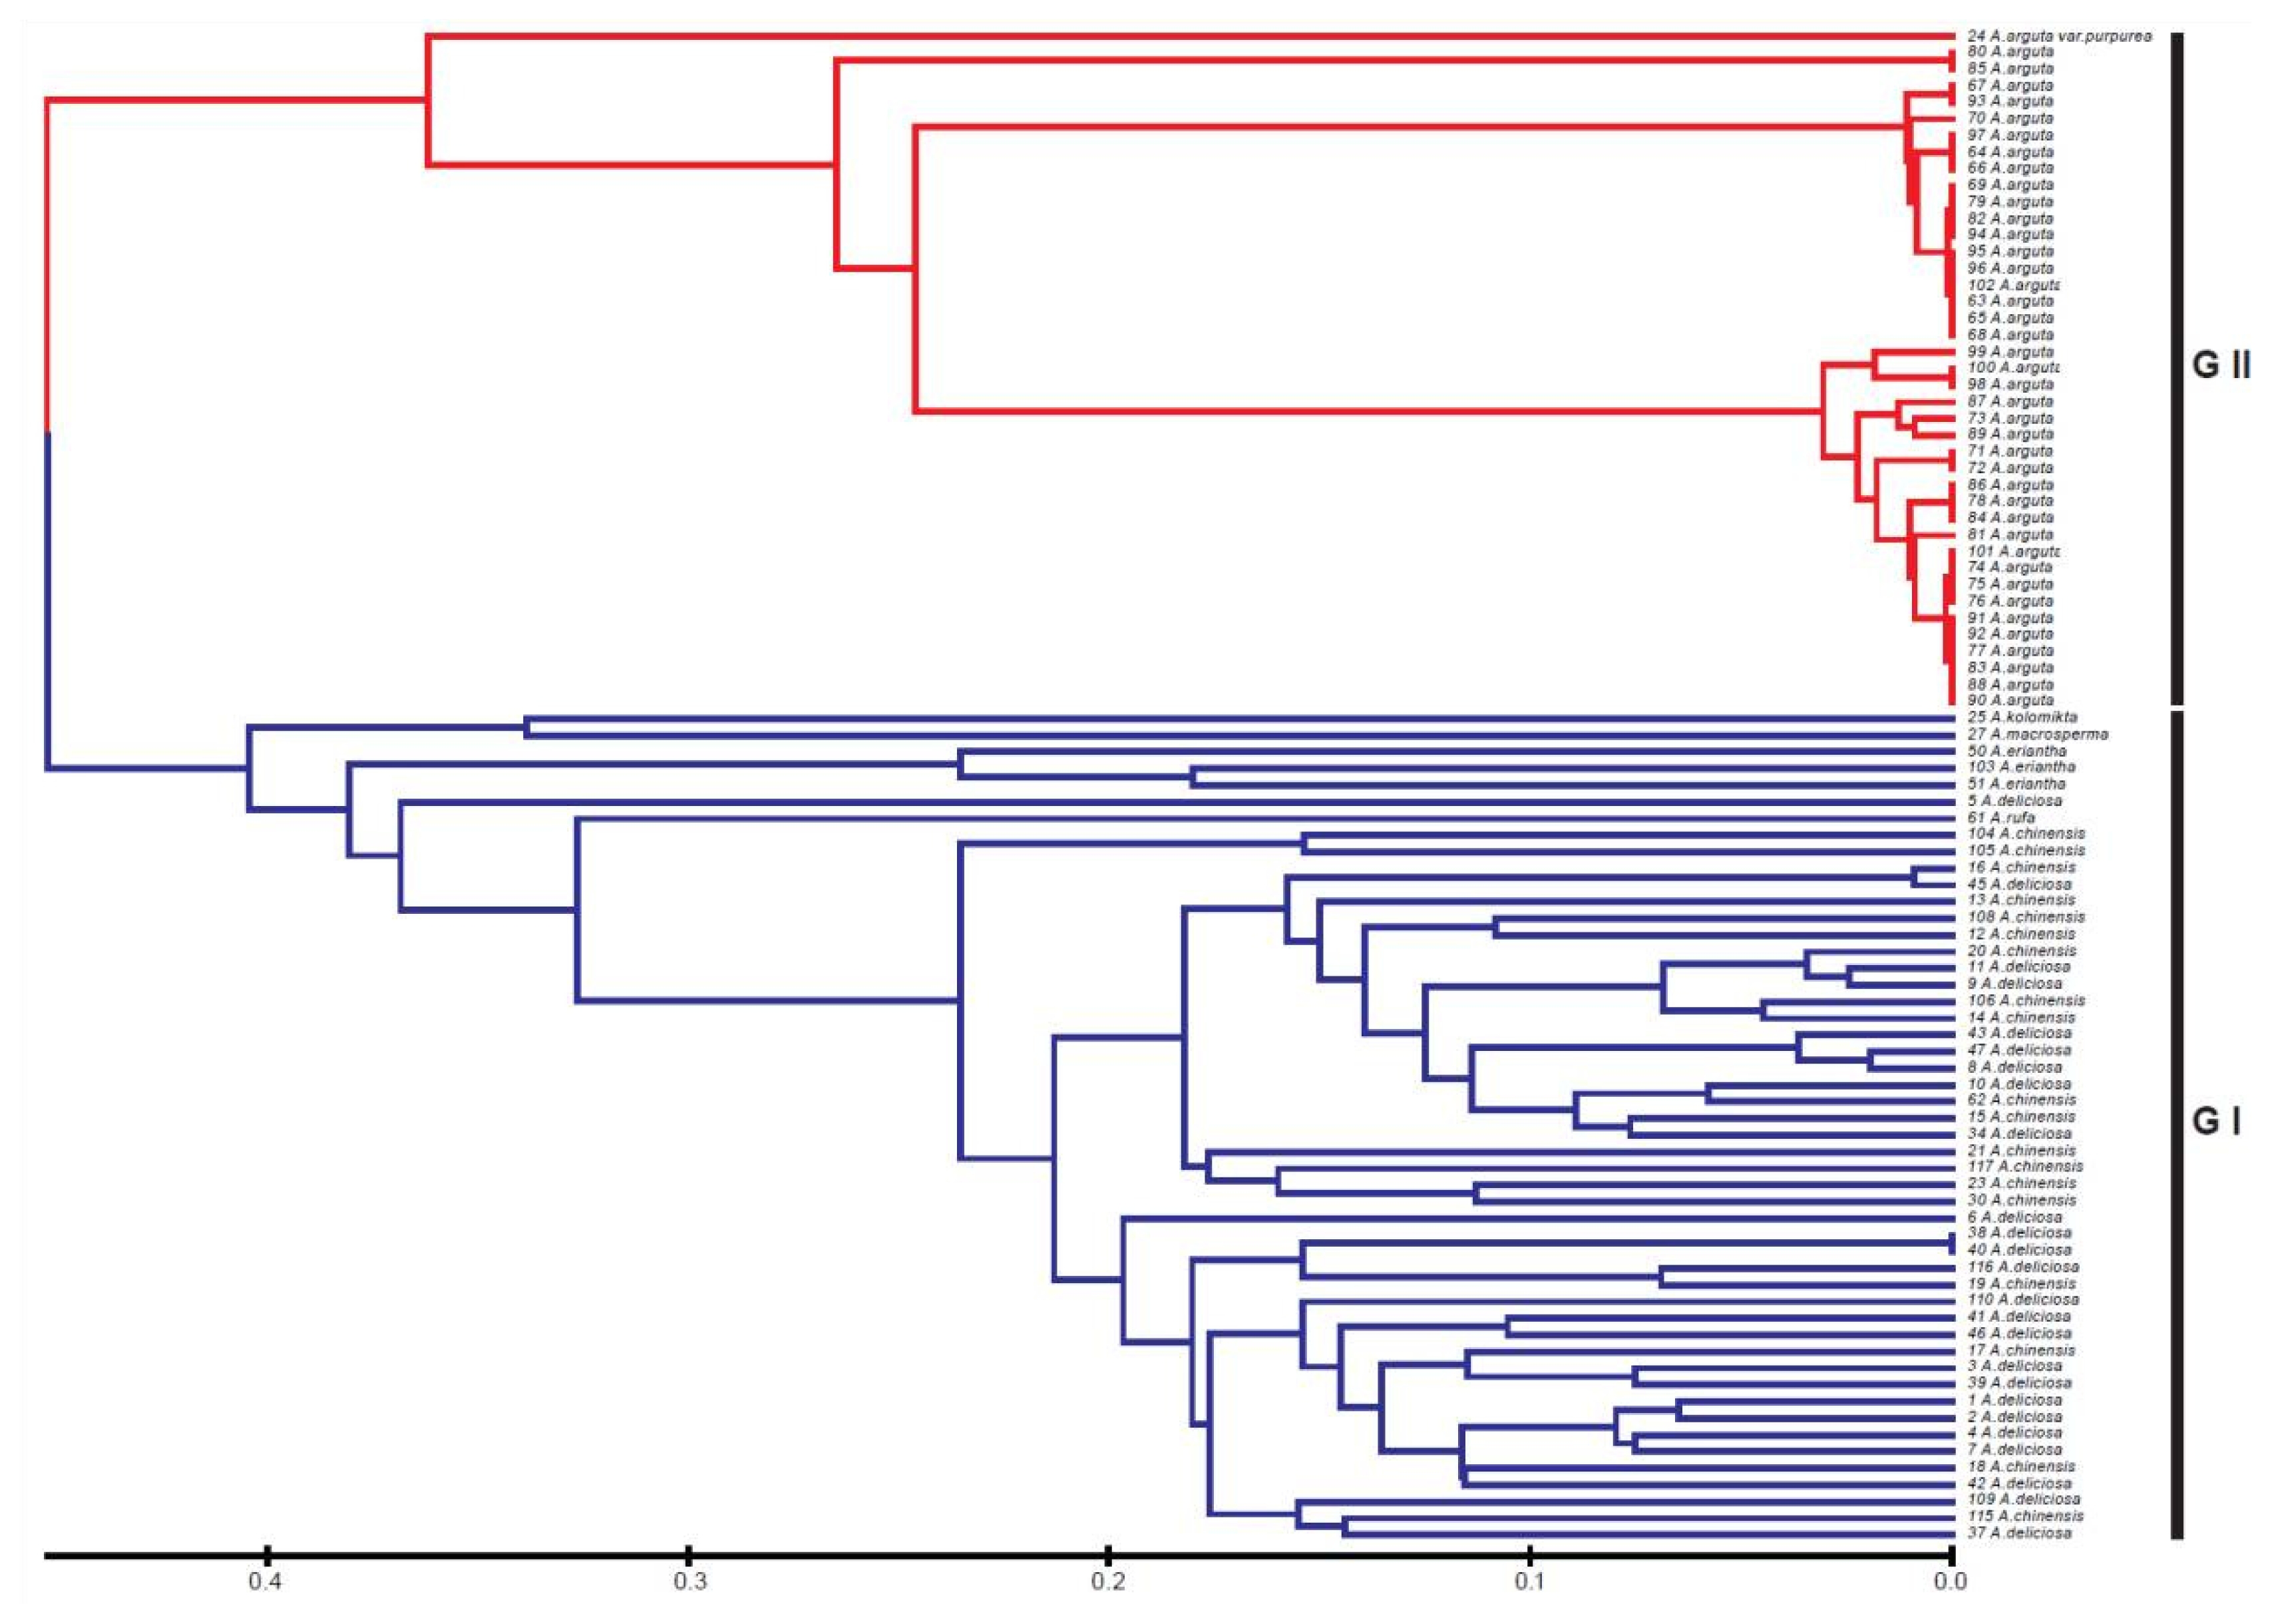
Table 1List of Actinidia species used in this study.
Table 1
|
Taxon |
Number of accessions |
Variety |
Geographic location |
|
A. arguta (Sieb. and Zucc.) Planch. ex Miq. var. arguta
|
40 |
63. K5-1-22 |
73. K5-3-6 |
83. K5-4-12 |
93. K5-10-1 |
Korea |
|
64. K5-2-3 |
74. K5-3-7 |
84. K5-5-1 |
94. K5-10-2 |
|
65. K5-2-7 |
75. K5-3-8 |
85. K5-5-8 |
95. K5-10-3 |
|
66. K5-2-8 |
76. K5-3-12 |
86. K5-5-12 |
96. K5-10-5 |
|
67. K5-2-10 |
77. K5-3-13 |
87. K5-5-14 |
97. K5-10-8 |
|
68. K5-2-13 |
78. K5-3-18 |
88. K5-6-10 |
98. K5-11-1 |
|
69. K5-2-16 |
79. K5-4-3 |
89. K5-6-12 |
99. K5-11-2 |
|
70. K5-2-18 |
80. K5-4-7 |
90. K5-9-1 |
100. K5-11-3 |
|
71. K5-2-22 |
81. K5-4-8 |
91. K5-9-4 |
101. K5-11-8 |
|
72. K5-3-3 |
82. K5-4-10 |
92. K5-9-8 |
102. K5-12-6 |
|
|
A. chinensis Planch. var. chinensis
|
13 |
14. SKK3 |
20. SKK10 |
104. Red-Kiwi |
106. Jesi-Gold |
Korea |
|
16. SKK5 |
21. SKK11, |
105. Hort16A |
|
|
17. SKK7 (Gracies) |
23. SKK13, |
108. Yeo-San-Hyang |
|
|
19. SKK9 (Chin Mei) |
62. Jeju-Gold |
115. Guem-Goi |
|
|
|
A. chinensis Planch. var. chinensis
|
6 |
12. SKK1 |
30. S13 |
|
|
China |
|
13. SKK2 |
15. SKK4 |
18. SKK8 (Tomuri) |
117. SKK12-2 |
|
|
A. deliciosa (A. Chev.) C.F. Liang and A.R. Ferguson var. deliciosa
|
25 |
1. Abbott |
7. Hyang-Rok |
11. Yellow Queen (First Emperor) |
45. SKK 60 |
New Zealand, Japan, China |
|
2. Bruno |
8. Golden King |
38. SKK22 (Jinkui) |
47. SKK80 (Red Princess) |
|
3. Hayward |
9. Golden Yellow |
40. SKK33 (Wha-Pyung 2 Ho) |
116. Jin-Mi |
|
4. Monty |
10. Sensation Apple |
42. SKK43 (Seo-Hyang) |
|
|
5. Matua |
37. SKK18 (Chieftain) |
43. SKK44 |
110. M51-2 |
|
6. Tomuri |
39. SKK23 |
46. SKK 61 |
|
|
34. Sun-WuKong |
41. SKK34 (Mi-Lyang 2 Ho) |
109. M51-1 |
|
|
|
A. eriantha Benth.
|
3 |
50. S10 |
51. S20 |
103. Bi-Dan |
|
China, Korea |
|
|
A. arguta var. purpurea (Rehd.) C.F. Liang |
1 |
24. S3 |
China |
|
|
A. kolomikta (Maxim. and Rupr.) Maxim. |
1 |
25. S4 |
China |
|
|
A. macrosperma C.F. Liang |
1 |
27. S7 |
China |
|
|
A. rufa (Sieb. and Zucc.) Planch. ex Miq. |
1 |
61. Seom-Darae |
Korea |
Table 2Efficiency of the procedure adopted for the identification of microsatellite markers in A. arguta.
Table 2
|
Procedural step |
Number (percentage) |
|
Sequenced clones |
762 |
|
Redundant clones |
35 (4.6%) |
|
Unique clones |
727 (95.4%) |
|
SSR clones |
565 (74.1%) |
|
Truncated clones (5′ or 3′ end) |
162 (21.3%) |
|
Fewer than 12 nucleotides |
263 (34.5%) |
|
Primer pairs designed |
140 (18.4%) |
|
Polymorphic loci |
34 (24.3%)z)
|
Table 3Frequency and type of di-, tri- and ≥ tetra-nucleotide repeats isolated from the A. arguta microsatellite-enriched library.
Table 3
|
Repeat unit |
Repeat class |
Number of microsatellite loci |
Polymorphic loci |
|
|
|
Number |
Percentage |
Number |
Percentage |
|
|
|
Di-nucleotide |
AC/CA/TG/GT |
238 |
23.7% |
8 |
17.4% |
|
AG/GA/TC/CT |
603 |
60.1% |
30 |
65.2% |
|
AT/TA |
22 |
2.2% |
|
|
|
CG/GC |
1 |
0.1% |
|
|
|
|
|
Total |
|
864 |
86.1% |
|
|
|
|
|
Tri-nucleotide |
AAC/ACA/CAA |
15 |
1.5% |
|
|
|
AAG/AGA/GAA |
44 |
4.4% |
1 |
2.2% |
|
AAT/ATA/TAA |
4 |
0.4% |
|
|
|
ACC/CCA/CAC |
3 |
0.3% |
|
|
|
AGC/CGA/GAC |
4 |
0.4% |
|
|
|
AGG/GGA/GAG |
14 |
1.4% |
2 |
4.3% |
|
ATC/TCA/CAT |
1 |
0.1% |
|
|
|
CCG/CGC/GCC |
2 |
0.2% |
|
|
|
|
|
Total |
|
87 |
8.7% |
|
|
|
|
|
≥ Tetra-nucleotide |
|
53 |
5.8% |
5 |
10.9% |
|
|
|
Total repeat motifs |
|
1004 |
|
46 |
|
Table 4Characteristics of 34 polymorphic microsatellite loci for Actinidia species.
Table 4
|
Marker |
GeneBank accession |
Repeat motif |
Primer sequence |
Size (bp) |
Ta (°C) |
A
|
MAF
|
He
|
Ho
|
PIC
|
|
GB-AA-005 |
FJ647762 |
(CT)17
|
F: AGTTGTGCATCCAAAGGC
R: CAGTGGGGTGAAGAACGA |
192–218 |
57 |
12 |
0.32 |
0.73 |
0.78 |
0.76 |
|
GB-AA-012 |
FJ647763 |
(TG)13
|
F: TCACAACACTCATTTCGGC
R: ATCCGCTTCCTTAGCTGC |
154–176 |
58 |
10 |
0.49 |
0.47 |
0.71 |
0.68 |
|
GB-AA-015 |
FJ647764 |
(AG)19
|
F: CCTGGTCGTTCAGGGAAT
R: ATGGCATTTGTTGCCTTG |
267–293 |
58 |
14 |
0.24 |
0.89 |
0.83 |
0.83 |
|
GB-AA-017 |
FJ647765 |
(CT)6
|
F: AAAGTGTGAGCACGTGACAA
R: TGAGAGAGAGAGGTGGCG |
170–182 |
58 |
2 |
0.54 |
0.00 |
0.50 |
0.37 |
|
GB-AA-018 |
FJ647766 |
(CA)8, (GGA)4
|
F: ACCATGGCACAGATGGAA
R: TCCAGTGCCTTTTTAAGCC |
147–171 |
58 |
11 |
0.23 |
0.75 |
0.81 |
0.80 |
|
GB-AA-024 |
FJ647767 |
(GA)19
|
F: AGGAGACCCAACAGGAACA
R: AATTCGGGTCACCACACA |
155–181 |
58 |
12 |
0.40 |
0.49 |
0.75 |
0.74 |
|
GB-AA-054 |
FJ647768 |
(GA)15
|
F: ACCAAAAACCACCTGCCT
R: TGAACCCGTATTCGCATC |
186–214 |
58 |
15 |
0.23 |
0.87 |
0.85 |
0.84 |
|
GB-AA-065 |
FJ647769 |
(GA)11(GAA)23
|
F: ATTGAAGCCCCCATTGAG
R: CCAAGGAGGGCATTTAGG |
212–238 |
58 |
11 |
0.43 |
0.60 |
0.74 |
0.72 |
|
GB-AA-069 |
FJ647770 |
(GGGA)6(GA)8
|
F: CGTTCTCCTTCGACCCTT
R: CCGTTACCTTGTCCAATCC |
196–258 |
58 |
11 |
0.43 |
0.67 |
0.74 |
0.71 |
|
GB-AA-080 |
FJ647771 |
(GA)15
|
F: CCAATCAACAAGATGCACG
R: TGGGAGGTTGAAACTGGA |
179–213 |
58 |
11 |
0.26 |
1.00 |
0.82 |
0.80 |
|
GB-AA-084 |
FJ647772 |
(GA)15
|
F: CATTCGAACCAACGCAAT
R: AGTCGGAGCTGGGAGAAG |
233–259 |
58 |
12 |
0.22 |
0.96 |
0.83 |
0.82 |
|
GB-AA-088 |
FJ647773 |
(CT)7 |
F: TCTGGTTTGTTTTCCACCA
R: GGTTGAGTTCCATTCCCG |
177–197 |
57 |
8 |
0.45 |
0.56 |
0.69 |
0.67 |
|
GB-AA-091 |
FJ647774 |
(CT)19
|
F: TGACTTAAGGGCGACCAA
R: GGAAATCGCTCATGGACA |
201–223 |
58 |
8 |
0.38 |
0.62 |
0.74 |
0.69 |
|
GB-AA-094 |
FJ647775 |
(AC)15
|
F: ACAGGGGAACATCAGTGC
R: GTGGGATATAACCGGGGA |
208–220 |
57 |
6 |
0.38 |
0.41 |
0.68 |
0.63 |
|
GB-AA-096 |
FJ647776 |
(GA)6, (GA)3
|
F: TTGGTACACAAGACGCCC
R: GAAATTTCTTCACCCGCC |
229–235 |
58 |
3 |
0.52 |
0.01 |
0.50 |
0.39 |
|
GB-AA-302 |
FJ647777 |
(AG)13
|
F: TCGGTGATAAATGGCAGG
R: GGCTCCTTGACAGCACAG |
269–311 |
58 |
11 |
0.43 |
0.31 |
0.74 |
0.72 |
|
GB-AA-303 |
FJ647778 |
(CT)15
|
F: TGGGGCATTTATGCCTAT
R: TCCAACCTTCTTGGCTCA |
156–258 |
57 |
12 |
0.33 |
0.35 |
0.75 |
0.73 |
|
GB-AA-304 |
FJ647779 |
(AG)11
|
F: CAGTCCACAAAATGGGTCA
R: GGTGAACACCCCCAAAGT |
202–364 |
58 |
13 |
0.41 |
0.15 |
0.67 |
0.64 |
|
GB-AA-308 |
FJ647780 |
(CCCT)4, (GGGT)2, (GGGT)2
|
F:TAGTGCTGCGAAGGAGGA
R: ATTGCACCATTCTGTGGC |
265–304 |
58 |
8 |
0.32 |
0.36 |
0.77 |
0.75 |
|
GB-AA-331 |
FJ647781 |
(GA)15, (CAGA)4
|
F: CCATCTTTTTGTGCCTTTG
R: TTGTTGGTATCATGCCCC |
259–303 |
57 |
13 |
0.28 |
0.59 |
0.83 |
0.80 |
|
GB-AA-333 |
FJ647782 |
(TG)12
|
F: AAGTTCATTCCACGCACG
R: ATTGCATTTGAGCCGCTA |
242–276 |
58 |
6 |
0.49 |
1.00 |
0.67 |
0.61 |
|
GB-AA-337 |
FJ647783 |
(GA)10, (AC)6
|
F: TTCTCTGCGCGTTCTCTC
R: AGCCTCAACCAAGAAGGG |
290–332 |
58 |
10 |
0.36 |
0.53 |
0.74 |
0.72 |
|
GB-AA-340 |
FJ647784 |
(CCT)5
|
F: AAGGAATTCGCCCTCAAA
R: GGCTGACAAGAAGCGATG |
287–296 |
58 |
4 |
0.65 |
0.68 |
0.49 |
0.45 |
|
GB-AA-342 |
FJ647785 |
(GA)2, (GA)4
|
F: AAAATTCCAATTCCCCCA
R: CATTTCGGAATCCCCTTT |
261–293 |
57 |
13 |
0.35 |
0.59 |
0.81 |
0.80 |
|
GB-AA-343 |
FJ647786 |
(AG)14
|
F: TGCTTCTTCGGTCATGCT
R: CACCATTTCGAACCCAGA |
232–262 |
58 |
5 |
0.44 |
0.67 |
0.70 |
0.64 |
|
GB-AA-356 |
FJ647787 |
(AC)12
|
F: CCCGACTTCCAAGTCTCC
R: CTCCGGATGCCCTTTATC |
251–287 |
58 |
16 |
0.25 |
0.70 |
0.85 |
0.83 |
|
GB-AA-366 |
FJ647788 |
(GA)7
|
F: CAGCTCCAAGGGCTATGA
R: TGTTCCCACTACCGCAAC |
241–247 |
57 |
5 |
0.51 |
0.09 |
0.53 |
0.43 |
|
GB-AA-369 |
FJ647789 |
(CT)16(CA)17
|
F: TGATCCACAACGTCATCAA
R: GGGCACGCTAGACACACC |
185–215 |
58 |
13 |
0.32 |
0.31 |
0.76 |
0.74 |
|
GB-AA-370 |
FJ647790 |
(GA)16
|
F: GGGAATTGGTGAGTGGGT
R: ATAGCCCAAACCGTTGGT |
229–273 |
58 |
16 |
0.57 |
0.77 |
0.61 |
0.63 |
|
GB-AA-372 |
FJ647791 |
(TC)16
|
F: GGACTTCGGTCACCCTTC
R: CATCCAAAAACACCTCGG |
149–215 |
57 |
10 |
0.51 |
0.59 |
0.71 |
0.67 |
|
GB-AA-374 |
FJ647792 |
(CT)17
|
F: GAACGAATCAGGAATCGAAA
R: TGAAGTGTAATAAAAGACTTCGCA |
153–171 |
58 |
9 |
0.32 |
0.68 |
0.78 |
0.74 |
|
GB-AA-380 |
FJ647793 |
(CT)16
|
F: GGCAAACCTACACCCTCA
R: TTTTCTCGCTCCTCGTGA |
296–326 |
57 |
9 |
0.57 |
0.02 |
0.56 |
0.52 |
|
GB-AA-393 |
FJ647794 |
(GA)7
|
F: CAAGCAGTGAAGATGCTTACC
R: CAGCTCAGGGGTCGACTA |
118–216 |
57 |
20 |
0.22 |
0.68 |
0.87 |
0.88 |
|
GB-AA-398 |
FJ647795 |
(GA)11
|
F: CGGGAATGTGAAATCCTTT
R: CCAATTGCTTGGGAGTGA |
233–267 |
57 |
10 |
0.40 |
0.65 |
0.75 |
0.72 |
|
|
Mean |
|
|
|
|
|
10.3 |
0.39 |
0.55 |
0.72 |
0.69 |
References
- Ashkenazi V, Chani E, Lavi U, Levy D, Hillel J, Veilleux RE. 2001. Development of microsatellite markers in potato and their use in phylogenetic and fingerprinting analyses. Genome. 44: 50-62.
- Ashworth V, Kobayashi MC, De La Cruz M, Clegg MT. 2004. Microsatellite markers in avocado (Persea americana Mill.): development of dinucleotide and trinucleotide markers. Sci Hortic. 101: 255-267.
- Botstein D, White RL, Skolnick M, Davis RW. 1980. Construction of a genetic linkage map in man using restriction fragment length polymorphisms. Am J Hum Genet. 32: 314-331.
- Cipriani G, Testolin R, Gardner R. 1998. Restriction-site variation of PCR-amplified chloroplast DNA regions and its implication for the evolution and taxonomy of Actinidia. Theor Appl Genet. 96: 389-396.
- Cui Z, Huang H, Xiao X. 2002. Actinidia in China. China Agricultural Science and Technology Press. Beijing.
- Danin-Poleg Y, Reis N, Tzuri G, Katzir N. 2001. Development and characterization of microsatellite markers in Cucumis. Theor Appl Genet. 102: 61-72.
- Ferguson AR. 1990. The genus Actinidia. editors. Kiwifruit: science and management. Warrington IJ, Weston GC, Auckland: New zealand Society for Horticultural Science.
- Ferguson AR. 1999. New Temperate Fruit: Actinidia chinensis and Actinidia deliciosa. Alexandria, VA: ASHS Press.
- Ferguson AR, Huang HW. 2007. Genetic resources of kiwifruit: domestication and breeding. Hort Rev. 33: 1-121.
- Fraser LG, Harvey CF, Gill GP. 2000. Application of microsatellite-based DNA profiling in Actinidia species. Acta Hort (ISHS). 546: 401-405.
- Fraser LG, McNeilage MA, Tsang GK, Harvey CF, De Silva HN. 2005. Cross-species amplification of microsatellite loci within the dioecious, polyploid genus Actinidia (Actinidiaceae). Theor Appl Genet. 112: 149-157.
- Huang H, Ferguson AR. 2001. Kiwifruit in China. Crop Hortic Sci. 29: 1-14.
- Huang H, Li Z, Li J, Kubisiak TL, Layne DR. 2002. Phylogenetic relationships in Actinidia as revealed by RAPD analysis. J Am Soc Hortic Sci. 127: 759-766.
- Huang H, Dane F, Wang Z, Jiang Z, Huang R, Wang S. 1997. Isozyme inheritance and variation in Actinidia. Heredity. 78: 328-336.
- Huang WG, Cipriani G, Morgante M, Testolin R. 1998. Microsatellite DNA in Actinidia chinensis: isolation, characterisation, and homology in related species. Theor Appl Genet. 97: 1269-1278.
- Jones ES, Dupal MP, Kolliker R, Drayton MC, Forster JW. 2001. Development and characterisation of simple sequence repeat (SSR) markers for perennial ryegrass (Lolium perenne L.). Theor Appl Genet. 102: 405-415.
- Kim IJ, Lee JH, Chong BC, Park SM, Park YS. 2008. Breeding of New Cultivars Cheongsan (Actinidia arguta) to Consume with Skin. J Kor Soc Hort Sci. 12: 103.
- Kim KY. 2004. Developing one step program (SSR Manager) for rapid identification of clones with SSRs and primer designing. Ms Thesis Seoul National University. Seoul, The Republic of Korea.
- Kim SC, Jung YH, Kim M, Kim CH, Koh SH, Kang SH. 2003. Genetic relationships of Genus Actinidia based on random amplified polymorphic DNA analysis. J Kor Soc Hort Sci. 44: 340-344.
- Korkovelos AE, Goulas CK, Vasilakakis MD. 2003. Screening microsatellites for their effectiveness to identify and differentiate among Actinidia genotypes. Acta Hort (ISHS). 610: 357-363.
- Korkovelos AE, Mavromatis AG, Huang WG, Hagidimitriou M, Giakoundis A, Goulas CK. 2008. Effectiveness of SSR molecular markers in evaluating the phylogenetic relationships among eight Actinidia species. Sci Hortic. 116: 305-310.
- Kwon SJ, Lee JK, Kim NS, Yu JW, Dixit A, Cho EG, Park YJ. 2005. Isolation and characterization of microsatellite markers in Perilla frutescens Brit. Mol Ecol Notes. 5: 455-457.
- Lee BS, Lee MH, Hwang SI, Kim SC, Han SS, Lee U. 2004. Characteristics of F1 Seeds of the Cross between Actinidia arguta and A. deliciosa. Korean J Breed. 36: 345-349.
- Lee GA, Kwon SJ, Park YJ, Lee MC, Kim HH, Lee JS, Lee SY, Gwag JG, Kim CK, Ma KH. 2011. Cross-amplification of SSR markers developed from Allium sativum to other Allium species. Scientia Horticulturae. 128: 401-407.
- Li J, Huang H, Sang T. 2002. Molecular phylogeny and infrageneric classification of Actinidia (Actinidiaceae). Syst Bot. 27: 408-415.
- Liu K, Muse SV. 2005. PowerMarker: an integrated analysis environment for genetic marker analysis. Bioinformatics. 21: 2128-2129.
- Ma KH, Kim NS, Lee GA, Lee SY, Lee JK, Yi JY, Park YJ, Kim TS, Gwag JG, Kwon SJ. 2009. Development of SSR markers for studies of diversity in the genus Fagopyrum. Theor Appl Genet. 119: 1247-1254.
- Mba REC, Stephenson P, Edwards K, Melzer S, Nkumbira J, Gullberg U, Apel K, Gale M, Tohme J, Fregene M. 2001. Simple sequence repeat (SSR) markers survey of the cassava (Manihot esculenta Crantz) genome: towards an SSR-based molecular genetic map of cassava. Theor Appl Genet. 102: 21-31.
- Nishiyama I. 2007. Fruits of the Actinidia genus. Advances in Food and Nutrition Research. 52: 293-324.
- Park YJ, Lee JK, Kim NS. 2009. Simple Sequence Repeat Polymorphisms (SSRPs) for Evaluation of Molecular Diversity and Germplasm Classification of Minor Crops. Molecules. 14: 4546
- Peakall ROD, Smouse PE. 2006. genalex 6: genetic analysis in Excel. Population genetic software for teaching and research. Mol Ecol Notes. 6: 288-295.
- Schuelke M. 2000. An economic method for the fluorescent labeling of PCR fragments. Nat Biotechnol. 18: 233-234.
- Tamura K, Dudley J, Nei M, Kumar S. 2007. MEGA4: molecular evolutionary genetics analysis (MEGA) software version 4.0. Mol Biol Evol. 24: 1596
- Taramino G, Tarchini R, Ferrario S, Lee M, Pe’ ME. 1997. Characterization and mapping of simple sequence repeats (SSRs) in Sorghum bicolor. Theor Appl Genet. 95: 66-72.
- Testolin R, Ferguson AR. 1997. Isozyme polymorphism in the genus Actinidia and the origin of the kiwifruit genome. Syst Bot. 22: 1-16.
- Wang H, Walla JA, Zhong S, Huang D, Dai W. 2012. Development and cross-species/genera transferability of microsatellite markers discovered using 454 genome sequencing in chokecherry (Prunus virginiana L.). Plant Cell Reports. 1-9.
- Wang Z, Weber JL, Zhong G, Tanksley SD. 1994. Survey of plant short tandem DNA repeats. Theor Appl Genet. 88: 1-6.
- Weir BS. 1996. Genetic data analysis II: Methods for discrete population genetic data. Sinauer Assoc., Inc.. Sunderland, MA, USA.
- Weir BS, Cockerham CC. 1984. Estimating F-statistics for the analysis of population structure. Evolution. 38: 1358-1370.
- Williams MH, Boyd LM, McNeilage MA, MacRae EA, Ferguson AR, Beatson RA, Martin PJ. 2003. Development and commercialization of “Baby Kiwi” (Actinidia arguta Planch.). Acta Hort (ISHS). 610: 81-86.
- Yu K, Park SJ, Poysa V. 1999. Abundance and variation of microsatellite DNA sequences in beans (Phaseolus and Vigna). Genome. 42: 27-34.


