Abstract
Rapeseeds have many health benefits because its oil is rich in polyunsaturated and monounsaturated fatty acids, tocopherols and phytosterols. The objective of this research was to examine a possible genetic variation of oil, fatty acids, tocopherols and phytosterols in eight rapeseed varieties and the effect of locations on expression of those chemical compounds. In this study, effects of variety x location interaction for palmitic, stearic, oleic, linoleic, linolenic, eicogenic and erucic contents were found to be significant while that of oil content was not. For oil content, variation between the two locations was much higher than all other factors. Variation among varieties was the major source of variation in most fatty acids. Variation between two locations was much less for tocopherols and phytosterols than that for oil and fatty acids. Instead, variation in residual effect was much higher in tocopherols and phytosterols demanding more number of replication to achieve same level of statistical precision as oil and fatty acids. Correlation analyses confirmed that some of the chemical compounds can be a target for indirect selection.
-
Key words: Rapeseed, Oil, Fatty acid, Tocopherol, Phytosterol, Interaction
INTRODUCTION
Oilseed rape (
Brassica napus L.) is one of the major oil seed crops grown all over the world. Rapeseed has many health benefits because its oil is rich in polyunsaturated and monounsaturated fatty acids, tocopherols and phytosterols. They play an important role in human nutrition and health, which includes reduction of blood cholesterol, anti-inflammatory properties, artery cleansing properties, etc. (
Muhammet & Samija 2006;
Nissinen et al. 2002;
Trautwein et al. 2003). Most of the rapeseed oil is produced for margarine, frying and salad oil. Several attempts have been made to modify the fatty acid composition through conventional breeding and transgenic approaches to make the oil more suitable for food industry. High oleic acid content in rapeseed oil is considered desirable for improving its applicability for food and non-food purposes (Christain 2002). Rapeseed is the most important oil crop in Europe because of its improved oil quality with high oil yield of around 40 to 47% (
Becker et al. 1999). Although seed oil of normally cultivated oilseed rape is considered to be of good quality for edible purposes, the development of cultivars with high oleic acid has been an important breeding objective for this crop. One advantage of oil high in oleic acid is its high degree of oxidative stability which is desirable for seed storage (
Piazza & Foglia 2001). Tocopherols and phytosterols are important lipid-soluble minor components of rapeseed. The content of tocopherols in rapeseed oil ranges from 230 to 1,000 mg/kg (
Marwede et al. 2003). In rapeseed oil, tocopherols are commonly composed of four known isomers; γ-tocopherol (70%), α-tocopherol (25%), δ-tocopherol (<5%) and β-tocopherol (0%) (
Goffman et al. 1999;
Marwede et al. 2004). Among all tocopherol isomers, α-tocopherol has the highest vitamin E activity, and γ-tocopherol shows the most potent antioxidant activity (
Kamal-Eldin et al. 1996). Tocopherols have been recognized as a classic free radical scavenger with chain-breaking properties and are one of the most important fat-soluble antioxidants in biological systems (
Prabhudas et al. 2000;
Alpaslan & Gunduz 2000). Rapeseed oil commonly contains about 0.5~1.1% phytosterols which are consisted of 55~58% sitosterol, 20~29% campesteol, 5~13% brassicasterol and <5% stigmasterol (
Hamama et al. 2003). Phytosterols are minor constituents of vegetable oils, cereals seed, nuts, and fruits, and their concentrations vary according to plant species (
Ostlund 2007). The presence of phytosterols in the diet is known to reduce serum cholesterol levels because of their structural similarity to cholesterol (
Abidi 2001).
Genotypes by environment interactions are very important in rapeseed production (
Becker 1999). Numerous reports on fatty acid, tocopherol and phytosterol are available, however there are no researches about analyzing oil, fatty acids, tocopherol and phytosterol simultaneously in rapeseed. The objective of this research was to determine the effects of varieties and two cultivation locations on oil, fatty acids, tocopherol and phytosterol compositions in rapeseed. This study will provide valuable information for rapeseed cultivations and help in developing functional food resources.
MATERIALS AND METHODS
Plant materials and field experiments
Total eight Korean oilseed rape genotypes including six varieties, Tammi (
Jang et al. 1997), Hanla, Youngsan, Naehan, Sunmang and Tamla and two experimental lines (Mokpo 111 and Mokpo 68) were obtained from Bioenergy Crop Research Center in Muan, Republic of Korea. Eight genotypes were planted on late September in Cheongwon, Chungcheongbukdo (latitude 36°58′ N, longitude 127°46′ E, altitude 301 m) and on early October in Muan, Jeollanamdo (latitude 35°01′ N, longitude 126°48′ E, altitude 228 m) in 2010. The field trial was laid out in a randomized complete block design with three replications. The seeds were sown in rows that were 40 cm apart with a planting distance of 5 cm within a row. Plants were fertilized with an N-P-K ratio of 10-8-8 kg/10a.
Fatty acid methyl esters (FAME), phytosterols (β-sitosterol, campesterol, brassicasterol and stigmasterol) and tocopherols (α-, β-, γ-, δ-tocopherol) standards (Sigma-Aldrich, USA) were used in this study. The trimethyl silyl ether (TMS) derivatives of all sterols were prepared using N, O-bis-[Trimethylsiyl] trifluoroacetamide (BSTFA) reagent from Supelco (USA).
Rapeseed oil was extracted from 3 g of ground seed with ether for eight hours in a soxhlet type extractor using AOCS method (
AOCS 1993). The oil extract was evaporated by distillation at reduced pressure in a rotary evaporator at 50 °C until the solvent was totally removed. Crude extract was then weighted.
For fatty acid analyses, a total of 50 ml of rapeseed oil was transferred to a screw-cap vial with 2 ml mixture of methanol, heptane, benzene, 2, 2-dimethoxypropane and H2SO4 (37:36:20:5:2 V/V) and held at 80 °C for 20 min for methylation of the oil fatty acid. The fatty acid composition of rapeseed oil was determined by using an Agilent 6850 gas chromatography system equipped with a flame ionization detector. Samples were separated by Agilent Innowax column (30 m × 0.25 mm × 0.25 μm). Injector temperature was set at 250°C while detector temperature was set to 280 °C. The oven temperature was held at 150°C for 5 min and then increased by 5°C min−1 to 230°C.
For analysis of tocopherol and phytosterol, a half gram of ground rapeseed was added into a 50 ml screw-cap test tube, and then 1 ml 5α-cholestane (500 ppm in hexane) was added as an internal standard. The sample was saponified by adding 10 ml pyrogallol (3%) and 2 ml KOH (60%). The solution was vortexed for 1 min and heated at 80 °C in water bath for 20 min. Unsaponifiable fraction was recovered by extraction with hexane. The recovered fraction was pipetted into glass vials and dried under nitrogen at room temperature. TMS derivatives were prepared by dissolving the unsaponifiable material into 150 μl of BSTFA reagent. Silylation was achieved after heating the mixture for 1 h at 60°C. Samples were stored at 4°C prior to analysis.
Chromatographic analysis was carried out on an Agilent 6850 GC-FID. HP-5 column with 0.25 μm film thickness (30 m × 0.25 mm I.D., USA) was used for separation. Splitless injection was used and the carrier gas was nitrogen at a flow-rate of 1 ml min−1. Nitrogen (30 ml min−1), hydrogen (30 ml min−1), and dry air (300 ml min−1) were used as auxiliary gases for the flame ionization detector. The injector and detector temperatures were both set at 300°C. The oven temperature was held at 200°C for 1 min and then increased by 10°C min−1 to 245°C, which was then maintained for 10 min, followed by an increase by 8°C min−1 to 280°C which was then held for 25 min. Individual sterols and tocopherols were mainly identified by the retention time of corresponding standards and their contents were determined from the ratio of each peak area compared to the internal standards.
Statistical analysis
Analyses of variance were performed with SAS software version 9.2 using the following model:
where, was Yijk observation of variety k in location i in jth replication; μ was the grand mean; ei and gk were the effects of location i and variety k, respectively; r(e)ij was jth replication nested within location i; geik was the variety by location interaction of variety i in location j and ɛijk was the residual of genotype k, environment i in replication j. Replication and residual effect were considered as random variables. For pairwise comparison of means, Waller-Duncan multiple range test was performed in PROC GLM in SAS. Pearson correlation analysis was also conducted using PROC CORR.
RESULTS AND DISCUSSION
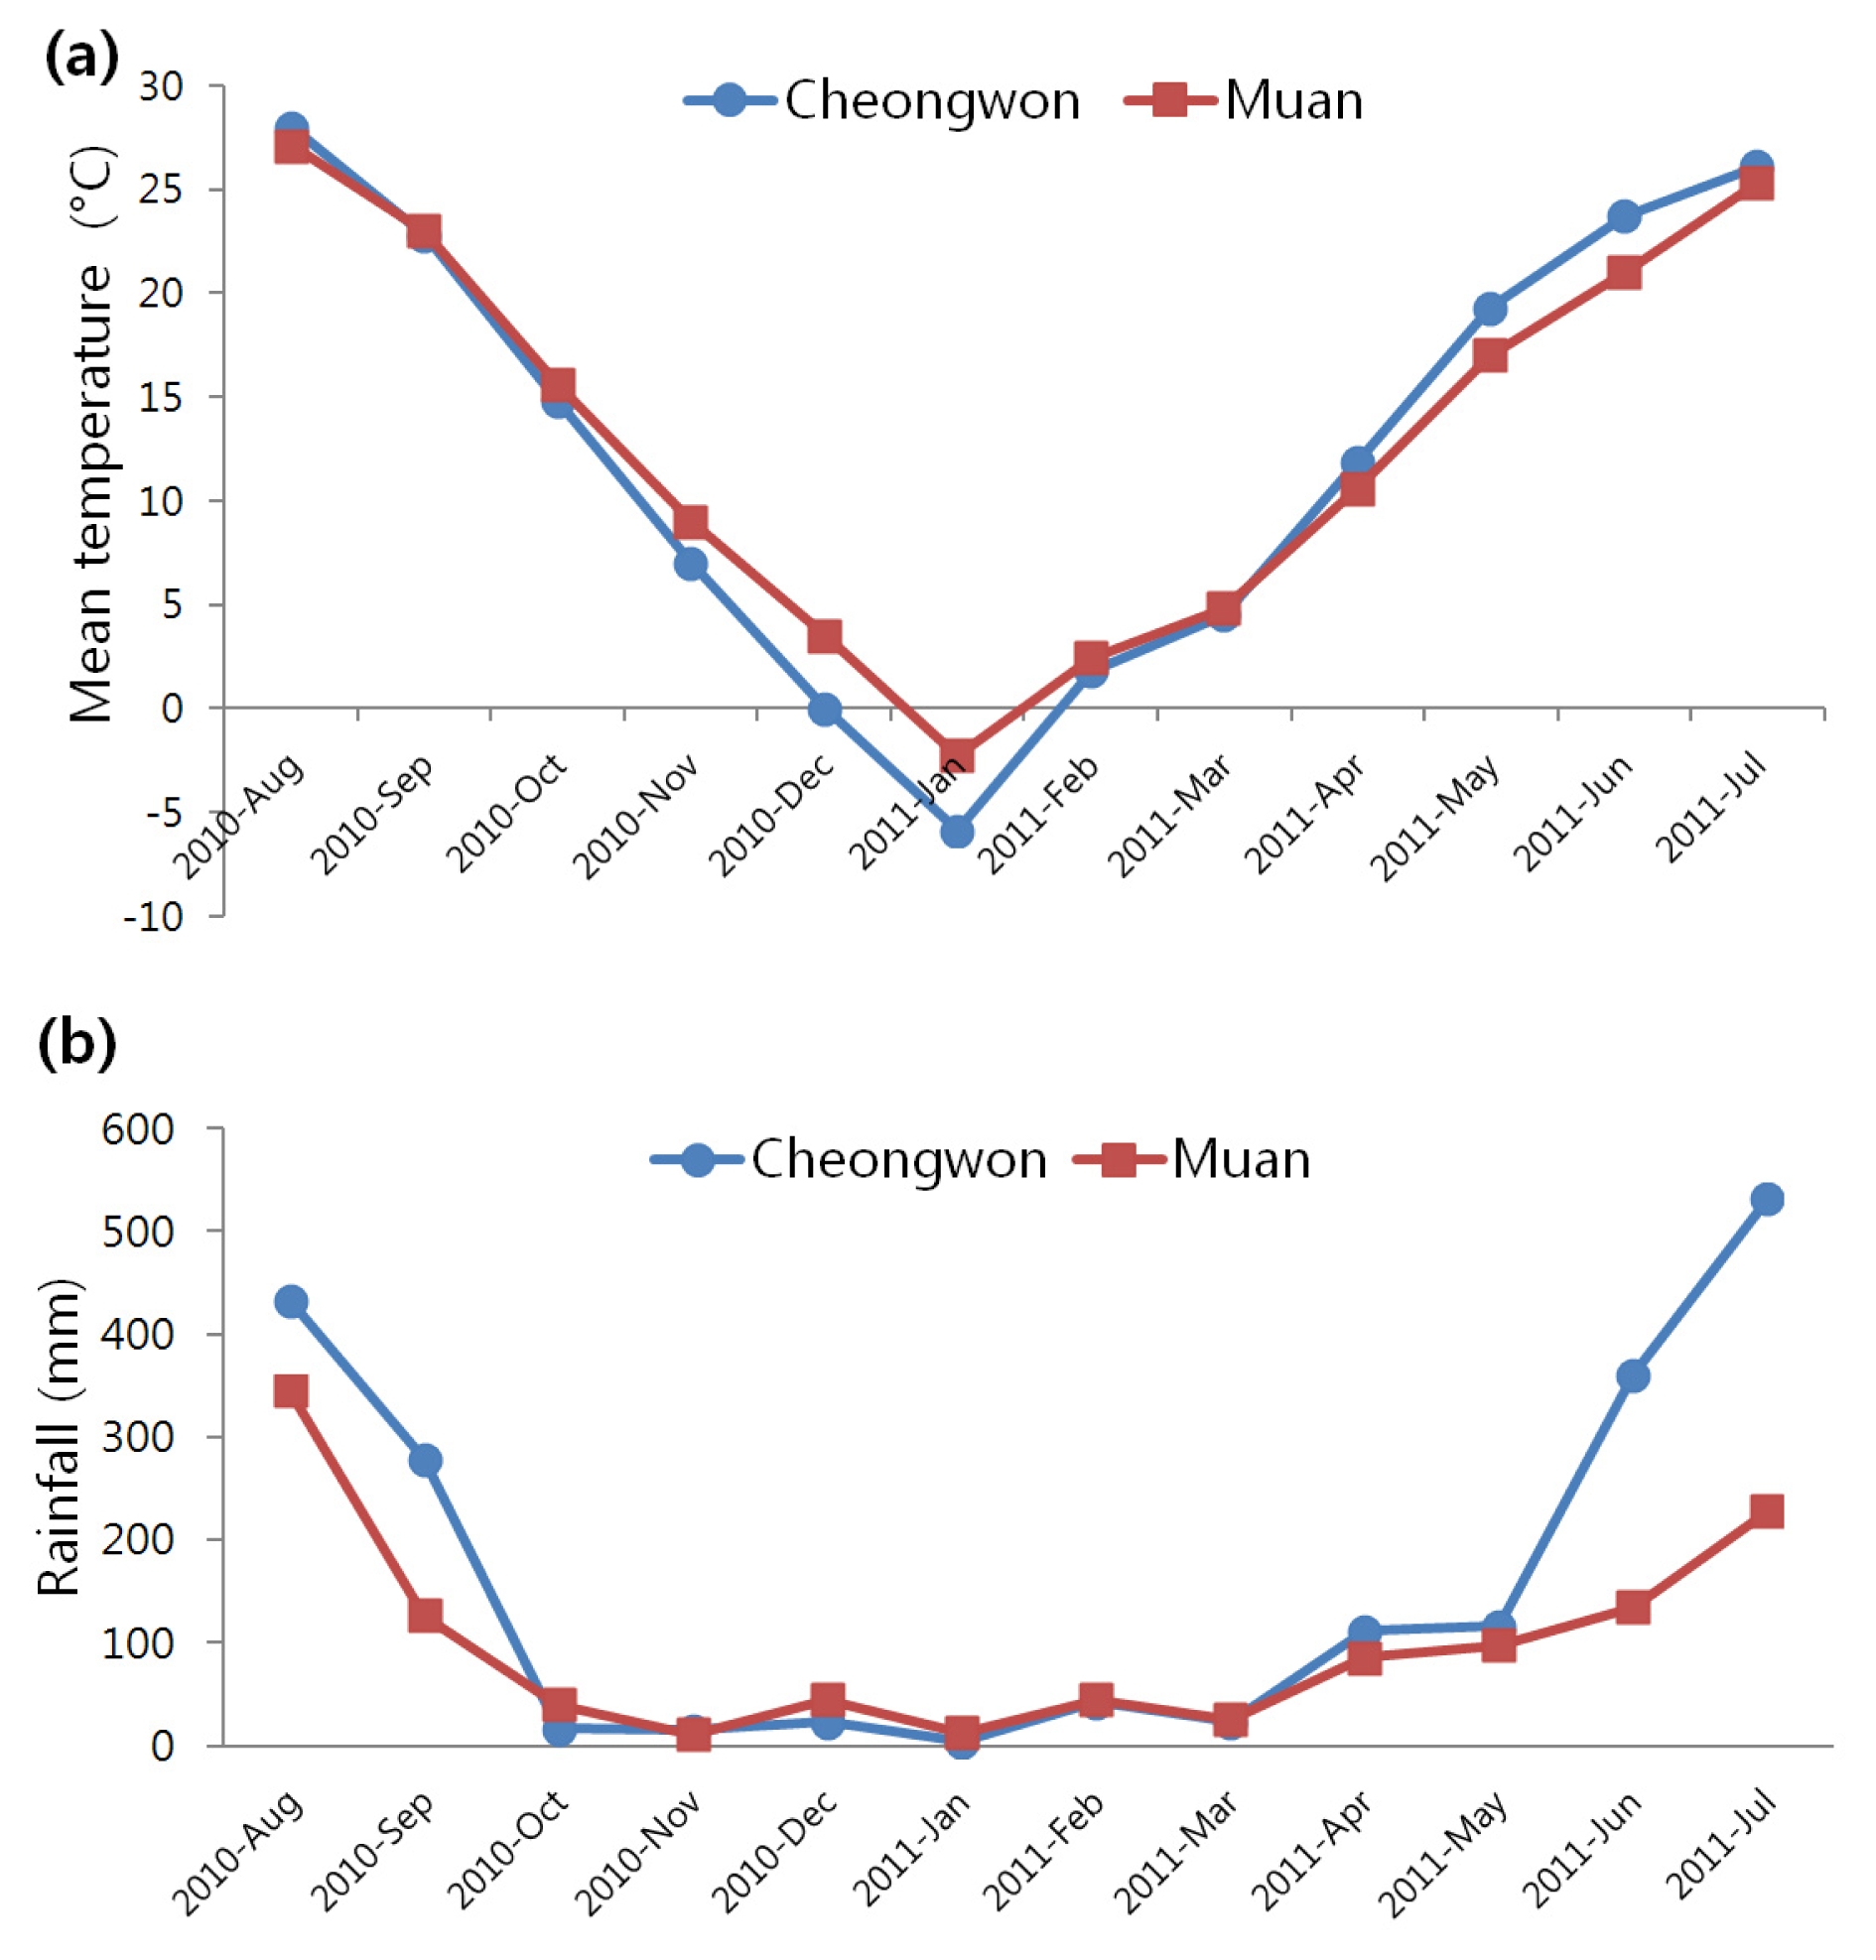
Monthly mean temperature and rainfall for trial locations are shown in
Fig. 1. In comparison with the mean temperature for 2010 to 2011 cropping season, Cheongwon had lower monthly mean temperatures than Muan in November, December, January and February.
During seed filling period, however, Cheongwon had a bit higher temperature. Monthly mean rainfall was generally higher in Cheongwon than in Muan during sowing (from August to September 2010) and harvesting period (from May to July 2011).
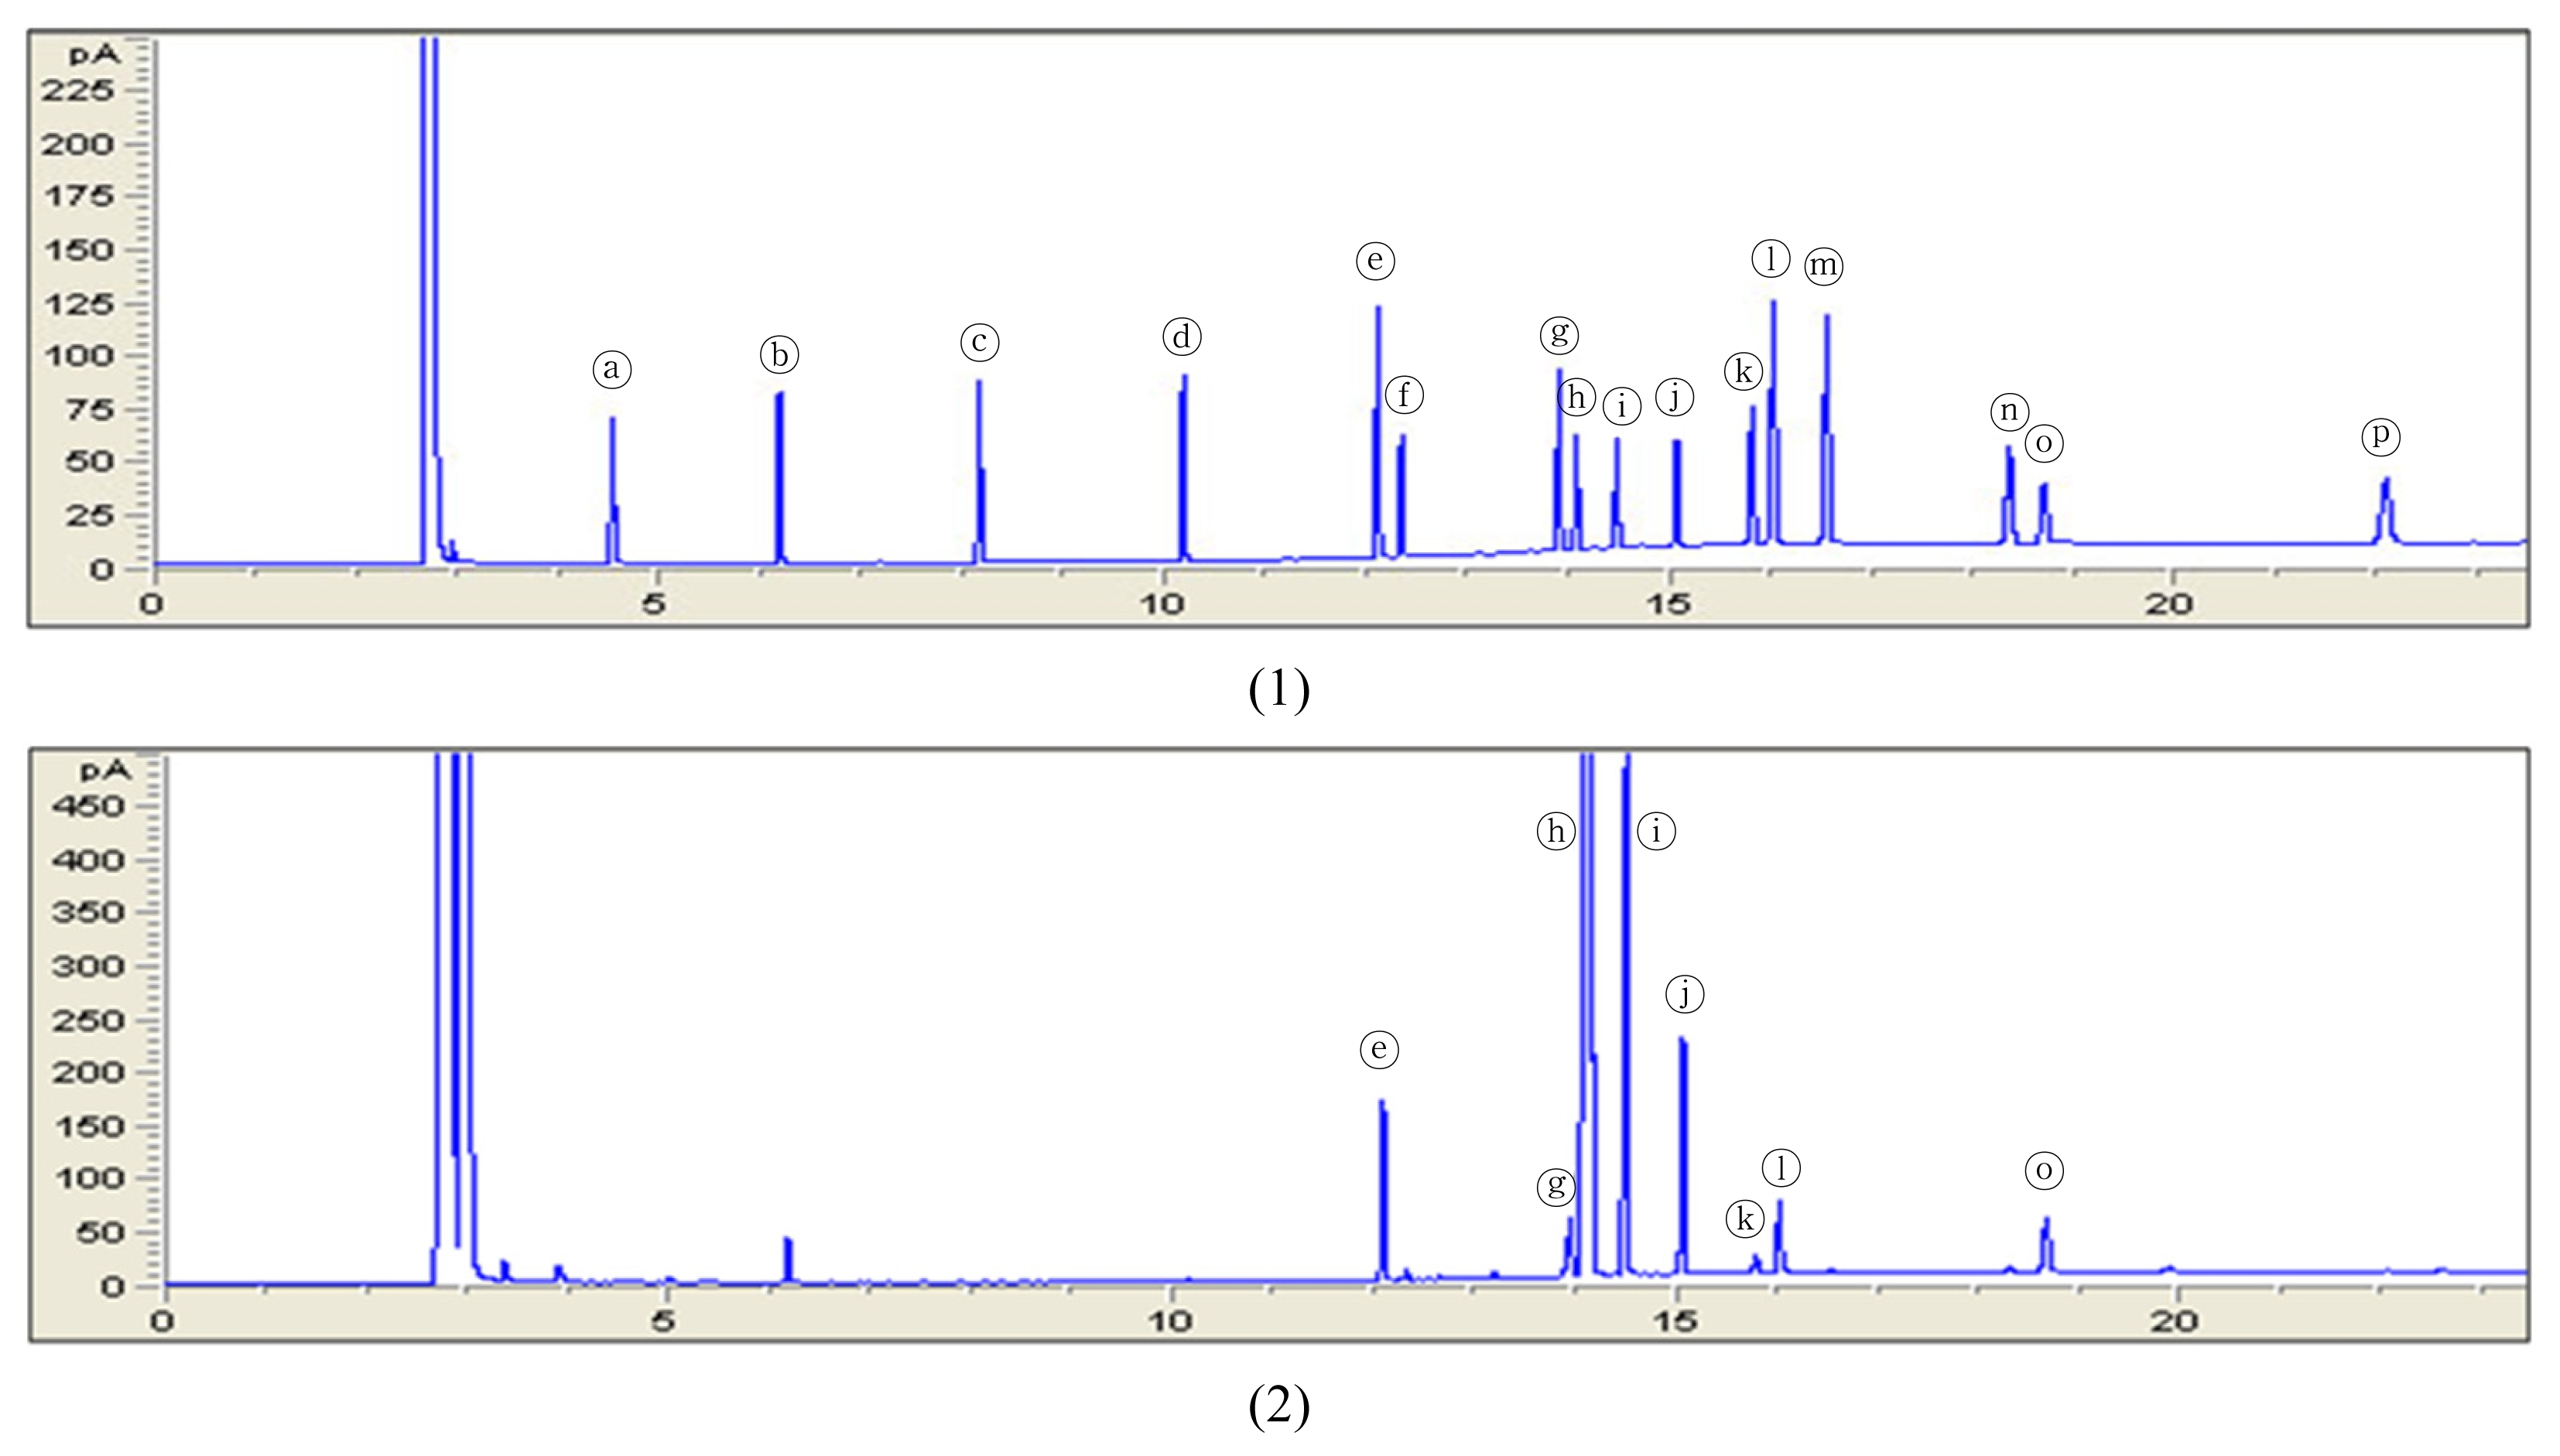
Typical chromatographic profiles of fatty acids on a mixed FAME standard solution (1) and a rapeseed sample (2) are shown in
Fig. 2. Eight peaks were observed in rapeseed samples, which were identified as palmitic acid (ⓔ), stearic acid (ⓖ), oleic acid (ⓗ), linoleic acid (ⓘ), linolenic acid (ⓙ), arachidic acid (ⓚ), eicoseoic acid (ⓛ) and erucic acid (ⓞ) by comparing with the retention times of the standard compounds.
The results of ANOVA for oil content and fatty acids of eight rapeseed varieties in two locations are presented in
Table 1. Variety by location interaction was not significant (
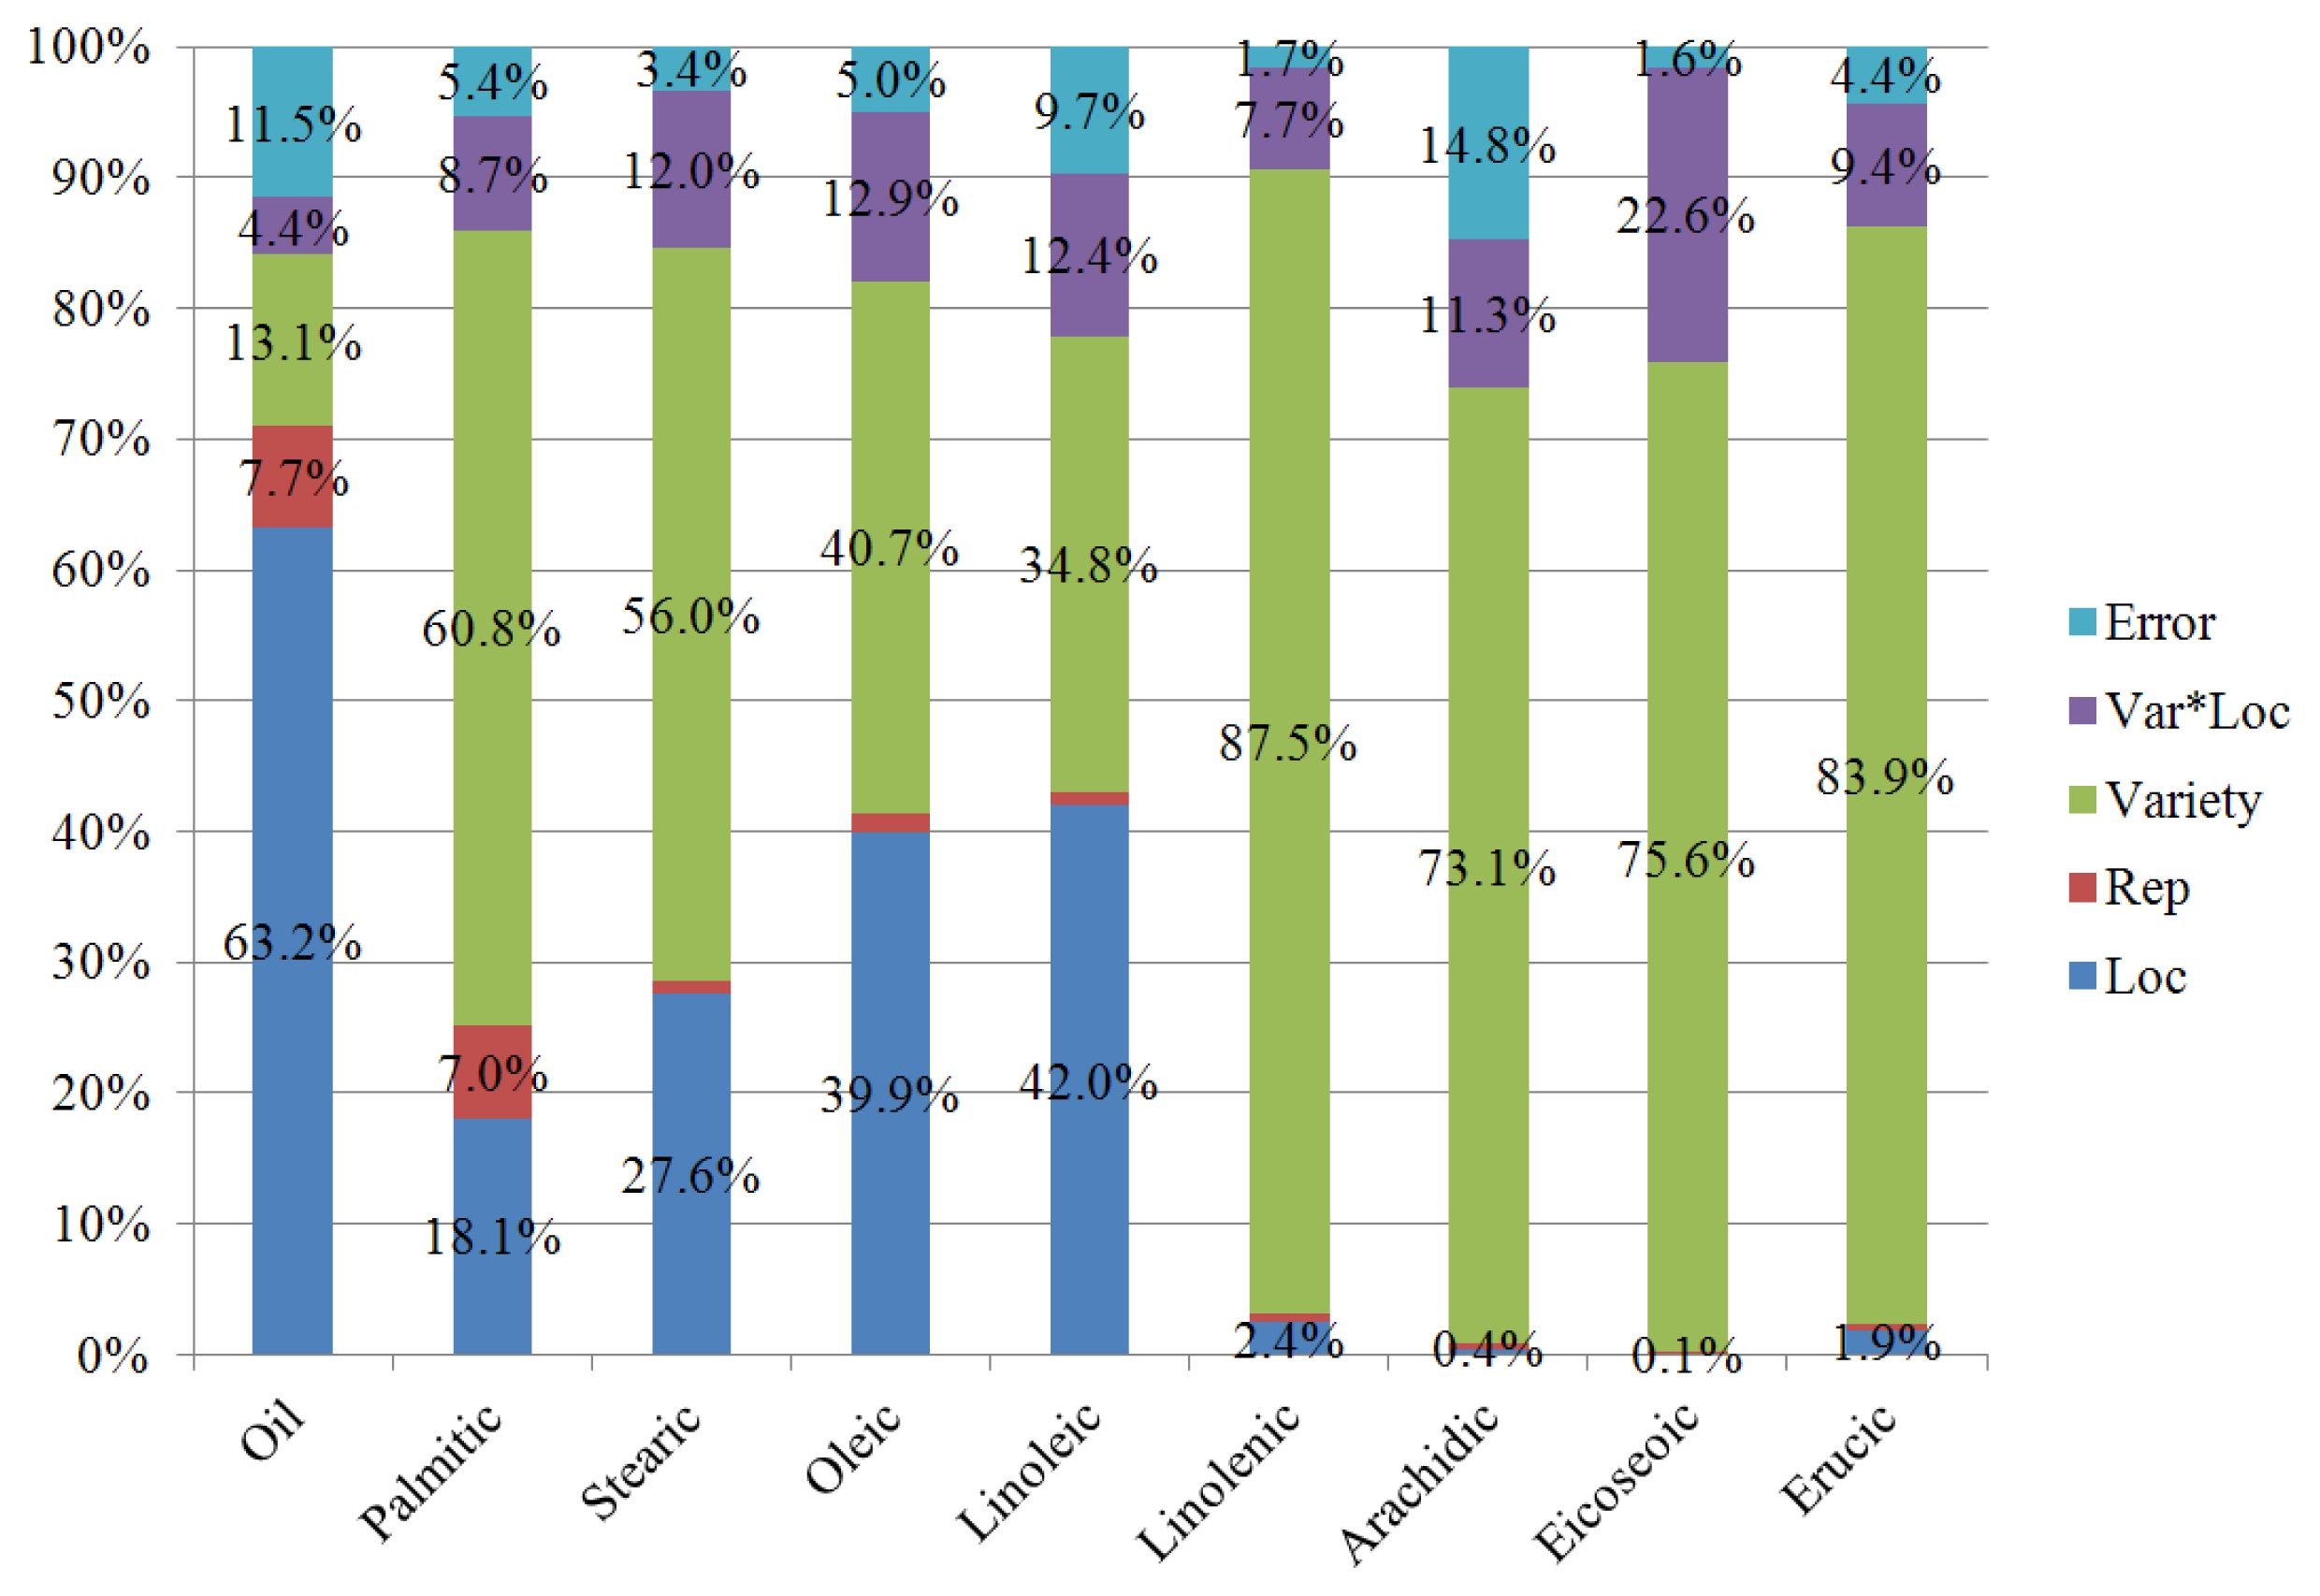
p = 0.2008) for oil content while all fatty acids detected had significant interaction terms. For the oil content with no significant interaction, effect of location and variety was significantly different with the p-value of 0.0046 and 0.0017, respectively. However, sum of squares for location was much higher (63.2%) than that of variety (13.1%) in total sum of squares (
Fig. 3). This in terms indicates variation due to location effect is greater than variety for oil content. Interestingly, greater influence of location effect on total variation was not observed for all fatty acids when sums of squares for each term were expressed in percentage.
In general, variety effect was a major factor for observed variation in all fatty acids except linoleic acid which had similar percentage of sum of squares for variety (34.8%) and location (42.0%). For linolenic, arachidic, eicoseoic and erucic acid, location effect was quite negligible. Instead, variety effect dominantly occupied very high proportion of total sums of squares, from 73.1% for arachidic acid to 87.5% for linolenic acid. We can carefully draw a conclusion from the ANOVA result for oil and fatty acid that oil content could be predicted for test locations without rank change or cross-over interaction among the varieties tested. However, there could be significant changes in fatty acid composition in the rapeseed oil produced from different varieties in different area.
Gororo et al. (2003) also observed significant genotype by environment interaction in saturated fatty acid content in Australian canola. The eight advanced breeding lines didn’t perform similarly across 14 environments in terms of palmitic, stearic and arachidic acid content. In contrast to our results, they observed that different environments influenced the most on variation in saturated fatty acid content of canola. This discrepancy can be attributed to different genotypes and environments used in two studies. It may also require a greater effort for local breeders that new breeding materials should be evaluated for their target environments prior to main breeding activities for fatty acid composition due to omni-presence of genotype by environment interaction.
Oil content of all genotypes evaluated in Cheongwon (AVG=43.19) was higher than that in Muan (AVG=38.68) located in the south western part of Korea (
p<0.0001). As mentioned earlier, monthly mean temperature and precipitation was both higher in the last two months of the cropping season in Cheongwon (
Fig. 1). Whether these two factors had an influence on the observed difference in mean oil content in the two locations remains unclear and brings an attention for further studies in rapeseed. In soybean (
Glycine max), there has been a confirmed positive correlation between oil content and temperature from a controlled experiment using phytotron (
Wolf et al. 1982).
A previous study had an observation that rapeseed had about 60~80% oleic acid content (
Mollers & Schierholt 2002). Similar results were found in this study where oleic acid was the main component (56.8~71.9%, AVG=64.33%) in rapeseed fatty acid followed by linoleic (13.0~22.4%, AVG=19.04%) and linolenic (6.1~10.3%, AVG=7.32%) acid (
Table 2). These three fatty acids together took up about 90.71% of fatty acid composition of rapeseed. With the significant variety by location interaction for all fatty acids detected, it appeared that the three main rapeseed fatty acids were the most influenced in magnitude. When means of same varieties from two different locations were compared for each fatty acid, stearic and oleic acid for all varieties were significantly higher in Cheongwon than Muan by Waller-Duncan’s multiple range test. In contrast, all varieties except Tamla had significantly lower linoleic acid in Cheongwon than Muan. Oleic acid is a precursor for linoleic acid in the biosynthetic pathway of fatty acids (
Rahman et al. 2001). Hence, the decrease in linoleic acid can be inferred as a direct consequence of the increase in oleic acid. Correlation analysis also confirmed the association (
Table 3). Correlation coefficient between oleic and linoleic acid was −0.85 (
p<0.001), the strongest correlation found among fatty acids in this study. There was also a significant positive correlation between stearic and oleic acid (
r = 0.37,
p = 0.011) while palmitic and oleic acid were negatively correlated (
r = −0.42,
p = 0.003). While the association of oleic acid to linoleic acid is found in many crop species (
Knowles & Hill 1964;
Downey & Dorrell 1971:
Wolf et al. 1982), the observed positive and negative correlation of oleic acid to stearic and palmitic acid in this study was different from the results found in soybean (
Wolf et al. 1982). In their phytotron study with different temperature regime, no such relationship was observed with temperature increase. Hence, correlated changes of palmitic and stearic acid in relation to oleic acid from two locations might be caused by some other environment factors other than different temperature observed during grain filling period. There was an increased rainfall in Cheongwon for the last two month of the growing season. Whether rainfall has an effect on change of fatty acid contents in rapeseed was not well documented in the literature. This should be a subject for further research.
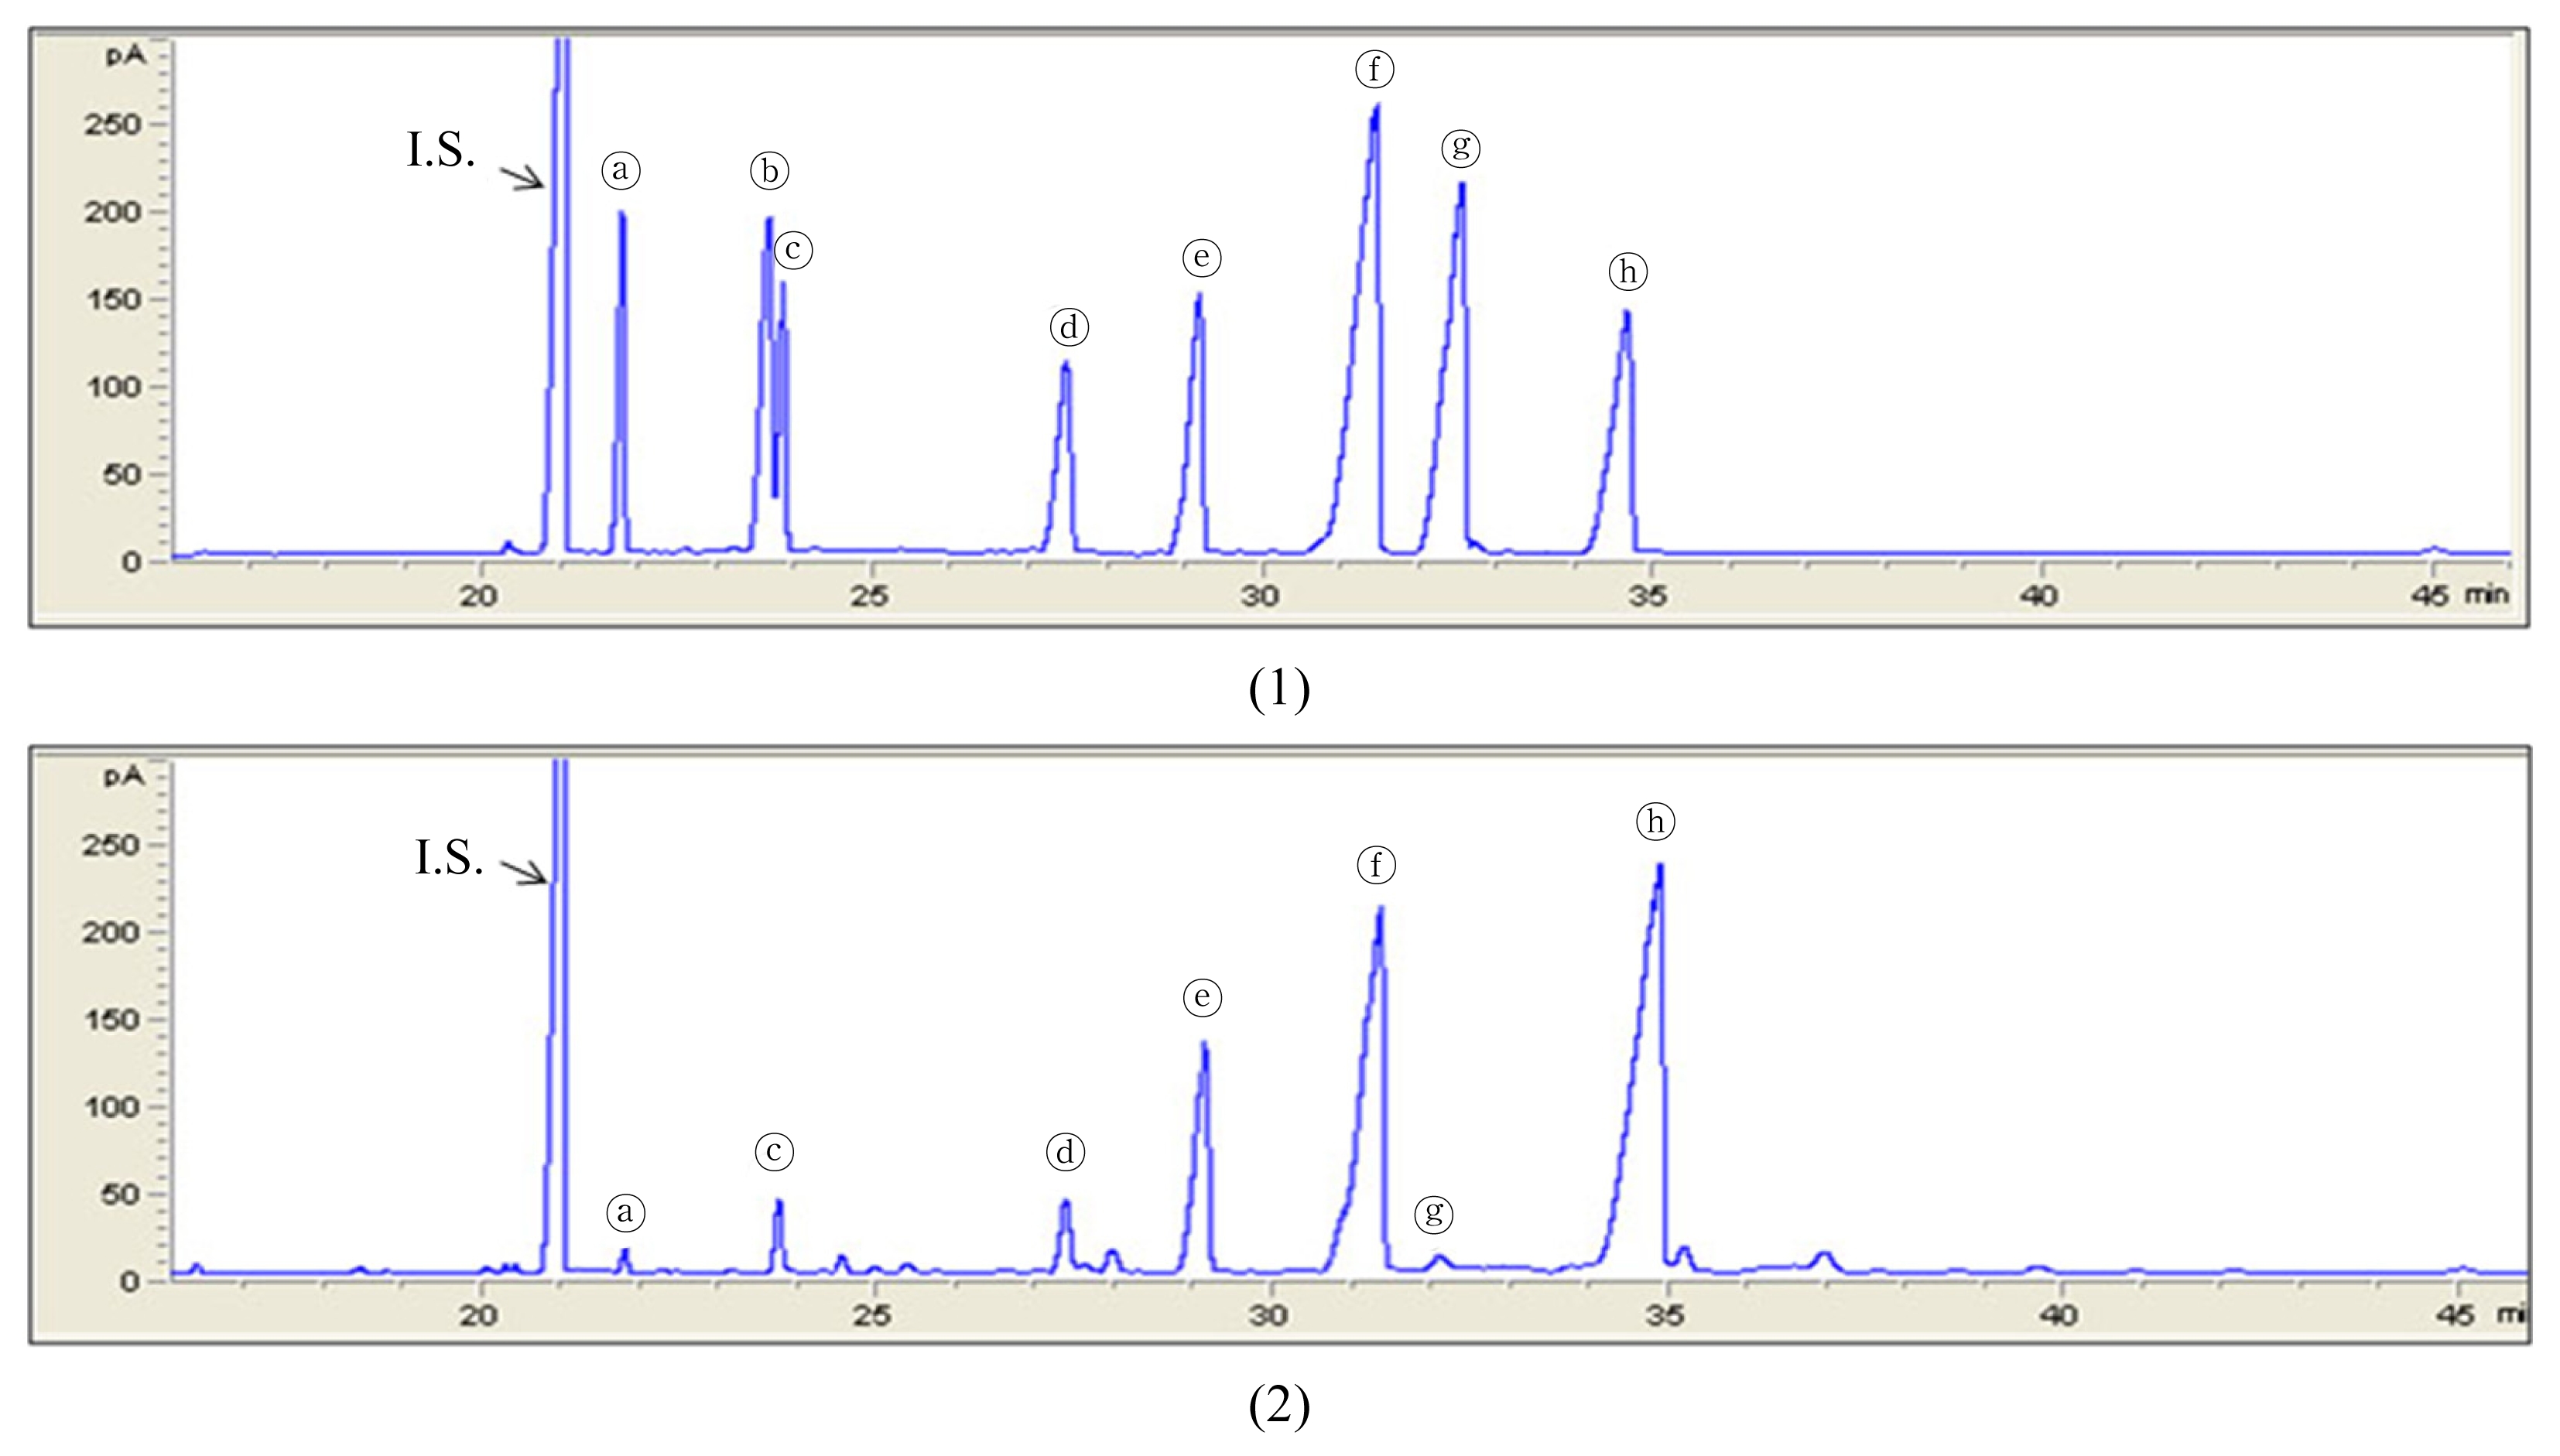
We successfully separated and quantified tocopherols and phytosterols by GC-FID.
Fig. 4 showed a typical gas chromatogram of the tocopherol and phytosterol standard mixture (1) and rapeseed sample (2). All major tocopherols and phytosterols were separated and detected in 40 min. As shown in
Fig. 4, internal standard (5α-cholestane) was first detected, followed by δ-, β-, γ-, α-tocopherol, brassicasterol, campesterol, stigmasterol and β-sitosterol, while β-tocopherol was not detected in all rapeseed samples.
Table 4 shows analyses of variance for tocopherols and phytosterols in eight rapeseed varieties in two locations. Variety by location interaction was not significantly different except for α-tocepherol (
p = 0.042) and stigmasterol (
p = 0.0108). The chemical components with no significant interaction term also had no significant location effect while effect for the variety was all significant except δ-tocopherol. It had none of terms for the source of variation significant in ANOVA. Relatively large error sum of squares for δ-tocopherol is responsible for the no significance. It took up 56.4% of total sum of squares while all the other compounds ranged from 9.9% to 28.3%. This is quite high in comparison to the range (1.6%~14.8%) found in oil and fatty acids. Tocopherols and phytosterols are secondary metabolites found in plant with very small quantity unlike fatty acids. Hence, this result suggests that more replications or samples be needed for the analysis of tocopherols and phytosterols than that of fatty acids if one would like to have similar level of statistical precision as fatty acids for tocopherols and phytosterols. Nevertheless, there exits genetic variation for the improvement of tocopherol and phytosterol contents in Korean rapeseed varieties without a concern for variety by location interaction. However, higher tocopherol levels are generally promoted by increased temperature in oilseeds and cereal grains (
Lampi et al. 2002).
In rapeseed, distribution of the four known tocopherol isomers is usually found to be 70% γ-tocopherol, 25% α-tocopherol, <5% δ-tocopherol, and β-tocopherol is absent (
Marwede et al. 2004). It also contained 0.5~1.1% phytosterols which are consisted of 55~58% β-sitosterol, 20~29% campesteol, 5~13% brassicasterol and <5% stigmasterol (
Hamama et al. 2003). Similar results were observed in this study where γ-tocopherol was found to be a major tocopherol (over 80%), and β-sitosterol (over 55%) as a major phytosterol in eight Korean rapeseed varieties (
Table 5). The γ-tocopherol content was highest in variety Naehan both in Cheongwon (253.03 μg g
−1) and in Muan (259.47 μg g
−1). Also, variety Naehan obtained the highest total tocopherol contents both in Cheongwon (276.03 μg g
−1) and in Muan (276.47 μg g
−1). The β-sitosterol content in Mokpo 68 line and the total phytosterol content in variety Naehan were consistently highest in both locations.
In biosynthetic pathway of tocopherols, 2-methyl-6-phytyl benzoquinol, a precursor for all tocopherols detected in this study takes two different pathways by two different enzymes, methyl transferase and cyclase. In one way, 2-methyl-6-phytyl benzoquinol is converted to γ-tocopherol which in terms ends up being converted to α-tocopherol. Cyclase converts 2-methyl-6-phytyl benzoquinol into δ-tocopherol which then is converted to β-tocopherol. α-tocopherol is also produced from β-tocopherol (
Lampi et al. 2002). It can be inferred from our observation that majority of 2-methyl-6-phytyl benzoquinol being produced in rapeseed is converted to γ-tocopherol. It, however, is unclear if α-tocopherol in rapeseed is produced mainly from γ-tocopherol or from δ-tocopherol via β-tocopherol from this study. Despite the well-understood biosynthetic pathway of tocopherols, correlation analyses did not detect any significant association among the three tocopherols detected in the analysis.
In phytosterol biosynthetic pathway, brassicasterol is produced via campsterol from 24-methylene lophenol which also takes another branch pathway to sitosterol (
Amar et al. 2008). In their study, spearman’s rank correlation between campesterol and brassicasterol was 0.37** while that of campesterol and sitosterol was 0.53**. Our pearson correlation analysis had a similar result (
r = 0.30,
p = 0.041) for campesterol and brassicasterol. But there was no correlation between campesterol and β-sitosterol in our study. Significant negative correlation (
r = −0.35,
p = 0.014) was also found between campesterol and stigmasterol.
Interactions between variety and environment are very important in crop breeding in order to develop a specific variety suitable for a given region (
Becker 1999). Based on the presence or absence of the interaction effect, breeders may have to change the target area for cultivation or selection scheme. In our study, all fatty acids detected had significant interaction between varieties and locations. Rapeseed breeders may have to adjust the target cultivation region based on more controlled experiment or recommendation for current cultivars should be restricted to high temperature area during seed formation for higher level of oleic acid. If the aim for breeding or cultivation is only on high level oil content, the result suggests that one can proceed without worrying too much about interaction effect of variety and environments. The same can be applicable for most of tocopherols and phytosterols. It should, however, be noted that cautions must be practiced since the results pose a limited information from only two location evaluation.
ACKNOWLEDGEMENTS
This work was supported by research grant of Chungbuk National University in 2011
Fig. 1Mean temperature (a) and rainfall (b) during 2010 and 2011 crop cycle in Cheongwon and Muan.

Fig. 2
Chromatograms of fatty acid by GC-FID in rapeseed.
(1): Standard mixture, (2): rapeseed sample ⓐ caprylic acid, ⓑ capric acid, ⓒ lauric acid, ⓓ myristic acid, ⓔ palmitic acid, ⓕ palmitoleic acid, ⓖ stearic acid, ⓗ oleic acid, ⓘ linoleic acid, ⓙ linolenic acid, ⓚ arachidic acid, ⓛ eicoseoic acid, ⓜ eicosadienioc acid, ⓝ behenicacid, ⓞ erucic acid, ⓟ lignoceric acid.

Fig. 3Sums of squares in percentage for oil and fatty acids detected.

Fig. 4
Chromatograms of tocopherol and phytosterol by GC-FID in rapeseed.
(1): Standard mixture, (2): rapeseed sample. I.S.: Internal standard, ⓐ: δ-T, ⓑ: β-T, ⓒ: γ-T, ⓓ: α-T, ⓔ: brassicasterol, ⓕ: campesterol, ⓖ: stigmasterol, ⓗ: β-sitosterol.

Table 1Analyses of variance for oil and fatty acids of eight rapeseed varieties tested in two test environments. Data show sums of squares with F-test results.
Table 1
|
Source of variation |
df |
Oil |
Palmitic |
Stearic |
Oleic |
Linoleic |
Linolenic |
Arachidic |
Eicoseoic |
Erucic |
|
Loc |
1 |
244.35**
|
0.75*
|
0.63**
|
185.26**
|
115.32**
|
1.58*
|
0.002ns
|
0.002ns
|
0.09*
|
|
Rep(Loc) |
4 |
29.83 |
0.29 |
0.02 |
6.94 |
2.76 |
0.44 |
0.002 |
0.007 |
0.02 |
|
Variety |
7 |
50.73**
|
2.52***
|
1.28***
|
189.19***
|
95.42***
|
56.74***
|
0.321***
|
4.168***
|
4.01***
|
|
Variety X Loc |
7 |
16.95ns
|
0.36**
|
0.27***
|
60.03***
|
34.05**
|
5.01***
|
0.050*
|
1.246***
|
0.45***
|
|
Error |
28 |
44.56 |
0.22 |
0.08 |
23.17 |
26.73 |
1.08 |
0.065 |
0.087 |
0.21 |
|
|
Total |
47 |
386.42 |
4.14 |
2.28 |
464.58 |
274.28 |
64.84 |
0.440 |
5.510 |
4.78 |
Table 2Analysis of oil and fatty acid contents (%) of eight rapeseed varieties in two cultivation locations.
Table 2
|
Varieties |
Locations |
Oil |
Fatty acid |
|
|
Palmitic |
Stearic |
Oleic |
Linoleic |
Linolenic |
Arachidic |
Eicoseoic |
Erucic |
|
Hanla |
Cheongwon |
41.13±0.924 cdef |
4.30±0.173 def |
2.63±0.058 a |
65.60±0.361 cd |
19.47±0.351 ef |
6.30±0.173 g |
0.60±0.000 d |
1.00±0.000 g |
0.03±0.058 f |
|
Muan |
38.37±2.458 ghi |
4.37±0.058 cde |
2.33±0.058 c |
63.10±0.300 hij |
22.20±0.173 ab |
6.13±0.115 g |
0.60±0.000 d |
1.10±0.000 f |
0.13±0.058 ef |
|
Mokpo111 |
Cheongwon |
42.67±1.069 bcd |
4.07±0.115 gh |
2.47±0.058 b |
66.20±0.265 bc |
18.70±0.173 f |
6.80±0.173 ef |
0.60±0.000 d |
1.07±0.058 fg |
0.07±0.058 f |
|
Muan |
37.23±1.185 i |
4.53±0.153 bc |
2.30±0.000 c |
63.37±0.651 ghij |
20.93±0.44 bcd |
6.77±0.351 b |
0.60±0.000 d |
1.30±0.000 d |
0.23±0.058 e |
|
Mokpo68 |
Cheongwon |
45.20±2.265 a |
3.90±0.173 hi |
2.13±0.058 d |
65.2±0.700 cdef |
19.10±1.931 ef |
8.87±0.351 b |
0.50±0.000 e |
1.13±0.058 ef |
0.10±0.000 f |
|
Muan |
39.67±2.458 efgh |
3.87±0.155 i |
2.00±0.100 f |
62.17±0.702 j |
21.17±0.416 abc |
9.03±0.503 b |
0.05±0.000 e |
1.20±0.000 e |
0.13±0.058 ef |
|
Naehan |
Cheongwon |
43.93±1.550 ab |
4.47±0.153 bcd |
2.47±0.058 b |
65.00±0.000 cdef |
16.73±0.153 g |
8.37±0.115 c |
0.80±0.000 a |
1.50±0.000 c |
0.60±0.000 cd |
|
Muan |
38.77±2.695 fghi |
4.93±0.155 a |
2.03±0.058 ef |
65.83±0.513 k |
22.40±0.100 a |
10.27±0.231 a |
0.70±0.000 bc |
1.50±0.100 c |
0.90±0.000 a |
|
Sunmang |
Cheongwon |
41.77±0.451 bcde |
4.40±0.100 bcde |
2.10±0.000 de |
65.33±0.208 cde |
18.27±0.058 f |
6.63±0.058 f |
0.63±0.058 cd |
1.87±0.058 b |
0.73±0.115 b |
|
Muan |
37.70±0.346 hi |
4.57±0.058 b |
2.00±0.000 f |
62.53±0.153 ij |
20.50±0.100 cde |
7.27±0.058 d |
0.60±0.000 d |
1.83±0.058 b |
0.70±0.000 bc |
|
Tamla |
Cheongwon |
43.37±0.503 abc |
4.17±0.155 fg |
2.13±0.058 d |
63.87±0.416 fghi |
18.20±0.100 f |
6.17±0.153 g |
0.60±0.000 d |
2.33±0.115 a |
0.87±0.153 a |
|
Muan |
37.20±1.825 i |
4.57±0.058 b |
2.03±0.058 ef |
62.17±0.862 j |
19.07±1.155 ef |
6.67±0.153 f |
0.73±0.115 ab |
1.50±0.000 c |
0.60±0.200 cd |
|
Tammi |
Cheongwon |
43.63±1.429 ab |
4.30±0.173 def |
2.13±0.058 d |
71.90±0.173 a |
12.97±0.252 h |
6.67±0.058 f |
0.70±0.000 bc |
1.33±0.058 d |
0.10±0.100 f |
|
Muan |
40.57±0.379 defg |
4.50±0.200 bc |
2.03±0.058 ef |
64.63±3.435 defg |
18.97±3.004 f |
6.80±0.173 ef |
0.67±0.115 bcd |
1.53±0.058 c |
0.10±0.100 f |
|
Yeongsan |
Cheongwon |
43.80±0.500 ab |
3.97±0.058 hi |
2.63±0.058 a |
67.27±0.252 b |
16.60±0.100 g |
7.33±0.153 d |
0.80±0.000 a |
1.30±0.000 d |
0.10±0.000 f |
|
Muan |
39.70±0.755 efgh |
4323±0.058 efg |
2.13±0.058 d |
64.13±0.306 efgh |
19.60±0.110 def |
7.10±0.100 de |
0.73±0.058 ab |
1.47±0.058 c |
0.50±0.000 d |
|
|
LSD (α=0.05) |
2.54 |
0.21 |
0.09 |
1.61 |
1.60 |
0.36 |
0.08 |
0.09 |
0.14 |
Table 3Pearson correlation coefficients among oil, fatty acids, tocophenols and phytosterols.
Table 3
|
Oil |
Palmitic |
Stearic |
Oleic |
Linoleic |
Linolenic |
Arachidic |
Eicoseoic |
Erucic |
α-T |
γ-T |
δ-T |
Brassica |
Campe |
Stigma |
β-sito |
|
Oil |
|
−0.46 |
0.32 |
0.57 |
−0.56 |
0.03 |
0.03 |
0.01 |
−0.19 |
−0.01 |
−0.24 |
0.06 |
−0.34 |
0.00 |
−0.27 |
−0.04 |
|
Palmitic |
0.001 |
|
−0.21 |
−0.42 |
0.18 |
0.06 |
0.35 |
0.27 |
0.49 |
−0.14 |
0.53 |
−0.21 |
0.26 |
0.46 |
−0.33 |
−0.13 |
|
Stearic |
0.029 |
0.154 |
|
0.37 |
−0.21 |
−0.26 |
0.23 |
−0.45 |
−0.42 |
0.27 |
0.01 |
−0.17 |
−0.12 |
0.05 |
−0.20 |
−0.05 |
|
Oleic |
<0.001 |
0.003 |
0.011 |
|
−0.85 |
−0.49 |
0.17 |
−0.18 |
−0.52 |
0.55 |
−0.32 |
0.05 |
−0.53 |
0.08 |
−0.20 |
−0.05 |
|
Linoleic |
<0.001 |
0.222 |
0.152 |
<0.001 |
|
0.26 |
−0.47 |
−0.11 |
0.18 |
−0.38 |
0.21 |
0.05 |
0.46 |
−0.39 |
0.41 |
−0.03 |
|
Linolenic |
0.829 |
0.684 |
0.069 |
<0.001 |
0.072 |
|
−0.02 |
−0.14 |
0.19 |
−0.58 |
0.29 |
0.14 |
0.41 |
0.18 |
0.15 |
0.44 |
|
Arachidic |
0.829 |
0.015 |
0.121 |
0.260 |
<0.001 |
0.877 |
|
0.13 |
0.19 |
0.17 |
0.28 |
−0.11 |
−0.23 |
0.60 |
−0.53 |
0.04 |
|
Eicoseoic |
0.967 |
0.064 |
0.001 |
0.232 |
0.470 |
0.329 |
0.364 |
|
0.78 |
−0.14 |
−0.20 |
−0.27 |
0.01 |
0.25 |
−0.19 |
−0.30 |
|
Erucic |
0.203 |
<0.001 |
0.003 |
<0.001 |
0.219 |
0.193 |
0.186 |
<0.001 |
|
−0.39 |
0.08 |
−0.30 |
0.33 |
0.40 |
−0.22 |
−0.11 |
|
α-T |
0.946 |
0.333 |
0.059 |
<0.001 |
0.008 |
<0.001 |
0.251 |
0.349 |
0.007 |
|
−0.25 |
−0.03 |
−0.41 |
−0.01 |
−0.01 |
−0.23 |
|
γ-T |
0.103 |
<0.001 |
0.967 |
0.025 |
0.142 |
0.043 |
0.057 |
0.166 |
0.610 |
0.085 |
|
0.13 |
0.24 |
0.28 |
−0.34 |
0.27 |
|
δ-T |
0.667 |
0.153 |
0.246 |
0.755 |
0.713 |
0.344 |
0.438 |
0.060 |
0.036 |
0.863 |
0.390 |
|
−0.17 |
−0.18 |
0.17 |
0.30 |
|
Brassica |
0.018 |
0.070 |
0.427 |
<0.001 |
0.001 |
0.003 |
0.120 |
0.940 |
0.022 |
0.004 |
0.107 |
0.258 |
|
0.30 |
0.25 |
0.22 |
|
Campe |
0.987 |
0.001 |
0.714 |
0.569 |
0.007 |
0.226 |
<0.001 |
0.089 |
0.005 |
0.954 |
0.051 |
0.220 |
0.041 |
|
−0.35 |
0.25 |
|
Stigma |
0.059 |
0.024 |
0.166 |
0.166 |
0.004 |
0.293 |
<0.001 |
0.204 |
0.137 |
0.926 |
0.019 |
0.254 |
0.085 |
0.014 |
|
0.04 |
|
β-sito |
0.785 |
0.364 |
0.732 |
0.734 |
0.827 |
0.002 |
0.793 |
0.039 |
0.468 |
0.119 |
0.068 |
0.036 |
0.139 |
0.085 |
0.785 |
|
Table 4Analysis of variance in tocopherol and phytosterol contents (μg g−1) of eight rapeseed varieties in two locations. Data show sums of squares with F-test results.
Table 4
|
Source osf variation |
df |
Tocopherols |
Phytosterols |
|
|
|
Total |
α-Tz)
|
γ-Ty)
|
δ-Tx)
|
Total |
Brassicav)
|
Campeu)
|
Stigmat)
|
β-sitos)
|
|
Loc |
1 |
4776.0ns
|
66.3ns
|
5779.4ns
|
1.5ns
|
3884.4ns
|
21522.3ns
|
41943.3ns
|
4508.6*
|
5094.4ns
|
|
Rep(Loc) |
4 |
4573.2 |
617.6 |
5414.1 |
8.2 |
3981988.2 |
102006.8 |
146633.2 |
941.9 |
1681114.5 |
|
Variety |
7 |
42279.0***
|
6844.9***
|
44877.3***
|
15.6ns
|
5390295.1***
|
335592.3***
|
697190.9***
|
24354.7***
|
4835740.5***
|
|
Variety X Loc |
7 |
3149.2ns
|
1000.7*
|
2293.8ns
|
7.3ns
|
1815596.8ns
|
37898.4ns
|
70583.1ns
|
3152.3*
|
1233275.0ns
|
|
Error |
28 |
7816.8 |
1626.4 |
6377.3 |
42.1 |
3983228.2 |
196423.5 |
227814.1 |
3810.0 |
2136145.0 |
|
Total |
47 |
62594.3 |
10155.8 |
64742.0 |
74.7 |
15174992.7 |
693443.3 |
1184164.5 |
36767.3 |
9891369.4 |
Table 5Analysis of tocopherol and phytosterol contents (μg g−1) of eight rapeseed varieties in two locations.
Table 5
|
Varieties |
Locations |
Tocopherol |
Phytosterol |
|
|
|
Total |
α-T |
γ-T |
δ-T |
Total |
Brassica |
Campe |
Stigma |
β-sito |
|
Hanla |
Cheongwon |
267.87±4.302 a |
46.80±4.440 abc |
216.63±6.181 cde |
4.43±0.208 a |
5239.63±274.147 ab |
740.83±63.518 abc |
973.43±95.039 defg |
31.43±10.072 cd |
3493.93±111.196 abc |
|
Muan |
264.77±19.651 ab |
33.37±13.478 de |
225.07±16.684 bc |
6.33±2.281 a |
4779.23±552.071 ab |
663.67±138.978 bcd |
896.93±102.989 fg |
41.00±15.181 c |
3177.63±328.463 abcd |
|
Mokpo111 |
Cheongwon |
209.87±17.012 defg |
40.33±11.956 bcd |
165.17±11.843 fghi |
4.37±0.850 a |
4376.20±352.819 b |
805.77±64.6523 ab |
1053.03±81.219 bcdef |
60.27±8.677 b |
2457.13±201.617 e |
|
Muan |
234.53±9.150 bcd |
42.97±9.131 bcd |
187.53±7.506 efg |
4.03±0.950 a |
4557.20±399.045 b |
825.77±42.309 ab |
1047.20±88.333 bcdef |
103.57±3.729 a |
2580.67±276.923 de |
|
Mokpo68 |
Cheongwon |
187.43±1.665 fg |
15.70±4.503 gh |
166.20±6.002 fghi |
5.53±0.473 a |
5330.93±291.524 ab |
741.67±50.793 abc |
946.93±62.118 efg |
71.43±18.250 b |
3570.90±185.456 ab |
|
Muan |
205.23±12.143 defg |
23.50±4.214 efgh |
175.87±8.165 fghi |
5.87±1.662 a |
5352.33±771.734 ab |
783.87±199.104 ab |
799.07±65.074 g |
100.97±14.506 a |
3668.43±494.607 a |
|
Naehan |
Cheongwon |
276.03±12.050 a |
18.90±4.670 fgh |
253.03±8.565 ab |
4.10±0.954 a |
5679.63±312.898 a |
814.17±51.639 ab |
1354.33±81.099 a |
21.53±11.741 d |
3489.60±208.882 abc |
|
Muan |
276.47±42.285 a |
12.13±4.225 h |
259.47±44.071 a |
4.87±1.007 a |
5343.50±369.611 ab |
894.70±104.777 a |
1225.70±83.611 ab |
25.40±11.386 cd |
3179.70±185.690 abcd |
|
Sunmang |
Cheongwon |
191.37±26.054 efg |
26.10±9.015 efg |
161.23±22.288 ghi |
4.03±0.551 a |
4884.80±285.080 ab |
765.93±41.049 ab |
1149.70±83.611 ab |
35.87±8.816 cd |
2933.30±183.330 cde |
|
Muan |
281.07±9.711 cdef |
35.60±6.451 cde |
177.57±13.279 fgh |
4.90±2.476 a |
5080.57±389.373 ab |
796.63±79.322 ab |
1149.70±83.611 ab |
69.30±4.215 b |
3046.17±256.168 abcde |
|
Tamla |
Cheongwon |
184.63±5.107 g |
32.63±7.304 de |
148.03±3.580 hi |
3.97±0.945 a |
4339.37±276.445 b |
689.00±38.835 bcd |
1149.07±53.432 bcd |
37.77±13.959 cd |
2618.23±192.017 de |
|
Muan |
220.37±24.581 cde |
31.90±4.158 def |
184.27±27.600 fg |
4.20±1.212 a |
4972.43±817.891 ab |
719.27±41.397 abcd |
1168.47±56.486 bc |
32.73±9.509 cd |
3168.87±729.956 abcd |
|
Tammi |
Cheongwon |
256.70±9.614 ab |
58.93±8.905 a |
192.30±7.725 def |
5.47±1.656 a |
4978.37±620.392 ab |
572.03±84.781 cd |
994.37±51.288 cdef |
21.00±8.903 d |
3207.13±385.408 abcd |
|
Muan |
266.50±34.426 a |
40.87±0.808 bcd |
220.33±34.593 cd |
5.30±0.964 a |
4374.30±677.671 b |
660.77±113.588 bcd |
1051.97±229.349 cdef |
29.07±8.198 cd |
2668.50±441.650 de |
|
Yeongsan |
Cheongwon |
201.00±23.961 efg |
49.27±14.103 ab |
146.73±10.877 i |
5.00±0.755 a |
4651.03±732.999 ab |
545.57±88.263 d |
1085.07±165.739 bcde |
33.50±13.700 cd |
2986.90±485.141 bcde |
|
Muan |
248.57±8.864 abc |
49.53±12.011 ab |
194.80±21.022 def |
4.23±0.551 a |
4876.47±210.411 ab |
669.10±157.954 bcd |
1057.20±89.324 bcdef |
65.83±20.710 b |
3084.33±256.918 abcde |
|
|
LSD (α=0.05) |
32.73 |
13.93 |
31.93 |
2.08 |
829.76 |
160.61 |
179.91 |
20.27 |
576.42 |
References
- Abidi SL. 2001. Chmatographic analysis of plant sterols in foods and vegetable oils. I. Chromatogr, A 2001. 935: 173-201.
- Alpaslan M, Gündüz H. 2000. The effects of growing conditions on oil content, fatty acid composition and tocopherol content of some sunflower varieties produced in Turkey. Food/Nahrung. 44(6): 434-437.
- Amar S, Ecke W, Becker HC, Möllers C. 2008. QTL for phytosterol and sinapate ester content in Brassica napus L. collocate with the two erucic acid genes. Theor Appl Genet. 116: 1051-1061.
- AOCS.1993. Official methods and recommended practices. The Americian oil chemists society. Champaign, 1L.
- Becker HC, Loptein H, Robbelen G. 1999. Breeding: An overview. editor. Developments in plant genetics and Breeding, 4: Biology of Brssica coenospecies. Gomez-Campo C, 13: pp. 413-449.
- Downey RK, Dorrell DG. 1971. Genetic control of fatty acid composition in oil seed crops. Proc Flax Inst US. 41: 1-3.
- Goffman F, Velasco L, Becker HC. 1999. Tocopherols accumulations in developing seeds and pods of rapeseed (Brassica napus L.). Fett/Lipid. 101: 400-403.
- Gororo NN, Salisbury PA, Rebetzke GJ, Burton WA, Bell CC. 2003. Genotypic variation for saturated fatty acid content of victorian canola. In: Proceedings: 11th International Rape Seed Congress; Copenhagen, Denmark. pp 215-217.
- Hamama AA, Bhard HL, Starnal DE. 2003. Genotype and growing location effects on phytosterols in canola oil. J Am Oil Chem Soc. 80: 1121-2488.
- Jang YS, Choi IH, Oh YB, Cho SY, Chong DH, Oh HC. 1997. SHORT INFORMATION (Characteristics of New Varieties Developed in 1997): A new early - maturing, flower of large size and the use of sightseeing rapeseed variety “Tammiyuchae”. Korean journal of breeding science. 29(4): 507.
- Kamal-Eldin A, Appelqvist LA. 1996. The chemistry and antioxidant properties of tocopherols and tocotrienols. Lipids. 31: 671-701.
- Knowles PE, Hill AB. 1964. Inheritance of fatty acid content in the seed oil of a safflower introduction from Iran. Crop Science. 4: 406-409.
- Lampi AM, Kamal-Eldin A, Piironen V. 2002. Tocopherols and tocotrienols from oil and cereal grains. editors. Functional foods: Biochemical and processing aspects. Shi J, Mazza G, Maguer ML, CRC Press, LCC. 2: pp. 1-38.
- Marwede V, Mollers C, Olejniczak J, Becker HC. 2003. Genetic variation, genotype x environment interactions and herirability of tocopherol content in winter oilseed rape (Brassica napus L.). In: proc. 11th Int. Rapeseed Congr.; KVL Copenhagen. 6ȓ10; pp 212-214.
- Marwede V, Shierholt A, Moellers C, Becker HC. 2004. Genotype X environment interactions and heritability of tocopherol contents in canola. Crop Sci. 44: 728-731.
- Mollers C, Schierholt A. 2002. Genetic variation of palmitate and oil content in a winter oilseed rape doubled haploid population segregating for oleate content. Crop Sci. 42: 379-384.
- Muhammet KG, Samija A. 2006. Sterols and phytosterol content in oilseed rape (Brassica napus L.). J of cell and Mol Bio. 5: 71-79.
- Nissinen M, Gylling H, Vuoristo M, Miettinen TA. 2002. Micellar distribution of cholesterol and phytosterols after duodenal plant stanol ester infusion. American Journal of Physiology – Gastrointestinal and liver Physiology. 282: 1009-1015.
- Ostlund RE. 2007. Phytosterols, cholesterol absorption and healthy diets. Lipids. 42(1): 41-44.
- Piazza GJ, Foglia TA. 2001. Rapeseed oil for oleochemical uses. Eur J Lipid Sci Technol. 103: 405-454.
- Prabhudas PR, Woodall AL, Anderson PS, Mikhail MS. 2000. α-Tocopherol and α-tocopheryl quinone levels in cervical intraepithelial neoplasia and cervical cancer. American Journal of Obstetrics and Gynecology. 190(5): 1407-1410.
- Rahman SM, Kinoshita T, Anai T, Takagi Y. 2001. Combining ability in loci for high oleic and low linolenic acids in soybean. Crop Science. 41: 26-29.
- Trautwein EA, Duchateau G, Lin Y, Melcnikov SM, Molhuizen H, Ntanios FY. 2003. Proposed mechanisms of cholesterol-lowering action of plant sterols. European Journal of lipid Science and Technology. 105: 171-185.
- Wolf RB, Cavins JF, Kleiman R, Black LT. 1982. Effect of temperature on soybean seed consitituents: oil, protein, moisture, fatty acids, amino acids and sugars. Journal of the American oil chemists’ society. 59(5): 230-232.