Abstract
Plant breeding relies on genetic variation to produce new and improved cultivars. One way to obtain novel traits is by inducing mutations. The present study aimed to create a Fusarium crown rot (FCR) and Fusarium head blight (FHB)-resistant mutagenized wheat population using ethyl methane sulphonate (EMS) and identify mutant resistance to FCR and FHB, which could provide a starting point for resistance breeding. The optimal mutagenesis conditions were determined based on the germination percentage. This study used six Chinese wheat cultivars, namely Jimai22, Hengguan35, Shixin828, Gaoyou2018, Keiwei20, and Keiwei18, to create a mutant population by treating them with EMS. For Shixin828, the optimal condition was 0.8% EMS with a 50-55% germination rate. For Hengguan35 and Jimai22, it was 0.6% EMS. For Gaoyou2018 and Kewei20, it was 0.8% and 0.4-0.6%, respectively. The FCR disease index of the mutant lines (M1) ranged from 10.00 to 77.67. For M2, the number of individual mutant plants demonstrating resistance to FCR varied from 76 to 102. In M3, 570 healthy plants were obtained using various EMS concentrations. The mutant line Kewei18 demonstrated the most resistance to FCR, FHB, and Deoxynivalenol (DON) infection. Kewei20 mutants had a higher FHB susceptibility than other mutants. Overall, mutants from the Kewei18 genetic background displayed better disease resistance to both diseases and DON contamination than natural plants. Mutants with or moderate resistance to FCR and FHB could be used in breeding and genetic studies to identify FHB and FCR-resistant Quantitative Trait Locus (QTL) in wheat.
-
Key words: Crop imporvement, Disease resistance, Genetic variation, Mutation breeding, Physical, Chemical mutagen
Introduction
Wheat (
Triticum aestivum) is an important staple food crop that plays a vital role in national food security, and socio-economic development. A complex of plant pathogens belonging to the
Fusarium fungal genera are among wheat's most economically important pathogens. The pathogen has however developed resistance to some fungicides. The use of fungicides has also been shown to worsen mycotoxin contamination (
McMullen et al. 1997). Unfortunately, efforts to carry out population-breeding programs have not brought sound results or changes in the Fusarium Crown Rot (FCR) and Fusarium Head Blight (FHB)-resistant breeding (
Sikora et al. 2011). It is therefore necessary to identify sources of FCR and FHB resistance to lay a foundation for breeding resistant varieties. There are multiple mutation strategies to screen desirable variations for wheat improvement and produce resistant genes from its wild species (
Pathirana 2011;
Arora et al. 2018). The creation of novel gene mutagenesis changes the nucleotide sequences, allowing the production of alleles.
The most common methods of mutagenesis are (1) biological agents (e. g. T-DNA and transposons)(
Hancock et al. 2011), (2) chemical mutagens (e.g., ethyl methane sulfonate (EMS), Nitroso-methyl urea (NMU), and ethyl nitrosourea (ENU)), (3) physical agents (e.g., UV, X-ray radiation and fast neutron (FN)), and (4) transgenic technologies (e.g., CRISPR-Cas9, gene knockdown using RNAi)(
Lu et al. 2015). Due to its effectiveness and potential to induce high-frequency point mutations, chemical mutagenesis using EMS is the most widely used crop mutation (
Chen et al. 2012). Compared to physical methods and other chemical mutagens, EMS is relatively easy to handle; it can provide very high mutation frequency and can be detoxified via hydrolysis for disposal (
Pathirana 2011). Furthermore, EMS-mutated populations resulted in more GC (purines) to AT (pyrimidines) transitions, causing mispairing with thiamine (T) instead of cytosine (C) (
Greene et al. 2003), and it is an alkylating agent directly affecting DNA by alkylating guanine (G) bases (
Tetlow et al. 1994;
Singh et al. 2015).
Genetic resources play a tremendous role in disease resistance and yield-improving genes (
Hoisington et al. 1999). Reverse and forward genetic approaches have identified new genes and gene functions that have proved vital for improved or new genetic-based plant traits. These two approaches have been used to analyze EMS mutagenized populations: A forward genetic screen is used to identify genes (or set of genes) responsible for a particular phenotype of an organism. On the other hand, a reverse genetic screen analyses the phenotype of an organism following the disruption of a known gene. In short, forward genetics starts with a phenotype and moves towards identifying the gene (s) responsible. In contrast, reverse genetics begins with a known gene and assays the effect of its disruption by analyzing the resultant phenotypes. Both forward and reverse genetic screens aim to determine gene function (
Peters et al. 2003;
Hartwell LH 2008).
Mutant populations have now been created for many cereal crops, including rice (
Suzuki et al. 2008), maize (Till et al. 2007), sorghum (
Xin et al. 2008), barley (
Caldwell et al. 2004), and both hexaploid bread wheat (
Dhaliwal et al. 2015;
Slade et al. 2005), and hexaploidy winter wheat mutagens (
Weil et al. 2009). Mutagenesis breeding aims to cause maximal genomic variation with a minimum decrease in viability (
Sikora et al. 2011). Mutagenized populations could be used to identify resistant lines with a vital genetic component, even for characters that vary considerably with environmental factors, like pathogen resistance. The skill of designing invitro assay experiments that have precise selection ability for lines having strong resistance against FCR disease can be identified (
Sikora et al. 2011).
Caldwell et al. (2004) have designed and tested a Petri dish assay to determine Fusarium-tolerant barely from a mutated population and found promising results that indicate the phenotype screening of a mutagenized population. It is essential to carefully design this method to evaluate the different population characteristics like pathogen resistance. Significant efforts have improved and sustained wheat production by developing varieties with more advanced genetics.
To increase mutation detection efficiency, optimizing the mutagen dose to achieve a high mutation rate while avoiding severe effects on germination and plant development is advisable. In diploid species, this can be difficult as even relatively low levels of mutation can result in the almost complete loss of male or female fertility, resulting in a need for huge populations if saturated coverage is required (
Parry et al. 2009). By contrast, polyploid species such as wheat have a very high tolerance for mutations due to homologous copies' complementation of essential genes. Thus, populations saturated with mutations can be much smaller, resulting in more cost-effective screening for mutations.
Information on chemical mutagenesis wheat cultivars resistant to FCR is scant.
Rizwan et al. (2015) carried out a study that screened and isolated mutant line populations resistant to leaf rust and powdery mildew. Recently,
Chhabra et al. (2021) have Conducted extensive forward genetic screening of the M
4 generation of an EMS-induced mutagenized population of cultivar Jagger to identify mutants with FHB resistance. However, there are no studies on FCR resistance mutants by EMS, and creating more FCR and FHB resistance germplasm resources is more significant. Hence, there is a need to develop optimal mutagenesis conditions for different cultivars and screen the FCR and FHB resistance mutant lines. The current study aimed to create an FCR and FHB-resistant mutagenized wheat population using EMS and identify mutant resistance to FCR and FHB that could lay a foundation for resistance breeding.
Materials and Methods
Plant materials and EMS treatment optimization
Six Chinese wheat cultivars (Jimai 22, Hengguan35, Shixin828, Gaoyou2018, Keiwei20 and Keiwei18 and the cultivar Sunco was used as a resistant control to FCR) were used to create a mutant population by EMS. These Chinese wheat cultivars have known resistance to FCR and FHB, have good quality, and are commercially cultivated in Hebei Province. The wheat seeds were disinfected with 70% ethanol for 1 minute and then rinsed three times with tap water for 5 minutes. For the preparation of different EMS concentrations, a baseline solution thewas prepared by dissolving 3.9 g of Na
2HPO
4.2H
2O and 8.95 g of K
2HPO
4H
2O in 500 mL of distilled water at pH 7. One of the most important requirements for mutation induction is the selection of an efficient dose of the mutagenic agent for mutating the starting material. The effectiveness of a chemical mutagen isn't just about the chemical itself, but also the genetic makeup of the material being treated (
Kamra et al. 1977).
The concentration of EMS to be used was determined on a preliminary experiment before treating all seeds of wheat cultivars (before a large-scale treatment was done), and the relative germination rate and germination rate were determined as described in formulas (1) and (2) below.
Seeds (100 per cultivar per treatment) were treated with 0.4%, 0.6%, 0.8%, and 1% of EMS concentrations, and their germination percentage and relative germination rate were calculated as described above for the premier treatment.
To develop the EMS mutant population, one hundred seeds from each cultivar were soaked in ordinary water overnight (= 18 hours at room temperature) the water was discarded, and a measured quantity of sterile water was added just until 2 cm above the seed level and poured off. Seeds were then immersed in a prepared concentration of EMS (15 mL for 100 seeds) (ACMEC biochemical, Beijing, China) solution in 0.1 M sodium phosphate buffer (pH 7.0) and incubated for 12 hours at 28°C in a shaking incubator (100 rpm) in the dark (
Hussain et al. 2018). Treated seeds were washed with 0.5% ethyl acetate diluted in 0.1 M phosphate buffer (pH 7.0) for 50 minutes, and finally, seeds were washed under running tap water for 3-4 hours to remove any residual EMS. Control seeds were treated with 0.1 M phosphate buffer (pH 7.0) and then processed like the EMS-treated seeds. Generally, more than 10,000 seeds per cultivar were mutagenized in five batches during the large-scale treatment.
Inoculation was carried out using a mixture of three isolates of
F. psuedograminearum, isolated from an FCR wheat plant in Hebei China, and cultured on a PDA media for 5 to 7 days. Mung bean liquor medium was used to produce the conidial inoculum at 28ºC for a week. Mung bean liquor was prepared by adding 40 g of mung beans in 1 L of distilled boiling water. The mung beans were steamed for 15 minutes and then the broth was filtered through double-layer cheesecloth and autoclaved at 121ºC for 15 minutes to kill any fungi or bacteria. To prepare the liquid mung bean medium 1 L of the broth was autoclaved in 300-ml flasks. The flasks were inoculated with the mycelium of
F. pseudograminearum and then incubated in a rotary shaker (SUKUN Rocking Incubator) (180 Revolutions per minute) at 28ºC for a week to allow the macroconidia to develop. The mixture of macroconidia, mycelium, and mung bean medium was filtered through a double layer of autoclaved cheesecloth. The macroconidia concentrations were directly quantified under an optical microscope using a haemocytometer and diluted to the desired concentration. Then the mutagenic seedlings were inoculated with 6 mL of
F. pseudograminearum (1 x10
6 spore/mL), and the control treatment was inoculated with distilled water. Inoculated seedlings were covered with plastic bags (sprayed with water inside) for 48 hours to facilitate high humidity for fungal infection and growth (
Fig. 1).
Five to seven days after inoculation Fusarium-infected mutant seedlings were identified by brown spots on coleoptiles or by mycelium completely covered seeds. The percentage of diseased seedlings for all EMS-induced mutants was calculated as the number of diseased mutants divided by the total number of mutants plated on the small pots×100% (
Table 1). Mutant lines that showed resistance (zero disease level) or with no symptom of FCR were transplanted into the field and greenhouse to generate M
1 plants. The M
1 generations were inoculated with
F. pseudograminearum and the level of resistance was screened up to M
3 by selecting mutant lines with no symptoms of FCR at all mutant stages. A diagram indicating the development of the mutant population from EMS-inducing to M
4 generations is shown in
Fig. 1.
Before employing the experiment, the optimal concentration was determined by taking a series of concentrations of EMS solutions (0.4%-1.0%) to find out the optimum germination rate for the tested varieties. It was found that the suitable dose of EMS that was needed to achieve at least 50% germination rate was varied for the different tested cultivars. To determine the optimum concentration (dose) of EMS, 2500 seeds in three rounds (> 7500 seeds per cultivar) were treated with different EMS and the response of the cultivars to the different concentrations of EMS was evaluated to find out the lethal dose and the germination percentage.
Greenhouse planting and inoculation
Greenhouse testing was conducted from M1 to M3 in fall 2019, fall 2020, and fall 2021. Ten plants per line with three replications were planted in seedling trays. The seedlings vernalized at 4°C for 40 days. After vernalization, seedlings were transplanted into pots 5×5 cm (MONROVIA.COM Plastics) then all the pots were moved into the greenhouse at a temperature of 23-25°C during the day and 16-18°C during the night. Grains colonized with F. pseudograminearum isolates were used to inoculate the mutants in the greenhouse. After full maturity, each plant was assessed for the disease level on the crown and main stem bases using a 0 to 4 scale as described under the field planting and inoculation below, and plants that showed no symptom (0 disease level) or resistance (R) were counted and selected for further screening.
Field planting and inoculation
The field experiment was conducted to generate M1 and M3 plants at the field experiment of Hebei Agricultural University, China, during the cropping seasons of 2020 and 2021. The experiment was arranged using a complete randomized design (CRD) with three replications. All the mutant seedlings were transplanted in a single row plot per line consisting of 1 m with a row-to-row distance of 0.3 m long and planted with a 3-4 cm depth. Sunco (partially resistant bread wheat) was used as a resistance control.
For the inoculation, grains colonized with
F. pseudograminearum isolate were used for the field inoculation. Before grain colonization was done, grains were soaked in tap water for 24 hours sterilized in bakers of 500 mL at 121℃ for 30 minutes, and then allowed to cool overnight. Afterward, seeds were inoculated with a one-week-old PDA-activated
F. pseudograminearum isolate that was previously confirmed by our lab as an aggressive strain and was incubated at 27℃ for 3 weeks. The mixtures were turned over 2-3 times during the culture process and then the colonized grains were used and spread manually in the rows prepared for each cultivar at a density of 40 g/m
2 (
Chhabra et al. 2021), during planting, and all the plots were covered with plastic sheets for 72 hours to maintain high humidity for optimum fungal growth. FCR resistance for mutant lines was determined by assessing each plant from each row at the adult stage using a 0-4 scale where 0 = no disease symptom and 4 = necrotic lesions on the fourth stem node, formation of whiteheads, or failure of heading. Mutants that show resistance or no sign (0-disease level) were counted and selected for further generation.
Inoculation and FHB resistance identification
Four spikes per line (M
3) were selected and inoculated with a previously prepared inoculum of
F. graminearum suspension at anthesis using a point inoculation method. Each of the selected spikes was inoculated with 10 µL liquid inoculum for one floret. After inoculation, the plants were labeled with plant tags and covered with plastic bags for 72 hours to provide high humidity for fungal infection and development. The evaluation of FHB infection was performed during the grain maturation phase using a five-point scale of disease severity for each spike per mutant line and the FHB disease index was determined according to
Chhabra et al. (2021), which provides a standardized measure of the disease index based on the severity of infection. Generally, this experiment allowed us to assess the susceptibility of different mutant lines to FHB infection and determine the extent of disease severity for each line.
Determination of deoxynivalenol contents in mutant lines inoculated with F. graminearum
DON measurement for each inoculated and selected mutant line was tested during M3 generation in 2021 using enzyme-linked immunosorbent assay (ELISA) kits at the laboratory of Hebei Agricultural University. Wheat matrix (seed, seed shell, and stem) from inoculated spikes of different plants of the same line were mixed and ground to a fine powder, and then divided into three replicates of 1 g each. Each subsample was extracted with 10 mL acetonitrile: water (84:16, v/v), in 50 mL of the centrifuge, and the DON content of each mutant line was determined using an ELISA kit for DON quantification in Fusarium head blight infected grains. The extraction and test procedures to determine DON contents are described in supplementary file 1.
Assessment of phenotypic traits
Agronomic and physiological traits were assessed at the seedling and adult stages. Each plant was evaluated for disease resistance, and only healthy seeds were planted to generate the next mutant generation (M0-M3) and carefully photographed. All M1 individual plants were harvested, crown rot investigation was conducted and those with zero (0 level of disease resistance scale or plants with no visible symptoms) were planted to develop M2 plants. Each M2 plant was harvested to develop the M3 generations and the M3 populations were replanted again to generate M4 plants. Phenotypic parameters of the mutant lines related to disease resistance were assessed and recorded from M3 mutagenized populations of the mutant variants.
• Percentage of whiteheads (percentage of WH): the development of whiteheads was assessed and counted visually for each line in each plot before physiological maturity.
• Thousand-kernel weight (g): two hundred cleaned grains from each pot were randomly sampled from each M2 plant, counted manually, and subsequently weighed using a digital balance. Five to record thousand-grain weights (TGW) in grams then multiplied the weight.
• Screenings: defined as the percentage of grains smaller than 2 mm, were assessed. From each cultivar, 400 g of seed was poured into a 2.0 mm seed sieve. The percentage of shriveled grains or screenings was assessed by shaking the sample 40 times over a 2.0 mm sieve with elongated slots (Agitator). All shriveled seeds were weighed and expressed as a percentage of the total.
Statistical analyses
For EMS mutants’ seedlings, the experimental unit corresponded to the 60-seed plate. For each cultivar, the means of inoculated plates across the experiment and the corresponding control plants were compared using Student’s t-test. For the subsequent analyses, the variables were expressed as percentages of the control values. The relationships between seedling variables and experiments were evaluated by the parametric Pearson correlation. The significance level of a variable to be added to the model was set at 0.15. All statistical analyses were performed using SPSS software version 17.
Results
Screening of suitable concentration of mutagenesis
The cultivar Jimai22 was found with a significant germination rate of 52% and 40% with a relative germination percentage of 53.61% and 41.23%, respectively (
Table 1,
Fig. 2a). The germination rate of the 0.6%EMS was highly significant compared with the CK (
Fig. 2a). The optimum dose of EMS for Henguan35 and Shixin828 was found to be 0.6% and 0.8% EMS with a germination rate of 46.6% and 49.75%, respectively (
Table 1,
Figs. 2b,
2c). Similarly, for “Kewei18” (0.4% and 0.6% EMS), 50% and 56% were found to be the optimum germination rates, with relative germination percentages of 53.76% and 60.22%, respectively, whereas the germination rate and relative germination rate for “Kewei20” (0.4% and 0.6% EMS) were found to be 46% and 39.6%, and 47.42% and 40.82%, respectively (
Table 1,
Figs. 2d,
2e). The 0.4% EMS and 0.6% EMS were highly significant (
p=0.05) with the CK. Likewise, the optimum dose of EMS to mutagenize seeds of the cultivar Gaoyou2018 was 0.80%, and the germination and relative germination rates were 50% and 51.54%, respectively (
Table 1).
The higher the EMS concentration, the stronger the inhibition of seed germination rate (
Table 1) or the lethality of the wheat seeds, according to the curve that predicts the optimum dose within a given concentration range. The response of the six cultivars to different concentrations of EMS has been evaluated to find out the lethal dose to the tested varieties and found that the reaction of the cultivars was different for different concentrations (dose) of EMS. The optimum concentration of EMS used to mutagenize the other seeds ranged from 0.4% to 1.0%, and the lethal rate was about 50%. Moreover, if the concentration is too high, the lethal rate would be too high, and the mutant would not germinate.
The mutagenized EMS-induced seedlings were inoculated with
F. pseudograminearum after the suitable optimum concentrations and germination rates were determined for each tested cultivar. EMS-induced seedlings without any symptoms were picked and transplanted in the greenhouse and field conditions to generate M
1 plants (
Fig. 3a). Susceptible mutants were covered with
F. pseudograminearum mycelium, as displayed in
Fig. 3b. The disease index and lesion length were measured using a centimeter for each of the bioassay-mutagenized seedlings and were determined and presented in
Table 2.
EMS-induced wheat cultivars were inoculated with
F. pseudograminearum and screened at M
1 generation based on the FCR disease scale measurements. Accordingly, mutant lines from the genetic background of Kewei18 (0.6% EMS), Hengguan35 (0.4% EMS), and “Shixin828” (0.8% EMS) showed better resistance to FCR with a mean disease score of 3.13, 2.47 and 1.23, respectively (
Table 2). In contrast, EMS-induced mutagenized seedlings of GaoYou2018 (0.8% EMS) and Hengguan35 (0.6% EMS) were more susceptible to FCR than Jimai22 mutants. In general, a total of 328 individual plants (excluding ck) were obtained in M
1 with different concentrations of EMS. The CK plants used in each treatment are not treated with EMS but inoculated with the pathogen. The disease resistance for the seedlings treated with different concentrations of EMS and inoculated with
F. pseudograminearum was summarized in
Table 2. The resistant EMS-induced mutants were selected and saved for further transplanting to generate the next mutant generation.
The length of the lesion is an important feature that is used to measure how far the pathogen infection spreads after inoculation. Kewei18 (0.4% EMS) and Kewei20 (0.4% EMS) exhibited decreased disease infection or lesion length based on measurements of the mean lesion length of EMS-induced mutant seedlings (
Table 3).
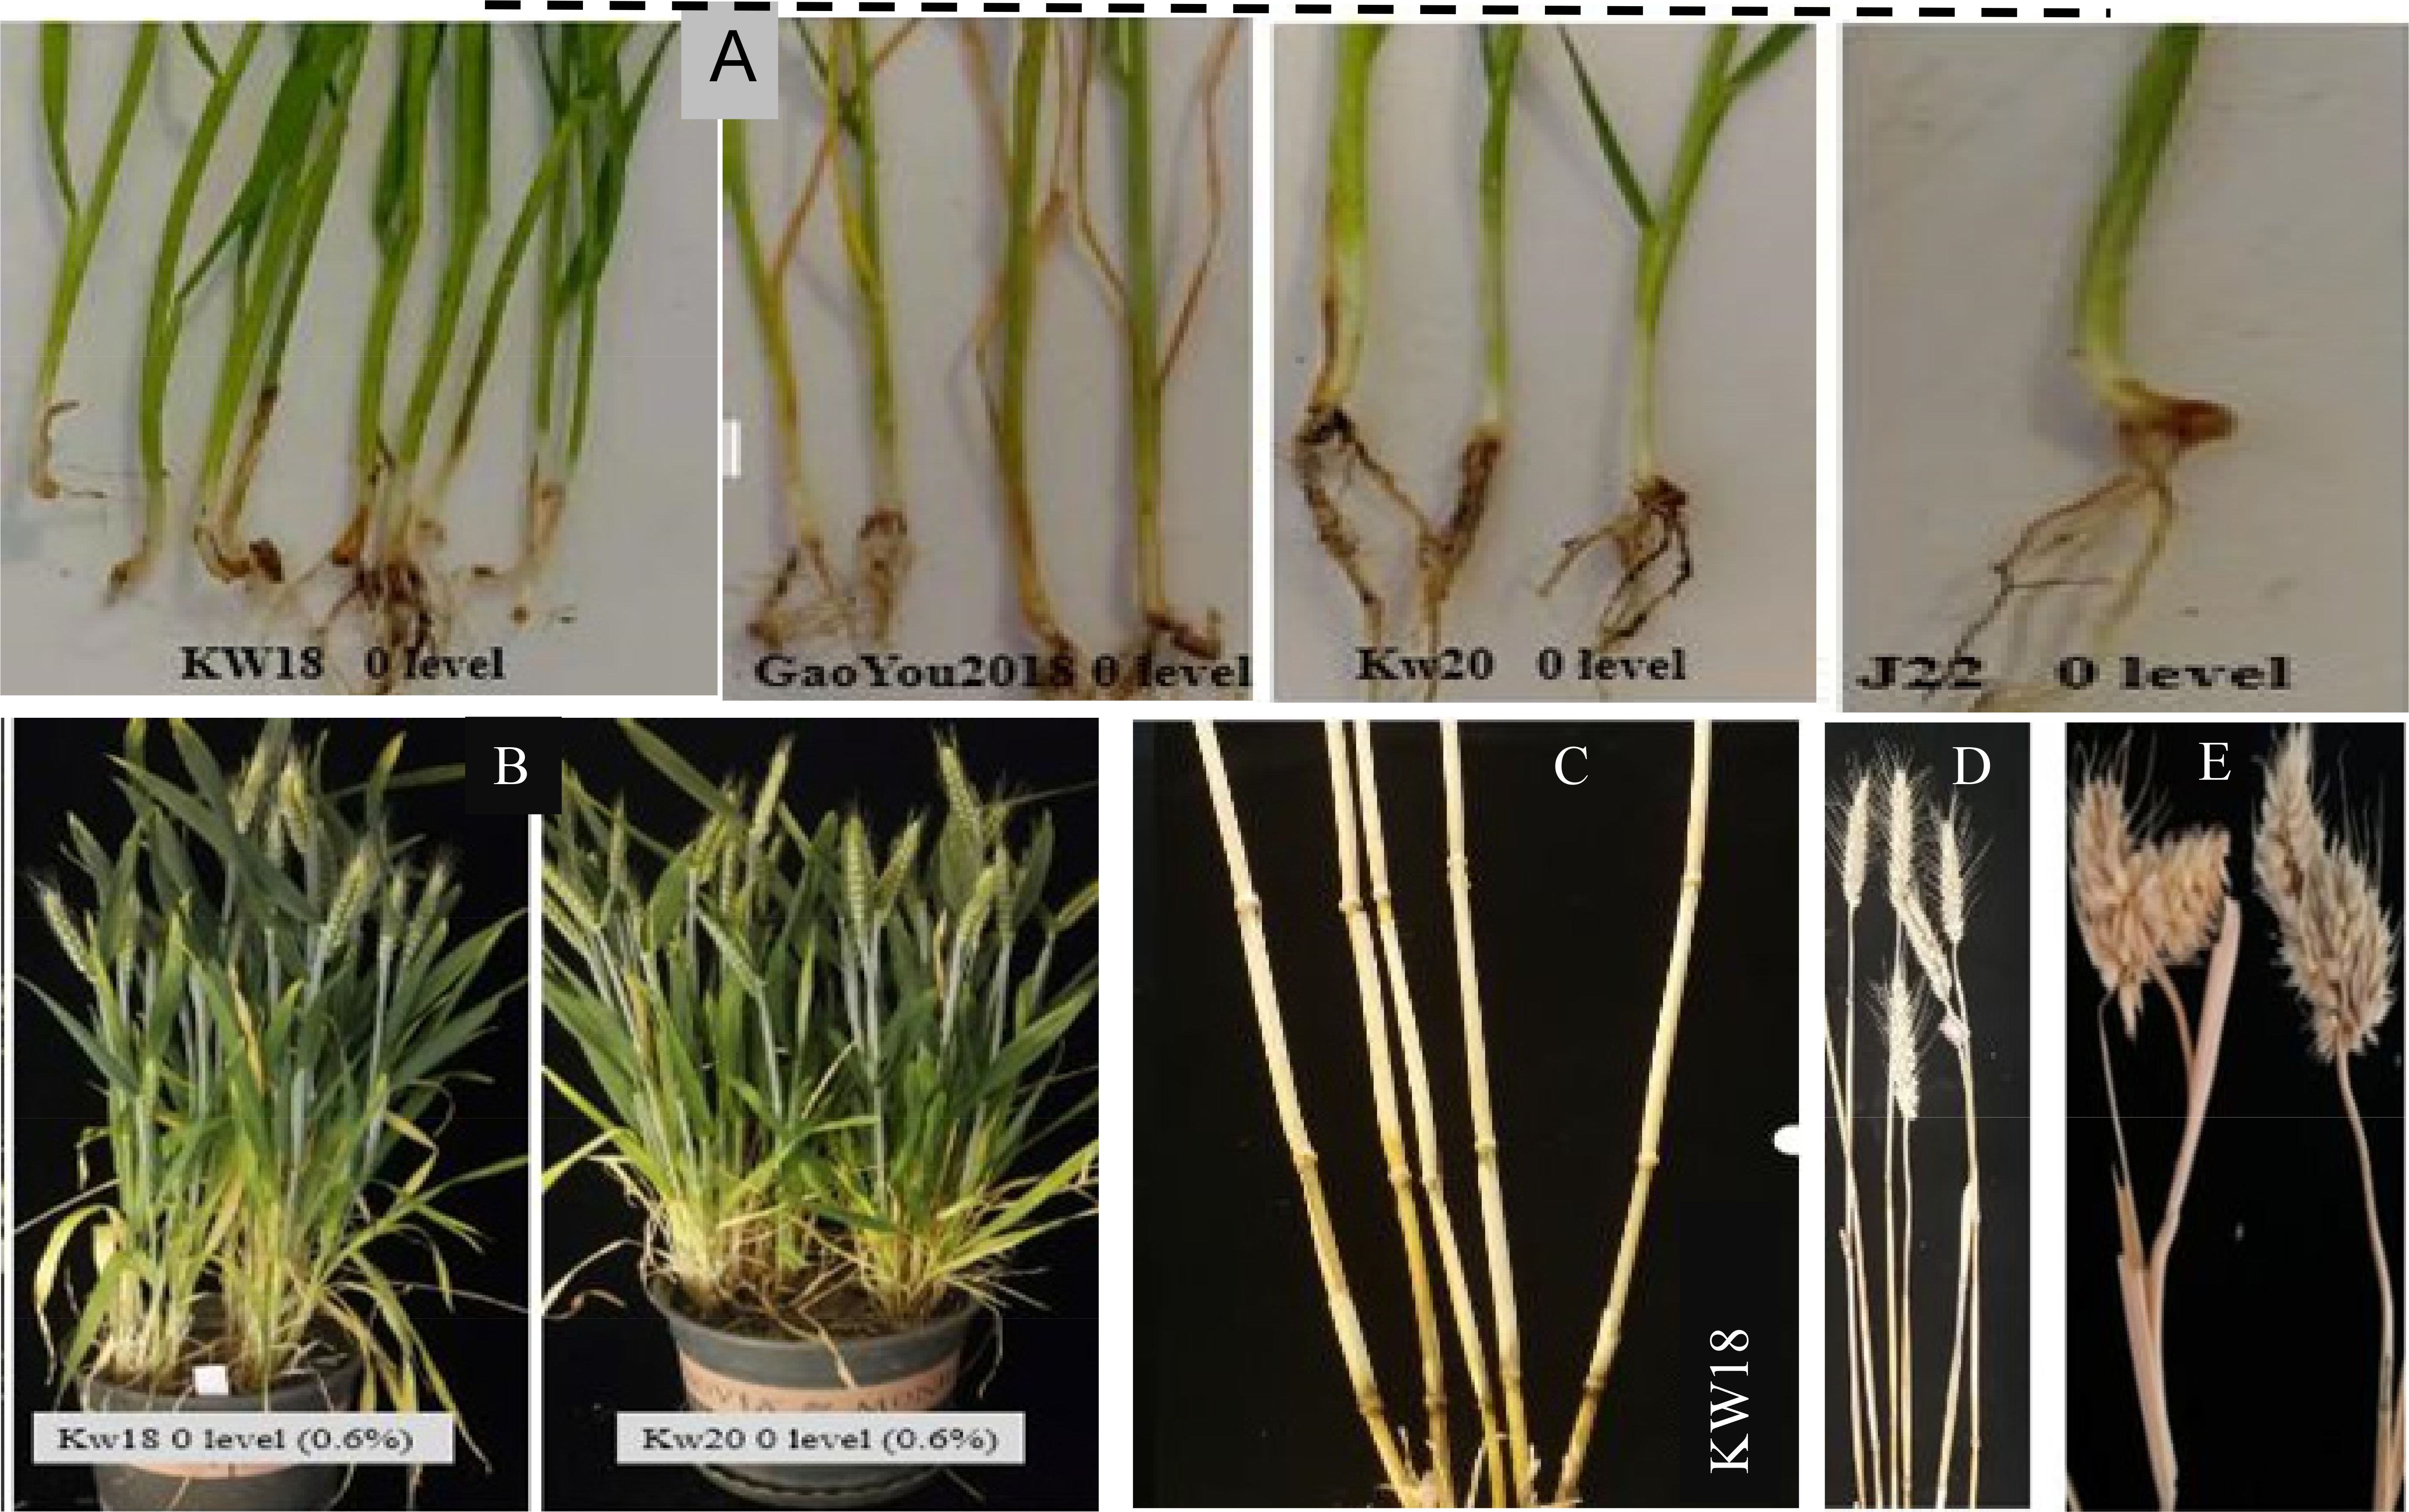
In comparison to the resistance mutant lines, the stems of the susceptible mutant lines were totally or partially covered in fungal mycelia (
Fig. 4). The differences in visible discoloration between cultivars varied from 4.17 to 26.33. The measurement of stem base browning is commonly employed as a proxy for determining FCR resistance in wheat cultivars (
Fig. 5). Seedlings that did not exhibit stem browning symptoms (
Fig. 4a) were chosen, whereas those that did not (
Figs. 4a-
4e) were covered with fungal mycelium and discarded.
A total of 10 plants for each distinct phenotype were prepared in bulk as source material for DNA collection. Differences between the two parents were also compared to obtain multiple SNP-index levels. The total SNP-index level was calculated by subtracting the SNP-index values. Raw NGS data were processed using Python (
Sugihara et al. 2022). The threshold limit was set to 99% confidence for the selection of candidate regions and SNPs. The candidate region (qHL6) showing an SNP-index score of over 0.5 was identified to be between 24.8 Mb and 29.8 Mb in chromosome 6 (
Fig. 2a).
In the greenhouse, 159 unique resistant plants were grown in M
2 at various EMS concentrations. 23 (14.47%) were obtained from the genetic background of Jimai22 and Shixian828 treated with 0.6% EMS (
Table 4). In general, the field experiment yielded a greater number of mutant-resistant plants than the greenhouse trial. Forty-five seeds of each line (15 seeds/pot) were taken from healthy plants of each cultivar for nest planting.
The M
3 mutant population's disease resistance selection and phenotypic traits were observed. In M
3, 570 individual healthy plants were obtained using various EMS concentrations. 65 GaoYou2018 plants (0.8%), 85 Hengguan35 plants (0.6%), 67 Jimai 22 plants (0.4%), 98 Kewei18 plants (0.4%), 102 Kewei20 plants (0.6%), 41 Kewei20 plants (0.4%), 76 Kewei18 plants (0.6%), and 36 Shixin 828 plants (0.6%) are among them (
Table 5). Plant heights varied between mutants, ranging from 45 to 68 cm. The number of kernels per plant is an essential yield characteristic, and the number of kernels per plant varied amongst the mutant plants. The largest number of kernels (35.20) was obtained from Kewei18 (0.6%), while the lowest number (19) was obtained from Hengguan35 (0.6%) (
Table 5). When tested under greenhouse circumstances, the M
3 mutant generations GaoYou2018 (0.80%), Jimai22 (0.4%), Kewei20 (0.4%), and Shixin828 (0.6%) demonstrated the highest FCR infection. Other mutants examined in this study, Kewei18 (0.4%) and Kewei18 (0.6%), exhibited better resistance to FCR (
Fig. 5).
The degree of disease resistance is affected by variations in mutant lines' growth performance, germination rate, heading time, and percentage of white head.
Table 5 analyses and presents the correlation relationship between FCR disease measurement and other agronomic characteristics that determine FCR resistance.
Fig. 6 shows some mutant lines with improved resistance and one susceptible mutant line (Gaoyou2018) at the seeding stage of the M
3 generation.
Table 6 shows the relationships between disease resistance, plant height, screen (%), number of kernels per plant per spike, 1000 kernel weight, and percent white heads. FCR disease assessment and percentage of white head (WH) had a highly significant (
p=0.05) positive link, according to correlation analysis. FCR disease measurements and thousand-kernel weights were also found to have significant positive associations (TKW). In a related manner, correlation analysis demonstrated a favorable association (
p=0.05) between FCR disease assessment, plant height, and TKW (
Table 6). The mutant lines with the genetic backgrounds of Gaoyou2018 and Hengguan35 were mostly susceptible, while the mutant lines with both the genetic backgrounds of Keiwei18 and Kewei20 were more FCR resistant than the rest of the EMS-generated lines (
Fig. 5).
Fig. 7 illustrates the adult plant and seeds of the resistant mutant alongside the wild type of Kewei 18.
Phenotypic description of M3 generations based on disease resistance
Disease resistance, growth performance, spike morphology, and heading time are all phenotypic changes in mutant populations. Some mutants had irregular spike morphology (
Fig. 8e) while others were dwarfed or shorter than the wild plant (
Figs. 7,
8).
Table 7 indicates the frequency of disease reaction for the M
3 mutations studied, as well as the frequency of other associated phenotypic characteristics. The M
3 mutants' disease measurement was evaluated at seedling and adult stages (
Fig. 5). At each disease resistance screening stage, mutant lines with no FCR symptoms were chosen for the following generation.
Table 7 shows the frequency of the mutant lines' phenotypic descriptors.
Some members of the M
2 mutant population exhibited mutant traits. The number of tillers, disease sensitivity, leaf structure, leaf pigmentation, spike form, seed morphology, and developmental variables including maturity time were all phenotypically altered (
Table 7,
Fig. 8).
All mutant plants were examined individually at harvest, and the number of mutants exhibiting FCR resistance were screened and classified as resistant or susceptible, as shown in
Tables 5-
8. Mutant plants that met the resistance criteria were threshed and saved for future use. In comparison to the other M
3 mutant lines, GaoYou2018 (0.80%), Hengguan35 (0.6%), Jimai22 (0.4%), and Kewei18 (0.4%) demonstrated higher (> 70.25%) healthy or resistant plants to FCR according to the evaluation criteria and FCR disease measurement scales (
Table 7). The mutant lines from the genetic background of Kewei18 (0.4%) demonstrated the highest percentage of resistant plants.
Fig. 8 shows some of the mutant lines that were selected for further testing at the seedling and adult stages. Phenotypic changes such as spike shape and size were also seen in several mutants (
Fig. 8).
To select mutant lines with FHB and DON resistance, extensive screening of the M
3-resistant generation of the EMS-generated mutagenized cultivars was done.
Fig. 10 shows the FHB resistance and DON accumulation of the mutant lines. As a resistant control, Sumai-3 was inoculated with FHB pathogen but not treated with EMS. FHB and DON resistance were improved in mutant lines with the genetic background of Kewei18. Mutant lines from Jimai22's genetic background, on the other hand, were found to be susceptible to FHB and DON contamination (
Fig. 10). Among the screened mutant lines, Kewei18 was shown to be the most resistant to FCR, FHB, and DON infection and Kewei20 (0.6%) had higher FHB than the others (
Fig. 9). The combined evaluation of FHB and DON Contamination is highly significant since evaluating resistance just based on visual symptoms may not be a realistic measurement (
Fig. 9).
There were 120 Kewei18 (0.4%), 76 Kewei 18 (0.6%), 52 Hengguan35 (0.6%), and 25 Gaoyou2018 mutant (M3) plants that demonstrated resistance or moderate resistance to FHB. These mutant lines could be used in breeding situations in the future. The results provided not only essential genetic resources for wheat FHB resistance gene cloning and functional genomic research, but also novel germplasms for wheat breeding.
Discussion
Effect of EMS concentration on germination rate of wheat cultivars
The objective of the study was to find the best EMS concentration and generate EMS mutagenized mutant lines that were resistant to wheat crown rot and FHB diseases. The optimum EMS concentrations that could offer the tested cultivars the best germination rates were calculated, and it was discovered that the appropriate dose of EMS required to achieve at least a 50% germination rate differed for each cultivar.
To identify the optimum EMS concentration (does), 2500 seeds were treated with different EMS in three rounds (> 7500 seeds per cultivar), and the response of the cultivars to the different EMS concentrations was examined to determine the lethal dosage and germination percentage. With a relative germination percentage of 53.61% and 41.23%, respectively, the cultivar Jimai22 was determined to have a substantial germination rate of 52% and 40% (
Table 1). Similarly, the optimum dose of EMS to mutagenize seeds of the cultivar Gaoyou2018 was 0.80%, with 50% germination and 51.54% relative germination rates, respectively (
Table 1). The ideal EMS concentration utilized to mutagenize the other seeds ranged from 0.4% to 8.0%.
We confirmed that the higher the EMS concentration, the stronger the inhibition of the germination rate. Because it has the advantages of higher point mutation, fewer chromosomal abnormalities, and quicker mutant screening over other approaches, ethyl methane sulfonate (EMS) has been widely utilized to generate mutants with various agronomic features in crops in recent years (
Amberg et al. 2006;
Zhang et al. 2008). EMS can also be used to improve specific agronomic features, breed novel varieties, screen resistant varieties, and screen elite germplasm (
Jankowicz-Cieslak et al. 2016). EMS-induced mutant germplasms can be utilized to discover new genes, advance functional genomics research, and speed up breeding programs (
Qian 2017).
Hailegiorgis et al. (2018) mutagenized durum wheat with a 0.7% EMS dose and the optimal germination rate was discovered to be 50%-60%, which was chosen to generate other generations. EMS-induced mutations provide a viable approach for developing a novel resistant cultivar by generating a new source of disease resistance (
Penna et al. 2015). Chemical mutagens cause a lot of point mutations and have a lot of mutations. has characterized various plant chemical mutagens and their sites of action. Alkylating compounds, such as EMS, add an ethyl group to guanine or thymine, causing the DNA replication machinery to recognize the changed base as an adenine or cytosine, respectively. Chemical mutagenesis causes a high rate of nucleotide changes, with 70% to 99% in EMS-mutated cells.
EMS-induced wheat cultivars were inoculated with
F. pseudograminearum and screened at M
1 generation based on the FCR disease scale measurements. Accordingly, mutant lines from the genetic background of Kewei18 (0.6% EMS), Hengguan35 (0.4% EMS), and Shixin828 (0.8% EMS) showed better resistance to FCR with a mean disease score of 3.13, 2.47 and 1.23, respectively (
Table 2). The length of the lesion is an important feature that is used to measure how far the pathogen infection spreads after inoculation. Kewei18 (0.4% EMS) and Kewei20 (0.4% EMS) exhibited decreased disease infection or lesion length based on measurements of the mean lesion length of Ems-induced mutant seedlings (
Table 3). Susceptible seedling lines were shorter than resistant seedling lines and coated in fungal mycelia. Those with evident FCR symptoms were eliminated, while those without symptoms or healthy seedlings were placed into the greenhouse to produce the next generation (M
1-M
3). For Kewei20 (0.6%), Kewei18 (0.4%), Hengguan35 (0.6%), and Kewei18 (0.6%), the number of individual mutant (M
2) plants that demonstrated resistance to FCR were 102, 98, 86, 85, and 76, respectively. When evaluated under greenhouse circumstances, the Gaoyou2018 (0.80%), Jimai 22 (0.4%), Kewei20 (0.4%), and Shixin 828 (0.6%) mutant generations had the greatest FCR index. Other mutants tested in the greenhouse, Kewei18 (0.4%) and Kewei18 (0.6%), exhibited improved resistance to FCR.
In general, mutant lines with the genetic backgrounds Gaoyou2018 and Hengguang35 were susceptible, but mutant lines with the genetic backgrounds Keiwei18 and Keiwei20 were more FCR resistant. We hypothesized that these mutant lines may be utilized to produce more resistance strains. EMS is a competent tool for improving specific agronomic traits, screening elite germplasms, and breeding noble varieties (
Jankowicz-Cieslak et al. 2016). Mutant lines induced by EMS could be used to promote functional genomic studies, mine noble genes, and speed up breeding programs (
Qian 2017). Many wheat varieties developed so far using chemical mutagens for different purposes. Examples of mutagenized populations of wheat variety QA200 and Ventura (
Dong et al. 2009), Candenza (
Rizwan et al. 2015), “Jinmai47” (
Chen et al. 2012), Indian (
Dhaliwal et al. 2015), and Jagger (
Rawat et al. 2016). EMS is the most extensively employed chemical mutagen in forwarding genetics for the identification of mutants with phenotypic interest (
Peters et al. 2003) because it has fewer chromosomal abnormalities, higher point mutation, and easier mutant screening than other approaches (
Amberg et al. 2006;
Zhang et al. 2008). Disease resistance (
(IAEA) 2015), herbicide resistance, and morphological variants (
Dhaliwal et al. 2015) have all been developed in wheat via EMS mutagenesis. EMS-induced mutant lines could be exploited to create desirable noble genes and accelerate breeding processes (
Qian 2017). When mutants are compared to their wild parents, this can help to boost disease resistance and genetic variety.
The relationship between FCR disease resistance measurement and other agronomic traits that affect FCR resistance, such as white head, thousand-kernel weight, plant height, and percentage of screening, was investigated, and the disease index and percentage of the white head had a highly significant (
p=0.05) positive correlation. There was also a significant link between plant height and thousand kernel weight (
p=0.05). In their two-year study, (
Rahman et al. 2021) discovered a reasonably substantial positive connection between whitehead incidence and screens. The formation of whiteheads has an impact on grain size, resulting in a decrease in yield. In wheat breeding, the presence of whiteheads can be utilized as an indication of crown rot (
Klein et al. 1991). Screening for FCR resistance based on stem browning is a reliable way of measurement, although it is costly and time-consuming. The evaluation of mutant lines from seedling to M
3 population, for example, necessitated the evaluation of almost 5000 tillers. Because of environmental changes, the degree of stem browning may fluctuate from season to season (
Rahman et al. 2021). As a result, having a set of closely related molecular markers on hand might aid in the selection of FCR-resistant genes.
To select mutant lines with FHB and DON resistance, extensive screening of the M
3-resistant generation of the EMS-generated mutagenized cultivars was done.
Fig. 10 shows the FHB resistance and DON accumulation of the mutant lines. As a resistant control, Sumai-3 was infected with the FHB pathogen but not treated with EMS. FHB and DON resistance were improved in mutant lines with the genetic background of Kewei18. Mutant lines from Jimai22's genetic background, on the other hand, were found to be susceptible to FHB and DON contamination (
Fig. 10). We tested the mutant M
3 generations' resistance to FHB and DON contamination by inoculating them with
F. graminearum. As a result, mutant lines from the Kewei18 genetic background demonstrated greater resistance to FHB and DON. However, mutant lines derived from Jimai22's genetic background have been proven to be vulnerable to FHB (
Fig. 9). Among the screened M
3 mutant lines, mutant lines of Kewei18 were found to be the most resistant to FCR, FHB, and DON infection, and we hypothesize that this mutant could be a valuable resource for further resistance selection and mapping. It's possible that evaluating resistance solely based on visual symptoms isn't realistic. As a result, a combined evaluation of FHB severity, FDK infection, and DON infection is critical in resistant cultivar selection and distribution to farmers. When compared to the other examined lines, mutant lines from the “Kewei18” and “Kewei20” backgrounds demonstrated higher resistance to FHB and DON contamination.
Chhabra et al. (2021) identified eight EMS-mutated wheat genotypes that were resistant to FHB. Furthermore, these resistant genotypes had a reduced area under the illness progression curve than the Jagger WT. This is consistent with the current investigation, which found that the EMS-induced “Kewei18” had less severe FHB than the resistant control “Sumai3.” Using an enzyme-linked immunosorbent test, the mutant lines Hengguan35 and Jimai22 treated with a 0.6% dosage of EMS were found to have the lowest (0.04-ppm) and highest (23.15 ppm) DON content, respectively. DON contamination resistance was stronger in mutant lines produced from the Kewei18 genetic background. In EMS-induced wheat genotypes, there was a considerable variance in DON content. Only seven genotypes were discovered with statically lower DON levels than the resistant control Jagger WT, indicating a considerable variance in DON content in EMS-induced wheat genotypes (
Chhabra et al. 2021). DON content and FHB disease severity are known to have separate genetic controls, and resistance may not be dependent on one another. DON content and FHB disease severity are known to have separate genetic controls, and resistance may not be dependent on one another. A prior study (
Bai et al. 2004) found a negative link between FHB disease resistance and DON grain pollution, whereas others (
Mesterházy et al. 1999) did not.
Somers et al. (2003) claimed that DON accumulation and FHB resistance may be controlled by separate genetic mechanisms, however other studies revealed that type II resistance is more closely linked to low DON levels (
Lemmens et al. 2005). The DON content in harvested grains is measured using an enzyme-linked immunosorbent test (ELISA) (
Qiu et al. 2005). Type II resistance is often assessed in field and greenhouse trials using single floret (spikelet) inoculation, which injects inoculum into a central spikelet of a spike (point inoculation) and is expressed as the spread of infection inside the spike. Type III resistance is often used to characterize resistance to mycotoxin buildup, and it is significantly associated with type I and type II resistance (
Rudd et al. 2001). The link between FHB incidence, FHB severity, FDK, and DON content found a weak correlation between FHB severity and DON content in a meta-analysis of 163 field studies (
Paul et al. 2005). The examination of DON contamination and FDK is indicated for breeding purposes rather than the severity of FHB (
Mesterhazy 2020).
Different cultivars required varying EMS concentrations for optimal mutagenesis, with most responding well to 0.4-0.6%. Mutant lines derived from the Kewei18 genetic background exhibited significant resistance to FCR, FHB, and DON contamination compared to wild-type plants. These resistant mutants hold promise for future breeding programs.
Our study generated valuable genetic resources for wheat FCR and FHB research, including FCR-resistant mutants for further resistance breeding and genetic analysis to identify resistance QTLs. Furthermore, the identified resistant mutants and wheat varieties offer new germplasm for breeding programs aimed at enhancing disease resistance and identifying QTLs associated with resistance genes. Overall, this research not only provides essential genetic materials for wheat FCR and FHB gene cloning and functional genomics studies but also contributes to the development of new wheat germplasm with improved disease resistance. Further studies are undertaken to identify the QTLs associated with the resistance genes.
Acknowledgments
The authors are grateful for the full funding of this research by the Key Research and Development Program of Province 2017204115, the National Key Research and Development Program of China 2017YFD01201707, and the Hebei Province Industrial System Wheat Innovation Team HBCT2018010204. Additionally, we are grateful to all lab mates for their support during the sample collection of the wheat crown rot during the greenhouse and field disease evaluation works.
Fig. 1Development of mutant population from seedling assay (M0) to M3 generations. EMS-mutagenized lines were inoculated with F. psuedograminearum at each generation (M0 to M3). The red dot represents pathogen inoculation; Fp=F. psuedograminearum; M1-M3 represents mutant generations of 1-3.
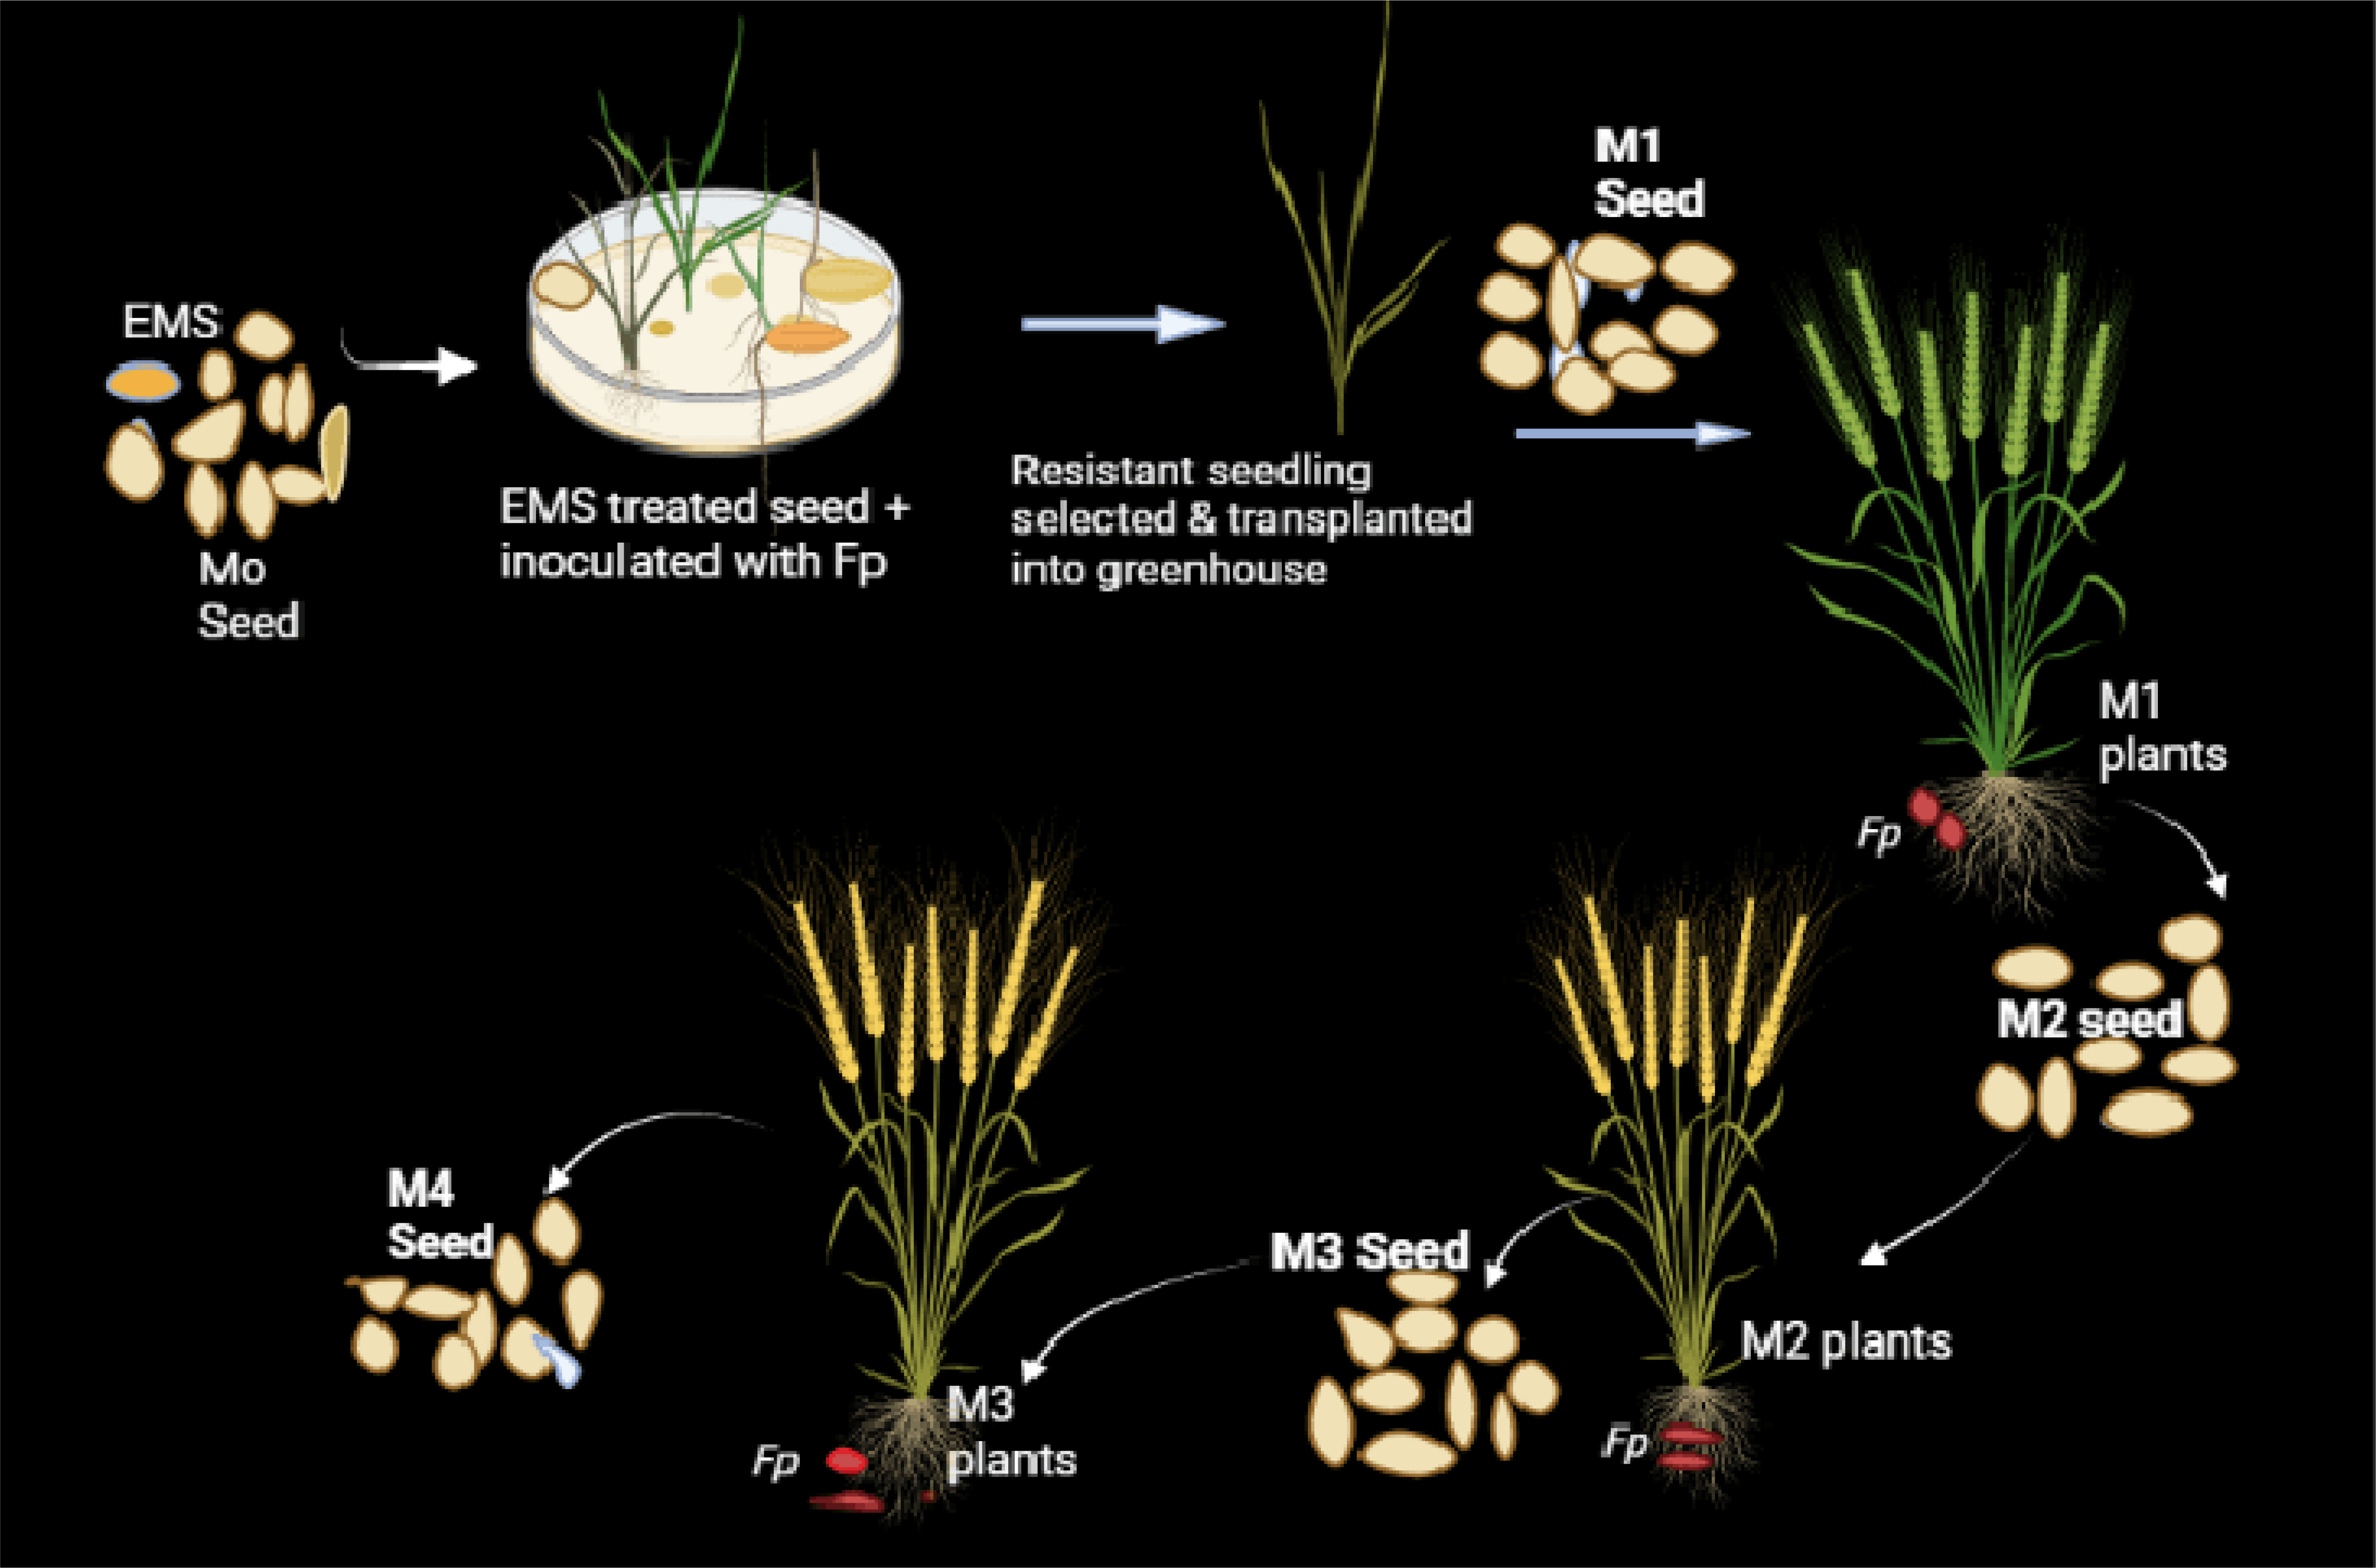
Fig. 2The seedling germination rate of different cultivars that were inoculated with with F. pseudograminearum and induced by varying concentrations of EMS. The cultivars are Jimai22 (A), Hengguan35 (B), Shixin828 (C), Sunco (D), Kewei18 (E) and Kewei20 (F). The error bar represents the standard deviation of three replicates.
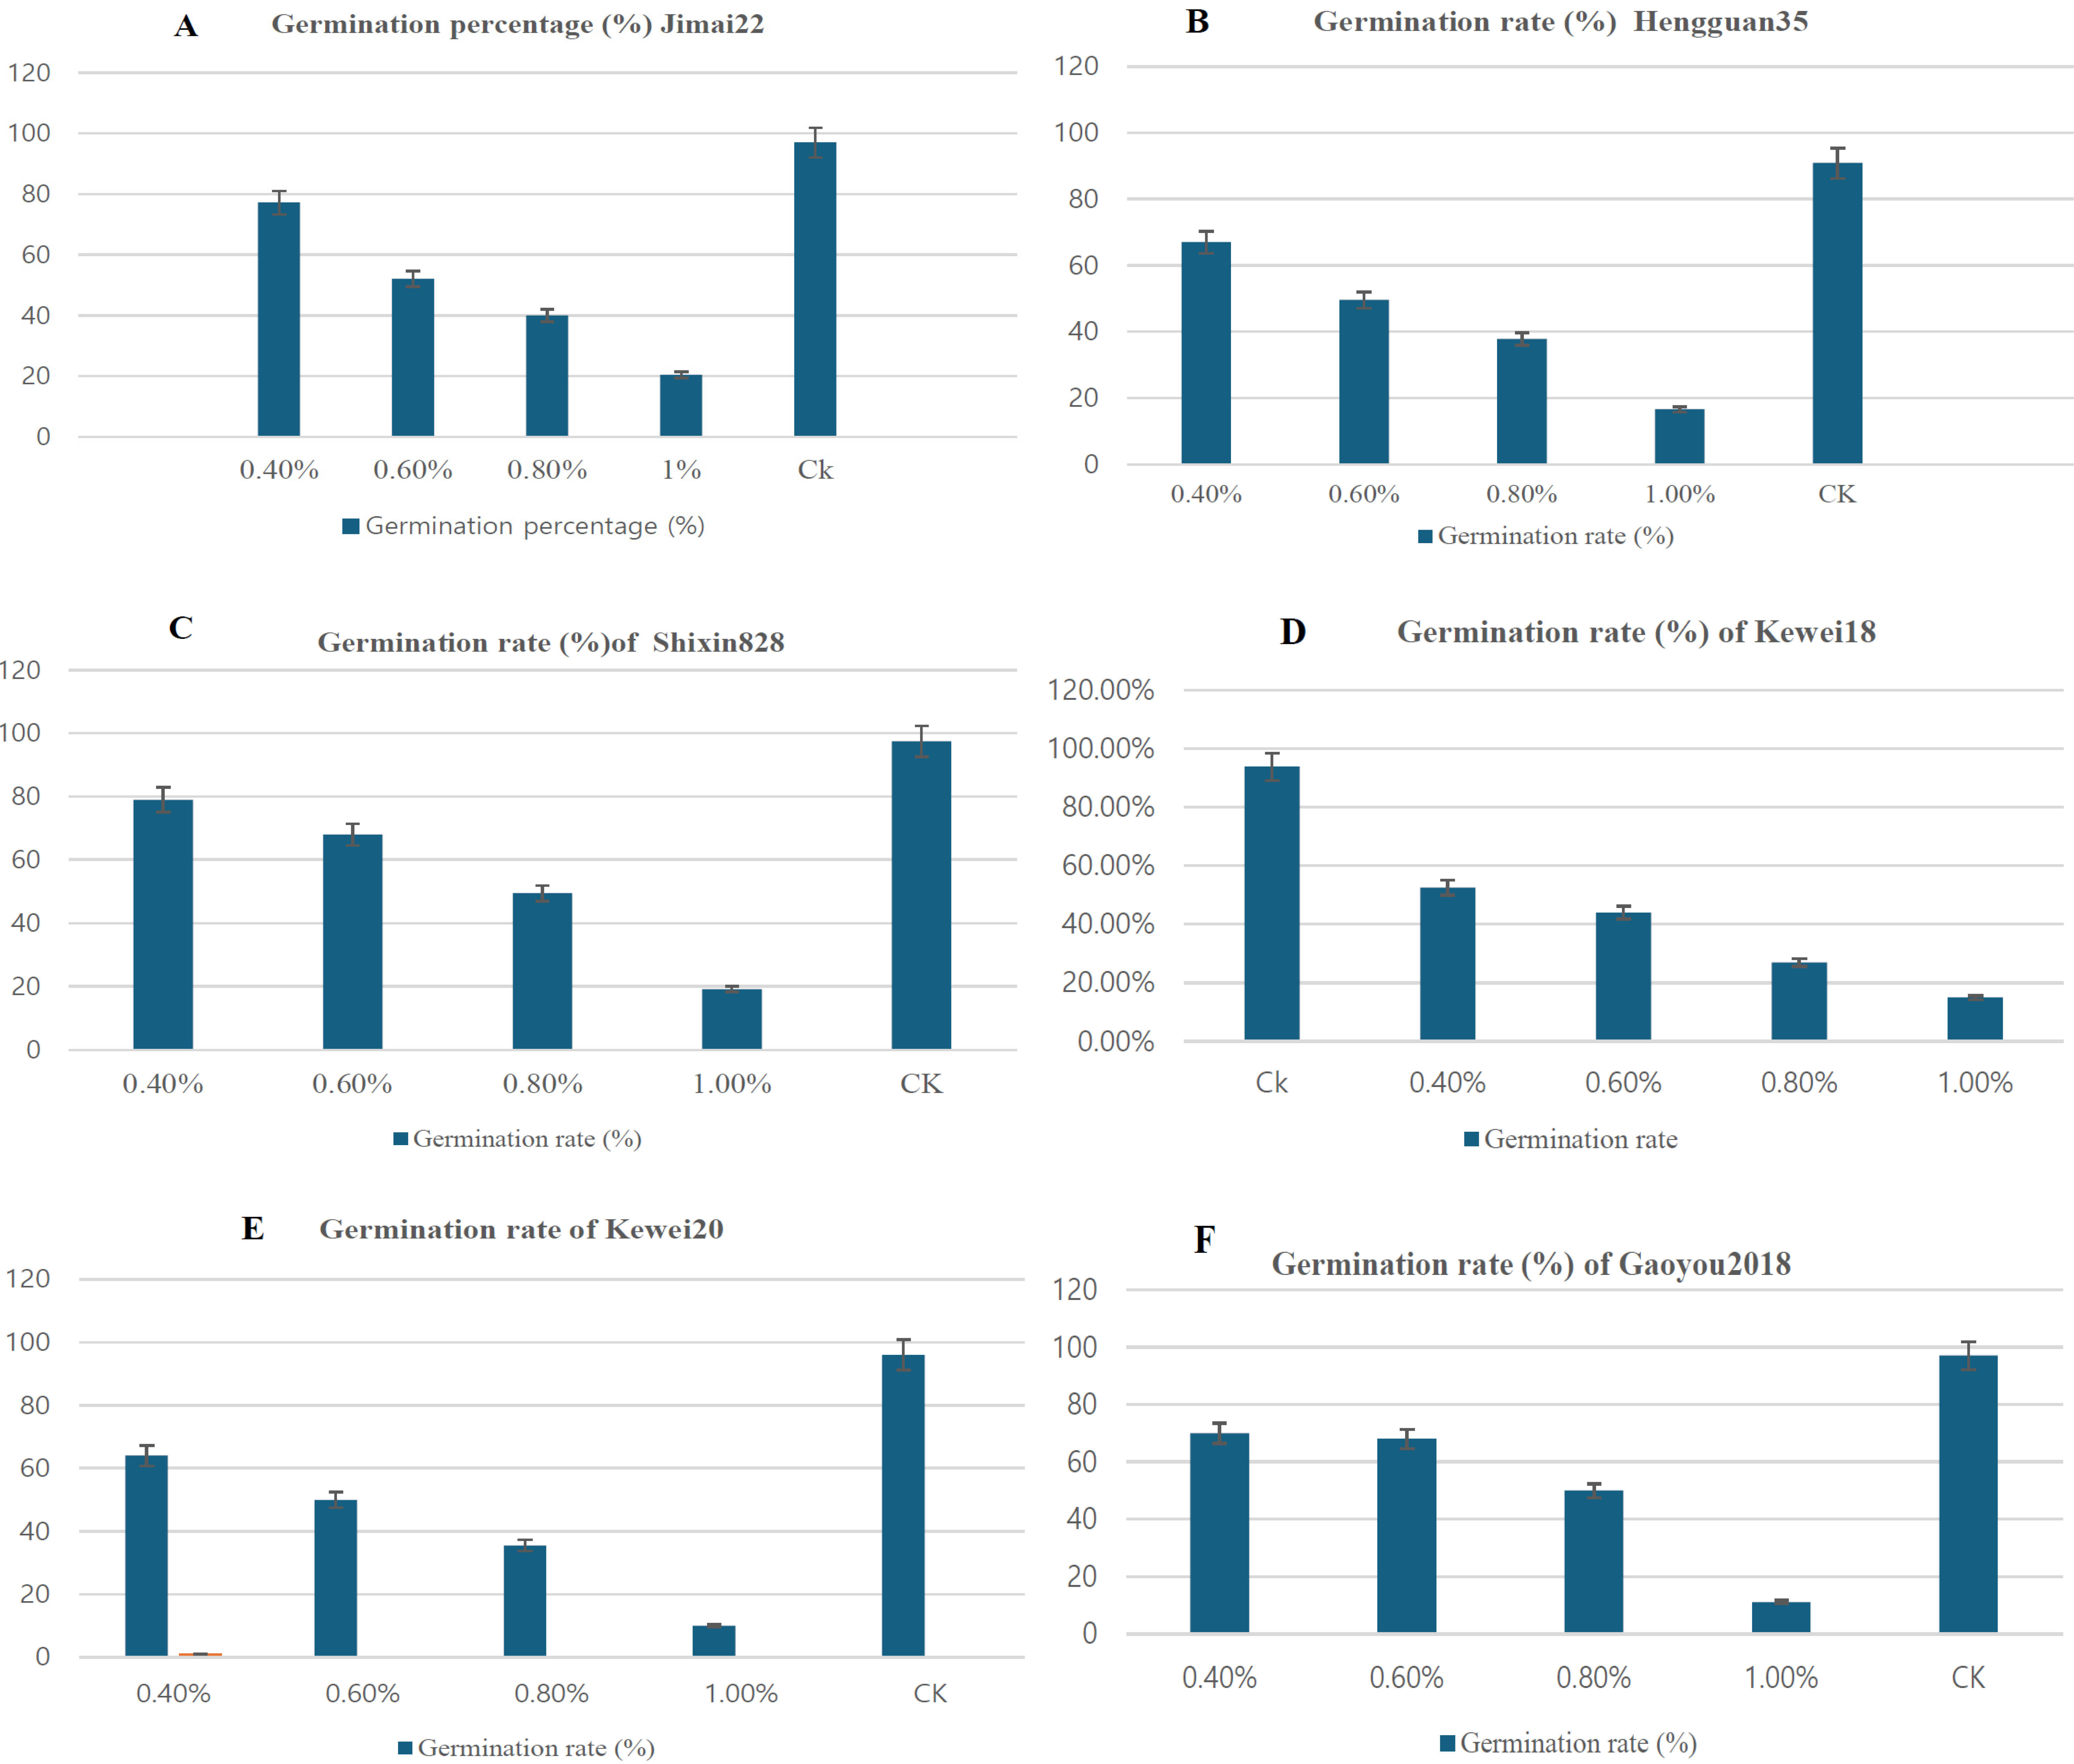
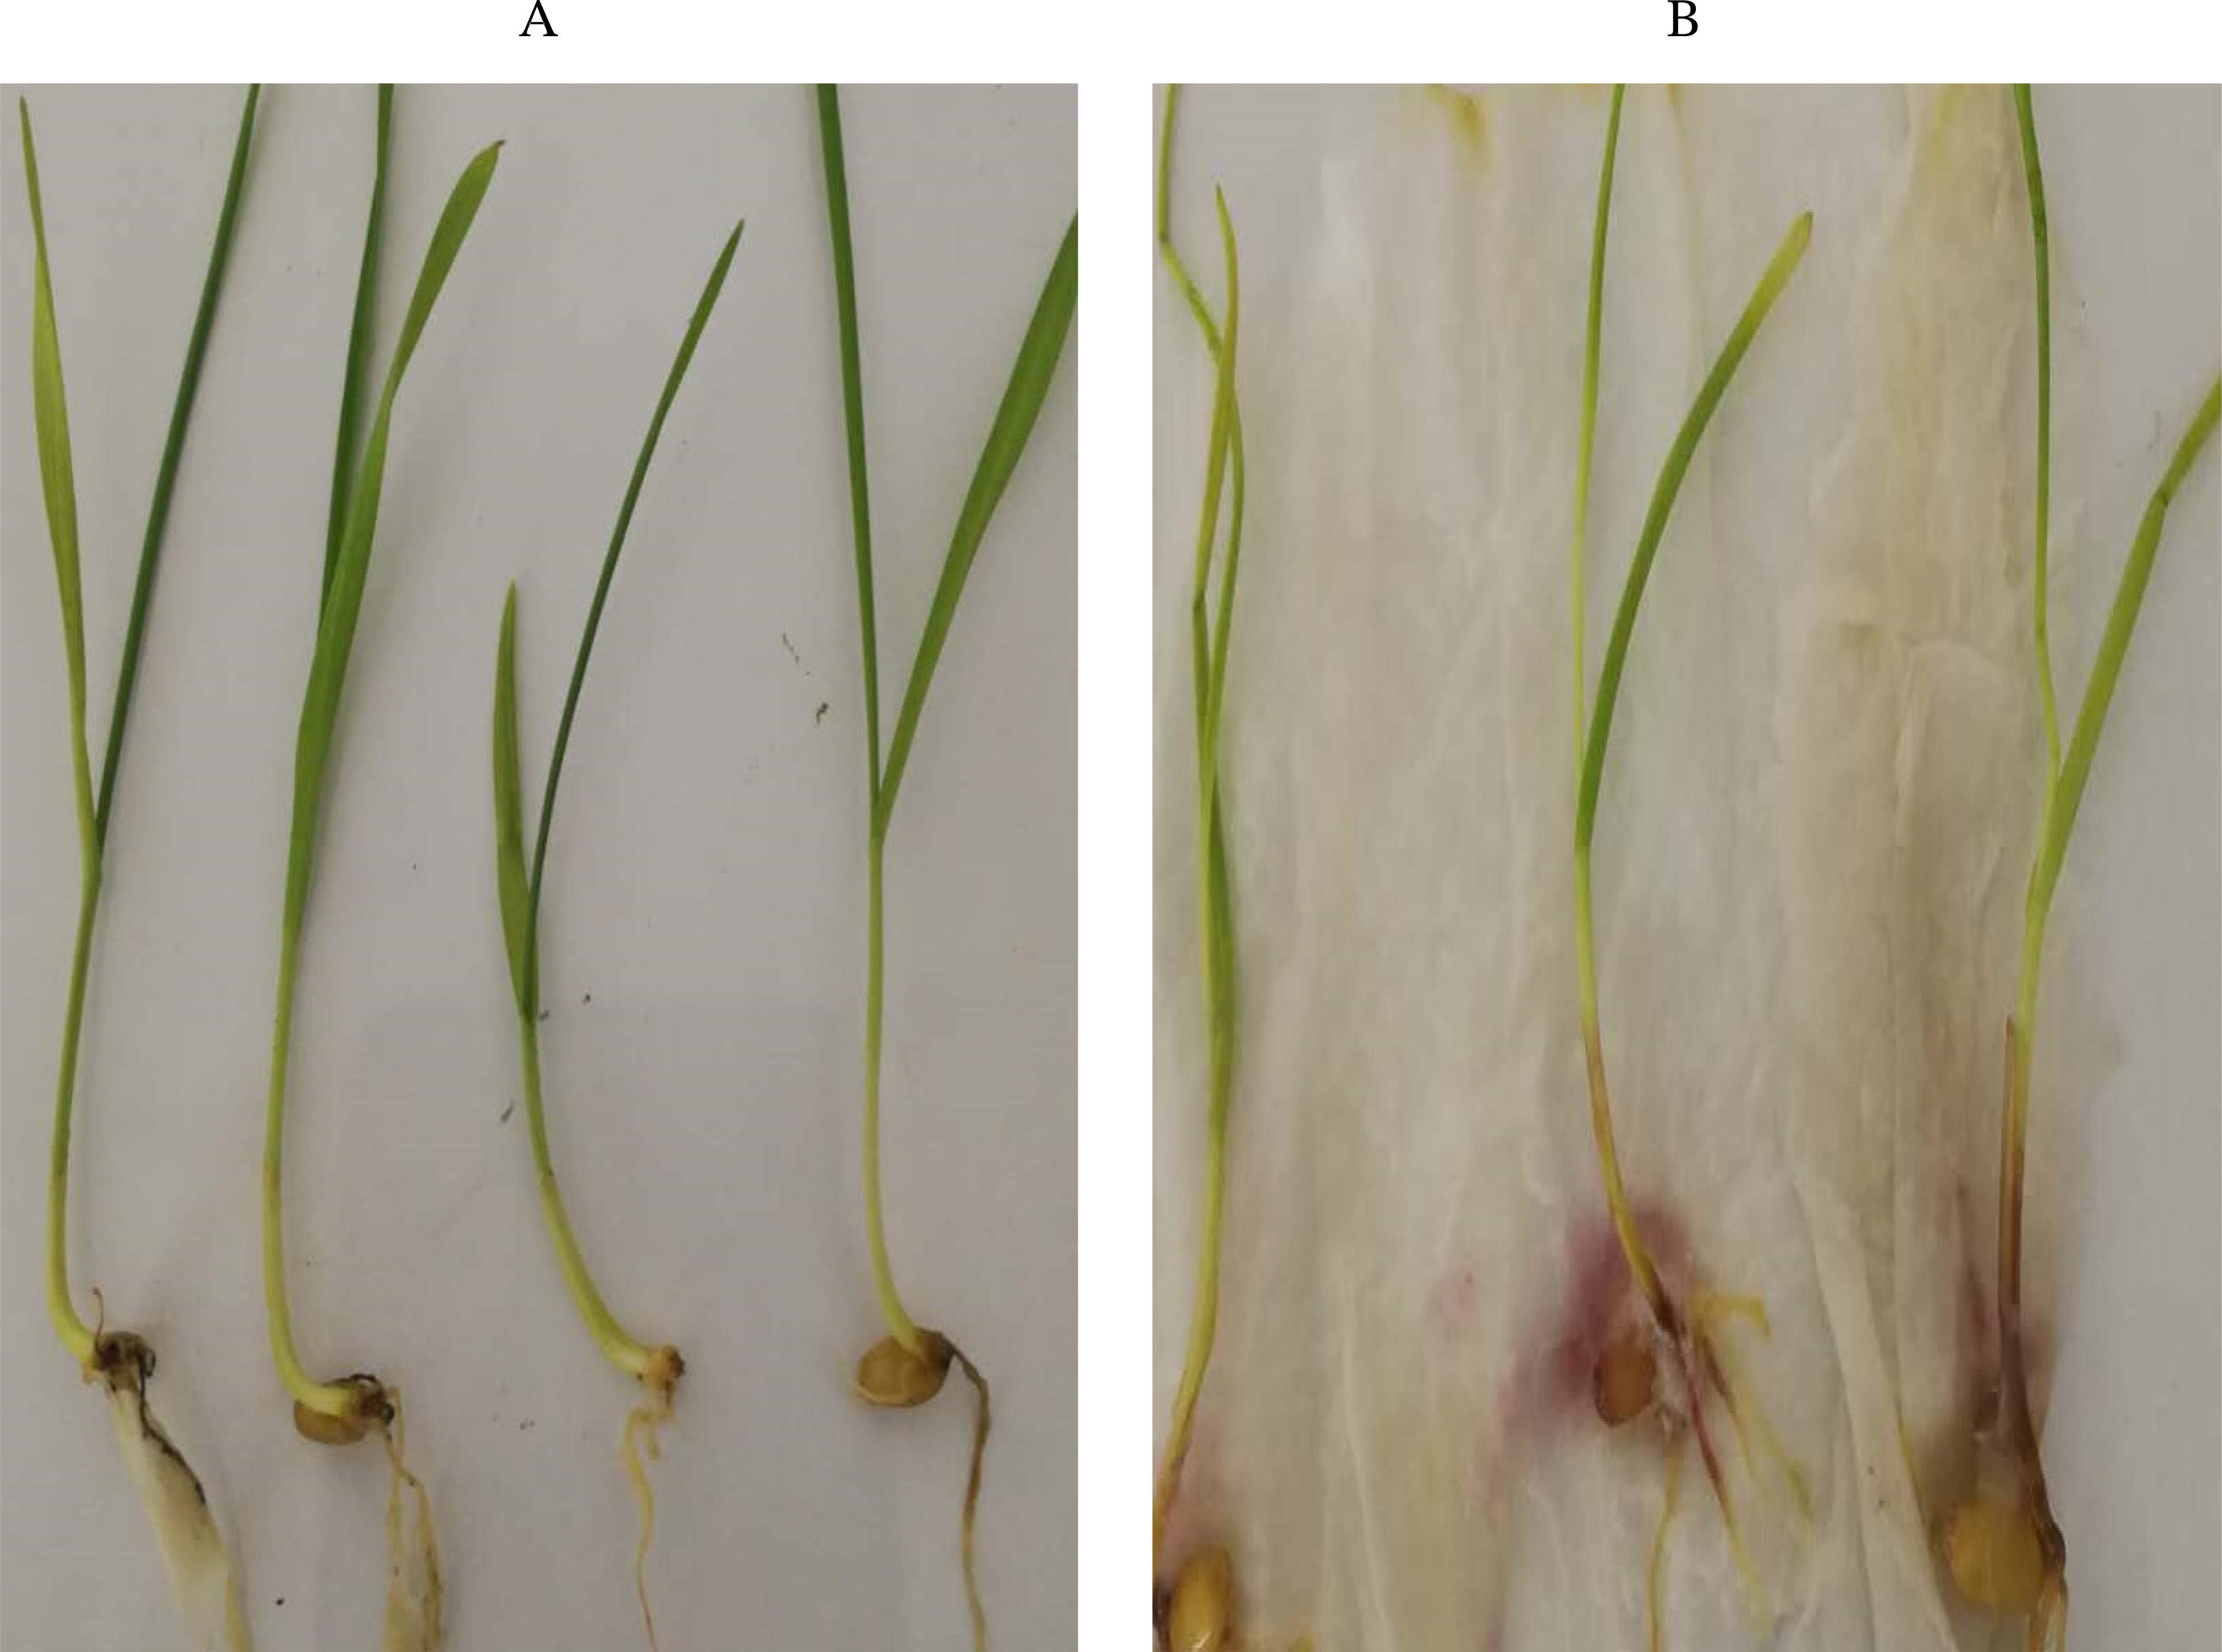
Fig. 3Seedlings from EMS-treated seeds were inoculated with F. psuedograminearum suspensions. A) Resistant -seedlings with no disease symptoms and B) Susceptible- seedlings covered with fungal mycelia

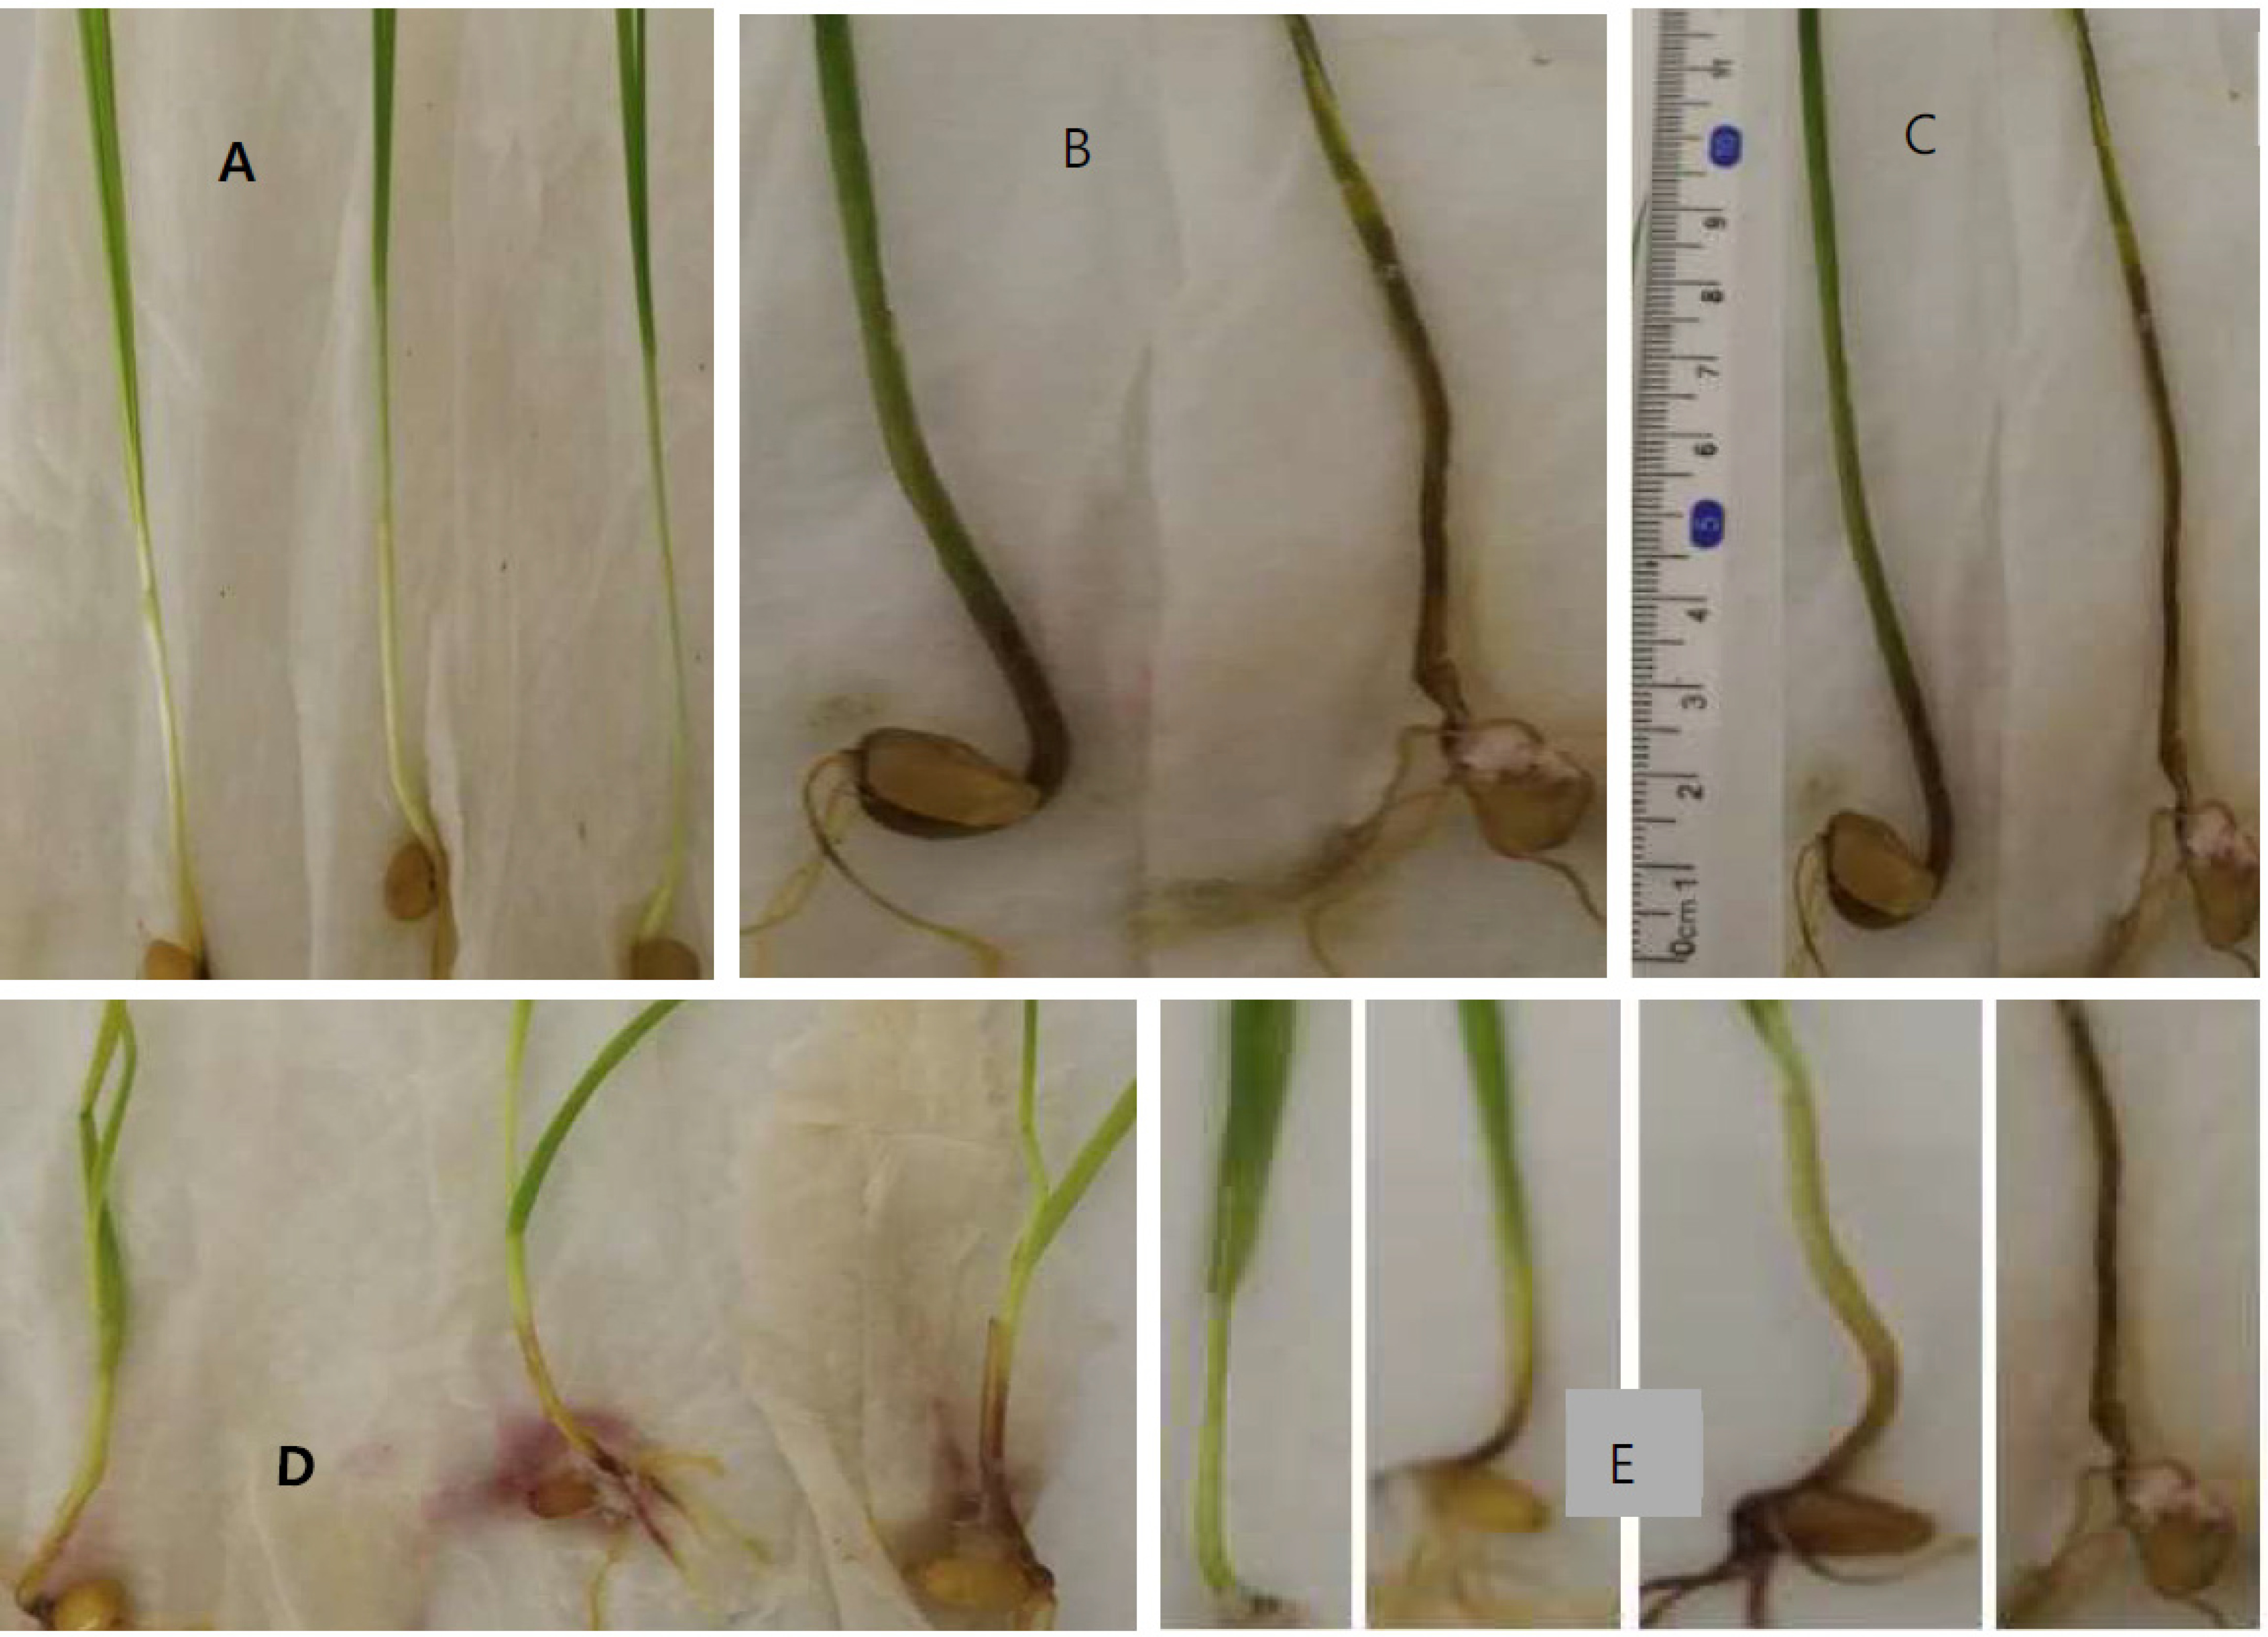
Fig. 4Screening of EMS-treated mutants’ resistance evaluation using seedling assay A, Resistant, B. susceptible C. seedling lesion measurement D. dead seedling and covered with fungal mycelium and E. level of disease reaction of the mutant seedlings.

Fig. 5FCR disease severity of wheat mutants (M3) lines treated with EMS (mutant’s lines from the genetic material of Kewei18 (0.40% and Kewei20 (0.40%) showed better resistance performance compared with the other mutant lines). The error bar represents the standard deviation of three replicates.
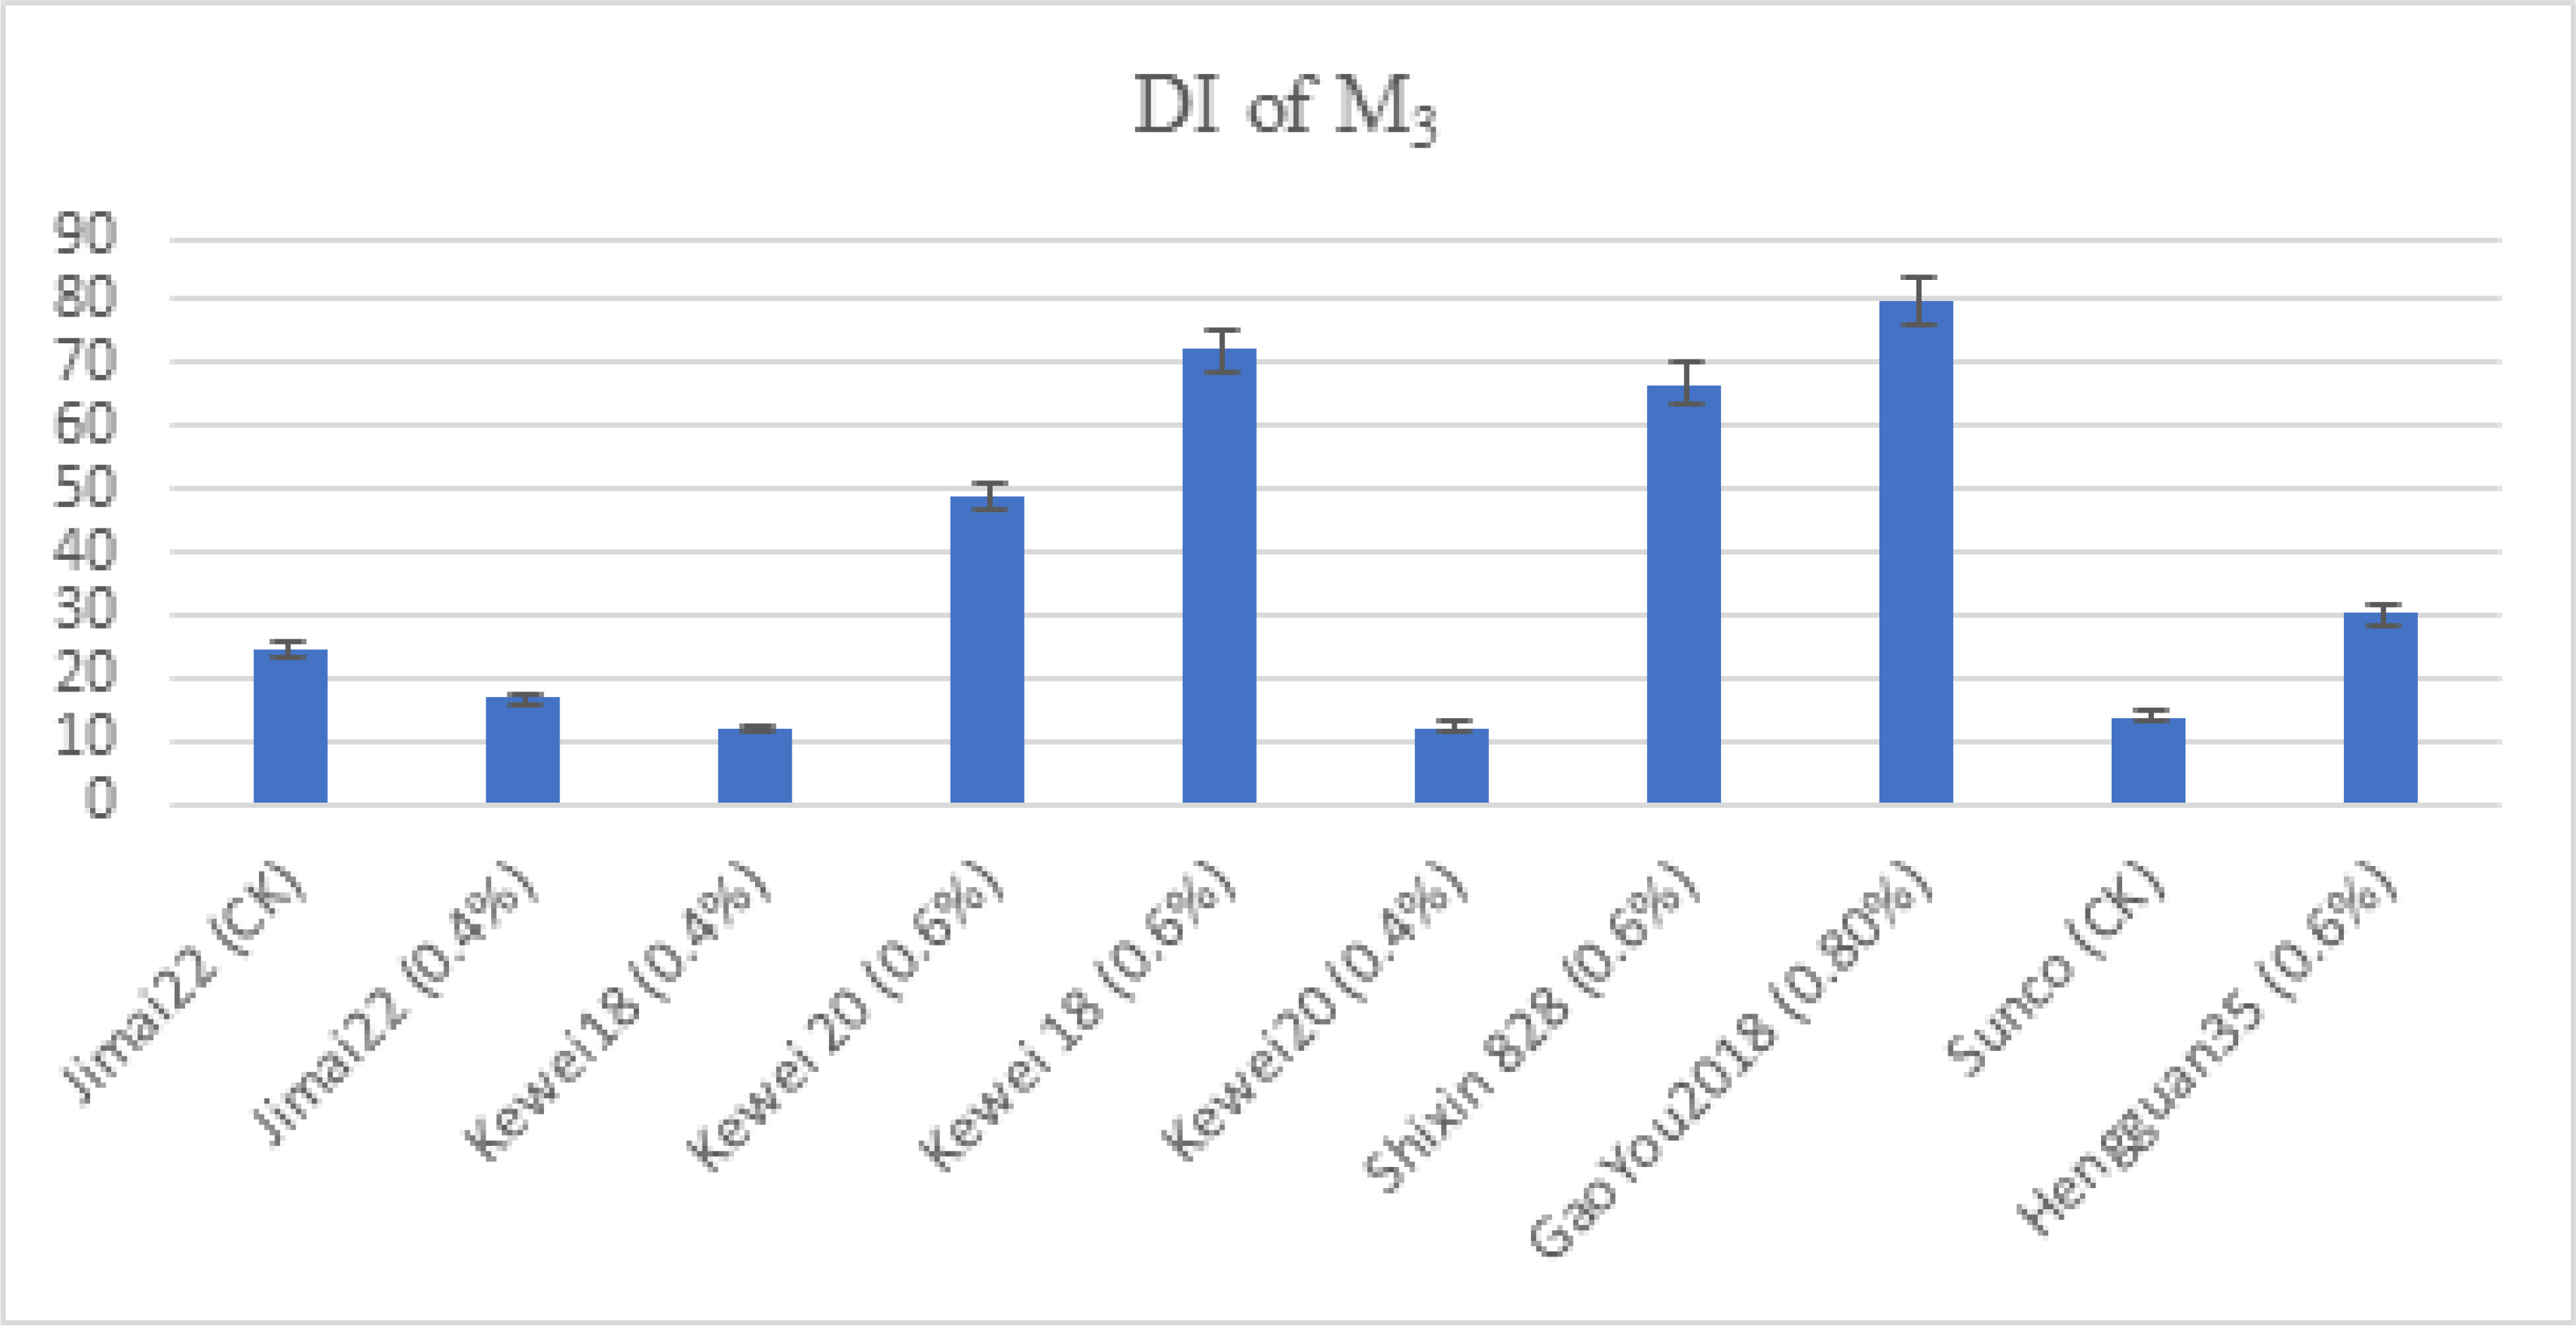
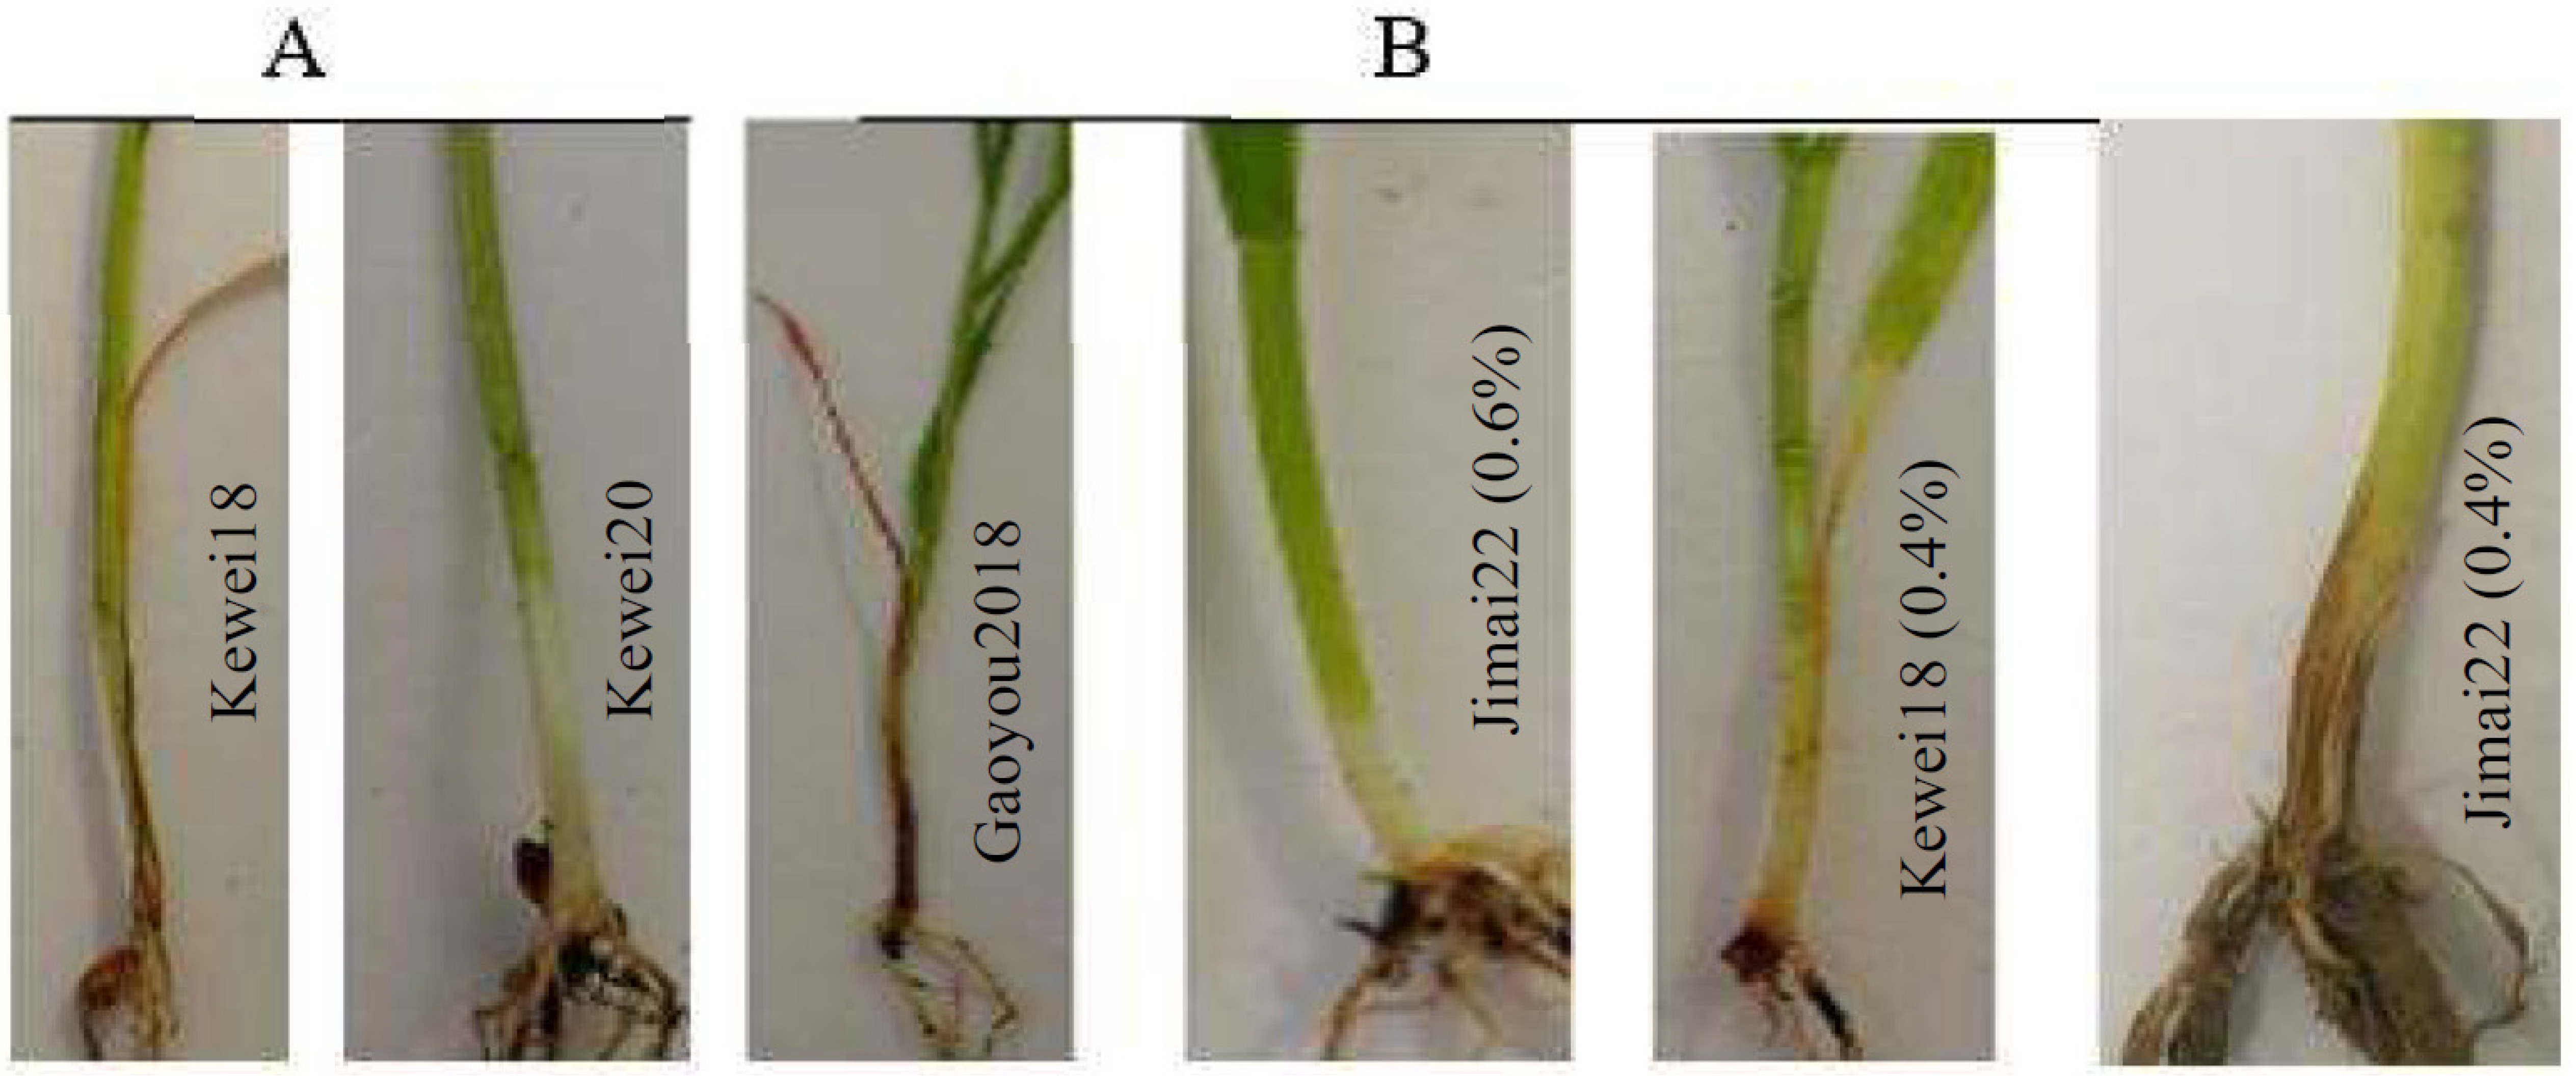
Fig. 6Some mutant lines showing seedling resistance during M3 generation A) biological seedlings (Kewei18, Kewei20) B) mutant seedlings (Gaoyou2018, Kewei18 (0.4% EMS), Jimai22 (0.4% EMS) and Jima22 (0.6% EMS)).

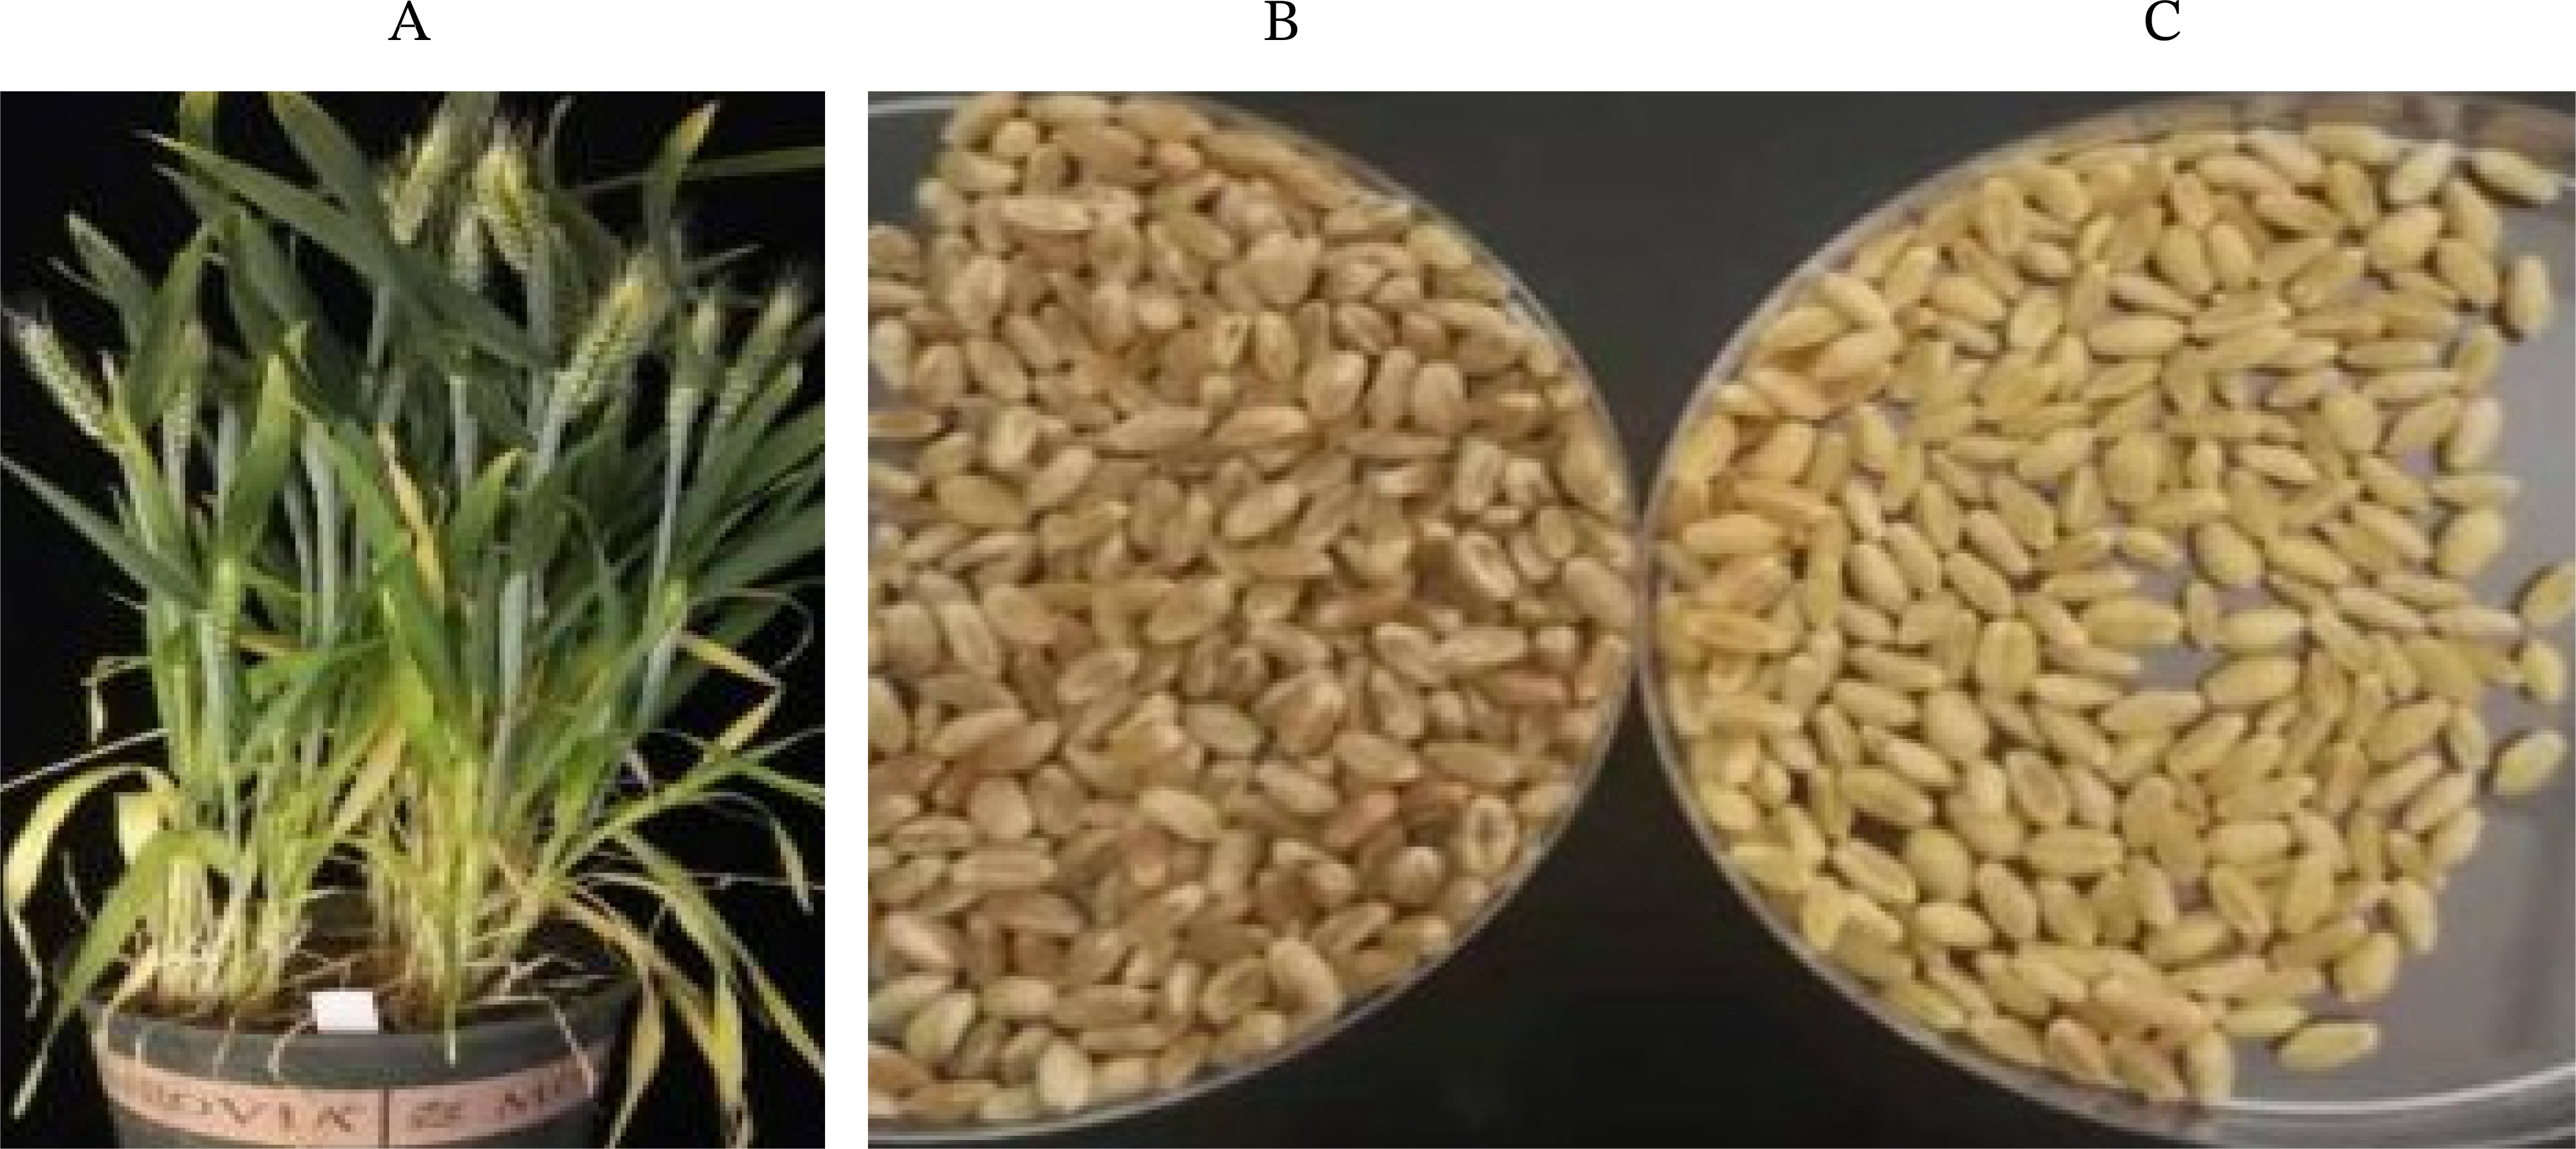
Fig. 7Adult plant and seeds of the resistant mutant compared with the wild one of Kewei 18: Adult plant B) mutant resistant seed C) wild seed.

Fig. 8Example of resistant M3 mutant lines selected at seedling and adult plant stages. A) at seedling, B) at maturity, and C) at harvest; D) wild spike E) mutant abnormal spike shape.

Fig. 9FHB Disease severity and DON content of mutant lines (M3) inoculated with F. graminearum.

Fig. 10Mutant plants showing resistant and susceptible to FHB at maturity stage. A and B are from the background of Kewei18, and C-is Kewei20, D- Jimai22.
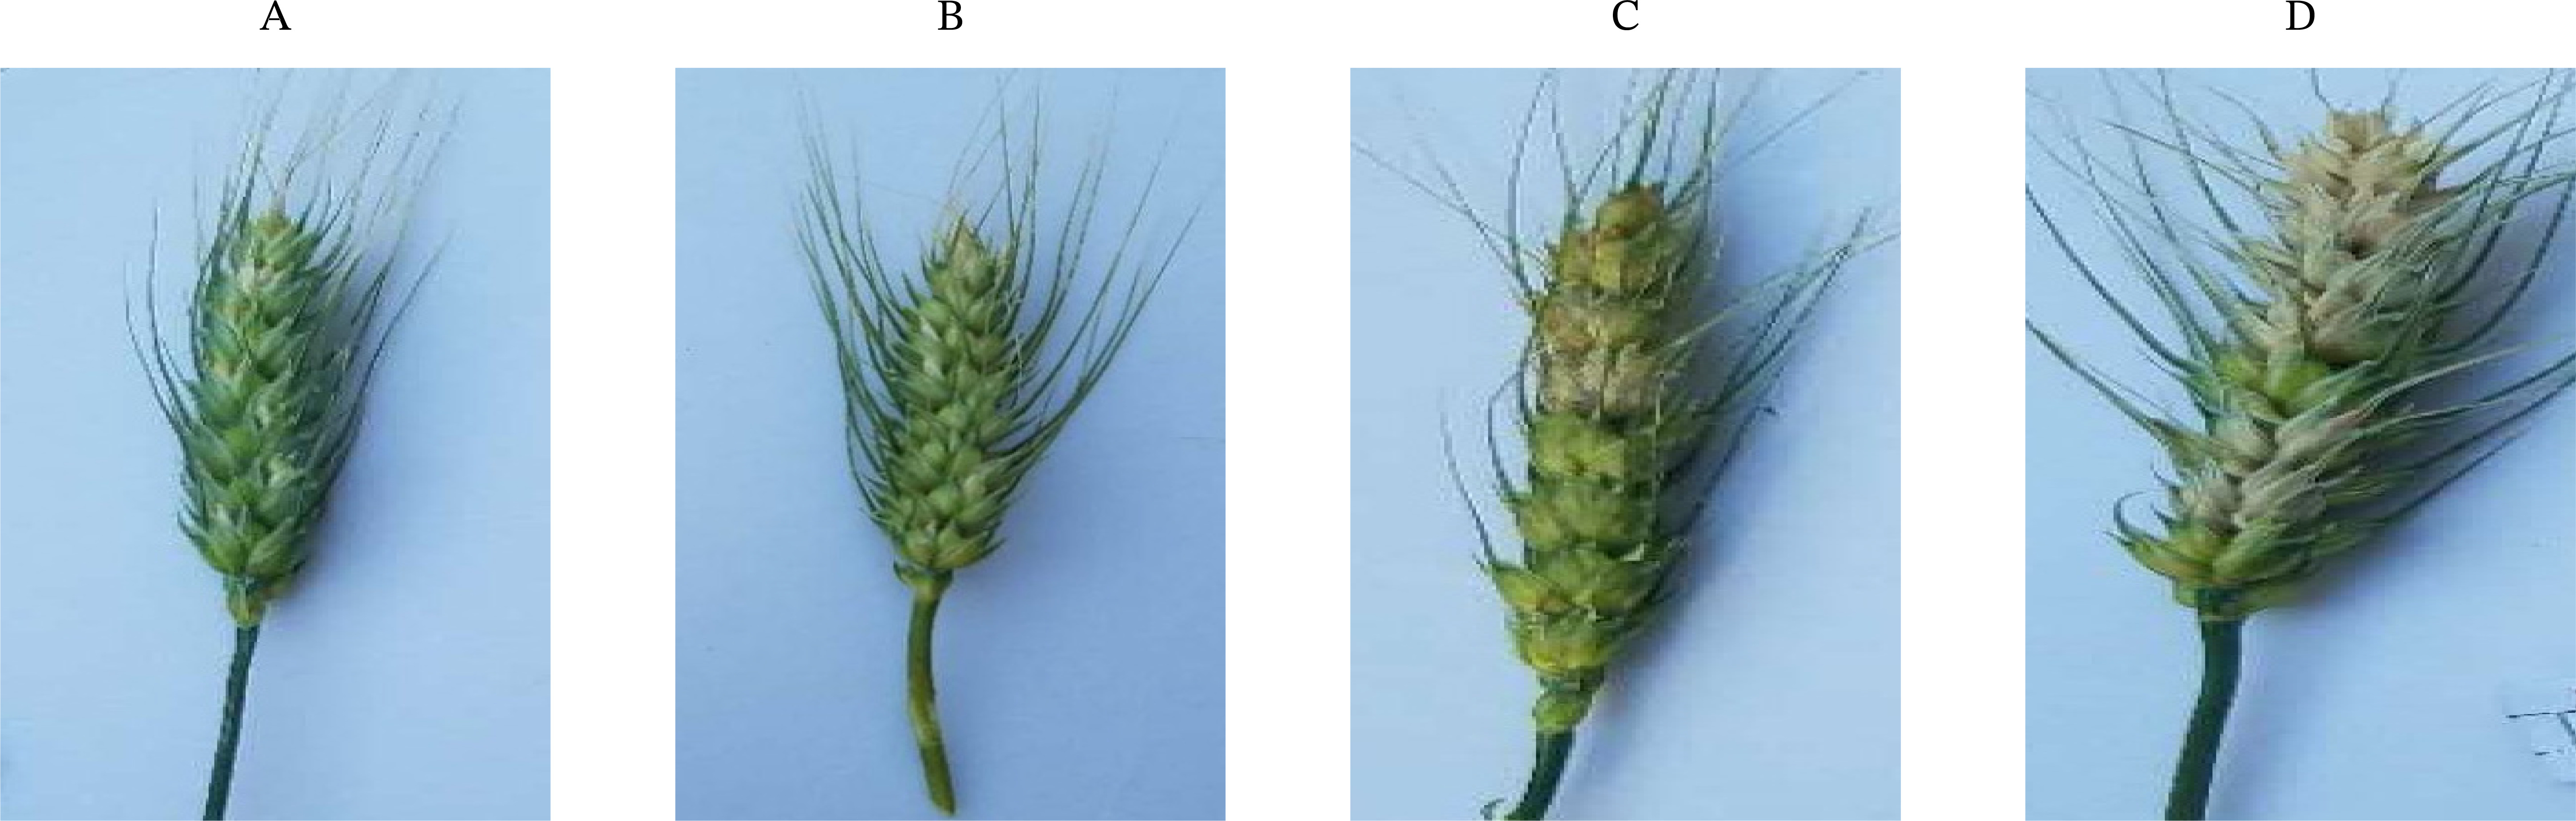
Table 1The seedling rate of different wheat cultivars induced by different concentrations of EMS.
Table 1
|
Cultivars |
EMS concentrations (%) |
Total seeds treated |
Number of Germinated seedlings |
Non-germinated
Seedlings |
Germination percentage (%) |
Relative germination percentage (%) |
|
Jimai22 |
0.4 |
500 |
386 |
114 |
77.20 |
79.59 |
|
0.6 |
500 |
260 |
240 |
52.00 |
53.61 |
|
0.8 |
550 |
200 |
350 |
40.00 |
41.23 |
|
1.0 |
500 |
102 |
398 |
20.40 |
21.03 |
|
0.0 |
500 |
485 |
50 |
97.00 |
100.00 |
|
|
Hengguan35 |
0.4 |
500 |
335 |
165 |
67.00 |
73.74 |
|
0.6 |
500 |
248 |
252 |
49.60 |
54.59 |
|
0.8 |
500 |
189 |
311 |
37.80 |
41.60 |
|
1.0 |
500 |
83 |
417 |
16.60 |
21.57 |
|
0.0 |
350 |
318 |
32 |
90.85 |
100.00 |
|
|
Shixin828 |
0.4 |
400 |
316 |
84 |
79.00 |
81.03 |
|
0.6 |
400 |
273 |
127 |
68.00 |
69.74 |
|
0.8 |
400 |
198 |
202 |
49.50 |
50.77 |
|
1.0 |
400 |
96 |
404 |
19.20 |
19.59. |
|
0.0 |
500 |
492 |
8 |
98.40 |
100.00 |
|
|
Kuwait20 |
0.4 |
500 |
230 |
270 |
46.00 |
47.42 |
|
0.6 |
500 |
198 |
302 |
39.60 |
40.82 |
|
0.8 |
500 |
140 |
360 |
28.00 |
28.86 |
|
1.0 |
500 |
76 |
424 |
15.20 |
15.67 |
|
0.0 |
500 |
485 |
15 |
97.00 |
100.00 |
|
|
Kuwait18 |
0.4 |
500 |
250 |
250 |
50.00 |
53.76 |
|
0.6 |
500 |
280 |
220 |
56.00 |
60.22 |
|
0.8 |
500 |
224 |
276 |
44.80 |
47.52 |
|
1.0 |
500 |
98 |
402 |
19.63 |
21.10 |
|
0.0 |
500 |
465 |
35 |
93.00 |
100.00 |
|
|
Gaoyou2018 |
0.4 |
500 |
370 |
130 |
74.00 |
76..28 |
|
0.6 |
500 |
340 |
160 |
68.00 |
70.00 |
|
0.8 |
500 |
250 |
250 |
50.00 |
51.54 |
|
1.0 |
500 |
56 |
444 |
11.20 |
11.55 |
|
0.0 |
500 |
485 |
50 |
97.00 |
100.00 |
Table 2Disease resistance screening of EMS-treated seedlings inoculated with Fusarium pseudograminearum.
Table 2
|
Cultivar name |
EMS (%) |
Disease levels |
|
|
0 |
1 |
2 |
3 |
4 |
5 |
DI |
|
Jimai22 |
0.4 |
0 |
60 |
35 |
31 |
17 |
9 |
2.46 |
|
Jimai22 |
0.6 |
0 |
20 |
25 |
52 |
18 |
16 |
3.61 |
|
Jimai22 |
0.0 |
0 |
11 |
64 |
59 |
51 |
39 |
1.64 |
|
GaoYou2018 |
0.8 |
0 |
12 |
8 |
16 |
4 |
3 |
16.59 |
|
GaoYou2018 |
0.0 |
0 |
32 |
31 |
42 |
30 |
18 |
28.10 |
|
Hengguan35 |
0.0 |
25 |
35 |
71 |
66 |
48 |
39 |
1.38 |
|
Hengguan35 |
0.4 |
28 |
49 |
37 |
15 |
4 |
14 |
2.47 |
|
Hengguan35 |
0.6 |
22 |
24 |
17 |
33 |
7 |
5 |
7.78 |
|
Hengguan35 |
0.8 |
25 |
12 |
20 |
10 |
5 |
8 |
4.02 |
|
Kewei20 |
0.0 |
0 |
19 |
11 |
15 |
21 |
5 |
10.99 |
|
Kewei20 |
0.4 |
0 |
21 |
12 |
25 |
20 |
2 |
7.02 |
|
Kewei20 |
0.6 |
0 |
20 |
22 |
10 |
51 |
30 |
2.01 |
|
Kewei20 |
0.8 |
0 |
17 |
22 |
23 |
7 |
8 |
6.43 |
|
Kewei18 |
0.0 |
0 |
4 |
21 |
17 |
3 |
6 |
9.08 |
|
Kewei18 |
0.4 |
18 |
21 |
35 |
14 |
7 |
8 |
4.88 |
|
Kewei18 |
0.6 |
13 |
19 |
22 |
9 |
11 |
15 |
3.13 |
|
Kewei18 |
0.8 |
0 |
20 |
13 |
8 |
6 |
11 |
2.50 |
|
Shixin828 |
0.0 |
19 |
37 |
71 |
54 |
51 |
46 |
1.21 |
|
Shixin828 |
0.4 |
0 |
32 |
25 |
10 |
5 |
10 |
5.02 |
|
Shixin828 |
0.6 |
0 |
34 |
25 |
24 |
3 |
2 |
|
|
Shixin828 |
0.8 |
0 |
25 |
48 |
93 |
55 |
52 |
1.23 |
|
Shiyou17 |
0.0 |
11 |
43 |
67 |
64 |
57 |
32 |
1.72 |
|
|
Total number of mutants |
136 |
433 |
598 |
611 |
394 |
324 |
|
Table 3Mean lesion length of EMS-treated wheat seedlings inoculated with F. pseudograminearum.
Table 3
|
Mutant line |
EMS concentrations (%) |
Lesion length (mm) +Std dev |
|
Hengguan35 |
0.60 |
15.00+2.65 |
|
Jimai 22 |
0.80 |
10.00 |
|
Jimai22 |
0.60 |
8.5+4.42 |
|
Shixin828 |
0.80 |
18.50+7.37 |
|
GaoYou2018 |
0.80 |
11.17+3.40 |
|
Kewei18 |
0.40 |
5.42+5.43 |
|
Kewei18 |
0.60 |
8.0+3.62 |
|
Kewei20 |
0.60 |
8.92+2.10 |
|
Kewei20 |
0.40 |
6.58+2.16 |
|
Shiyou17 |
0.0 |
9.40±1.7 |
Table 4Assessment of crown rot disease severity index for 400 M1, and 400 M2 individuals planted in the field and greenhouse.
Table 4
|
Mutant name |
EMS concentration (%) |
Field |
|
Greenhouse |
|
|
|
No. of resistant M1 individuals |
Percentage
(%) |
No. of resistant M2 individuals |
Percentage
(%) |
|
Kewei18 |
0.04 |
20 |
5.18 |
|
11 |
6.92 |
|
Kewei18 |
0.60 |
69 |
17.88 |
|
23 |
14.47 |
|
Jimai22 |
0.40 |
26 |
6.74 |
|
6 |
3.77 |
|
Jimai22 |
0.60 |
42 |
10.88 |
|
20 |
12.58 |
|
Kewei 20 |
0.40 |
21 |
5.44 |
|
13 |
8.18 |
|
Kewei 20 |
0.60 |
45 |
11.66 |
|
17 |
10.69 |
|
Shixin828 |
0.60 |
23 |
5.96 |
|
8 |
5.03 |
|
Shixin828 |
0.80 |
38 |
9.84 |
|
23 |
14.47 |
|
Hengguan35 |
0.60 |
14 |
3.62 |
|
12 |
7.55 |
|
Hengguan35 |
0.80 |
58 |
15.03 |
|
17 |
10.69 |
|
GaoYou2018 |
0.80 |
30 |
7.77 |
|
9 |
5.66 |
|
Sunco (R) |
CK |
17 |
4.4 |
|
8 |
5.03 |
|
Shiyou17 |
CK |
20 |
5.18 |
|
8 |
5.03 |
|
|
Mean |
|
32.53 |
|
|
13.46 |
|
|
Stdv |
|
6.34 |
|
|
2.48 |
|
|
Variance |
|
40.16 |
|
|
6.15 |
|
Table 5Phenotypic traits of mutant plants including the number of resistant mutant plants, plant height, % screen, number of kernels per plant, 1000 kernel weight, and percent of white heads for mutant (M3) lines.
Table 5
|
Mutant name |
No of Resistant M3 plants |
PH (cm) |
Screen (%) |
NKPS |
TKW (g) |
WH (%) |
|
GaoYou2018 (0.8%) |
65 |
50.45 |
15.48 |
24.50 |
57.80 |
30 |
|
Hengguan35 (0.6%) |
85 |
62.40 |
53.33 |
19.00 |
43.09 |
5 |
|
Jimai 22 (0.4%) |
67 |
55.40 |
58.25 |
29.33 |
33.10 |
10.28 |
|
Kewei18 (0.4%) |
98 |
68.00 |
17.53 |
25.00 |
57.93 |
NA |
|
Kewei 20 (0.6%) |
102 |
50.40 |
31.37 |
16.8 |
61.34 |
15.5 |
|
Kewei 18 (0.6%) |
76 |
45.20 |
31.58 |
35.20 |
66.49 |
NA |
|
Kewei20 (0.4%) |
41 |
59.80 |
17.05 |
24.80 |
37.95 |
12 |
|
Shixin 828 (0.6%) |
36 |
60.00 |
58.12 |
26.00 |
62.46 |
2.6 |
|
Sunco (CK) |
|
66.50 |
28.78 |
22.67 |
42.50 |
15.32 |
|
Jimai 22 (CK) |
|
43.50 |
32.52 |
29.33 |
33.10 |
17 |
|
|
Mean |
|
59.08 |
34.12 |
23.93 |
50.51 |
12.18. |
|
StDev. |
|
8.37 |
17.54 |
5.68 |
11.81 |
7.24 |
|
Variance |
|
70.14 |
307.55 |
32.23 |
139.99 |
52.47 |
Table 6Pearson’s correlation among agronomic traits of mutant lines.
Table 6
|
DI |
PH |
Screen |
NKPS |
TKW |
WH |
|
DI |
1.000 |
|
|
|
|
|
|
PH |
0.416 |
1.000 |
|
|
|
|
|
Screen |
0.253 |
-0.368 |
1.000 |
|
|
|
|
NPKS |
0.13 |
0.769**
|
0.423 |
1.000 |
|
|
|
TKW |
0.036 |
0.590*
|
0.117 |
-0.615*
|
1.000 |
|
|
WH |
0.931**
|
0.818 |
0.003 |
0.744**
|
-0.521 |
1.000 |
Table 7Phenotype descriptions of M3 plants (greenhouse).
Table 7
|
Phenotype description |
Number of mutants observed |
Frequency (%) |
|
Dwarf and semi-dewarf |
35 |
1.34 |
|
Tiny plants |
8 |
0.31 |
|
Few tillers |
5 |
0.15 |
|
Seedling lethal |
4 |
0.15 |
|
Wide leaf |
3 |
0.11 |
|
Deep green |
2 |
0.08 |
|
Disease sensitivity |
16 |
1.9 |
|
Early senses |
5 |
0.15 |
|
Single tiller |
3 |
0.22 |
|
Multiple tiller |
35 |
1.34 |
|
Narrow leaf |
5 |
0.12 |
|
Spike shape |
8 |
0.25 |
Table 8Number of wheat mutant (M3) lines resistant and susceptible lines to FCR.
Table 8
|
List of mutants |
Total plant |
Diseased plant |
Healthy plant*
|
Resistance percentage of mutants |
|
GaoYou2018 (0.80%) |
559 |
227 |
332 |
62.57 |
|
Hengguan35 (0.6%) |
64 |
15 |
49 |
76.56 |
|
Jimai22 (0.4%) |
174 |
84 |
90 |
51.72 |
|
Kewei18 (0.4%) |
227 |
81 |
146 |
64.32 |
|
Kewei20 (0.6%) |
365 |
102 |
263 |
72.05 |
|
Kewei18 (0.6%) |
86 |
36 |
50 |
58.14 |
|
Kewei20 (0.4%) |
211 |
62 |
149 |
70.62 |
|
Shixin 828 (0.6%) |
399 |
329 |
70 |
17.54 |
|
Sunco ck |
440 |
190 |
250 |
56.82 |
References
- (IAEA) I International Atomic Energy Agency.2015. IAEA mutant database.
- Amberg DC, Burke DJ, Strathern JN. 2006. Ethyl methane sulfonate (EMS) mutagenesis. Cold Spring Harb. Protoc. 2006(1): 1-14.
- Arora S, Steuernagel B, Chandramohan S, Long Y, Matny O, Johnson R, et al. 2018. Resistance gene discovery and cloning by sequence capture and association genetics. BioRxiv..
- Bai G, Shaner G. 2004. Management and resistance in wheat and barley to Fusarium head blight. Annu. Rev. Phytopathol. 42: 135-161.
- Caldwell DG, McCallum N, Shaw P, Muehlbauer GJ, Marshall DF, Waugh R. 2004. A structured mutant population for forward and reverse genetics in Barley (Hordeum vulgare L.). Plant J. 40: 143-150.
- Chen Y, Liang H, Ma X, Lou S, Xie Y, Liu Z, et al. 2012. An efficient rice mutagenesis system based on suspension-cultured cells. J. Integr. Plant Biol. 55: 122-130.
- Chhabra B, Singh L, Wallace S, Schoen A, Dong Y, Tiwari VK, et al. 2021. Screening of an EMS mutagenized population of a wheat cultivar susceptible to Fusarium head blight identifies resistant variants. Plant Dis. 105: 3669-3676.
- Dhaliwal AK, Mohan A, Sidhu G, Maqbool R, Gill KS. 2015. An ethylmethane sulfonate mutant resource in pre-green revolution hexaploid wheat. PloS one. 10: e0145227
- Dong C, Dalton-Morgan J, Vincent K, Sharp P. 2009. A Modified TILLING Method for Wheat Breeding. Plant Genome. 2: 39-49.
- Greene EA, Codomo CA, Taylor NE, Henikoff JG, Till BJ, Reynolds SH, et al. 2003. Spectrum of chemically induced mutations from a large-scale reverse-genetic screen in Arabidopsis. Genetics. 164: 731-740.
- Hailegiorgis D, Lee CA, Yun S. 2018. Ethyl methanesulfonate (EMS)-induced mutagenesis of durum wheat for TILLING. Presented at Proceedings of the Korean Society of Crop Science Conference. Korea..
- Hancock CN, Zhang F, Floyd K, Richardson AO, LaFayette P, Tucker D, et al. 2011. The rice miniature inverted repeat transposable element mPing is an effective insertional mutagen in soybean. Plant Physiol. 157: 552-562.
- Hartwell LH HL, Goldberg ML, Reynolds AE, Silver LM, Veres RC. 2008. Genetics: From Genes to Genomes: McGraw-Hill Higher Education.
- Hoisington D, Khairallah M, Reeves T, Ribaut J-M, Skovmand B, Taba S, et al. 1999. Plant genetic resources: what can they contribute toward increased crop productivity? PNAS. 96: 5937-5943.
- Hussain M, Iqbal MA, Till BJ. Rahman M-u-2018. Identification of induced mutations in hexaploid wheat genome using exome capture assay. PLoS One. 13: e0201918
- Jankowicz-Cieslak J, Till BJ. 2016. Chemical mutagenesis of seed and vegetatively propagated plants using EMS. Curr. protoc. Plant Biol. 1: 617-635.
- Kamra OP, Brunner H. 1977. Chemical mutagens. Vienna: International Atomic Energy Agency..
- Klein T, Burgess L, Ellison F. 1991. The incidence and spatial patterns of wheat plants infected by Fusarium graminearum Group 1 and the effect of crown rot on yield. Aust. J. Agric. Res. 42: 399-407.
- Leitão J. 2012. Chemical mutagenesis. Plant Breed. Biotech. 135-158..
- Lemmens M, Scholz U, Berthiller F, Dall'Asta C, Koutnik A, Schuhmacher R, et al. 2005. The ability to detoxify the mycotoxin deoxynivalenol colocalizes with a major quantitative trait locus for Fusarium head blight resistance in wheat. Mol. Plant Microbe Interact. 18: 1318-1324.
- Lu S, Yin X, Spollen W, Zhang N, Xu D, Schoelz J, et al. 2015. Analysis of the siRNA-mediated gene silencing process targeting three homologous genes controlling soybean seed oil quality. PLoS One. 10: e0129010
- McMullen M, Jones R, Gallenberg D. 1997. Scab of wheat and barley: a re-emerging disease of devastating impact. Plant Dis. 81: 1340-1348.
- Mesterhazy A. 2020. Updating the breeding philosophy of wheat to Fusarium head blight (FHB): Resistance components, QTL identification, and phenotyping-A review. Plants. 9(12): 1702
- Mesterházy Á, Bartók T, Mirocha C, Komoroczy R. 1999. Nature of wheat resistance to Fusarium head blight and the role of deoxynivalenol for breeding. Plant Breed. 118: 97-110.
- Parry MA, Madgwick PJ, Bayon C, Tearall K, Hernandez-Lopez A, Baudo M, et al. 2009. Mutation discovery for crop improvement. J. Exp. Bot. 60: 2817-2825.
- Pathirana R. 2011. Plant mutation breeding in agriculture. CABI Reviews. pp. 1-20..
- Paul PA, Lipps PE, Madden LV. 2005. Relationship between visual estimates of Fusarium head blight intensity and deoxynivalenol accumulation in harvested wheat grain: A meta-analysis. Phytopathology. 95: 1225-1236.
- Penna S, Mirajkar S, Bhagwat S. 2015. Induced mutations and crop improvement. Plant Biology and Biotechnology. pp. 593-617..
- Peters JL, Cnudde F, Gerats T. 2003. Forward genetics and map-based cloning approaches. Trends Plant Sci. 8: 484-491.
- Qian Y. 2017. Identification of mutant traits in wheat induced by EMS. Shandong: Shandong Agricultural University..
- Qiu J, Xu J, Shi J. 2019. Fusarium toxins in Chinese wheat since the 1980s. Toxins. 11(5): 2481-34.
- Rahman MM, Davies P, Bansal U, Pasam R, Hayden M, Trethowan R. 2021. Relationship between resistance and tolerance of crown rot in bread wheat. Field Crops Res. 265: 108106
- Rawat N, Pumphrey MO, Liu S, Zhang X, Tiwari VK, Ando K, et al. 2016. Wheat Fhb1 encodes a chimeric lectin with agglutinin domains and a pore-forming toxin-like domain conferring resistance to Fusarium head blight. Nat. Genet. 48: 1576-1580.
- Rizwan M, Akhtar S. 2015. Development of herbicide resistant crops through induced mutations. Adv. Life Sci. 3: 1-8.
- Rudd J, Horsley R, McKendry A, Elias E. 2001. Host plant resistance genes for Fusarium head blight: sources, mechanisms, and utility in conventional breeding systems. Crop Sci. 41: 620-627.
- Sikora P, Chawade A, Larsson M, Olsson J, Olsson O. 2011. Mutagenesis as a tool in plant genetics, functional genomics, and breeding. Int J Plant Genomics. 2011(1): 314829
- Singh A, Kumar P, Sharma M, Tuli R, Dhaliwal HS, Chaudhury A, et al. 2015. Expression patterns of genes involved in starch biosynthesis during seed development in bread wheat (Triticum aestivum). Mol. Breed. 35: 1-9.
- Slade AJ, Fuerstenberg SI, Loeffler D, Steine MN, Facciotti D. 2005. A reverse genetic, nontransgenic approach to wheat crop improvement by TILLING. Nat. Biotechnol. 23: 75-81.
- Somers DJ, Fedak G, Savard M. 2003. Molecular mapping of novel genes controlling Fusarium head blight resistance and deoxynivalenol accumulation in spring wheat. Genome. 46: 555-564.
- Sugihara Y, Young L, Yaegashi H, Natsume S, Shea DJ, Takagi H, et al. 2022. High-performance pipeline for MutMap and QTL-seq. PeerJ. 10: e13170
- Suzuki T, Eiguchi M, Kumamaru T, Satoh H, Matsusaka H, Moriguchi K, et al. 2008. MNU-induced mutant pools and high performance TILLING enable finding of any gene mutation in rice. Mol. Genet. Genomics. 279: 213-223.
- Tetlow IJ, Blissett KJ, Emes MJ. 1994. Starch synthesis and carbohydrate oxidation in amyloplasts from developing wheat endosperm. Planta. 194: 454-460.
- Weil CF, Monde RA. 2009. EMS mutagenesis and point mutation discovery. In: Kriz AL and Larkins BA. (Eds.). Molecular genetic approaches to maize improvement. Berlin, Heidelberg: Springer Berlin Heidelberg. pp. 161-171.
- Xin Z, Li Wang M, Barkley NA, Burow G, Franks C, Pederson G, et al. 2008. Applying genotyping (TILLING) and phenotyping analyses to elucidate gene function in a chemically induced sorghum mutant population. BMC Plant Biol. 8: 1-14.
- Zhang H, Wang S, Huang X, Dong Y, Zheng X. 2008. Integrated control of postharvest blue mold decay of pears with hot water treatment and Rhodotorula glutinis. Postharvest Biol. Technol. 49: 308-313.