Abstract
The development of rice seedlings stressed by drought and salt is shown by different morphometric and colorimetric traits. These distinctions can be used to understand the response of plants to challenging conditions. Therefore, this study aimed to assess the efficacy of image-based phenotyping in the early testing of rice plants and observe how the plants respond to both drought and salinity. A stress tolerance index with multivariate analysis was used for the selection of the most important traits. The experiment consisted of 2 factors, namely the degree of environmental stress and rice genotype. Furthermore, the degree of environmental stress comprised normal (NaCl and PEG 0%), drought (10% PEG), salinity (60 mM NaCl), as well as a combination of moderate drought and salinity (5% PEG + 30 mM NaCl). The results showed that both morphometric (area, convex hull, bounding area, perimeter, centermassy) and colorimetric (CIVE, VARI, RGBVI, MGRVI, NDI, GLI, NGRDI) can be used as selection characters.
-
Key words: Color vegetation index, Image processing, Geometric, Multiple stress, Multivariate, Phenotypic
Introduction
Rice (
Oryza sativa L.) is one of the world's most important staple crops, providing food for a significant portion of the global population. It has played a vital role in the dietary and economic fabric of many nations, particularly in Asia, including Indonesia (
Charoonratana 2020;
Dabrowski et al. 2021). However, the reliability of rice production is becoming increasingly difficult due to climate change, with the associated adverse effects being increased intensity of drought and salinity stress (
Saud et al. 2022).
Environmental stress is particularly dangerous during the seedling stage of rice growth. Young rice plants, lacking the robust root systems and physiological processes discovered in more mature counterparts, face the challenges of managing stress during this developmental stage (
Hussain et al. 2018;
Yan et al. 2023). In cases where drought and salinity coincide, plants manifest defense mechanisms that differ from the responses provided to each stressor individually (
Ma et al. 2020). Therefore, early detection and assessment of stress-induced damage at the seedling stage are essential for effective mitigation and crop improvement (
Hairmansis et al. 2014;
Laraswati et al. 2021;
Vlaminck et al. 2020).
The seedling phenotypic imaging and the development of tolerance indices for drought and salinity stress is an important stride in plant breeding. Due to the significant impact of drought and salinity on rice cultivation and production, the study is focused on developing stress-tolerant varieties through breeding and genetic engineering (
Akbar et al. 2019;
Kakar et al. 2019). Plant phenotyping, a fundamental practice in crop improvement, includes the measurement and analysis of the physical and biochemical characteristics of an organism. Traditionally, the process relied on labor-intensive, subjective, and time-consuming approaches (
Bhatta et al. 2021;
Gano et al. 2021;
Laraswati et al. 2021). However, image-based phenotyping is currently being developed to characterize plant morphological and physiological responses using digital images (
Berger et al. 2010;
Das Choudhury et al. 2020;
Singh et al. 2018). This innovative approach offers the potential for high-throughput, non-invasive, and objective assessment of plant traits (
Bhatta et al. 2021;
Hairmansis et al. 2014;
Singh et al. 2018). Several studies have reported the application of an effective image-based selection method in rice (
Hairmansis et al. 2014;
Laraswati et al. 2021;
Sakinah et al. 2022). As an alternative to the conventional method, non-invasive RGB imaging has been incorporated to identify the tolerant plant in its early stage, focusing on important geometric features (
Bhatta et al. 2021). Meanwhile, few studies still focus on examining the morphometric and colorimetric image features in response to combined drought and salinity stress.
Morphometric and colorimetric traits play an important role in the image-based phenotyping of rice plants. These can also be used to identify differences between crop varieties and evaluate the effects of environmental stressors on rice growth (
Du et al. 2021). Morphometric traits refer to the physical measurements of an organism, such as length, width, and area. Meanwhile, colorimetric traits are color characteristics of an organism, including hue, saturation, and brightness (
Du et al. 2021;
Manacorda et al. 2018). Several studies have reported the morphometric traits used in rice, such as PAR, convex hull, and eccentricity (
Bhatta et al. 2021;
Kim et al. 2020). The colorimetric traits responsive to abiotic stress, including NDVI and RGBVI, were also identified (
Tilly et al. 2015;
Wang et al. 2020). During the seedling stage, variations in these traits can offer valuable insights into the responsiveness to environmental stressors, independent of nutritional conditions and aging in plant growth. This approach can be strengthened by incorporating tolerance indices to account for selection attributes during the screening process.
Tolerance indices provide a comprehensive and quantitative measure of the ability of a plant to withstand stress, providing valuable criteria for the selection of stress-tolerant rice varieties (
Anshori et al. 2021;
Fadhli et al. 2020;
Farid et al. 2021;
Laraswati et al. 2021). The combination of traits in regression produces a specific index value that characterizes a genotype (
Farid et al. 2021). This study aims to explore image-based phenotyping during the seedling stage, particularly focusing on advancing tolerance indices. The primary goal is to discern tolerance responses through these indices, assessing image-based phenotyping traits as selection criteria in screening rice. Combining the tolerance index with multivariate analysis like PCA, enhances effectiveness by weighting values for each selection index, simplifying the interpretation of extensive variable data (Mattjik et al. 2011;
Anshori et al. 2019). This study contributes to the development of stress-resistant rice varieties capable of withstanding challenges, thereby benefiting rice breeding and agricultural practices.
Materials and Methods
The experimental design
The method used was a randomized complete group design, comprising of 2 factors and 3 replications. The first factor was the level of environmental stress, while the second was rice genotypes. Furthermore, the degree of environmental stress included normal (without NaCl and PEG), drought (10% PEG), salinity (60 mM NaCl), and a combination of drought and salinity (10% PEG + 60 mM NaCl). A total of 5 rice cultivars, namely Inpari 34 (V1; moderate check), Inpari 29 (V2; tolerance check), IR29 (V3; sensitive check), Ciherang (V4; Indonesian mega variety), and Jeliteng (V5; pigmented rice), were adopted in this study. Stress treatment commenced on the 10th day after transplantation, with a gradual application to prevent osmotic shock. Half of the treatment dose was applied in the first session (drought 5% PEG; salinity 30 mM NaCl; and a combination of drought and salinity 5% PEG + 30 mM NaCl). After 3 days, the full dose was administered, except for the combination of drought and salinity due to already evident damage (drought 10% PEG; salinity 60 mM NaCl; and a combination of drought and salinity 5% PEG + 30 mM NaCl).
The hydroponic seedling stage procedures
The experiment was conducted from September to October 2021, in a hydroponic system at the screen house facility of the Plant Breeding and Tissue Culture Laboratory, Department of Agronomy, Hasanuddin University, Indonesia.
Seeds were planted hydroponically on floating rafts containing ABmix solution (8 mL/L = EC 3 ds m-1). Each seed type was subjected to germination in a mineral water solution. After 7 days of sowing, the seedlings were transferred to a hydroponic growth environment. For transplanting, foam was wrapped around the base of the stem and placed in designated planting holes in the floating raft system. The pH of the nutrient solution was adjusted every other day within the range of 5.5 and 6.0. Additionally, tap water was incorporated to compensate for any loss of solution volume.
Image collection and data observation
Images were captured using a Canon EOS 1200D camera at ISO 800, f/5.6, and 1/160 second without flash. Those of the plants were captured inside a sealed chamber using a high-intensity artificial light source. To determine the areas, a ruler was placed in proximity to the plants and labeled accordingly. The side views (at 90°) from which images were taken, fell within the visible spectrum, commonly known as the RGB range (400-700 nm).
Consistency was maintained throughout the process, including light intensity and distance from vegetation. The geometric characteristics of the captured image were examined using the open-source software Image J. In summary, excess regions were cropped on all 4 sides of the selected images. A straight line of known distance was drawn over the ruler to facilitate subsequent analysis. Subsequently, a color thresholding system was applied to separate the background from the plant image.
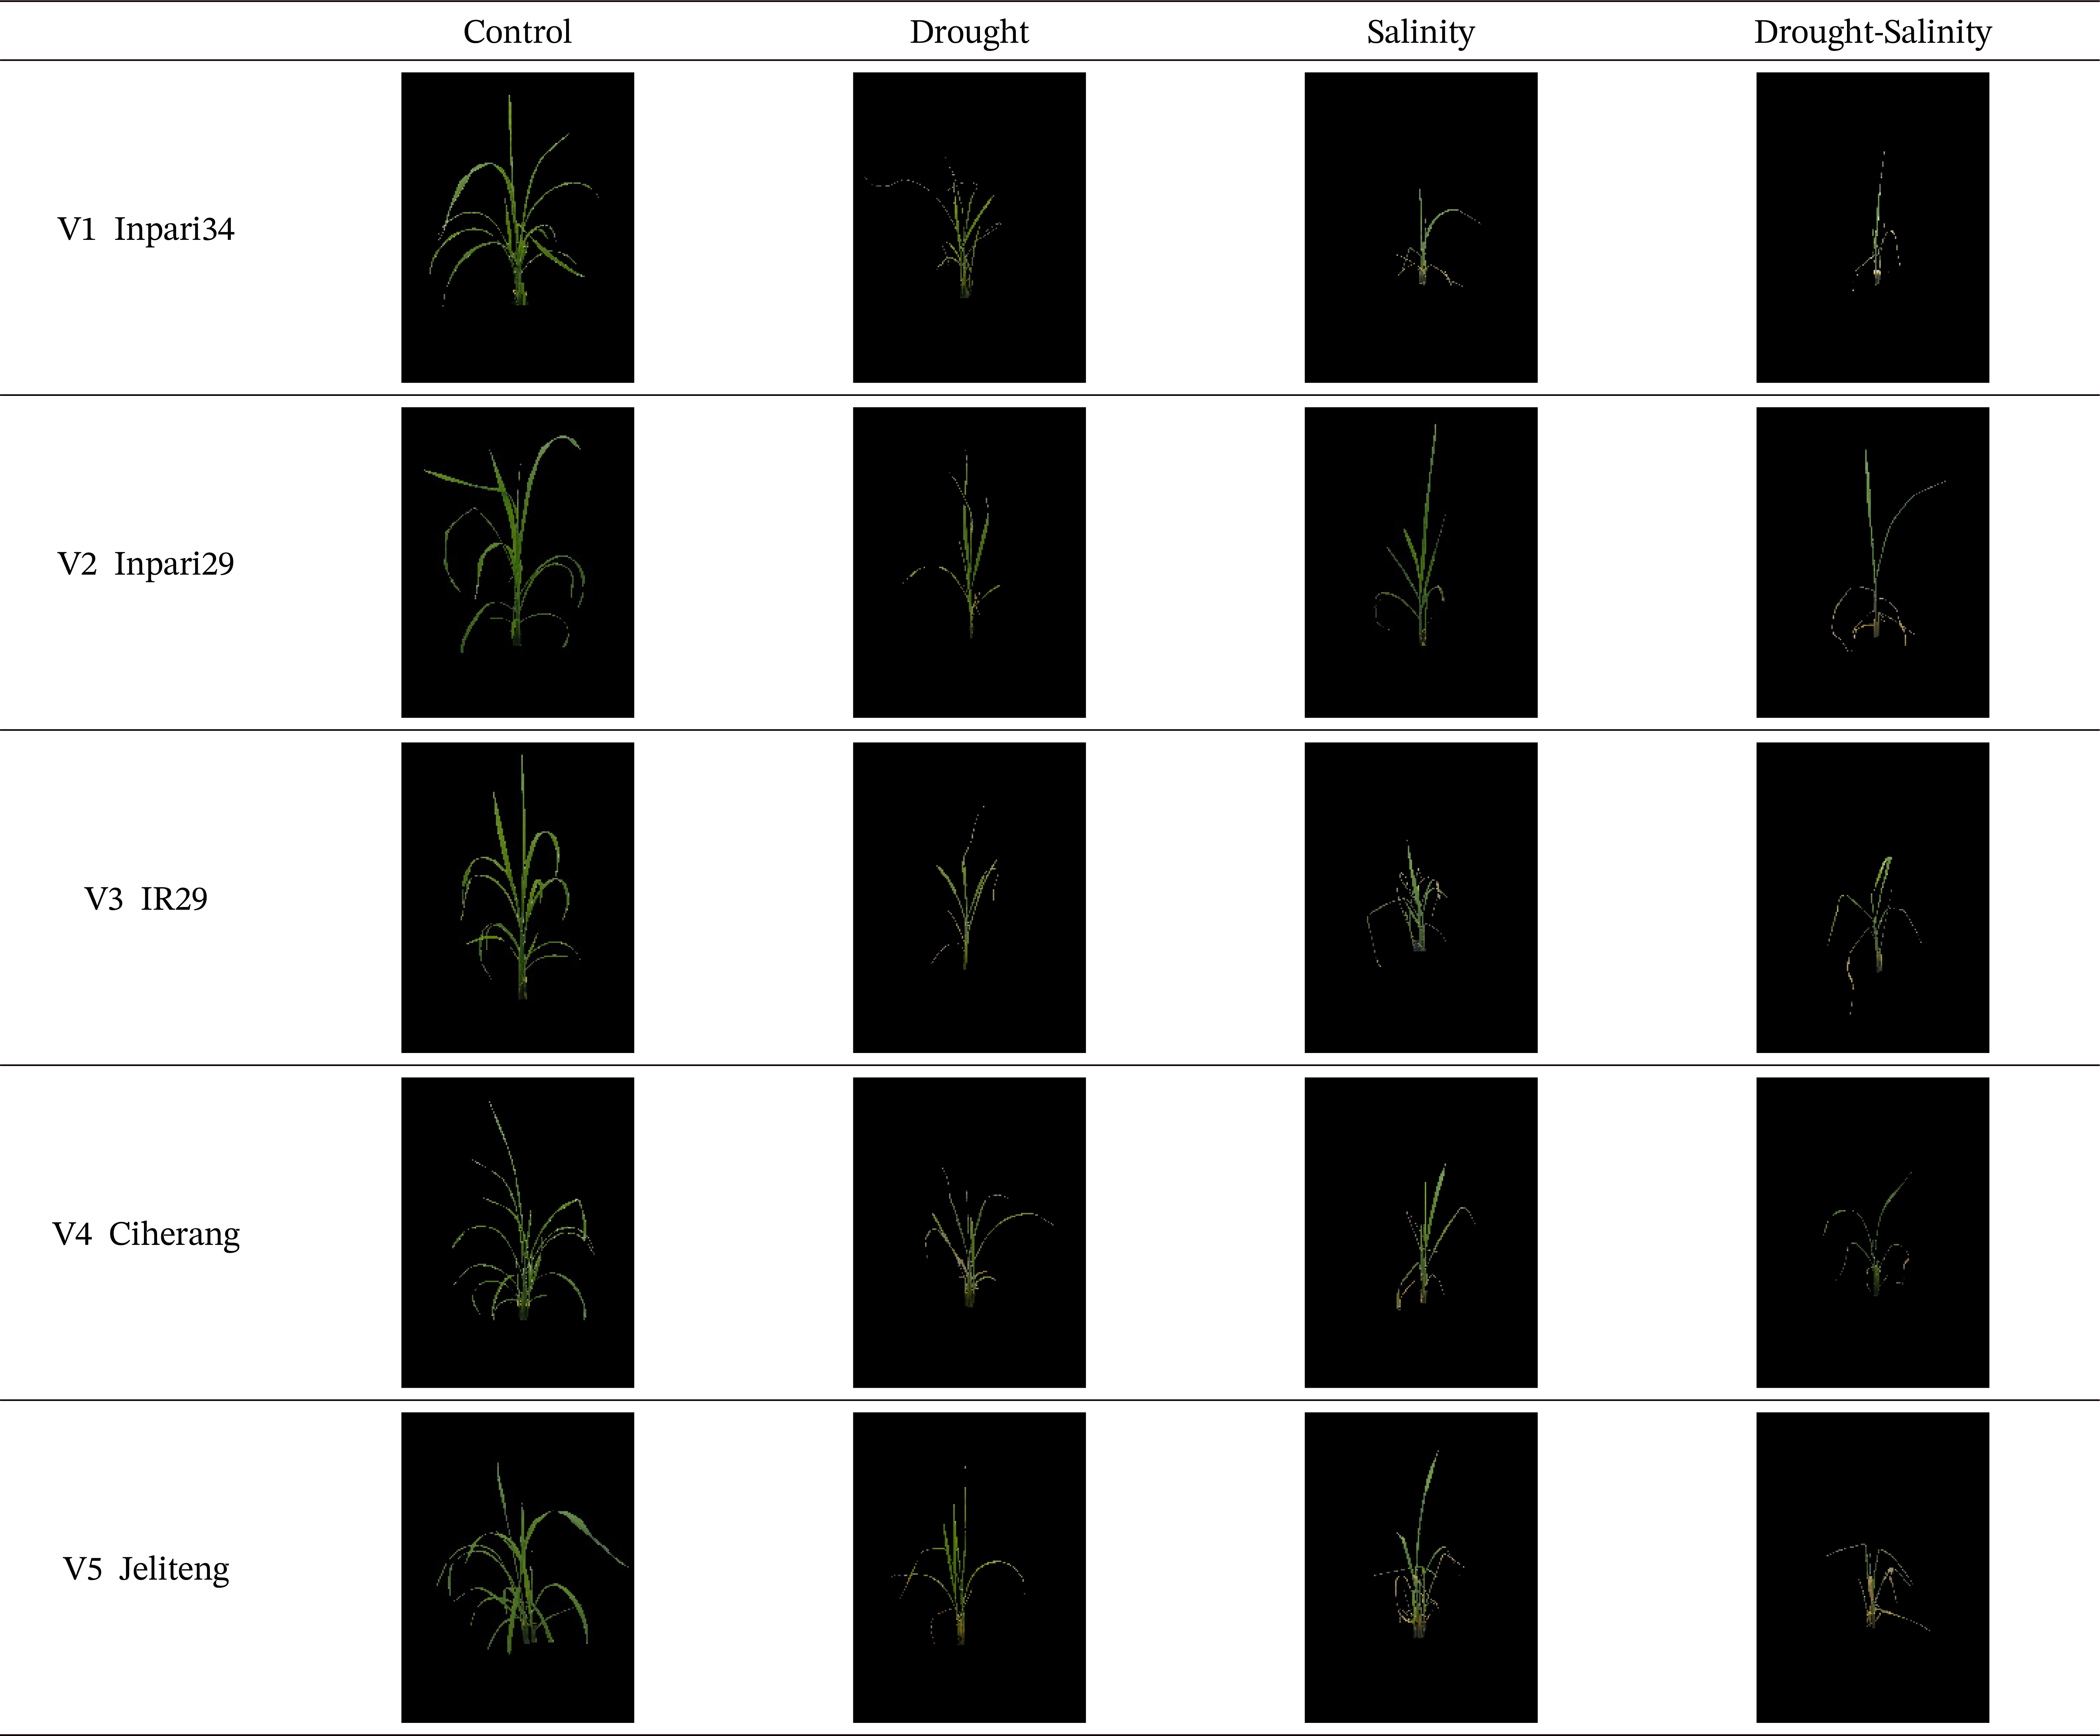
To quantify the greenness of specific or entire plant regions, RGB images were converted to a Hue Saturation and Brightness (HSB) system. In this study, capturing was performed at 35 DAP, as presented in
Fig. 1. The area of each or whole plant was converted from pixels to cm² using a known scale.
Table 1 describes the observation derived from the image.
ANOVA (analysis of variance) was performed using STAR 2.0.1 software (International Rice Research Institute [IRRI], Los Banos, Laguna, Philippines) to analyze the raw data and evaluate the effect of morpho-colorimetric stress changes while considering heritability values. The broad sense heritability (H2) for each trait under different stress conditions was estimated based on the ANOVA result, adopting the following formula.
where σ2g = genotypic variances, σ2p = phenotypic variances, σ2e is the error variance, and r is the number of replications.
The characters with significant interaction between genotypes and treatment in the ANOVA, alongside high heritability value were further analyzed by principal component analysis (PCA) using R Studio. Subsequent analyses were based on the stress tolerance index (STI) value of each character on individual stress treatment (
Anshori et al. 2019). Finally, STI is calculated using the following formula ingh (
Singh et al. 2015);
Yp is the character response under a normal environment, Ys is the character response in a stressful environment, and Ῡp is the average genotype response to characters in a normal environment.
To explore the relationship between morphometric and colorimetric characteristics, Pearson correlation was performed using the corrplot functions provided by the corrplot package in R (
Bhatta et al. 2021).
Results
Degree of variation in morphometric and colorimetric traits under drought, salinity, and the combination drought-salinity
Morphometric and colorimetric traits from image-based plant phenotyping of 5 cultivars were examined under drought, salinity, and combined drought and salinity stress conditions. ANOVA showed significant differences among cultivars, stress treatment, and their interaction (V*T) for most of the studied parameters (
Table 2). Among the morphometric characters, including area, convex hull, bounding area, perimeter, centermassy, and eccentricity, significant differences (
p<0.05) were observed between genotypes under drought, salinity, and interaction stress. The colorimetric indices, namely CIVE, VARI, RGBVI, MGRVI, NDI, GLI, and NGRDI, also had a significant effect (
p<0.05) in the interaction (V*T). These results suggest that the genetic basis of the trait under study can be exploited for further breeding programs. The V*T interaction provided a deeper insight into the adaptability of varieties under stress conditions.
The heritability values were in the high category (range 57% - 89%). Under stress treatment, centermassy showed the highest degree (89%), followed by area, TBR, and bounding area. The colorimetric indices such as MGBVI (80.99), VARI, and NGDRI (80.40, respectively) showed better heritability responses than others, as presented in
Table 2. Furthermore, the coefficient of variation (CV) was normal for most of the parameters studied, ranging from 0.15% to 25.97%, as detailed in
Table 2. CV values were also often used by plant breeders as an alternative method in the selection process, providing an overview of the diversity within a population.
The characters significantly affected by variety were further analyzed with STI, as shown in
Table 3. Based on the morphometric character of STI, Inpari 29 (V2) had a better value than IR29 (V3), serving as a tolerant control compared to the sensitive control.
Based on the PCA analysis of the morphometric character, PC1 and PC2 were optimal principal components in explaining the diversity of morphometric screening data. The cumulative proportion in this screening was 97%, as detailed in
Table 4. Meanwhile, PC1, as the main PC, accounts for 94% of the diversity in initial germination data.
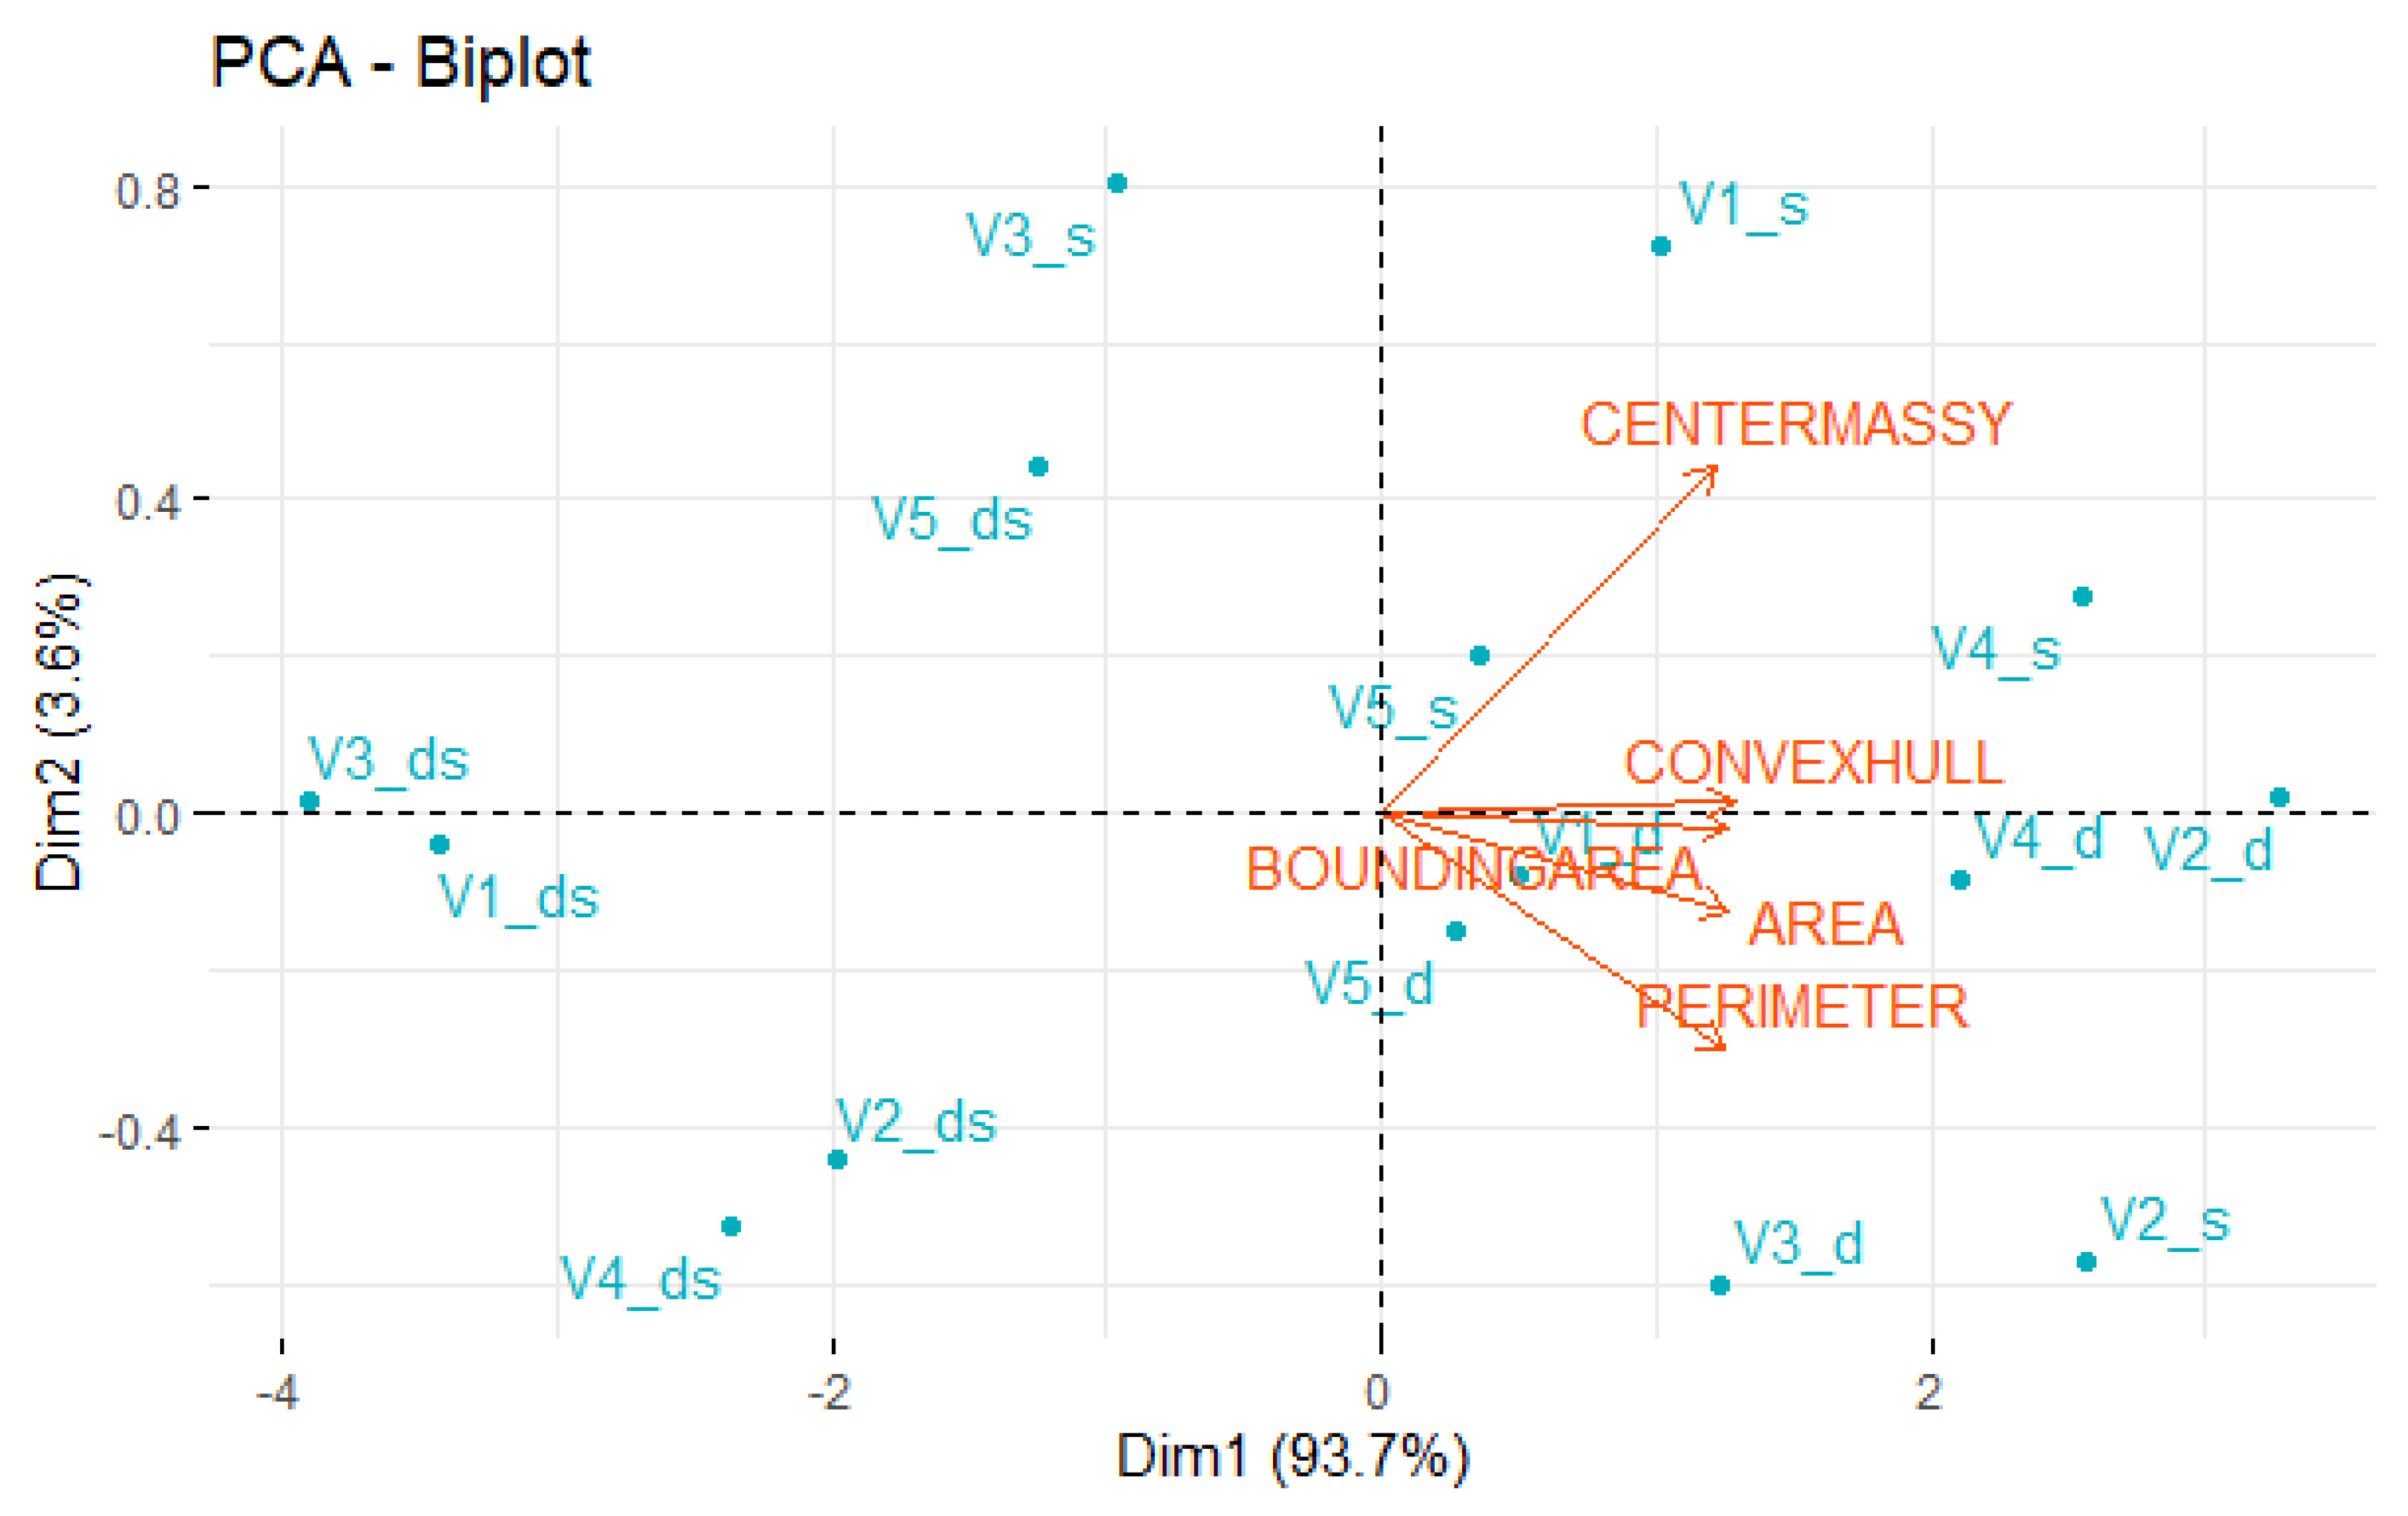
The PCA analysis based on STI in morphometric traits showed that the first two principal component vectors contribute 93.7 (PC1) and 3.6% (PC2) to the total variation, describing a cumulative variance of 97.2%. The TBR trait followed by compactness had a strong positive correlation in Dim1. Similarly, a centermassy followed by a convex hull, bounding area, area, and perimeter form a cluster with a strong correlation in Dim1.
The genotypes present in the two quadrants showed a maximum expression of morphometric traits. This PCA analysis separates the response of genotypes according to stress treatment and severity. Genotypes subjected to a single stress, drought (d), and salinity (s), were in the same cluster on the right plane of the plot, showing a consistent response to most morphometric traits (
Fig. 2). On the left plane of the plot, genotypes experiencing the combination of drought and salinity (ds) fell in the lower and upper clusters for the tolerant and sensitive varieties, respectively.
The results of STI on colorimetric characters in the seedling stage of drought, salinity, and combined stress are shown in
Table 5. Similar to the morphometric characters, the analysis showed that Inpari 29 (V2) had a better STI value than IR29 (V3) for all colorimetric characters of the seedling screening.
The results of the PCA analysis of the colorimetric characters showed that PC1 and PC2 were the optimal PCs for identifying the diversity among the morphological characters of the seeds, with a cumulative proportion of 99%. Meanwhile, PC1, as the main PC, contributed to 98% of the diversity.
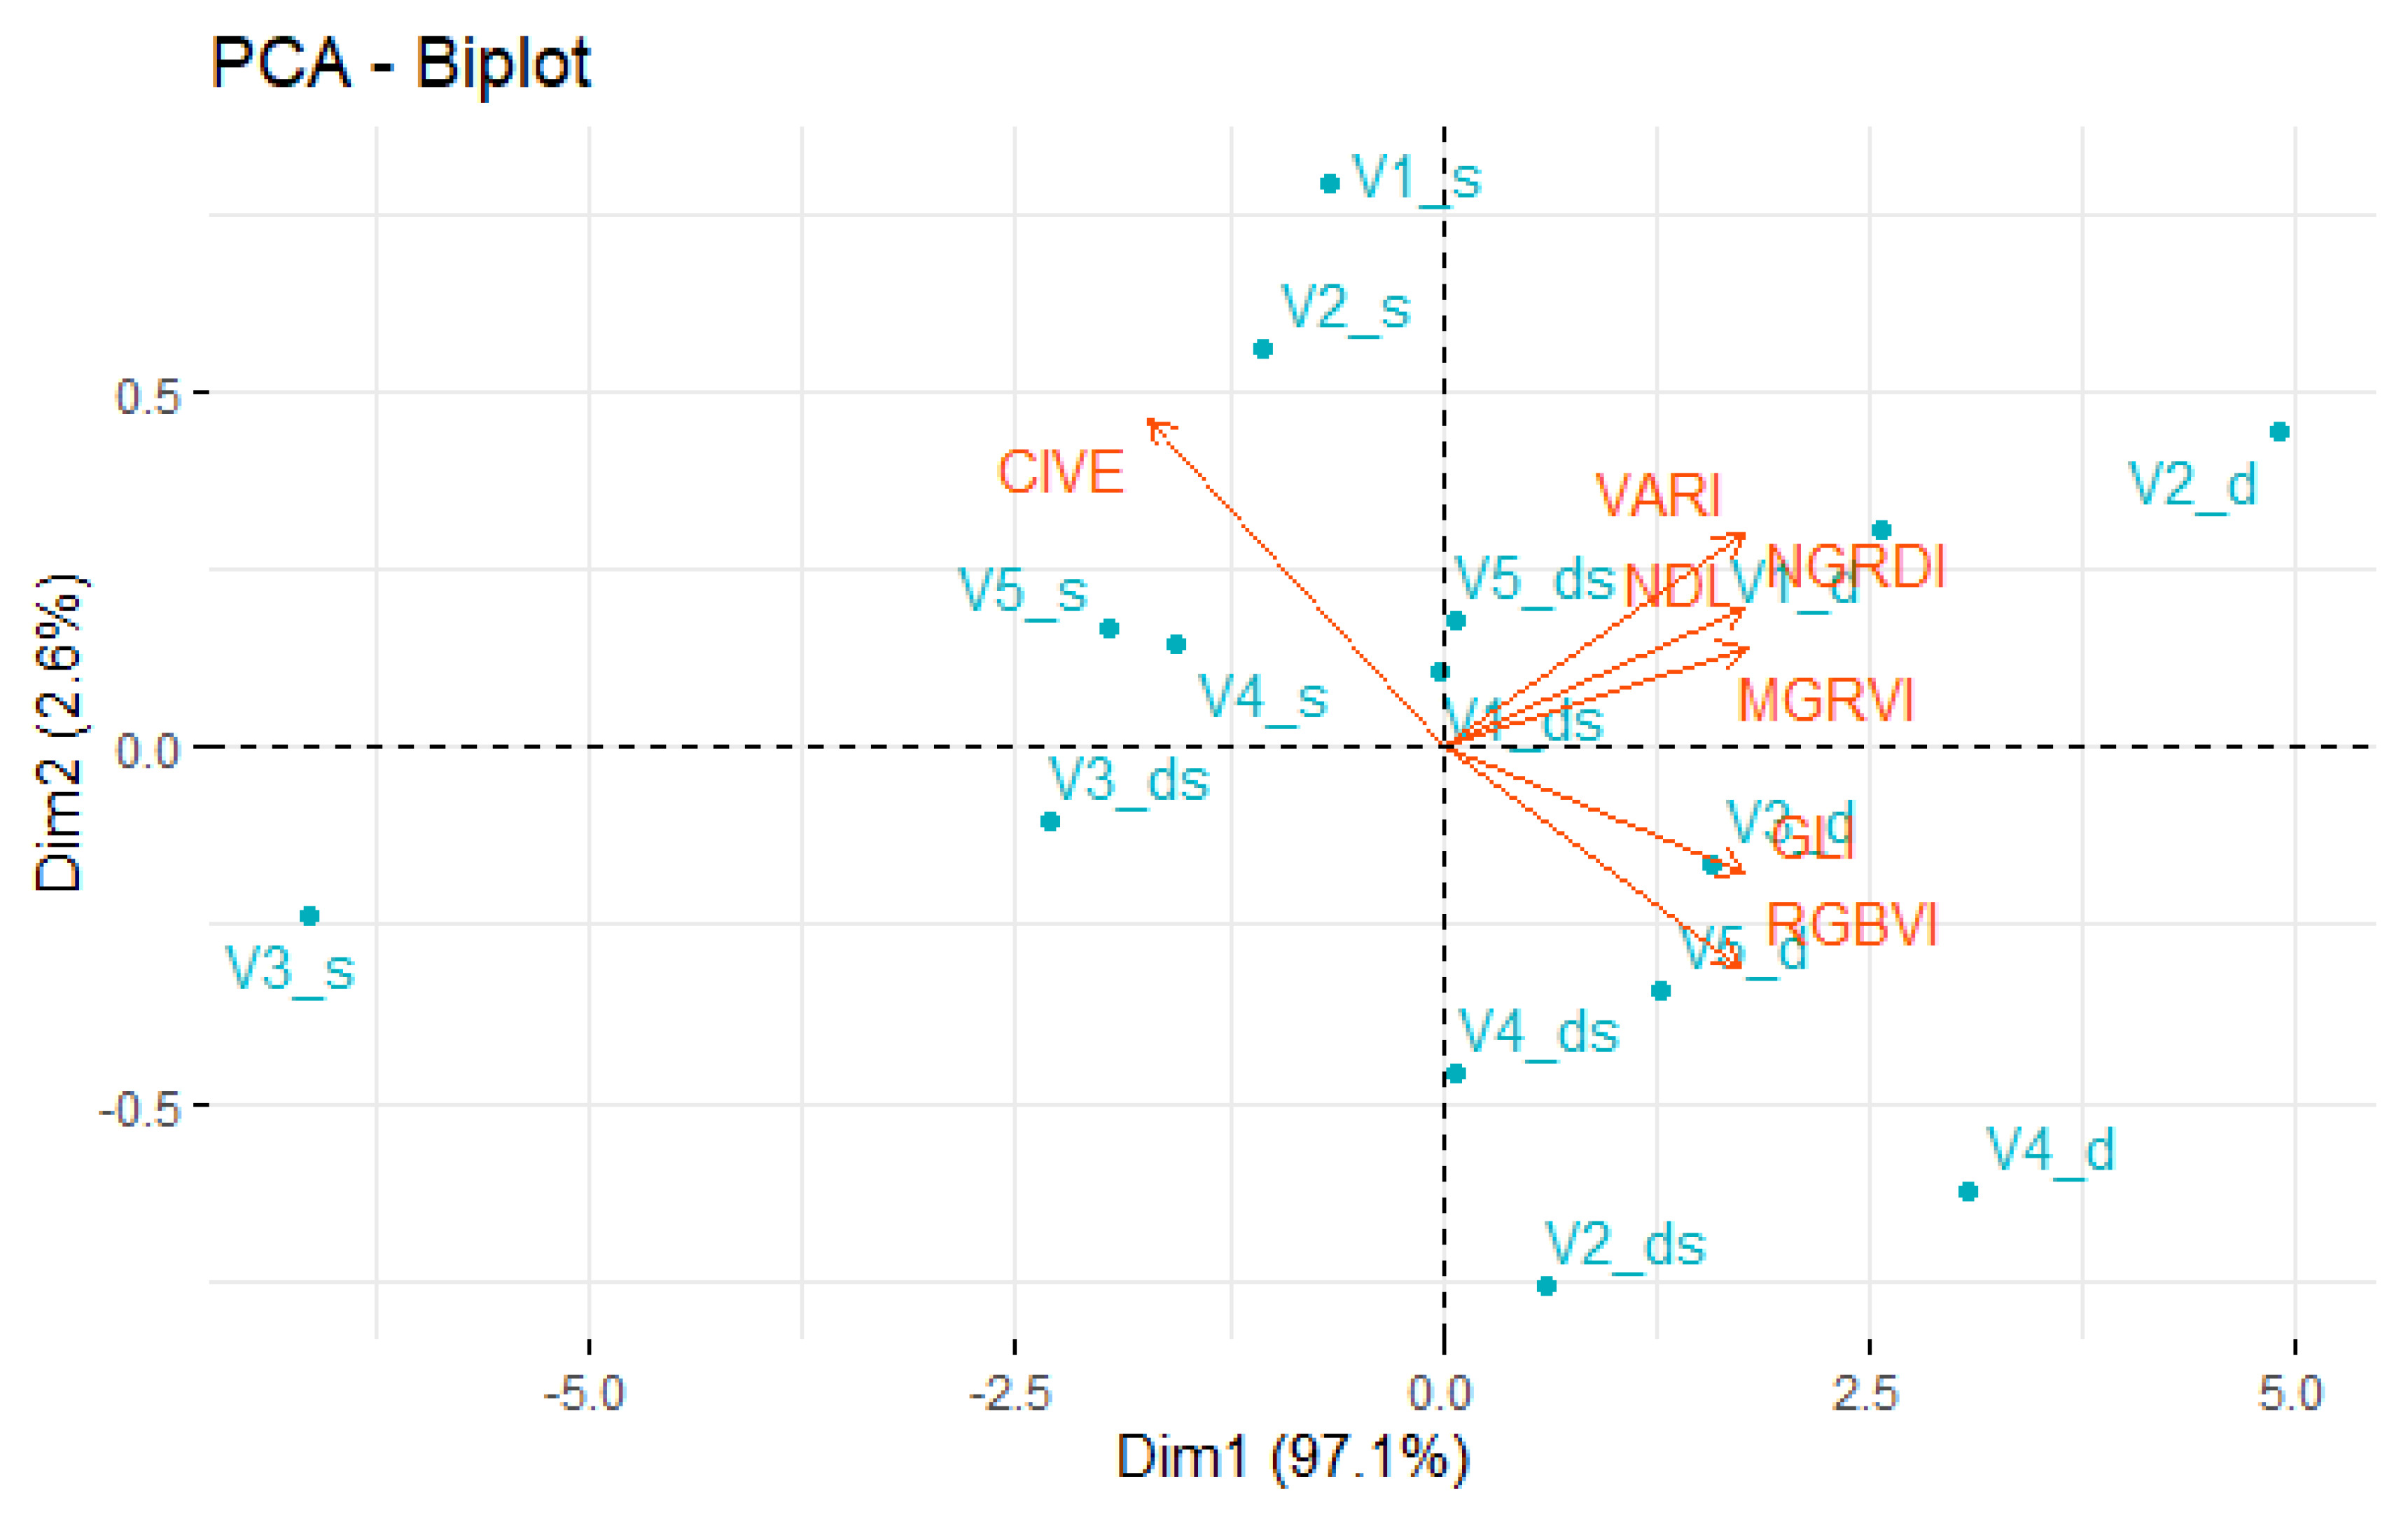
The STI-based PCA analysis of colorimetric traits showed that the first 2 principal component vectors contributed 97.9% (PC1) and 1.9% (PC2) (
Table 6). Among the STI colorimetric traits, VARI, followed by NDI, NDRDI, and MGRVI, had a strong positive correlation with dimension 1. Similarly, RGBVI, followed by GLI, also became a cluster with a strong correlation in Dim1. However, CIVE showed an inverse correlation, which is on Dim 2.
Similar to the morphometric traits, the PCA analysis showed the ability to separate the response of genotypes based on stress treatment and severity. The genotypes from the combined stress of drought and salinity (ds) occupied the middle of the point 0. Genotypes subjected to drought treatment (d) were positioned distantly from the plane of the plot, while those under salinity treatment (s) were situated to the left. In this result, the tolerant pattern appeared on the right, and as the point position shifted further to the left, the genotype indicated sensitivity, in line with the positioning of most morphometric traits, as shown in
Fig. 3.
The correlation matrix showed significant traits under drought, salinity, and combined drought-salinity stress. Among the morphometric traits, convex hull, bounding area, perimeter, and centermassy had a significant strong positive correlation (r>0.90, p<0.01). Similarly, almost all characters in the colorimetric traits, namely VARI, NGDRI, MGRVI, NDI, VEG, RGBVI, and GLI showed a significant positive association, with the exception of CIVE. However, the correlation between morphometric traits such as perimeter, area, and convex hull with colorimetric traits including VARI, NGDRI, and MGRVI, had slightly positive significance (r>0.5, p<0.01).
Discussion
To show the traits associated with drought and salinity tolerance, colorimetric and morphometric traits were assessed using imaging techniques on 5 varieties previously documented (bblitbang.go.id). This study aimed to determine the potential of this methodology to differentiate these varieties at an early stage of plant growth. The ANOVA suggests that morphometric traits such as area, convex envelope, bounding area, perimeter, and centermassy, have high sensitivity to stress conditions in the seedling phase. Similarly, colorimetric traits, including CIVE, VARI, RGBVI, MGRVI, NDI, GLI, and NGRDI were significantly influenced by varieties, treatments, and the interaction of varieties and stress treatment variance. The result is also supported by the coefficient of variance (CV) values, which can provide an overview of the diversity within the population (
Bhatta et al. 2021;
Kumar et al. 2020), with a value below 26%.
This is in line with the study by Alharbi et al. (2019) that the smaller the CV value, the stronger the character selection in predicting plant populations at different growth stages. An interaction variance considering heritability and CV can be an early indicator of selection criteria (
Fadhli et al. 2023;
Sakinah et al. 2021). Therefore, characters having significant interaction in the ANOVA are considered crucial for further analysis.
Variance interaction refers to the situation where genotypes respond differently to several environmental conditions. In other words, the effect of a genotype on a particular trait varies depending on the environment (
Hudson et al. 2022), which is the basis for trait selection (
Fadhli et al. 2023). In addition, rice breeders often use heritability and CV as an alternative approach during the selection process to assess the amount of variability withi assess the extent of variability within an a population.(Roy et al. 2020) In this study, compactness, PAR, TBR, and VEG did not show a significant interaction, leading to their exclusion from further analysis.
In addition, all of these traits had a higher percentage of heritability, with more than 50% of the evidence coming from controlled genes. Heritability is a statistical measure quantifying the extent to which heritable variables contribute to the total variation of a trait within a population. In rice breeding, it helps breeders assess the possibility of a particular trait being inherited from one generation to the next. A high heritability (>75%) shows a significant influence of genetic factors on the expression of traits. This allows plant breeders to determine the direction of selection and serves as a guide in the process (
Bhatta et al. 2021;
Fadhilah et al. 2022;
Fadhli et al. 2023;
Wening et al. 2019). While eccentricity had a significant interaction (V*T), a moderate heritability value of 57% was obtained, leading to exclusion from further analysis.
The STI used in plant breeding and agronomy serves as a valuable tool for assessing the performance of crops, including rice, specifically under adverse environmental conditions such as salinity and drought. This helps breeders to identify and select crop varieties with improved resistance to the stressors (
Fadhilah et al. 2022). In this study, categorization was performed using values of 0-0.5, 0.5-1.0, and more than 1.0, for sensitive, moderate, and tolerant varieties, respectively. Therefore, centermassy, CIVE, RGBVI, and GLI are potential selection characters for screening, specifically in drought stress. However, based on the STI value on the morphometric and colorimetric traits, all the characters could easily discriminate the responses between 'Inpari 29' (V2) and 'IR 29' (V3) as tolerant and sensitive control, respectively screening.
The use of STI was reported by Anshori et al. (2019),
and Farid et al. (2021) in rice salinity,
and Bhatta et al. (2021) in rice drought stress to evaluate tolerance in a genotype. The comparison between the yield of a specific crop genotype under drought stress and normal conditions was conducted, with the disparity between the two used to establish the index (
Anwaar et al. 2020). This approach makes the selection more representative compared to direct selection. Using stress tolerance indices, well-developed centrometry was observed in tolerant genotypes and comparatively less centrometry in sensitive counterparts under drought and salinity stress. A similar result was reported by (
Kim et al. 2020) in rice drought stress, where morphometric traits were identified as the best predictors of drought resistance. Additionally, it was discovered that colorimetric indices, specifically CIVE, RGBVI, and GLI, were essential for discriminating genotypes under drought stress.
This result is in line with Zhou et al. (2018) , where both NGRDI could reflect differences in yellow components and were helpful in quantifying plant stress tolerance. Therefore, the STI values were adopted to classify the phenotypic characteristics of images through PCA analysis.
This study showed that PC1 and PC2 collectively accounted for over half of the total variation in PCA analysis of morphometric and colorimetric traits. These principal components played a crucial role in accurately classifying both the traits and genotypes into distinct groups (
Kakar et al. 2019). For morphometric traits, centermassy is in the first cluster and has the highest contribution, followed by the convex hull.
This is in line with the study reported by Kim et al. (2020) that in the drought stress test, centermassy was used to express leaf desiccation and convex hull accurately represented drought variance. Furthermore, other traits such as area, perimeter, and bounding area are in the same cluster. Based on genotypes clustering, the varieties from drought stress are in the same cluster with morphometric traits, showing a better response to salinity stress and a combination of drought and salinity. This is also supported by the results of STI analysis.
Laraswati et al. (2021),
and Sakinah et al. (2021) reported that the area was significantly reduced in response to combined salt and drought stress in rice, as it represents the smallest polygon area comprising both the plant and the height, contributing to an overall slowing of plant development.
In the colorimetric characters, the results of PCA analysis show that VARI, NDI, NGRDI, and MGRVI are in the first cluster.
This is in line with the study by Han et al. (2021) that VARI and NDI can estimate plant height and biomass using the area. Shoot biomass is the main character in assessing drought and salinity stress in rice (
Sakinah et al. 2022). In the second cluster, the GLI and color indices were present, appearing in moderately tolerant genotypes. The colours were mainly related to vegetation cover and not directly tied to biomass (
Tilly et al. 2015). Conversely, the CIVE trait in the PCA analysis showed an inverse correlation with the other latent variables. This can be observed from the PC1 value, where CIVE is the only parameter with a positive value. However, the negative values in the other parameters show the direction of the data variance, not the absolute value. The direction of data variance shows that RGB imaging can be effectively used to digitally quantify rice traits in a non-destructive manner, contributing to the accurate and rapid selection of genotypes in drought salinity tolerance breeding. Color classification, an essential part of digital image analysis, is critical for identifying green and non-green in rice (
Bhatta et al. 2021) and tissues (
Joshi et al. 2021). Furthermore, RGB imaging techniques applied in plant phenotyping have provided some opportunities in crops under different growing conditions, such as tomato (
Rossi et al. 2022;
Stutsel et al. 2021), maize (
Ge et al. 2016;
Zhuang et al. 2017), and rice (
Bhatta et al. 2021;
Hairmansis et al. 2014;
Kim et al. 2020).
Correlation analysis between morphometric and colorimetric traits of stressed rice plants showed that perimeter, area, convex hull, and bounding areas were correlated with VARI, NGDRI, MGRVI, and NDI. According to the results, an increase in shoot growth (morphometric) significantly affected plant color in response to early-stage stress (
Fig. 4). The colour manifests as darker or more vibrant green hues due to increased chlorophyll production, a phenomenon influenced by several factors (
Ma et al. 2020;
Shah et al. 2017).
Borrell et al. (2014),
and Fahad et al. (2017) reported that under drought stress, leaves at the seedling stage may become darker green as the plant attempts to conserve water. Conversely, salinity stress can induce varying shades of green or even lead to the yellowing of leaves depending on the limited nutrients (
Hossain et al. 2022). This is in line with the results of PCA clustering analysis based on colorimetric parameters. Varieties under drought stress and the combination of drought and salinity clustered in the upper right and lower right segments are categorized as tolerant. It is important to acknowledge that this classification persists despite the plant stress response resulting in greener leaves. Meanwhile, varieties under salinity stress are included in the sensitive group due to the characteristic yellowing of leaves and low color index values.
Conclusions
In conclusion, this study showed the immense potential of using image-based phenotyping selection criteria during the seedling stage through tolerance indices in the context of drought and salinity stress in rice. The results suggested that both morphometric (area, convex hull, bounding area, perimeter, centermassy) and colorimetric (CIVE, VARI, RGBVI, MGRVI, NDI, GLI, NGRDI) can be adopted as selection characters. Based on the STI value, centermassy, CIVE, RGBVI, and GLI had the potential to identify and select plant varieties. Therefore, colorimetric traits were considered better predictors of drought salinity tolerance at the seedling stage. These outcomes can be further applied to breeding programs to help rice breeders and other scientists in screening. The integration of image-based characteristics facilitated the selection of drought-salinity tolerant rice breeding lines for variety development and related study.
Acknowledgments
The authors are grateful to the Government of Indonesia, through the Ministry of Education and Culture, for providing the Master to Doctoral Acceleration Program (PMDSU) and Enhancing Quality of International Publication (PKPI) study grants. The authors are also thankful to Riccardo Rossi, PhD; Department of Agriculture, Food, Environment and Forestry (DAGRI), Universita Degli Studi di Firenze, for assistance with image data processing.
Fig. 1Image-based phenotyping of rice varieties under stress treatment at 35 DAP in hydroponic.

Fig. 2Principal component-based biplot analysis of STI morphometric traits of rice under drought (d), salinity (s), and drought-salinity (ds) stress. V1: Inpari 34, V2: Inpari 29, V3: IR29, V4: Ciherang, and V5: Jeliteng.

Fig. 3Principal component-based biplot analysis of STI colorimetric traits of rice under drought (d), salinity (s), and drought-salinity (ds) stress. The direction and length of the vector represent trait contribution to the first 2 components of the PCA. V1: Inpari 34, V2: Inpari 29, V3: IR29, V4: Ciherang, and V5: Jeliteng.

Fig. 4Pearson correlation matrix of image-based traits in drought, salinity, and drought-salinity stress. Color (blue-positive correlation; red-negative correlation) intensity and the circle size are proportional to the correlation coefficient.
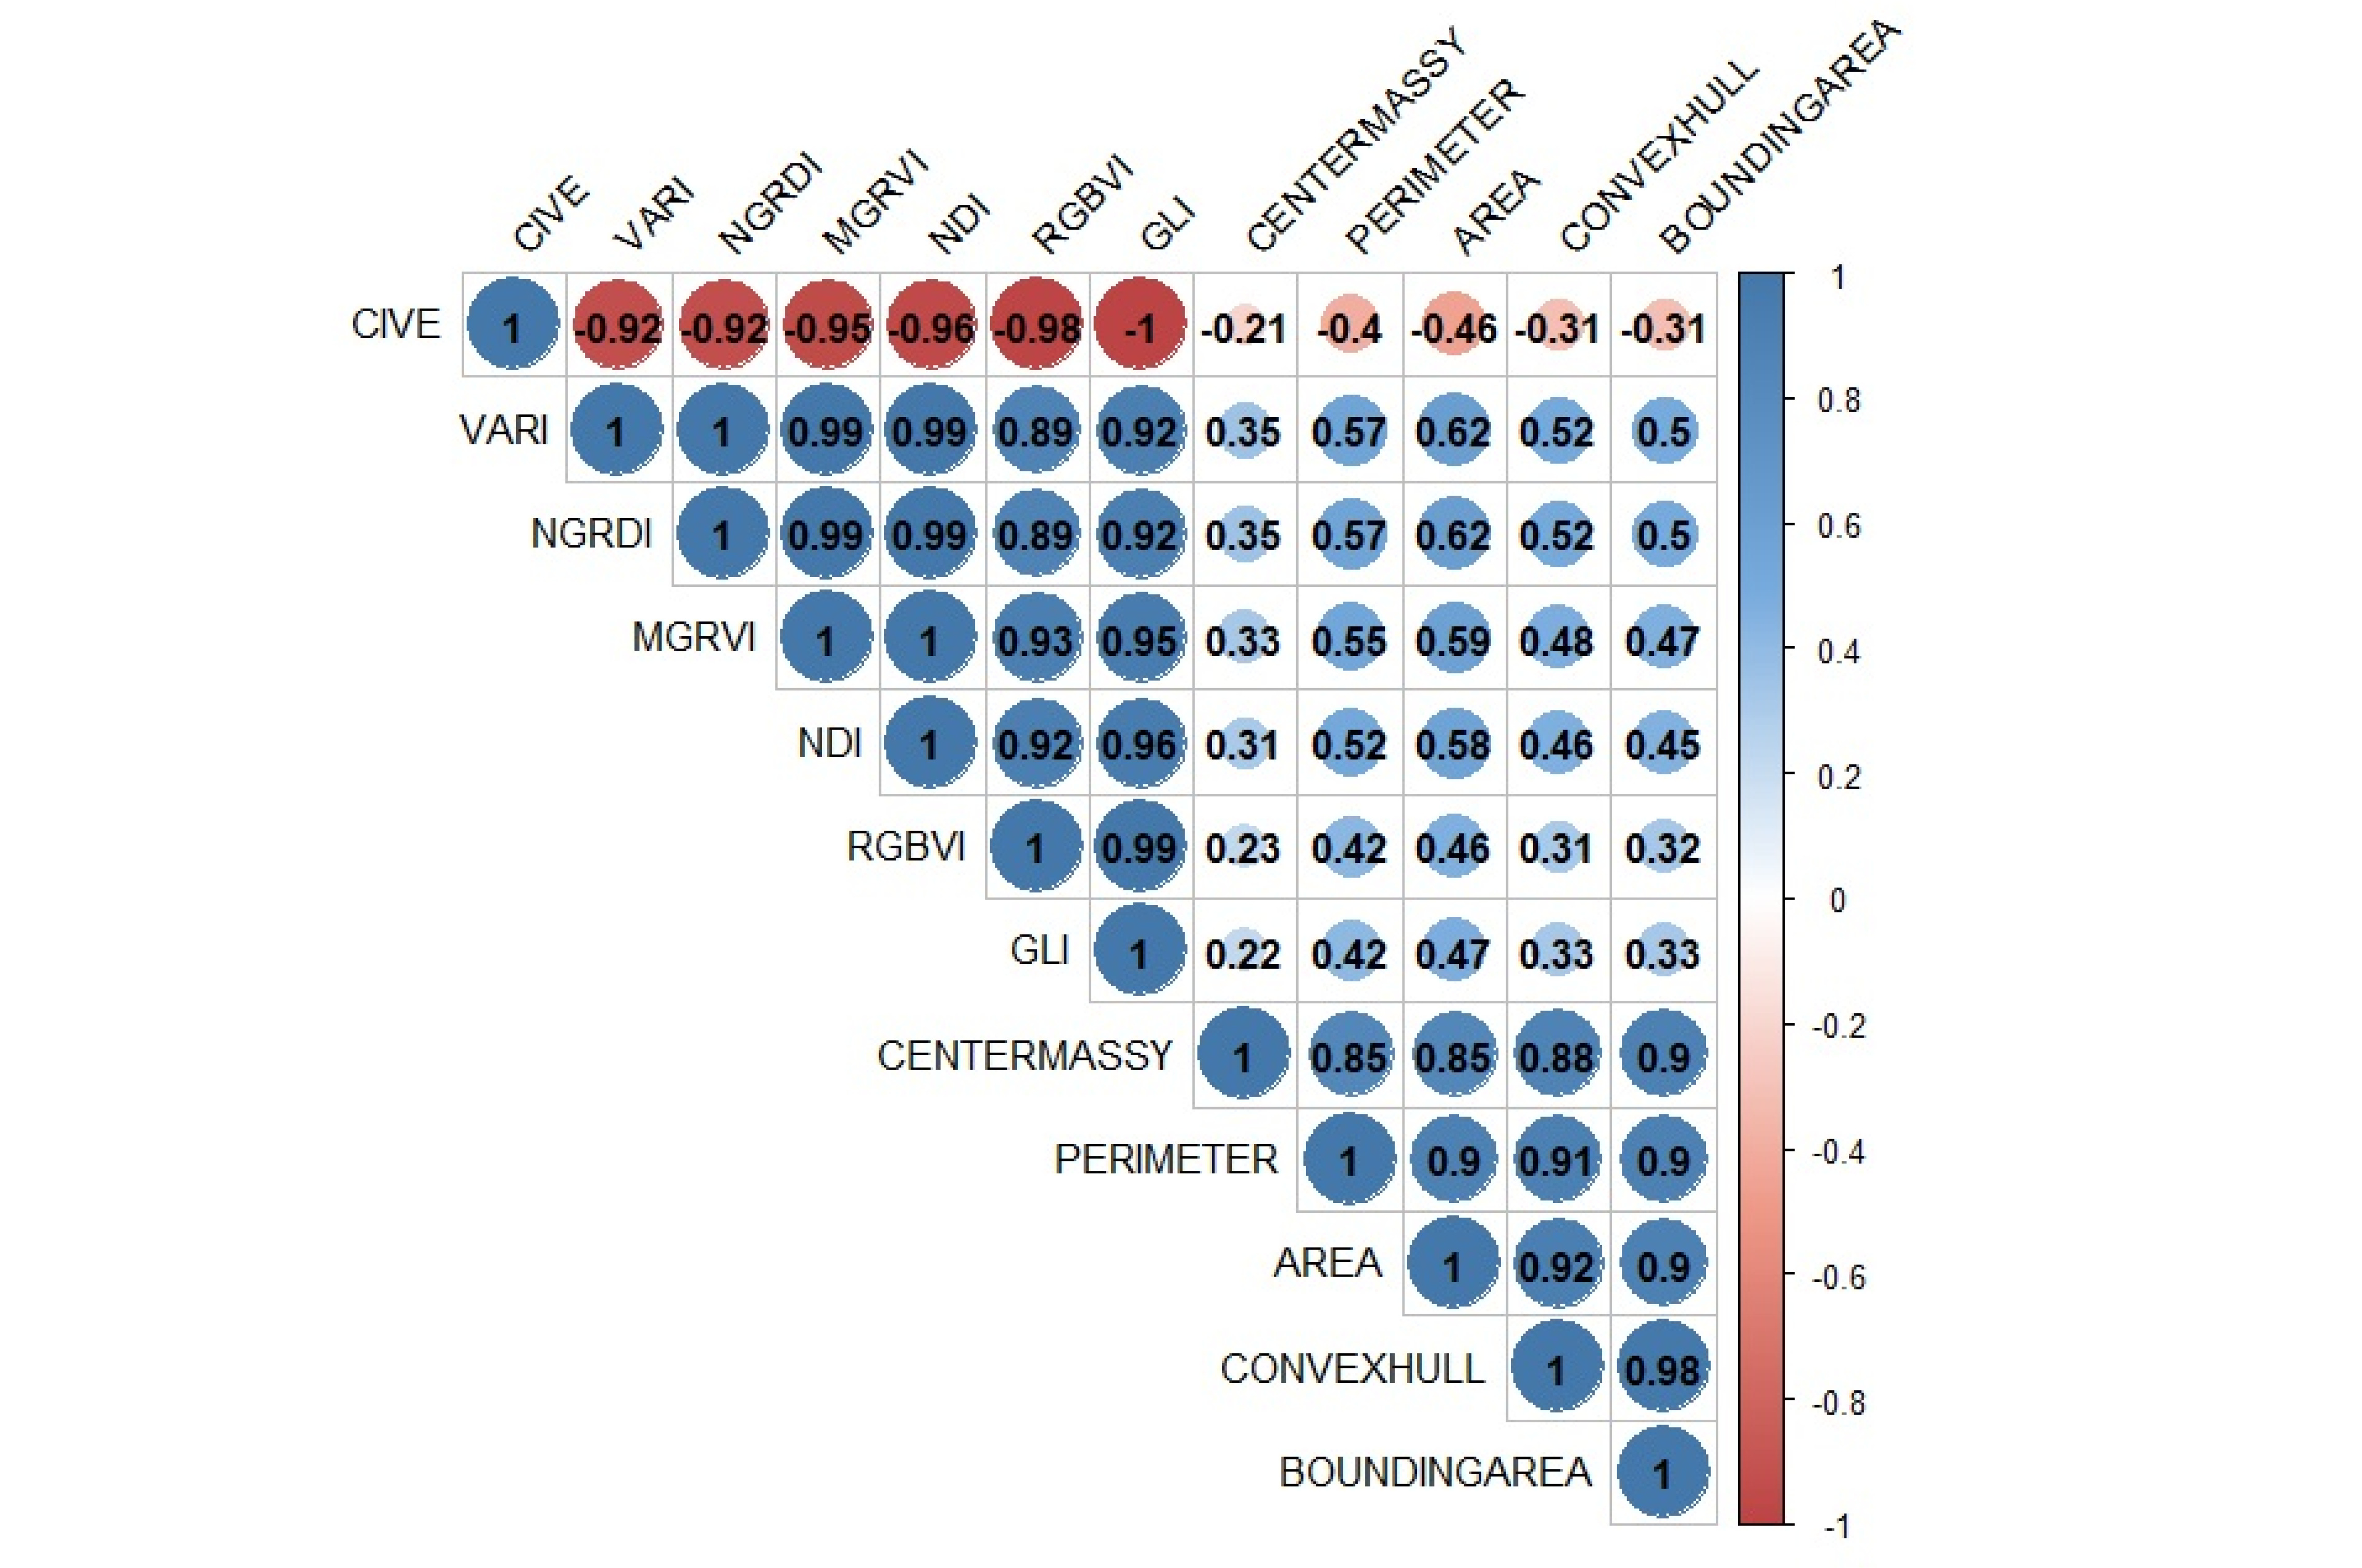
Table 1The description of the character groups in this study with their mathematical formulas.
Table 1
|
Types |
Description |
Formula |
|
|
Morphometric Traits |
|
Area |
The area of a plant is denoted by the number of leaf pixels positioned above it per centimeter. |
|
Convex hull |
The convex hull area denotes the smallest region bounded by an object's outer contour. The area of the convex hull was calculated using the pixel count per centimeter of the convex hull. |
|
Bounding area |
The plant's bounding rectangle was the smallest rectangle that completely contained the plant. The value was determined by multiplying its width and height. |
|
Compactness |
The object area divided by the convex hull area equals compactness. This can express plant density, including tillers and leaves. |
|
Perimeter |
The measurement of the object's exterior boundary length. |
|
Centermassy |
The Centre of mass Y shows the center of gravity of the y-axis. |
|
Eccentricity |
Eccentricity is a mathematical parameter associated with the conic section. The value is specified between 0 and 1, with 0 representing a circle and 1 representing a line, to show the form of the plant. |
|
PAR |
Perimeter Area Ratio |
Plant Perimeter/Total Projected Shoot Area |
|
TBR |
Total plant area/bounding rectangle area ratio |
Total projected plant area/bounding rectangle area |
|
|
Colorimetric Traits |
|
|
VEG |
Vegetation Index |
g/((r0.667)xb0.333) |
|
CIVE |
Color Index of Vegetation Extraction |
0.441R-0.811G+0.385B+18.787 |
|
VARI |
Visible Atmospherically Resistant Index |
(g-r)/(g+r-b) |
|
RGBVI |
Red Green Blue Vegetation index |
(G2-RxB)/(G2+BxR) |
|
MGRVI |
Modified Green Red Vegetation Index |
(G2-R2)/(G2+R2) |
|
NDI |
Normalized Difference Index |
(R-G)/(G+R) |
|
GLI |
Green Leaf Index |
(2xG-R-B)/(R+2xG+B) |
|
NGRDI |
Normalized Green-Red Difference Index |
(G-R)/(G+R) |
|
|
Additional Information of Colorimetric Traits Formula |
|
|
R |
Digital number of red channels |
|
|
G |
Digital number of green channels |
|
|
B |
Digital number of blue channels |
|
|
r |
Normalized red |
R/(R+G+B) |
|
g |
Normalized green |
G/(R+G+B) |
|
b |
Normalized blue |
B/(R+G+B) |
Table 2Mean squares and heritability of rice characters under drought and salinity stress.
Table 2
|
No |
Characters |
31 DAP |
|
|
Mean Square |
CV (%) |
Heritability |
|
|
Variety |
Treatment |
V*T |
e |
|
Morphometric traits |
|
|
1 |
Area |
16646.512**
|
66027.109**
|
2322.696**
|
706.950 |
25.030 |
88.257 |
|
2 |
Convex hull |
386398.594**
|
1677417.279**
|
52635.995*
|
25487.068 |
25.970 |
82.518 |
|
3 |
Bounding area |
1017435.328**
|
3519774.940**
|
135749.535*
|
60373.586 |
24.880 |
84.087 |
|
4 |
Compactness |
0.021**
|
0.008**
|
0.002 |
0.001 |
21.690 |
82.500 |
|
5 |
Perimeter |
26989.570**
|
127024.545**
|
6093.058**
|
2576.866 |
19.100 |
75.950 |
|
6 |
Centermassy |
342.814**
|
715.973**
|
31.627**
|
13.213 |
15.800 |
89.264 |
|
7 |
Eccentricity |
0.064**
|
0.076**
|
0.026*
|
0.013 |
14.450 |
57.770 |
|
8 |
PAR |
0.181**
|
0.423**
|
0.014 |
0.012 |
24.920 |
82.664 |
|
9 |
TBR |
0.009**
|
0.006**
|
0.001 |
0.001 |
21.910 |
85.000 |
|
|
Colorimetric traits |
|
|
10 |
VEG |
0.287**
|
0.426**
|
0.059 |
0.040 |
10.490 |
67.649 |
|
11 |
CIVE |
0.009**
|
0.020**
|
0.002*
|
0.001 |
0.150 |
76.699 |
|
12 |
VARI |
0.039**
|
0.104**
|
0.006*
|
0.003 |
23.190 |
80.405 |
|
13 |
RGBVI |
0.036**
|
0.104**
|
0.007**
|
0.003 |
9.420 |
80.292 |
|
14 |
MGRVI |
0.072**
|
0.202**
|
0.013**
|
0.005 |
21.190 |
80.999 |
|
15 |
NDI |
0.023**
|
0.057**
|
0.004*
|
0.002 |
23.240 |
78.652 |
|
16 |
GLI |
0.017**
|
0.042**
|
0.003*
|
0.001 |
12.660 |
79.104 |
|
17 |
NGRDI |
0.039**
|
0.104**
|
0.006*
|
0.003 |
23.190 |
80.405 |
Table 3Stress tolerance index (STI) of morphometric characters for drought, salinity, and drought-salinity stress.
Table 3
|
Treatment |
Variety |
Area |
Convexhull |
Bounding
Area |
Perimeter |
CentermassY |
|
Drought |
V1 |
0.705mt |
0.661mt |
0.659mt |
0.858mt |
0.907mt |
|
V2 |
0.920mt |
0.905mt |
0.976mt |
1.002t |
1.072t |
|
V3 |
0.698mt |
0.807mt |
0.867mt |
0.891mt |
0.833mt |
|
V4 |
0.773mt |
0.847mt |
0.917mt |
0.922mt |
0.967mt |
|
V5 |
0.693mt |
0.684mt |
0.687mt |
0.801mt |
0.853mt |
|
|
Salinity |
V1 |
0.741mt |
0.743mt |
0.729mt |
0.778mt |
1.010t |
|
V2 |
0.886mt |
0.900mt |
0.904mt |
0.982mt |
0.939mt |
|
V3 |
0.428mt |
0.612mt |
0.665mt |
0.650mt |
0.872mt |
|
V4 |
0.777mt |
0.895mt |
0.922mt |
0.946mt |
1.050t |
|
V5 |
0.666mt |
0.701mt |
0.736mt |
0.762mt |
0.887mt |
|
|
Drought-Salinity |
V1 |
0.358s |
0.361s |
0.381s |
0.548mt |
0.629mt |
|
V2 |
0.475s |
0.497s |
0.579mt |
0.649mt |
0.650mt |
|
V3 |
0.266s |
0.365s |
0.378s |
0.500mt |
0.587mt |
|
V4 |
0.398s |
0.427s |
0.465s |
0.718mt |
0.663mt |
|
V5 |
0.471s |
0.561mt |
0.615mt |
0.655mt |
0.817mt |
Table 4Analysis of the principal components of the morphometric traits.
Table 4
|
Variables |
PC1 |
PC2 |
PC3 |
PC4 |
PC5 |
|
Area |
-0.4500 |
-0.2272 |
-0.5201 |
0.6652 |
0.1813 |
|
Convexhull |
-0.4581 |
0.0277 |
0.3518 |
0.1908 |
-0.7932 |
|
Bounding area |
-0.4515 |
-0.0298 |
0.6792 |
0.0586 |
0.575 |
|
Perimeter |
-0.4442 |
-0.5492 |
-0.2378 |
-0.6662 |
-0.0284 |
|
Centermassy |
-0.4319 |
0.8032 |
-0.2966 |
-0.2718 |
0.0806 |
|
|
Proportion of Variance |
0.9365 |
0.0358 |
0.0187 |
0.0076 |
0.0014 |
|
Cumulative Proportion |
0.9365 |
0.9723 |
0.991 |
0.9987 |
1 |
Table 5Stress tolerance index of colorimetric characters for drought, salinity, and drought-salinity stress.
Table 5
|
Treatment |
Variety |
CIVE |
VARI |
RGBVI |
MGRVI |
NDI |
GLI |
NGRDI |
|
Drought |
V1 |
1.000mt |
0.924mt |
1.014t |
0.945mt |
0.958mt |
1.014t |
0.924mt |
|
V2 |
0.999t |
1.083t |
1.094t |
1.100t |
1.116t |
1.110t |
1.083t |
|
V3 |
1.000mt |
0.834mt |
0.993mt |
0.869mt |
0.867mt |
0.976mt |
0.834mt |
|
V4 |
0.999t |
0.898mt |
1.071t |
0.951mt |
0.945mt |
1.055t |
0.898mt |
|
V5 |
1.000mt |
0.801mt |
0.987mt |
0.848mt |
0.843mt |
0.970mt |
0.801mt |
|
|
Salinity |
V1 |
1.002mt |
0.748mt |
0.881mt |
0.752mt |
0.767mt |
0.867mt |
0.748mt |
|
V2 |
1.002mt |
0.711mt |
0.881mt |
0.726mt |
0.723mt |
0.851mt |
0.711mt |
|
V3 |
1.004mt |
0.313s |
0.708mt |
0.307s |
0.321s |
0.636mt |
0.313s |
|
V4 |
1.002mt |
0.651mt |
0.885mt |
0.677mt |
0.669mt |
0.842mt |
0.651mt |
|
V5 |
1.002mt |
0.627mt |
0.847mt |
0.634mt |
0.664mt |
0.831mt |
0.627mt |
|
|
Drought-Salinity |
V1 |
1.001mt |
0.747mt |
0.924mt |
0.779mt |
0.779mt |
0.904mt |
0.747mt |
|
V2 |
1.000mt |
0.729mt |
0.975mt |
0.785mt |
0.785mt |
0.958mt |
0.729mt |
|
V3 |
1.002mt |
0.583mt |
0.852mt |
0.627mt |
0.620mt |
0.816mt |
0.583mt |
|
V4 |
1.001mt |
0.706mt |
0.979mt |
0.765mt |
0.756mt |
0.945mt |
0.706mt |
|
V5 |
1.001mt |
0.759mt |
0.922mt |
0.780mt |
0.786mt |
0.907mt |
0.759mt |
Table 6Analysis of the principal components of the colorimetric traits.
Table 6
|
Variables |
PC1 |
PC2 |
PC3 |
PC4 |
PC5 |
PC6 |
PC7 |
|
CIVE |
0.3769 |
-0.4047 |
-0.7331 |
-0.0897 |
-0.3777 |
-0.0777 |
0 |
|
VARI |
-0.3775 |
-0.4109 |
0.1137 |
0.3125 |
-0.189 |
-0.2057 |
0.7071 |
|
RGBVI |
-0.3739 |
0.5413 |
-0.4615 |
0.4741 |
-0.2273 |
0.2788 |
0 |
|
MGRVI |
-0.3807 |
-0.1793 |
-0.4645 |
-0.1269 |
0.7631 |
-0.0936 |
0 |
|
NDI |
-0.3801 |
-0.2612 |
0.044 |
-0.4812 |
-0.2169 |
0.7119 |
0 |
|
GLI |
-0.3791 |
0.3242 |
-0.0777 |
-0.5694 |
-0.3239 |
-0.5622 |
0 |
|
NGRDI |
-0.3775 |
-0.4109 |
0.1137 |
0.3125 |
-0.189 |
-0.2057 |
-0.7071 |
|
|
Proportion of Variance |
0.979 |
0.0193 |
0.0011 |
0.0004 |
0.0001 |
0 |
0 |
|
Cumulative Proportion |
0.979 |
0.9983 |
0.9995 |
0.9999 |
1 |
1 |
1 |
References
- Akbar MR, Purwoko BS, Dewi IS, Suwarno WB, Sugiyanta d. 2019. Penentuan indeks seleksi untuk galur dihaploid padi sawah tadah hujan berdaya hasil tinggi. Jurnal Agronomi Indonesia (Indonesian Journal of Agronomy). 47: 111-118.
- Alharbi S, Raun WR, Arnall DB, Zhang H. 2019. Prediction of maize (Zea mays L.) population using normalized-difference vegetative index (NDVI) and coefficient of variation (CV). J. Plant Nutr. 42: 673-679.
- Angon PB, Tahjib-Ul-Arif M, Samin SI, Habiba U, Hossain MA, Brestic M. 2022. How do plants respond to combined drought and salinity stress?-A systematic review. Plants. 11: 2884
- Anshori M, Purwoko B, Dewi I, Ardie S, Suwarno W. 2019. Selection index based on multivariate analysis for selecting doubled-haploid rice lines in lowland saline prone area. SABRAO J. Breed Genet. 51: 161-174.
- Anshori MF, Purwoko BS, Dewi IS, Ardie SW, Suwarno WB. 2021. A new approach to select doubled haploid rice lines under salinity stress using indirect selection index. Rice Sci. 28: 368-378.
- Anwaar HA, Perveen R, Mansha MZ, Abid M, Sarwar ZM, Aatif HM, et al. 2020. Assessment of grain yield indices in response to drought stress in wheat (Triticum aestivum L.). Saudi Journal of Biological Sciences. 27: 1818-1823.
- Berger B, Parent B, Tester M. 2010. High-throughput shoot imaging to study drought responses. J. Exp. Bot. 61: 3519-3528.
- Bhatta BB, Panda RK, Anandan A, Pradhan NSN, Mahender A, Rout KK, et al. 2021. Improvement of phosphorus use efficiency in rice by adopting image-based phenotyping and tolerant indices. Front. Plant Sci. 12: 717107
- Borrell AK, Mullet JE, George-Jaeggli B, van Oosterom EJ, Hammer GL, Klein PE, et al. 2014. Drought adaptation of stay-green sorghum is associated with canopy development, leaf anatomy, root growth, and water uptake. J. Exp. Bot. 65: 6251-6263.
- Chang J, Cheong BE, Natera S, Roessner U. 2019. Morphological and metabolic responses to salt stress of rice (Oryza sativa L.) cultivars which differ in salinity tolerance. Plant Physiol. Biochem. 144: 427-435.
- Chang Jing CJ, Cheong BoEng CB, Natera S, Roessner U. 2019. Morphological and metabolic responses to salt stress of rice (Oryza sativa L.) cultivars which differ in salinity tolerance. Plant Physiol. Biochem. 144: 427-435.
- Charoonratana T. 2020. Cold pressed rice (Oryza sativa) bran oil. Cold pressed oils (pp. 391-403). Academic Press..
- Dabrowski V, Bouchaud C, Tengberg M, Mouton M. 2021. Crop processing, consumption and trade of Asian rice (Oryza sativa L.) in the Arabian Peninsula during antiquity: Earliest evidence from Mleiha (third c. AD), United Arab emirates. Archaeol. Anthropol. Sci. 13: 1-19.
- Das Choudhury S, Maturu S, Samal A, Stoerger V, Awada T. 2020. Leveraging image analysis to compute 3D plant phenotypes based on voxel-grid plant reconstruction. Front. Plant Sci. 11: 521431
- Du J, Fan J, Wang C, Lu X, Zhang Y, Wen W, et al. 2021. Greenhouse-based vegetable high-throughput phenotyping platform and trait evaluation for large-scale lettuces. Comput. Electron. Agric. 186: 106193
- Fadhilah A, Farid M, Ridwan I, Anshori M, Yassi A. 2022. Genetic parameters and selection index of high-yielding tomato F 2 populations. SABRAO J. Breed Genet. 54: 1026-1036.
- Fadhli N, Farid M, Azrai M, Nur A, Efendi R, Priyanto SB, et al. 2023. Morphological parameters, heritability, yield component correlation, and multivariate analysis to determine secondary characters in selecting hybrid maize. Biodiversitas. 24(7): 3750-3757.
- Fadhli N, Farid M, Effendi R, Azrai M, Anshori MF. 2020. Multivariate analysis to determine secondary characters in selecting adaptive hybrid corn lines under drought stress. Biodiversitas. 21: 3617-3624.
- Fahad S, Bajwa AA, Nazir U, Anjum SA, Farooq A, Zohaib A, et al. 2017. Crop production under drought and heat stress: plant responses and management options. Front. Plant Sci. 8: 1147
- Farid M, Anshori MF, Musa Y, Iswoyo H, Sakinah AI. 2021. Interaction of rice salinity screening in germination and seedling phase through selection index based on principal components. Chil. J. Agric. Res. 81: 368-377.
- Gano B, Dembele JSB, Ndour A, Luquet D, Beurier G, Diouf D, et al. 2021. Using UAV borne, multi-spectral imaging for the field phenotyping of shoot biomass, leaf area index and height of West African sorghum varieties under two contrasted water conditions. Agronomy. 11: 850
- Ge Y, Bai G, Stoerger V, Schnable JC. 2016. Temporal dynamics of maize plant growth, water use, and leaf water content using automated high throughput RGB and hyperspectral imaging. Comput. Electron. Agric. 127: 625-632.
- Hairmansis A, Berger B, Tester M, Roy SJ. 2014. Image-based phenotyping for non-destructive screening of different salinity tolerance traits in rice. Rice. 7: 1-10.
- Han GD, Jang G, Kim J, Kim D-W, Rodrogues R, Kim S-H, et al. 2021. RGB images-based vegetative index for phenotyping kenaf (Hibiscus cannabinus L.). Plos One. 16: e0256978
- Hossain MN, Sarker U, Raihan MS, Al-Huqail AA, Siddiqui MH, Oba S. 2022. Influence of salinity stress on color parameters, leaf pigmentation, polyphenol and flavonoid contents, and antioxidant activity of Amaranthus lividus leafy vegetables. Molecules. 27: 1821
- Hudson AI, Odell SG, Dubreuil P, Tixier M-H, Praud S, Runcie DE, et al. 2022. Analysis of genotype-by-environment interactions in a maize mapping population. G3 (Bethesda). 12: jkac013
- Hussain S, Cao X, Zhong C, Zhu L, Khaskheli MA, Fiaz S, et al. 2018. Sodium chloride stress during early growth stages altered physiological and growth characteristics of rice. Chil. J. Agric. Res. 78: 183-197.
- Joshi S, Thoday-Kennedy E, Daetwyler HD, Hayden M, Spangenberg G, Kant S. 2021. High-throughput phenotyping to dissect genotypic differences in safflower for drought tolerance. PLoS One. 16: e0254908
- Kakar N, Jumaa SH, Redoña ED, Warburton ML, Reddy KR. 2019. Evaluating rice for salinity using pot-culture provides a systematic tolerance assessment at the seedling stage. Rice. 12: 1-14.
- Kim SL, Kim N, Lee H, Lee E, Cheon K-S, Kim M, et al. 2020. High-throughput phenotyping platform for analyzing drought tolerance in rice. Planta. 252: 38
- Kumar S, Dwivedi SK, Basu S, Kumar G, Mishra J, Koley TK, et al. 2020. Anatomical, agro-morphological and physiological changes in rice under cumulative and stage specific drought conditions prevailed in eastern region of India. Field Crops Res. 245: 107658
- Laraswati AA, Padjung R, Farid M, Nasaruddin N, Anshori MF, Nur A, et al. 2021. Image based-phenotyping and selection index based on multivariate analysis for rice hydroponic screening under drought stress. Plant Breed. Biotechnol. 9: 272-286.
- Ma Y, Dias MC, Freitas H. 2020. Drought and salinity stress responses and microbe-induced tolerance in plants. Front. Plant Sci. 11: 591911
- Manacorda CA, Asurmendi S. 2018. Arabidopsis phenotyping through geometric morphometrics. GigaScience. 7: giy073
- Nagarajan S, Varatharajan N, Gandhimeyyan RV. 2022. Understanding the responses, mechanism and development of salinity stress tolerant cultivars in rice. Integrative advances in rice research. 91.:
- Nahar L, Aycan M, Hanamata S, Baslam M, Mitsui T. 2022. Impact of single and combined salinity and high-temperature stresses on agro-physiological, biochemical, and transcriptional responses in rice and stress-release. Plants. 11: 501
- Rossi R, Costafreda-Aumedes S, Leolini L, Leolini C, Bindi M, Moriondo M. 2022. Implementation of an algorithm for automated phenotyping through plant 3D-modeling: A practical application on the early detection of water stress. Comput Electron Agric. 197: 106937
- Roy SC, Shil P. 2020. Assessment of genetic heritability in rice breeding lines based on morphological traits and caryopsis ultrastructure. Sci. Rep. 10: 7830
- Sakinah A, Musa Y, Farid M, Anshori M, Arifuddin M, Laraswati A. 2021. Cluster heatmap for screening the drought tolerant rice through hydroponic culture. Presented at IOP Conference Series: Earth and Environmental Science..
- Sakinah A, Musa Y, Farid M, Hairmansis A, Anshori M, Nasaruddin N. 2022. Rice selection criteria based on morphological and image-based phenotyping under drought-and salinity-stress conditions. SABRAO J. Breed Genet. 54: 686-699.
- Saud S, Wang D, Fahad S, Alharby HF, Bamagoos AA, Mjrashi A, et al. 2022. Comprehensive impacts of climate change on rice production and adaptive strategies in China. Front. Plant Sci. 13: 926059
- Shah SH, Houborg R, McCabe MF. 2017. Response of chlorophyll, carotenoid and SPAD-502 measurement to salinity and nutrient stress in wheat (Triticum aestivum L.). Agronomy. 7: 61
- Singh A, Mukul , Joshi M, Ram M, Singh PK, Arya M. 2015. Screening and evaluation of rice cultivars for submergence tolerance using ssr markers. The Ecoscan. 9: 255-259.
- Singh AK, Ganapathysubramanian B, Sarkar S, Singh A. 2018. Deep learning for plant stress phenotyping: trends and future perspectives. Trends Plant Sci. 23: 883-898.
- Stutsel B, Johansen K, Malbéteau YM, McCabe MF. 2021. Detecting plant stress using thermal and optical imagery from an unoccupied aerial vehicle. Front. Plant Sci. 12: 734944
- Tilly N, Aasen H, Bareth G. 2015. Fusion of plant height and vegetation indices for the estimation of barley biomass. Remote Sens. 7: 11449-11480.
- Vlaminck L, Sang-Aram C, Botterman D, Uy CJC, Harper MK, Inzé D, et al. 2020. Development of a novel and rapid phenotype-based screening method to assess rice seedling growth. Plant Methods. 16: 1-19.
- Wang L, Duan Y, Zhang L, Rehman TU, Ma D, Jin J. 2020. Precise estimation of NDVI with a simple NIR sensitive RGB camera and machine learning methods for corn plants. Sensors. 20: 3208
- Wei X, Cang B, Yu K, Li W, Tian P, Han X, et al. 2022. Physiological characterization of drought responses and screening of rice varieties under dry cultivation. Agronomy. 12: 2849
- Wening RH, Rumanti IA, Purwoko BS, Suwarno WB, Khumaida N. 2019. Screening of submergence tolerant rice under artificial condition based on multiple selection indices. Plant Breed. Biotech. 7: 360-374.
- Yadav C, Bahuguna RN, Dhankher OP, Singla-Pareek SL, Pareek A. 2022. Physiological and molecular signatures reveal differential response of rice genotypes to drought and drought combination with heat and salinity stress. Physiol. Mol. Biol. Plants. 28: 899-910.
- Yan T, Sun M, Su R, Wang X, Lu X, Xiao Y, et al. 2023. Transcriptomic profiling of cold stress-induced differentially expressed genes in seedling stage of Indica rice. Plants. 12: 2675
- Zhou J, Chen H, Zhou J, Fu X, Ye H, Nguyen HT. 2018. Development of an automated phenotyping platform for quantifying soybean dynamic responses to salinity stress in greenhouse environment. Comput. Electron. Agric. 151: 319-330.
- Zhuang S, Wang P, Jiang B, Li M, Gong Z. 2017. Early detection of water stress in maize based on digital images. Comput. Electron. Agric. 140: 461-468.