Abstract
Eight rice genotypes, including Binam, Hashemi, Deylamani, TH1, Hasani, Saleh, IR75479-199-3-3, and Gohar, were crossed in a line tester mating design to generate breeding populations, assess the general and specific combining ability (GCA and SCA) and identify suitable combinations for yield. 23 genotypes (15 F1s and eight parents) were evaluated in a randomized complete block design with three replications at the Rice Research Institute of Iran during the 2020 cropping season. Analysis of variance revealed significant genotype effects and GCA and SCA mean square values for all the investigated traits, which indicated the genetic diversity of the parental genotypes and the importance of both additive and non-additive gene effects in the inheritance of the studied traits. Results indicated that additive gene action controlled plant height. Meanwhile, non-additive gene action controlled panicle length, number of panicles per plant, heading date, hundred-grain weight, number of grains per panicle, and grain yield. Effects of general combining ability were significant for the panicle length, the number of panicles per plant, heading date, hundred-grain weight, number of grains per panicle, and plant height in all testers. Hasani and Saleh's genotypes demonstrated to be good general combiners for early maturity. Gohar was the best specific combiner to enhance yield components. Hashemi×Gohar was identified as the best combination for improving grain yield and reducing the number of days to heading. The predominance of non-additive types of gene actions related to grain yield and its components suggested that selecting the best plants should be postponed to advanced generation.
-
Key words: Broad-sense heritability, Combining ability, Rice, Yield
Introduction
Rice is one of the most important crops in the world and plays a vital role in human feeding. It provides up to 50-80% of Asia's residents' calories, protein, and minerals (
Anders et al. 2021). Currently, more than three million tons of paddy are produced annually in 19 provinces of Iran (
Ahmadi et al. 2021), which shows the high importance of rice cultivation in the food, financial, and job security of people and Iranian farmers.
Iranian local rice varieties usually have favorable characteristics such as high quality of the cooked grain, early maturity, and stable production, However, they have low grain yield, sensitivity to lodging (due to tall plants and weak stems), and high vulnerability to rice blast disease. In Iran, methods based on crossing foreign cultivars with local populations and selecting the best progenies have a history of 50 years (
Modarresi 2023). This path started with the crossbreeding of Mesbah, and Taichung imported cultivars with local cultivars such as Dom Sefid, Tarom Mahali, and Musa Tarom (
Nematzadeh et al. 2000) and continues until now.
Crossing mating designs such as Line in Tester, North Carolina (1, 2, and 3) and Diallel can be very beneficial for selecting the best parents. Also, with the help of statistical methods, it is possible to know the additive or non-additive effects of the inheritance of different traits (
Fasahat et al. 2016). The Line in Tester (
Kempthorne 1957) is a widely used and robust method for estimating hybridization and selecting the best parents and their progeny for breeding using the pedigree method. By using information about the effect of genes (additive and non-additive), it is possible to select the appropriate traits and strategy to select the best progeny. Simultaneous use of general and specific combining ability as well as the degree of heterosis, will be helpful in estimating the response to selection in segregating generations (
Fellahi et al. 2013).
In plant breeding, general combining ability (GCA) and specific combining ability (SCA) are used to measure the effects of additive and non-additive genes on the inheritance of traits (
Fasahat et al. 2016). GCA is attributed to additive gene effects, while SCA is attributable to non-additive gene action, which may be due to dominance (
Abera Muluneh et al. 2020;
Karaağaç 2021). Heterosis, also known as hybrid vigor, is the phenomenon in which the offspring of two genetically different parents exhibit superior traits compared to their parents. The degree of heterosis is influenced by additive and non-additive gene effects (
Sunny et al. 2022).
This research was carried out to form breeding populations, estimate the gene effect, evaluate the combinability of several rice genotypes, and estimate the heritability of traits in the form of a line×tester mating design.
Materials and Methods
This experiment was conducted at the Rice Research Institute of Iran, Guilan province (longitude 49°36~ and latitude 37°16~ with 7 m above seq level), in 2019-2020. In this study, we have used five high-quality and low-yielding local Iranian genotypes, Deylamani, Hasani, Hashemi, Binam, and TH1, as maternal parents (lines). In addition, we have used three improved genotypes with suitable yield and low-cooking quality, named Gohar, Saleh, and IR75479-199-3-3, as paternal parents (testers) (
Table 1).
The parents were selected based on existing molecular, morphological, and physicochemical data (Allahgholipour 2014;
Jahani 2013;
Modarresi 2022). Therefore, improved genotypes with different genetic origins, Philippines (Saleh and IR75479-199-3-3) and India's Basmati (Gohar), were used alongside lines with Iranian rice genetic origin. In spring 2019, eight genotypes were sown at three sowing dates with 15-day intervals. Then seedlings were cultured as single plants at the 3-4 leaf stage. At the heading date, improved cultivars were crossed with local cultivars through line×tester mating design, and the hybrid seeds were harvested.
In the spring of 2020, the seeds of fifteen F1 progenies and eight parents (23 genotypes) were sown in the greenhouse and transferred to the field at the 3-4 leaf stage. Studied genotypes were cultivated in a randomized complete block design with three replications. Each genotype grown in a four-row plot had a row length of 2 m and a distance of 25 x 25 cm. The distance between plots and replications was 0.5 and 1 meter, respectively. All evaluations were done on 10 plants from each plot that was randomly selected (after removing border plants). Finally, an evaluation of traits (Plant height, Panicle length, Number of panicles per plant, Days to heading, Grains per panicle, hundred grain weight and Grain yield per plant) was done. All these measurements were performed based on the Standard Evaluation System for Rice (
S.E.S. 2002). Meteorological data related to the rice growing season is given in
Table 2.
After analysis of the variance of the traits among the parents, the estimation of the combining ability for traits with significant differences was done. In addition, their genetic effects were estimated using Line×Tester analysis by the Kempthorne method(
Kempthorne 1957). Equations (1) and (2) were used to estimate general combining abilities (GCA) through lines and testers, respectively. Meanwhile, equation (3) was used to estimate specific combining abilities (SCA). In addition, the variance of general (
σgca2) and specific combining abilities (
σsca2) were calculated. Since in the present study, the parents of the crosses were pure lines, so their coefficient of inbreeding (F) was considered one. The values of additive (
σA2) and dominant (
σD2) variances were determined through relations 4 and 5 respectively. The t-test was used to investigate the significance of the effects of general and specific combining of lines and testers. Also, the relative contribution of lines (relationship 6), testers (relationship 7) and the lines in testers (relationship 8) were also calculated. In addition, broad-sense heritability (relationship 9) and narrow-sense heritability (relationship 10) were also calculated (
Ghorbani et al. 2013). All calculations were done by writing formulas using R language (
de Mendiburu 2021) or using Microsoft Excel 2019 software.
(1) GCALines=gi=Xi…tr−X…ltr
(2) GCATesters=gt=X.j..lr−X…ltr
(3) SCA=Sij=Xij.r−Xi..tr−X.j.lr+X…ltr,∑iSij=∑jSij=∑i∑jSij=0
(4) σgca2=covHS=1+F4σA2
(5) σsca2=MSL×T−MSer=1+F22σD2
(6) Lines contribute=SSlSScross×100
(7) Testers contribute=SStSScross×100
(8) Lines × Testers contribute=SStlSScross×100
(9) H2=vA+vDvA+vD+vE×100
(10) h2=vArA+vD+vE×100
Results
The analysis of the variance of traits among parental genotypes (
Table 3) showed that the genotype effect, which indicates the difference among lines, testers, and hybrids, was significant at the 1% level for all studied traits. It indicates the presence of suitable genetic diversity between parents and the results of crosses. Therefore, it became possible to analyze the line in tester and separate the genetic variance into its components, general and specific combining abilities. So, the mean square of the genotypes was broken into its components (mean square of parents, crosses, and parents vs. crosses). The mean square of crosses was also broken into its components, including the mean square of lines, testers and lines in testers. The variation range of different traits is presented in
Table 4, which indicates the existence of high diversity in the experimental genotypes.
The difference of parents' traits and the results (
Table 5) showed that, in general, hybrid plants were 2.8 days later flowering. They had 24.5 cm more plant height, 3.5 cm longer panicle length, four more fertile tillers, 1.5 more seeds per panicle, 0.06 grams more weight of one hundred seeds and 7.25 grams per plant grain yield. Therefore, hybrids had numerical superiority in these traits.
Results of this research showed the presence of a positive, and significant general combining ability to increase seed yield per plant, and Deylamani, Hasani and IR75479-199-3-3 parents had negative GCA for this trait. In addition to Gohar, Hashemi, and IR75479-199-3-3 genotypes had positive, and significant GCA for one hundred-grain weight. Gohar, Saleh and Deylamani genotypes had a positive, and significant combining ability for the number of grains per panicle. Meanwhile, Hasani, Hashemi, Gohar, and IR75479-199-3-3 parents had positive, and significant combining ability for the number of grains per panicle trait as well as Gohar, and TH1 parents for the panicle length trait.
In this study (
Table 6), the hybrids of Binam×IR75479-199-3-3, Deylmani×Saleh, Hashemi×Gohar, and TH1×IR75479-199-3-3 had the positive and significant specific combining ability for grain yield traits. In addition, the hybrids of Binam×Gohar, Binam×Saleh, Hashemi×IR75479-199-3-3, Hashemi×Saleh, TH1×Gohar and Deylmani×Gohar had significant SCA to reduce grain yield. Moreover, Deylamani×Gohar and Hashemi×Saleh hybrids had positive and significant SCA for hundred-grain weight, and Deylamani×Saleh and Hashemi×Gohar hybrids had negative and significant SCA for the hundred-grain weight. In addition, Hashemi×Gohar, Hashemi× IR75479-199-3-3 and Deylamani×Gohar hybrids had positive and significant SCA for the number of grains per panicle trait, and TH1×IR75479-199-3-3 hybrid had negative and significant SCA for this trait. The Hasani× IR75479-199-3-3 hybrid was identified as the best promising combination for producing precocious lines, while having an early maturity and a significant combination of SCA and parents' GCA to reduce the days to heading. Hybrid TH1×IR75479-199-3-3 was identified as the best genetic combination with desirable alleles for reducing plant height due to the negative and significant SCA of the hybrid for plant height.
Examining the relative contribution of lines, testers and lines×testers interactions effect for the total variance in the studied genotypes showed that testers have the greatest effect on plant height, grains number per panicle and yield with 69.167%, 48.291% and 42.114%, respectively (
Table 7).
Discussion
In this research, the mean square of the parents was significant for all traits, which was expected considering the selection of these genotypes based on the variety of traits. The presence of high diversity among the offspring resulting from crossing is desirable and will increase the power of selecting superior plants for the breeder (
Modarresi 2022). The mean square of the parents versus the cross was also significant for all traits except the number of grains per panicle. This significance means the presence of positive or negative heterosis in the progeny and the difference between the mean of offspring and parents for these traits (
Ghorbani et al. 2013).
The significance of the mean square of the general combining ability of lines and testers (
Table 8) indicates the more outstanding contribution of additive variance, and the significance of the mean square of the specific combining ability (
Table 6) of lines in testers indicates the more outstanding contribution of non-additive variance (such as dominance or epistasis) (
Karademir et al. 2009).
The parents used in the crosses had a diverse range of the desired characteristics, but this does not mean the definite transfer of these traits to the progeny. Parents may not be able to transfer the desired traits to their progeny. Therefore, concepts such as estimating the effects of general (GCA) and specific (SCA) combining ability are proposed (
Fellahi et al. 2013). The success of a breeding program depends on the parents' combining ability, amount of heritability and their ability to transfer of traits characteristics to the progeny (
Suvi et al. 2020). Results of this research showed the presence of significant GCA (
Table 8) and SCA (
Table 6) effects for all traits, which indicates the role of additive and non-additive gene action in the inheritance of the examined traits.
In this research, Gohar had a positive GCA for all investigated traits. The existence of a parent with a positive general combining ability for yield and its components has been reported before (
Gramaje et al. 2020). However, in many studies, such a parent is not observed (
Huang et al. 2015;
Yuga 2018).
Due to the limitation of irrigation water, and the prevention of pesticide use, early to mid-maturing plants that escape from drought, and the third generation of stemborers are preferred. Meanwhile, for the days-to-heading trait, parents with negative combining ability are superior (
Azad et al. 2022). In this study, the parents Hasani, IR75479-199-3-3, and Saleh were identified as parents with the negative and significant general combining ability for the day-to-heading trait. Also, Gohar, Hashemi, and Binam were not favorable for this trait and had positive and significant GCA. Hasani, IR75479-199-3-3, and Saleh's parents had significant, and negative GCA for plant height trait. Due to the desirability of semi-dwarf plants compared to tall plants, and the possibility of these plants being more resistant to the lodging problem at the end of the season, these parents are preferred (
Aamer et al. 2020). For this trait, Hashemi, and Gohar had positive, and significant general combining ability (
Table 8).
General combining ability is directly related to the breeding value of parents and additive genetic effects, however specific combining ability is related to non-additive effects such as dominance, epistasis, and genotype-by-environment interaction (
Rukundo et al. 2017). The specific combining ability is usually not given much attention for self-pollinated plants, unless the goal is to create the best hybrids and use the ability of the heterosis phenomenon. High values of SCA of a cross indicate the more significant influence of the non-additive gene effect in controlling the trait (
Suvi et al. 2020). However, the best hybrids are expected to have the potential to produce proper homozygous lines due to transgressive segregation (
Rajput et al. 2018). It has been suggested that genetic combinations with a high trait average and desirable SCA estimate, where at least one of their parents has a high GCA estimate, can improve the target trait by increasing the frequency of desirable alleles (
Fellahi et al. 2013). Therefore, this research identifies the Gohar×Hashemi genotype as the best-expected hybrid for improving seed yield. Our observations in the fourth generation of these crosses also show that Gohar×Hashemi progenies have a high yield (unpublished).
Due to the significance of the mean square of lines, testers and lines×testers, the plant height trait is simultaneously affected by additive and non-additive effects (
Table 3). The ratio of the variance of GCA to the variance of SCA for the plant height trait was calculated as 1.637 (
Table 9). Therefore, this trait is more affected by additive effects and the selection among the diverging generations will be successful for the height of the plant. The low degree of dominance, the higher values of additive variance compared to the variance of dominance and environment, the high narrow-sense heritability and the low difference between broad-sense and narrow-sense heritability also confirm this. Similar results have been reported by other researchers (
Chakraborty et al. 2009;
Zewdu 2020). However, regarding the other studied traits (panicle length, number of panicles per plant, days to heading, number of grains per panicles, hundred-grain weight, and grain yield), the ratio of the variance of general combining ability to the variance of specific combining ability was calculated to be less than one (
Table 9). Therefore, these traits influenced mainly by non-additive effects and the selection among the diverging generations will not be successful. The lower values of the additive variance compared to the dominance variance also confirm this. High broad-sense heritability and low narrow-sense heritability indicate that these traits are under the control of genetic effects, but additive effects play a smaller role in controlling these traits compared to non-additive effects (such as dominance and epistasis). Therefore, methods such as the use of hybrid cultivars or selection in advanced generations can be used to improve these traits. Similar results have been reported by other researchers (
Ambikabathy et al. 2019;
Saidaiah et al. 2010;
Srijan et al. 2016).
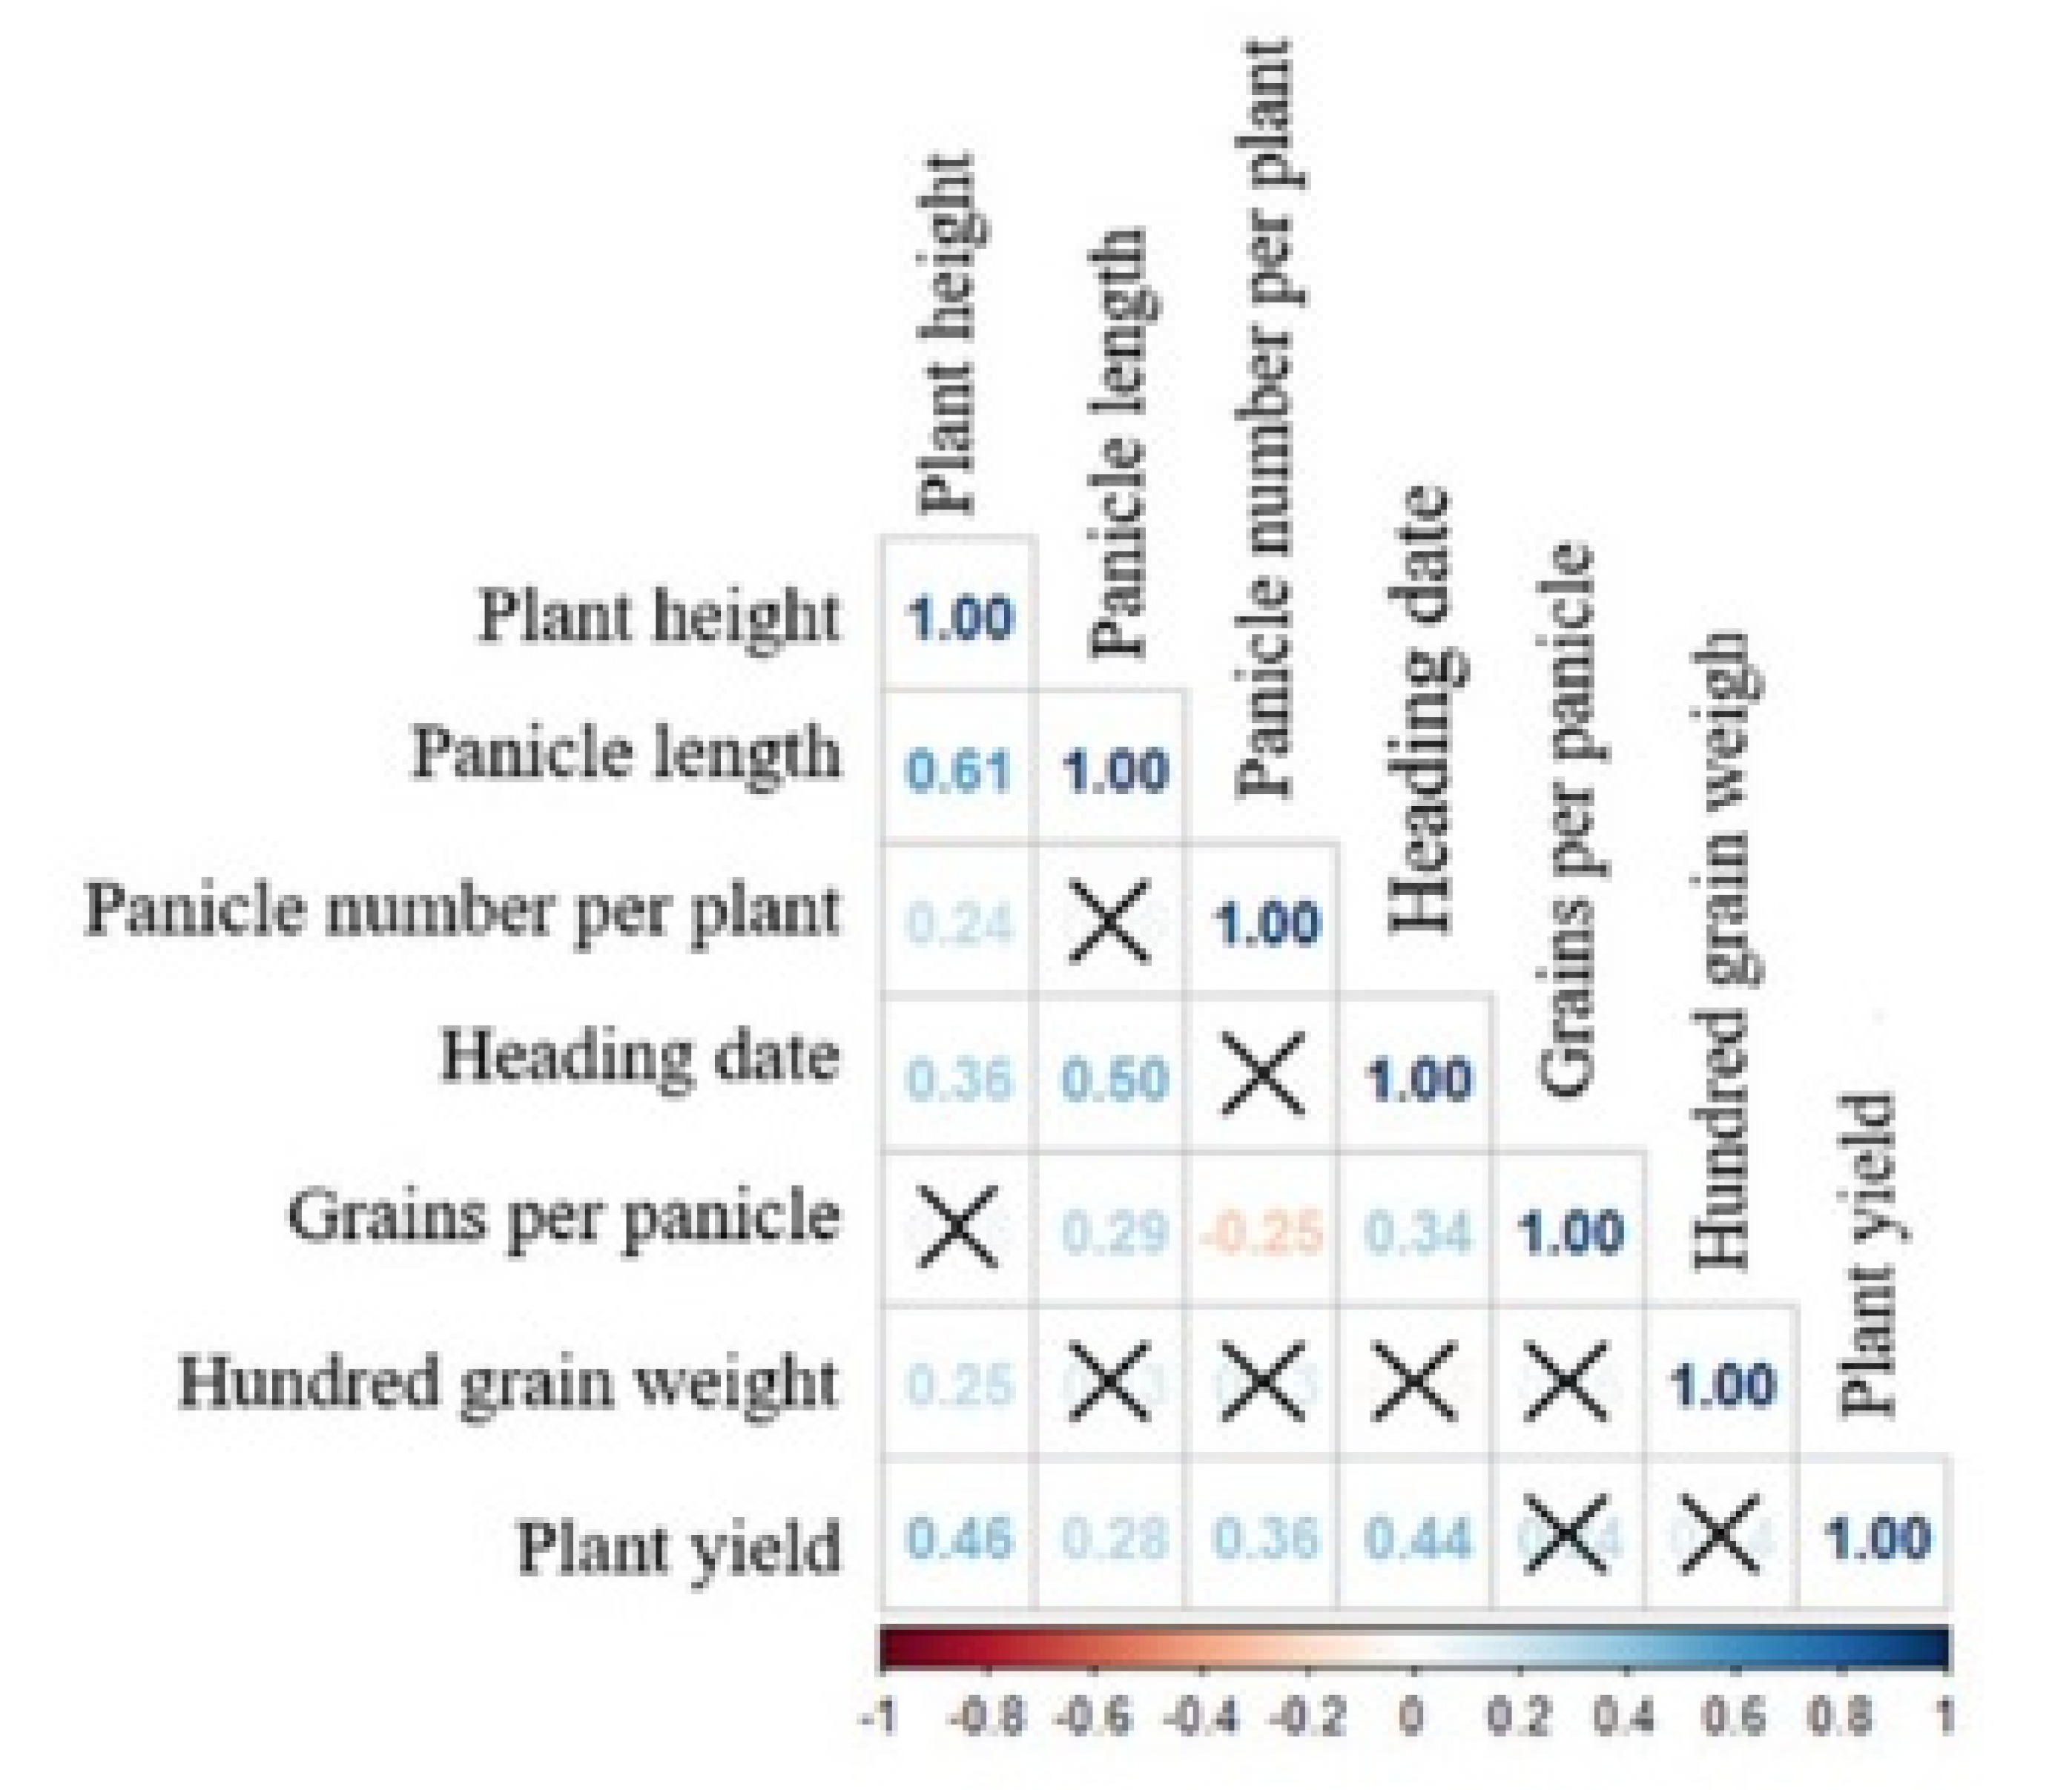
Correlation between different traits (
Fig. 1) shows a positive and significant correlation between plant height and panicle length, number of panicles per plant, days to heading, hundred grain weight and plant yield. Other researchers have also reported a positive and significant correlation between plant height and panicle length (
Sari et al. 2019), yield (
Bhutta et al. 2019), thousand-grain weight and panicle length (
Islam et al. 2020). Also, the results show a positive and significant correlation of yield with plant height, panicle length, number of grains per panicle and days to heading. Other researchers have also reported positive and significant correlation of yield with plant height and days to heading (
Nath et al. 2021) and panicle length (
Reddy et al. 2008).
Conclusion
The findings of this research showed that the dominance variance was higher for most of the traits compared to the additive variance. The results showed that the contribution of the additive effect was greater than the non-additive effects only in the plant height trait, so for this trait, selection in the diverging generations will be useful. Based on the findings of this research, Hasani and Saleh parents were the best general combining ability for early heading. In addition, Gohar variety hybrids had high SCA for yield components, and Gohar× Hashemi genotype can be identified as the best expected hybrid for improving grain yield. Considering the predominance of non-additive effects in traits related to performance and its components, it is suggested to postpone the selection of desirable plants to advanced generations (
Gramaje et al. 2020).
Acknowledgments
This work was supported by Rice research institute of Iran. The authors thank Mr. Arman Babakhani, Mr. Mohammad Mohammadi and Mr. Mahmoud Sayyadi-Fatmehsari for their assistance and companionship.
-
Conflict of Interests
The authors declare that they have no known competing financial interests or personal relationships that could have appeared to influence the work reported in this paper.
Fig. 1Correlation coefficients between traits in studied genotypes. Blue colour indicates positive correlation, red colour indicates negative correlation, Multiplication indicates non-significance at the 5% probability level.

Table 1Characteristics of parental genotypes used in this research.
Table 1
|
Genotypes |
Type |
Origin |
Characteristics |
|
Saleh (Khazar (IR2071-625-152×TNAU7456) ×IR39385-20-1-2-1-2) |
Improved |
Iran (parents from IRRI) |
Suitable yield, high amylose content, low gelatinization temperature, low cooking quality, and non-fragrant |
|
IR75479-199-3-3 |
Improved |
Philippines (IRRI) |
Suitable yield, lodging resistant, Intermediate amylose content, low cooking quality, and non-fragrant |
|
Gohar (pusa1238-1 ×pusa 1238-81-6) |
Improved |
Iran (parents from India) |
High yield, lodging resistant, blast disease resistant, late-maturing, intermediate to high amylose content, low gelatinization temperature, and fragrant |
|
Hashemi |
Landrace |
Iran |
Low yield, Grains with excellent market value (because of grain shape and taste quality), sensitive to lodging, early-maturing, intermediate amylose content, intermediate gelatinization temperature, and fragrant |
|
Hasani |
Landrace |
Iran |
Low yield, intermediate amylose content, intermediate gelatinization temperature, sensitive to lodging, and fragrant |
|
TH1 |
Landrace |
Iran |
Low yield, intermediate amylose content, intermediate gelatinization temperature, sensitive to lodging, and fragrant |
|
Deylamani |
Landrace |
Iran |
Low yield, Grains with good market value (because of grain shape and taste quality), early-maturing, intermediate amylose content, intermediate gelatinization temperature, sensitive to lodging, and fragrant |
|
Binam |
Landrace |
Iran |
Low yield, intermediate amylose content, intermediate gelatinization temperature, sensitive to lodging, and fragrant |
Table 2Meteorological data related to rice growing season which has been recorded in Rasht agricultural meteorological station (near the research farm).
Table 2
|
Date |
Average temperature (°C) |
Precipitation (mm) |
Total sunny hours (h) |
|
Max |
Min |
|
|
|
April |
16.8 |
9.9 |
131 |
101 |
|
May |
24.6 |
13.8 |
65 |
223 |
|
June |
30.5 |
18.8 |
10 |
306 |
|
July |
31.0 |
21.4 |
171 |
253 |
|
August |
31.4 |
20.4 |
25 |
227 |
|
Mean |
26.9 |
16.9 |
80 |
222 |
Table 3Analysis of variance from line×testers mating design for the investigated characters.
Table 3
|
S.O.V |
df |
Grain yield plant-1
|
Hundred grain weight |
Grains per panicle |
Days to heading |
Number of panicles plant-1
|
Panicle length |
Plant height |
|
Replication |
2 |
1.925*
|
0.003ns
|
64.701**
|
1.206ns
|
2.453**
|
8.858ns
|
86.543*
|
|
Genotypes |
22 |
265.312**
|
0.171**
|
539.367**
|
59.178**
|
76.417**
|
28.021**
|
1086.759**
|
|
Parents |
7 |
96.640**
|
0.319**
|
492.928**
|
92.137**
|
27.279**
|
12.994**
|
1121.708**
|
|
Pa. vs Crosses |
1 |
823.692**
|
0.059**
|
35.353ns
|
90.145**
|
84.324**
|
180.928**
|
9397.234**
|
|
Crosses |
14 |
309.764**
|
0.104**
|
598.587**
|
40.487**
|
100.421**
|
24.613**
|
475.679**
|
|
Lines |
4 |
300.887ns
|
0.037ns
|
625.490ns
|
65.210ns
|
57.823ns
|
26.743ns
|
384.551*
|
|
Testers |
2 |
913.172*
|
0.318ns
|
2023.466**
|
63.301ns
|
148.556ns
|
56.409ns
|
2303.081**
|
|
Lines×Testers |
8 |
163.351**
|
0.085**
|
228.915**
|
22.422**
|
109.687**
|
15.599**
|
64.393**
|
|
Error |
44 |
1.660 |
0.007 |
55.525 |
1.907 |
4.819 |
3.535 |
20.901 |
|
C.V. (percent) |
|
4.022 |
3.123 |
6.600 |
1.576 |
11.038 |
6.301 |
3.017 |
Table 4Descriptive statistics of evaluated traits in considered genotypes.
Table 4
|
Traits |
Range |
Minimum |
Maximum |
Mean |
Standard error |
|
Plant height (cm) |
72 |
113 |
185 |
151.522 |
2.308 |
|
Panicle length (cm) |
17 |
22 |
39 |
29.842 |
0.410 |
|
Number of panicles plant-1
|
23 |
12 |
35 |
19.889 |
0.636 |
|
Days to heading) |
18 |
77 |
95 |
87.607 |
0.544 |
|
Grains per panicle |
64 |
85 |
149 |
112.897 |
1.754 |
|
Hundred grain weight (g) |
1.15 |
2.2 |
3.35 |
2.702 |
0.030 |
|
Grain yield plant-1 (g) |
48 |
19 |
67 |
32.031 |
1 |
Table 5Mean performance for yield and yield components of the parents and their crosses.
Table 5
|
Genotypes |
Grain yield plant-1 (g) |
Hundred grain weight (g) |
Grains per panicle |
Days to heading |
Number of panicles plant-1
|
Panicle length (cm) |
Plant height (cm) |
|
Hashemi×Saleh |
40.867 |
2.767 |
117 |
91 |
13.333 |
33.333 |
162 |
|
Hasani×Saleh |
34 |
2.683 |
104.667 |
89.333 |
24.667 |
27 |
142.667 |
|
TH1×Saleh |
32.800 |
2.587 |
124.667 |
89.667 |
17 |
31.567 |
157.333 |
|
Deylamani×Saleh |
32.667 |
2.233 |
126 |
85 |
13.333 |
28 |
149 |
|
Binam×Saleh |
34.361 |
2.523 |
118.028 |
87.583 |
17 |
29.325 |
152.250 |
|
Hasani×Gohar |
40.333 |
2.791 |
110.962 |
89.453 |
16.943 |
31.893 |
169.433 |
|
TH1×Gohar |
31.787 |
2.848 |
128.637 |
89.920 |
25.164 |
33.989 |
176.648 |
|
Hashemi×Gohar |
64 |
2.700 |
114.667 |
91 |
35 |
31.333 |
185 |
|
Deylamani×Gohar |
33 |
3.033 |
144.333 |
90.667 |
16.667 |
39 |
170.667 |
|
Binam×Gohar |
41.667 |
2.800 |
111.333 |
93 |
18 |
32 |
170 |
|
Hashemi×IR75479-199-3-3 |
25 |
2.900 |
112.667 |
89 |
19.333 |
30 |
162.333 |
|
Hasani×IR75479-199-3-3 |
25.633 |
2.823 |
95.667 |
80.333 |
27.333 |
26 |
142 |
|
TH1×IR75479-199-3-3 |
28.467 |
2.767 |
91.667 |
85 |
23.333 |
33.333 |
146.667 |
|
Deylamani×IR75479-199-3-3 |
19.400 |
2.600 |
106.667 |
90.667 |
21.333 |
29.667 |
158 |
|
Binam×IR75479-199-3-3 |
34.333 |
2.800 |
94.333 |
92 |
22 |
30.833 |
156.667 |
|
Saleh |
24.667 |
2.300 |
112.667 |
88 |
19.333 |
30 |
117.333 |
|
IR75479-199-3-3 |
26 |
2.343 |
115 |
91 |
16 |
26.667 |
118 |
|
Gohar |
40.667 |
2.920 |
139 |
94.333 |
20.667 |
27 |
121.667 |
|
Hashemi |
26.667 |
2.583 |
109.333 |
85.333 |
16.333 |
27.333 |
151.333 |
|
Hasani |
26.200 |
3.283 |
109 |
77.333 |
16 |
23.667 |
124.667 |
|
TH1 |
21.867 |
2.567 |
113.333 |
80.667 |
12 |
28 |
141.667 |
|
Deylamani |
24.667 |
2.500 |
102.333 |
83.333 |
13 |
28 |
137 |
|
Binam |
27.667 |
2.800 |
94.667 |
88.333 |
20 |
30.333 |
172.667 |
|
|
LSD (5%) |
2.120 |
0.139 |
12.262 |
2.273 |
3.612 |
3.094 |
7.523 |
Table 6Specific combining ability values of crosses for studied traits.
Table 6
|
Genotypes |
Grain yield plant-1 (g) |
Hundred-grain weight (g) |
Grains per panicle |
Days to heading |
Number of panicles plant-1
|
Panicle length (cm) |
Plant height (cm) |
|
Binam×Gohar |
-2.723**
|
-0.018 |
-5.132 |
-0.228 |
-2.659*
|
-0.958 |
-3.944 |
|
Binam×IR75479-199-3-3 |
5.534**
|
0.038 |
0.345 |
2.180**
|
1.029 |
1.172 |
3.939 |
|
Binam×Saleh |
-2.811**
|
-0.020 |
5.477 |
-1.953*
|
1.629 |
-0.215 |
0.005 |
|
Deylamani×Gohar |
-2.959**
|
0.300**
|
10.100*
|
-0.478 |
-2.103 |
3.273**
|
-2.861 |
|
Deylamani×IR75479-199-3-3 |
-0.968 |
-0.077 |
-5.780 |
2.930**
|
2.252 |
-0.864 |
5.689*
|
|
Deylamani×Saleh |
3.927**
|
-0.224**
|
-4.319 |
-2.453**
|
-0.148 |
-2.409*
|
-2.828 |
|
Hasani×Gohar |
-0.592 |
-0.086 |
-1.370 |
3.047**
|
-7.697 |
1.357 |
3.761 |
|
Hasani×IR75479-199-3-3 |
0.299 |
0.003 |
5.121 |
-2.665**
|
2.382 |
-1.240 |
-2.456 |
|
Hasani×Saleh |
0.293 |
0.083 |
-3.751 |
-0.382 |
5.315**
|
-0.118 |
-1.306 |
|
Hashemi×Gohar |
13.108**
|
-0.200**
|
8.678*
|
-1.700*
|
10.786**
|
-2.460*
|
0.917 |
|
Hashemi×IR75479-199-3-3 |
-10.301**
|
0.057 |
11.108*
|
-0.292 |
-5.193**
|
-0.497 |
-0.533 |
|
Hashemi×Saleh |
-2.807**
|
0.143**
|
-2.430 |
1.992*
|
-5.593**
|
2.958**
|
-0.383 |
|
TH1×Gohar |
-6.834**
|
0.003 |
5.080 |
-0.642 |
1.673 |
-1.212 |
2.127 |
|
TH1×IR75479-199-3-3 |
5.437**
|
-0.021 |
-10.104*
|
-2.154**
|
-0.470 |
1.429 |
-6.638*
|
|
TH1×Saleh |
1.398 |
0.181 |
5.024 |
2.796**
|
-1.203 |
-0.216 |
4.512 |
|
S.E. (SCA) |
0.744 |
0.0487 |
4.302 |
0.797 |
1.267 |
1.086 |
2.640 |
Table 7The relative contributions of lines, testers, and their interaction with the total variance for the investigated characters.
Table 7
|
Contribution |
Grain yield plant-1 (g) |
Hundred-grain weight (g) |
Grains per panicle (no) |
Days to heading (day) |
Number of panicles plant-1
|
Panicle length (cm) |
Plant height (cm) |
|
Lines |
27.753 |
10.227 |
29.856 |
38.805 |
16.452 |
31.044 |
23.098 |
|
Testers |
42.114 |
43.407 |
48.291 |
15.095 |
21.133 |
32.741 |
69.167 |
|
Lines×Testers |
30.134 |
46.366 |
21.853 |
46.101 |
62.415 |
36.216 |
7.735 |
Table 8General combining ability values of parents for studied traits.
Table 8
|
Parents |
Grain yield plant-1
|
Hundred-grain weight |
Grains per panicle |
Days to heading |
Number of panicles plant-1
|
Panicle length |
Plant height |
|
Lines |
|
|
|
|
|
|
|
|
Binam |
2.233**
|
-0.016ns
|
-5.521**
|
2.420**
|
-1.696*
|
0.305ns
|
0.405ns
|
|
Deylamani |
-6.199**
|
-0.101**
|
12.247**
|
0.336ns
|
-3.585**
|
0.564ns
|
-0.822ns
|
|
Hasani |
-1.232**
|
0.042ns
|
-9.654**
|
-4.402**
|
2.285**
|
-2.727**
|
-8.678**
|
|
Hashemi |
8.735**
|
0.065*
|
1.358ns
|
1.892**
|
1.859*
|
0.531ns
|
9.733**
|
|
TH1 |
-3.537**
|
0.010ns
|
1.570ns
|
-0.246ns
|
1.137ns
|
1.938**
|
0.172ns
|
|
S.E. (Lines) |
0.429 |
0.028 |
2.484 |
0.460 |
0.731 |
0.626 |
1.523 |
|
S.E. (d) gi – gj (lines) |
0.607 |
0.039 |
3.512 |
0.651 |
1.034 |
0.886 |
2.155 |
|
Testers |
|
|
|
|
|
|
|
|
Gohar |
7.603**
|
0.111**
|
8.567**
|
2.366**
|
1.659**
|
2.238**
|
14.305**
|
|
IR75479-199-3-3 |
-7.988**
|
0.054*
|
-13.220**
|
-1.042**
|
1.971**
|
-1.058*
|
-6.911**
|
|
Saleh |
0.385ns
|
-0.165**
|
4.653*
|
-1.325**
|
-3.629**
|
-1.180*
|
-7.394**
|
|
S.E. (Testers) |
0.332 |
0.021 |
1.924 |
0.356 |
0.566 |
0.485 |
1.180 |
|
S.E. (d) gi - gj (testers) |
0.470 |
0.031 |
2.721 |
0.504 |
0.801 |
0.686 |
1.669 |
Table 9Estimates of genetic components and heritability of traits in the studied genotypes.
Table 9
|
Parameters |
Grain yield plant-1 (g) |
Hundred-grain weight (g) |
Grains per panicle (no) |
Days to heading (day) |
Number of panicles plant-1
|
Panicle length (cm) |
Plant height (cm) |
|
σGCA2
|
31.057 |
0.004 |
78.415 |
3.832 |
0.100 |
1.912 |
87.243 |
|
σA2
|
124.229 |
0.017 |
313.660 |
15.328 |
0.200 |
7.648 |
348.970 |
|
σD2
|
215.738 |
0.102 |
231.638 |
26.379 |
140.943 |
16.256 |
53.308 |
|
σE2
|
0.516 |
0.003 |
18.396 |
0.879 |
1.327 |
1.136 |
8.137 |
|
hbs2
|
0.998 |
0.977 |
0.967 |
0.979 |
0.991 |
0.955 |
0.980 |
|
hns2
|
0.365 |
0.138 |
0.556 |
0.360 |
0.043 |
0.305 |
0.850 |
|
σSCA2
|
215.738 |
0.102 |
231.638 |
26.379 |
140.943 |
16.256 |
53.308 |
|
σGCA2/σSCA2
|
0.144 |
0.041 |
0.339 |
0.145 |
0.001 |
0.118 |
1.637 |
|
σD2/σA21/2
|
1.318 |
2.470 |
0.859 |
1.312 |
37.542 |
1.458 |
0.076 |
References
- Aamer SM, Ibrahim HE. 2020. Assessment of combining ability for some grain yield and quality traits in rice (Oryza sativa L.) by using Griffing method and biplot analysis. Journal of Plant Production. 11: 1615-1623.
- Abera Muluneh N, Lapaka Odong T. 2020. Combining ability analysis and determination of controlling gene action for yield and other key traits of open pollinated maize (Zea Mays L.) varieties and their topcrosses with inbred line testers in Uganda. Global Journal of Agricultural Research. 8: 39-47.
- Ahmadi K, Ebadzadeh H, Hatami F, Mohammadnia Afroozi S, Esfandiari pour E, Abbas Taghani R. 2021. Agricultural statistics (Iran), 2019-2020. Vol1. Cop plants. Ministry of Agriculture. Tehran, Iran Allahgholipour M. 2014..
- Ambikabathy A, Banumathy S, Gnanamalar R, Arunchalam P, Jeyaprakash P, Amutha R, et al. 2019. Heterosis and combining ability for yield and yield attributing traits in rice. Electron. J. Plant Breed. 10: 1060-1066.
- Anders S, Cowling W, Pareek A, Gupta KJ, Singla-Pareek SL, Foyer CH. 2021. Gaining acceptance of novel plant breeding technologies. Trends Plant Sci. 26: 575-587.
- Azad AK, Sarker U, Ercisli S, Assouguem A, Ullah R, Almeer R, et al. 2022. Evaluation of combining ability and heterosis of popular restorer and male sterile lines for the development of superior rice hybrids. Agronomy. 12: 965
- Bagheri N, Jelodar NB. 2010. Heterosis and combining ability analysis for yield and related-yield traits in hybrid rice. Int. J. Biol. 2: 222
- Baloch Zehi A, Kiani G, Bagheri N. 2015. Identification of suitable parents for production of hybrid rice varieties through evaluation of combining ability and heterosis. Applied Field Crops Research. 28: 140-148.
- Bhutta MA, Munir S, Qureshi MK, Shahzad AN, Aslam K, Manzoor H, et al. 2019. Correlation and path analysis of morphological parameters contributing to yield in rice (Oryza sativa) under drought stress. Pak. J. Bot. 51: 73-80.
- Chakraborty R, Chakraborty S, Dutta B, Paul S. 2009. Combining ability analysis for yield and yield components in bold grained rice (Oryza sativa L.) of Assam. Acta Agronomica. 58: 9-13.
- de Mendiburu F. 2021. Agricolae tutorial (Version 1. 3-5). Universidad Nacional Agraria: La Molina. Peru..
- Devi B, Lal G. 2015. Combining ability analysis for yield & yield components in rice (Oryza sativa L.). Electron. J. Plant Breed. 6: 360-365.
- Faiz F, Sabar M, Awan T, Ijaz M, Manzoor Z. 2006. Heterosis and combining ability analysis in basmati rice hybrids. J. Anim. Pl. Sci. 16: 56-59.
- Fasahat P, Rajabi A, Rad JM, Derera J. 2016. Principles and utilization of combining ability in plant breeding. Biom. Biostat. Int. J. 4: 1-24.
- Fellahi ZEA, Hannachi A, Bouzerzour H, Boutekrabt A. 2013. Line× tester mating design analysis for grain yield and yield related traits in bread wheat (Triticum aestivum L.). J. Agron. 2013: 1-9.
- Gaballah MM, Attia KA, Ghoneim AM, Khan N, El-Ezz AF, Yang B, et al. 2022. Assessment of genetic parameters and gene action associated with heterosis for enhancing yield characters in novel hybrid rice parental lines. Plants. 11: 266
- Ghorbani HR, Samizadeh Lahiji H, Rabiei B, Allah Gholipour M. 2013. Line× tester analysis for yield and yield components in rice lines. Iran. J. Field Crop Sci. 44: 683-692.
- Gramaje LV, Caguiat JD, Enriquez JOS, dela Cruz QD, Millas RA, Carampatana JE, et al. 2020. Heterosis and combining ability analysis in CMS hybrid rice. Euphytica. 216: 14
- Huang M, Chen L-y, Chen Z-q. 2015. Diallel analysis of combining ability and heterosis for yield and yield components in rice by using positive loci. Euphytica. 205: 37-50.
- Islam S, Anothai J, Nualsri C, Soonsuwon W. 2020. Correlation and path analysis of phenological traits of Thai upland rice genotypes. Songklanakarin J. Plant Sci. 7: 133-142.
- Jahani M. 2013. Assessment of phenotypic and haplotype diversity and association mapping in rice genotypes. Department of Agronomy and Plant Breeding. Sari University of Agricultural Sciences and Natural Resources..
- Karaağaç O. 2021. Combining ability and heterosis for root structure and graft-related traits of interspecific Cucurbita rootstocks. Euphytica. 217: 166
- Karademir C, Karademir E, Ekinci R, Gencer O. 2009. Combining ability estimates and heterosis for yield and fiber quality of cotton in line x tester design. Not. bot. Horti Agrobot. Cluj-Napoca. 37: 228-233.
- Kempthorne O. 1957. An introduction to genetic statistics. New York: Wiley..
- Modarresi M. 2022. Formation of new rice breeding population with the aim of early-maturity, high yield potential and desirable quality. Rice Research Institute of Iran..
- Modarresi M. 2023. Rice breeding in Iran, current status and future perspective. Plant Breed. Biotech. 11: 97-104.
- Montazeri Z, Jelodar NB, Bagheri N. 2014. Genetic dissection of some important agronomic traits in rice using Line× tester method. Int. J. Adv. Biol. Biomed. Res. 2: 181-191.
- Nath S, Kole P. 2021. Genetic variability and yield analysis in rice. Electron. J. Plant Breed. 12: 253-258.
- Nematzadeh GA, Karbalaie M, Farrokhzad F, Ghareyazie B. 2000. Aromatic rices of Iran. In Aromatic rices (pp. 191-193). Oxford & IBH Publishing Company. New Delhi..
- Rajput RS, Kandalkar V. 2018. Combining ability and heterosis for grain yield and its attributing traits in bread wheat (Triticum aestivum L.). J. Pharmacogn. Phytochem. 7: 113-119.
- Reddy MY, Yadav SC, Reddy BS, Lavanya G, Babu GS. 2008. Character association and component analysis in rice. Oryza. 45: 239-241.
- Rukundo P, Shimelis H, Laing M, Gahakwa D. 2017. Combining ability, maternal effects, and heritability of drought tolerance, yield and yield components in sweetpotato. Front. Plant Sci. 7: 1981
- S.E.S.2002. Standard evaluation system. International Rice Research Institute. Manila, Philippines: pp. 11-30.
- Saidaiah P, Kumar SS, Ramesha M. 2010. Combining ability studies for development of new hybrids in rice over environments. J. Agric. Sci. 2: 225
- Sari WK, Nualsri C, Junsawang N, Soonsuwon W. 2019. Path analysis for yield and its components in F 1 upland rice hybrids and their parental lines. Songklanakarin J. Sci. Technol. 41: 1421-1427.
- Srijan A, Kumar SS, Raju CD. 2016. Studies on gene action and combining ablility in rice (Oryza sativa L.). Environment & Ecology. 34(4B): 1749-1755.
- Sunny A, Chakraborty NR, Kumar A, Singh BK, Paul A, Maman S, et al. 2022. Understanding gene action, combining ability, and heterosis to identify superior aromatic rice hybrids using artificial neural network. J. Food Qual. 2022: 1-16.
- Suvi WT, Shimelis H, Laing M, Mathew I, Shayanowako AI. 2020. Determining the combining ability and gene action for rice yellow mottle virus disease resistance and agronomic traits in rice (Oryza sativa L.). Agronomy. 11: 12
- Yuga M, Kimani P., Kimani J. M., Nzuve F., Olubayo M., Muthomi J.. 2018. Combining ability and heterosis for agronomic and yield traits in Indica and Japonica rice crosses. J. Agric. Sci.. 10: pp. 92-
- Zewdu Z. 2020. Combining ability analysis of yield and yield components in selected rice (Oryza sativa L.) genotypes. Cogent. Food Agric. 6: 1811594.