Abstract
The purity of seeds can be identified from the traits inherited from their parental lines. Hence, contamination may occur at the crossing step due to unshared similarities with their parents. This research aims to measure the genetic purity of several genotypes obtained from crosses between upland and lowland rice through the banding pattern differences among the genotype samples by using Simple Sequence Repeats (SSR) markers. Taking the leaf samples was carried out at the experimental field, while the marker analysis was conducted in the Plant Biotechnology Laboratory. In this research, 8 (eight) genotypes obtained from crossing, comprising F1, F2, and BC1 along with 4 (four) of their parents from upland rice and lowland rice, were tested using 6 (six) drought-specific SSR primers of RM5, RM211, RM232, RM249, RM255, and RM258. The banding pattern of the electrophoresis results on the 12 rice genotypes showed clear, unsmeared quality. Based on the results of distance and genetic similarities, the 12 genotypes could be classified into 4 (four) clusters in the dendrogram. Cluster I consists of the Situ Bagendit and BC1 TWCH varieties, Cluster II the Towuti variety, Cluster III the Ciherang, Cibogo, F1 SBCH, F1 SBCB, and F1 TWCH varieties, and Cluster IV the F2 SBCH, F2 TWCH, F2 SBCB, and BC1 SBCH varieties.
-
Key words: Genotype, Crossing, SSR markers, Rice
INTRODUCTION
Seed quality could be identified from its physical, physiological, and genetic aspects. In hybrid seeds, parental-inherited characteristics play a pivotal role in detecting seed purity. Seeds that do not share similar characteristics as their parents may lead to contamination during crossing (
Hazmy et al. 2018). To check on the purity, one of the methods used is Simple Sequence Repeats (SSRs). SSR markers have the advantages of high polymorphism and variability as well as codominance (
Mulsanti et al. 2013). Since rice is a self-pollinated plant, its purity can be tested through analysis of differences in banding patterns as well as similarities and genetic distance between hybrid seeds and their parents.
Hence, the need to perform genetic purity tests in genotypes of F1, F2, and BC1 generations of the upland and lowland rice parents is expected to be used as one of the guidelines for the development of the next rice variety (
Ardiarini et al. 2022).
MATERIALS AND METHODS
Research activities were carried out both in the experimental field and the Plant Biotechnology Laboratory of Universitas Brawijaya in Indonesia. In this research, 8 (eight) genotypes obtained from crossings, which were F1, F2, and BC1 along with 4 (four) of their parents from upland rice and lowland rice, were tested using 6 (six) drought-specific SSR primers of RM5, RM211, RM232, RM249, RM255, and RM258.
Seedling trays, nameplates, manure, NPK fertilizer, and polybags were used for planting the samples. Next, the young rice leaves produced were isolated using the DNeasy Plant Mini Kit procedure. When the results of the DNA isolation were obtained, a qualitative test of rice quality was carried out. The next stage involved DNA amplification by PCR technique using the DreamTaq Green PCR Master Mix procedure. The results of the PCR were electrophoresed using agarose gel and EtBr for analysis to obtain the data in the form of DNA banding patterns.
Data analysis was performed based on visible DNA bands on the gel doc. Then, the value of Polymorphism Information Content (PIC) was calculated. The data that had been obtained were analyzed using the Power Marker software to create binary data and the NTSYS 2.1 software with the UPGMA method to create genetic similarity matrixes and genetic distance dendrograms.
RESULTS AND DISCUSSION
DNA quality test
The use of molecular markers in this research is to measure the genetic purity of seeds from the crossing of upland rice with that from lowland rice. The genetic purity of seeds can be determined by the genetic similarity and genetic distance shown by amplified DNA banding patterns. In this study, six drought-specific and high-yielding primers were used, namely RM5, RM211, RM232, RM249, RM255, and RM258.
Electrophoresis was performed after isolating the rice plant DNA. The success of the electrophoresis process is affected by the use of KIT and the purity of the DNA solution (
Adriansyah et al. 2018). A contaminated solution may disrupt the process of primer attachment to the DNA. In this research, it could be seen that the obtained DNA electrophoresis results for the isolation are pure and uncontaminated.
In the amplification of the RM5 and RM211 primers, sample number 7 on the RM5 primer and sample number 12 on the RM211 primer did not form bands indicating that the used primers did not match with the target DNA and thus inhibited the doubling or amplification process during electrophoresis (
Hazmy et al. 2018). Because the amplification process did not occur, a band pattern was not formed in the DNA sample.
Meanwhile, based on the analysis of the PIC value, the average PIC value of the six primers that were used is 0.3775. In this research, primer RM255 has a PIC value > 0.5 and it is therefore categorized as having a high PIC value. Four primers (RM5, RM211, RM232, and RM249) have moderate PIC values of 0.25 < PIC < 0.50 while one primer has a low PIC value of < 0.25 (
Table 1).
However, the obtained PIC values are different from those in the previous research.
In Rokhmah et al. (2014), RM258 had a PIC value of 0.375 and was categorized as a marker with a moderate level of polymorphism, whereas in this research, the same primer owns a PIC value of 0.239 and is thus considered to be at the low level of polymorphism. According to
De Vicente and Fulton (2003), several factors like the number and frequency of occurrence of alleles in a sample of plant genotypes are believed to bring differential effects on the PIC value. The more alleles present, the higher the obtained PIC value is.
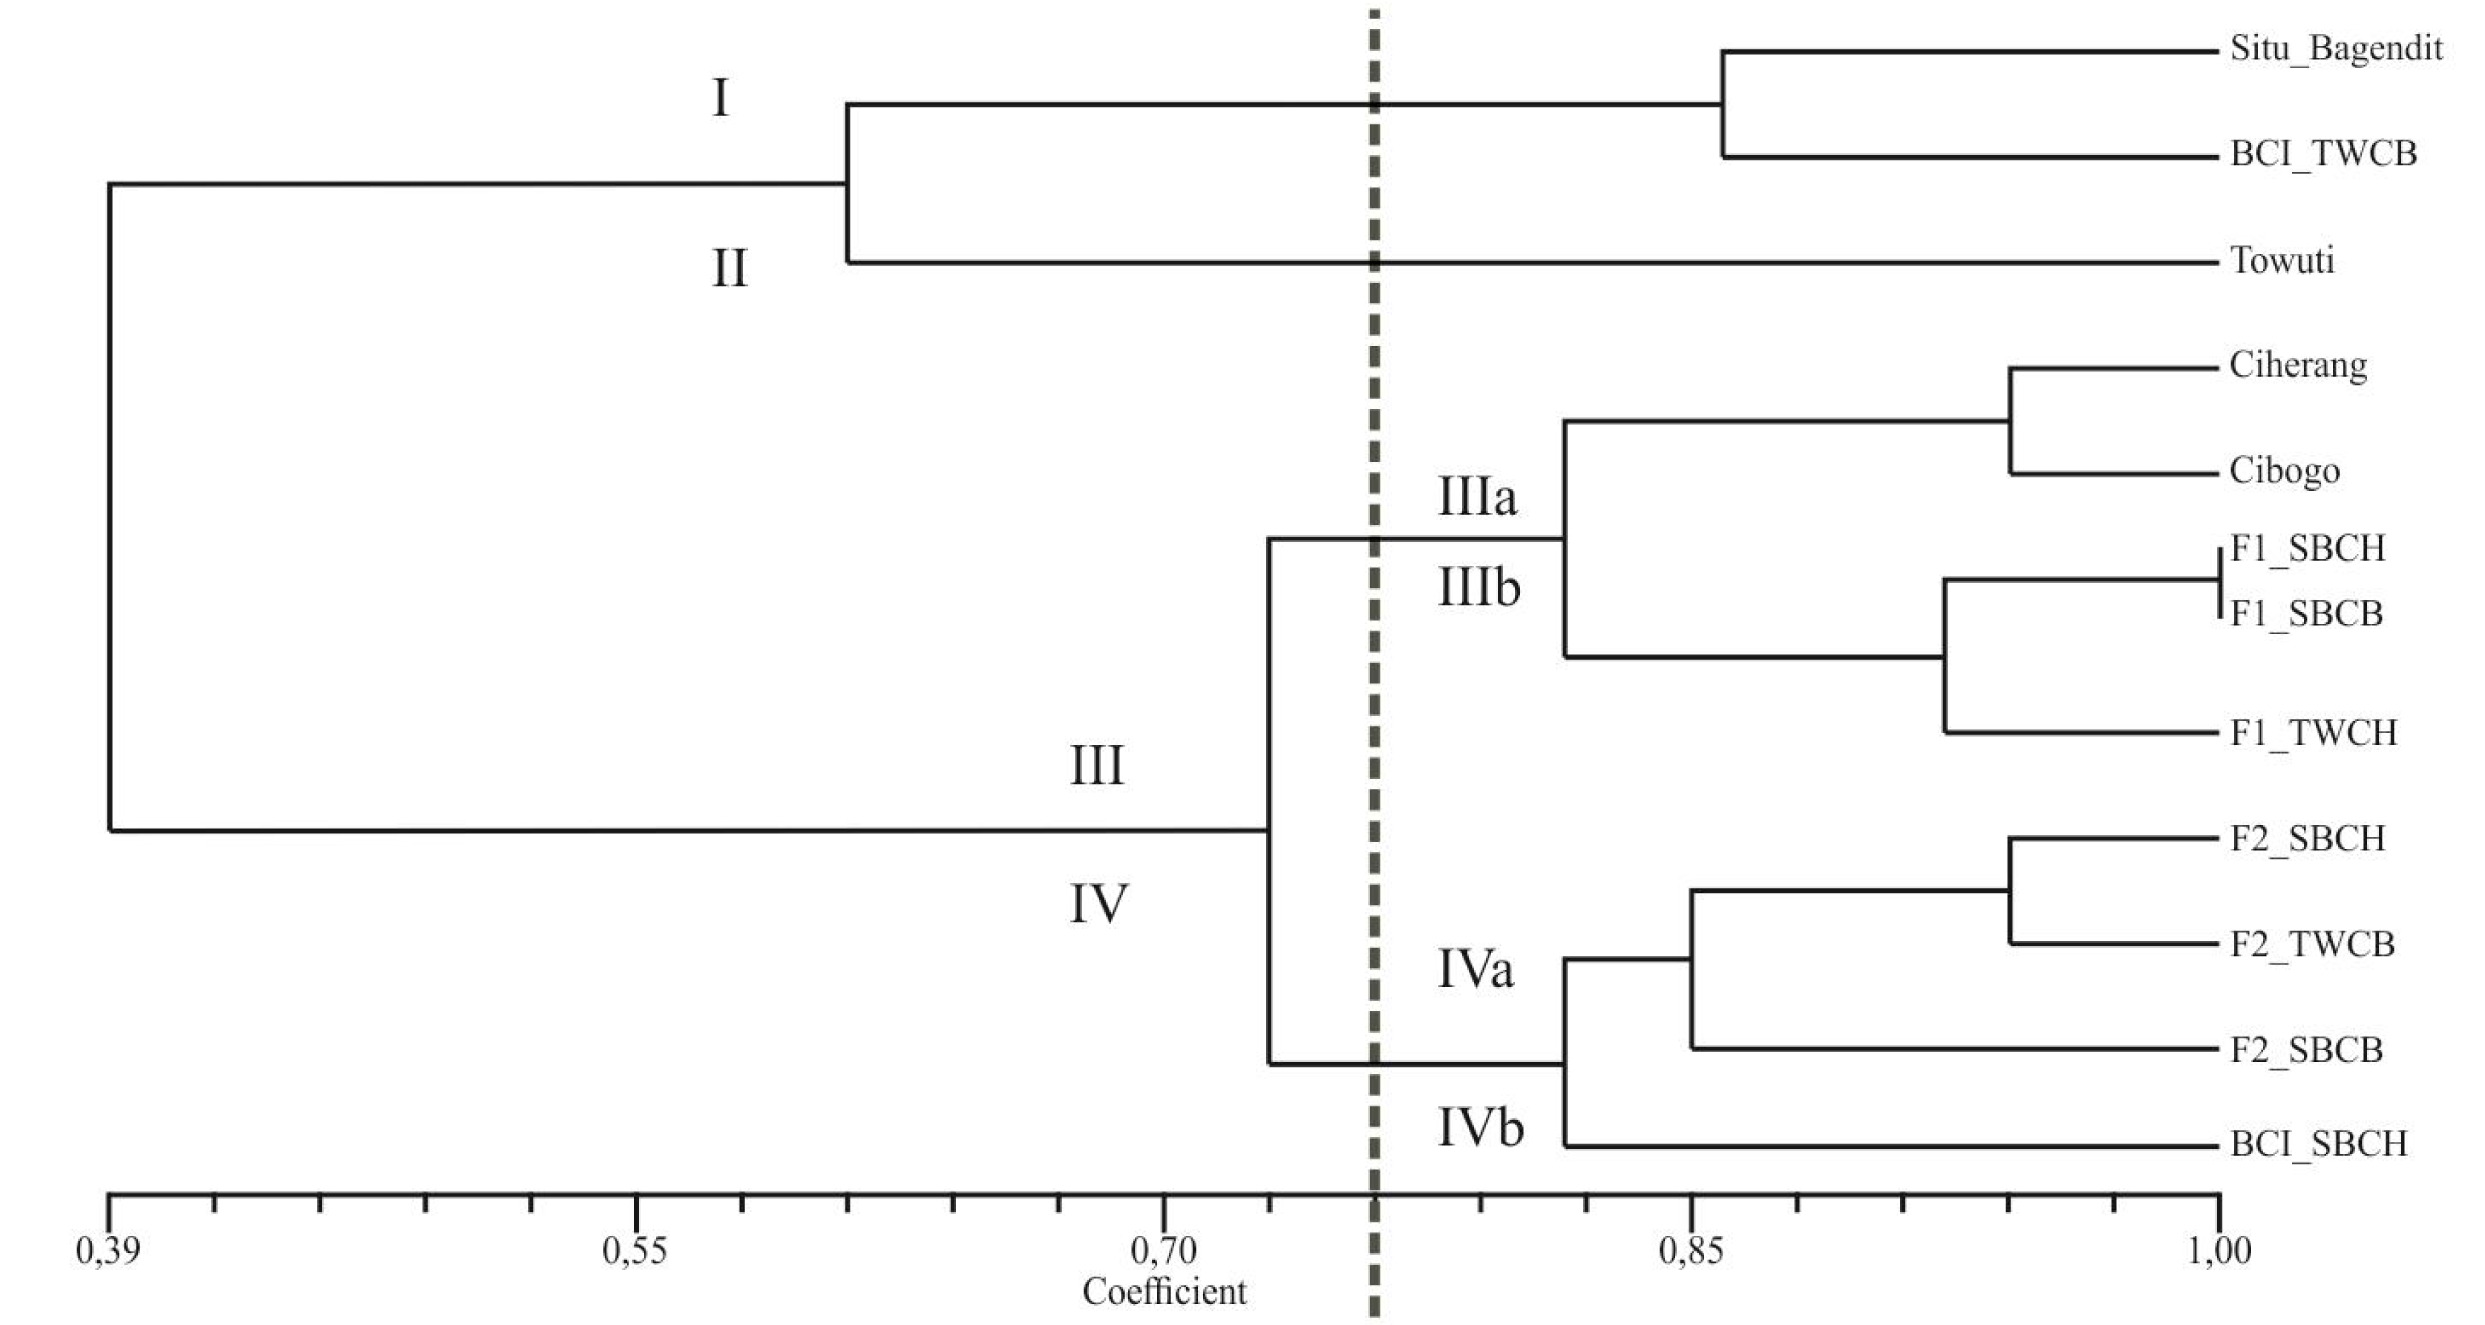
The results of scoring on the DNA banding patterns in this study through the genetic similarity values and the genetic distance dendrogram were obtained, in which the former refers to the inverse of the formed latter (
Bonato et al. 2006). Similarity and distance can be used to find the genetic purity, apart from the banding pattern differences and base pair. The result of genetic distance shows that the 12 genotypes could be divided into 4 (four) clusters in the dendrogram; Cluster I consisting of the
Situ Bagendit and BC1 TWCH varieties; Cluster II the
Towuti variety; Cluster III the
Ciherang,
Cibogo, F1 SBCH, F1 SBCB, and F1 TWCH varieties; and Cluster IV the F2 SBCH, F2 TWCH, F2 SBCB, and BC1 SBCH varieties (
Fig. 1).
Observed from the genetic distance and similarity coefficient, it is known that the F1 generation tends to resemble the lowland variety as the male parent as opposed to upland rice as the female parent. The F1 generation is the result of crossing the varieties of
Situ Bagendit and
Ciherang,
Situ Bagendit and
Cibogo, and
Towuti and
Ciherang (
Adiredjo et al. 2019). This finding supports the one from the previous research (
Hazmy et al. 2018) which shows the resemblance of the banding pattern in the F1 generation and that in the male parent. The resemblance reflects the dominance of one of the parents, which represents a true hybrid (
Liu et al. 2015).
Based on genetic similarities (
Table 2), F1 SBCH and F1 SBCB belonging to F1 generation genotypes possess genetic similarities with the same value of 1.00 despite having originated from different male parents.
Nugroho et al. (2017) argue that individual plants having very close or the same genetic distances may be the products of inbreeding or crossing of close relatives, which results in the produced seeds having similar or even the same DNA. Rice is a self-pollinating crop; consequently, natural inbreeding often occurs (
Warsono and Sukirman, 2010). Besides the occurrence of self-pollination, genetic similarity between two different individuals could also be caused by the mixing of seeds from the plants (
Verma et al. 2017).
For the F2 generation, the resulting band pattern has a lower similarity coefficient with the two parents compared to the F1 generation. This is contrary to Mendel’s first law for monohybrid crosses, in which the F2 generation will show different characteristics from the F1 generation but are more similar to their parents because of random segregation. F1 generated plants were later re-crossed with the upland rice parent as the restorer or recipient. Based on distance and genetic similarities, it can be seen that BC1 SBCH has a quite distant genetic similarity from its restorer parent,
Situ Bagendit. This is inversely proportional to BC1 TWCB, which has close genetic similarities to its restorer parent (
Towuti) and is even in the same cluster based on the dendrogram of genetic distance. This difference can be caused by the presence of segregation, thus making the inheritance of alleles and inherited traits still random among individuals (
Balakrishnan et al. 2016).
From the results of genetic purity testing based on genetic similarity, the F1 and F2 seeds of all cross sets (SBCH, SBCB, and BC1 TWCB) could be regarded as pure seeds and did not show a mixture of other genetic traits. The BC1 SBCH seeds were detected to have a mixture of other genetic traits because of the very low genetic similarity of the male parent (Situ Bagendit).
The F1 SBCH and F1 SBCB generations had a genetic similarity of 1.00 because of having been produced by the same female parent (Situ Bagendit). In the F2 generation, all genotypes had lower genetic similarities compared to the F1 generation; thus, the resulting genetic distance was also further apart. The results of backcrossing F1 SBCH and F1 TWCB generations with restorer parents showed differences in genetic inheritance. Meanwhile, BC1 SBCH had a large genetic distance compared to BC1 TWCB, which is in the same cluster as its restorer parent.
ACKNOWLEDGEMENTS
The authors are grateful to DIKTI and LPPM UB of Universitas Brawijaya for providing great support and assistance in the research project. Gratitude is due to Elfita Rahma Aulia for her contribution to the research.
Fig. 1Genetic distance dendrogram.

Table 1Number of alleles and Polymorphism Information Content (PIC) value.
Table 1
|
Primer |
Number of alleles |
PIC value |
|
RM5 |
11 |
0.3557 |
|
RM211 |
11 |
0.3557 |
|
RM232 |
12 |
0.3047 |
|
RM249 |
12 |
0.4598 |
|
RM255 |
19 |
0.5499 |
|
RM258 |
12 |
0.2392 |
|
Average |
12.8 |
0.3775 |
Table 2Similarity and genetic purity of each rice geno-type to its parents.
Table 2
|
Genotype |
Genetic similarity |
Genetic purity |
|
Male parent |
Female parent |
|
F1 SBCH |
0.81 |
0.19 |
Pure |
|
F1 SBCB |
0.88 |
0.19 |
Pure |
|
F1 TWCH |
0.85 |
0.62 |
Pure |
|
F2 SBCH |
0.69 |
0.19 |
Pure |
|
F2 SBCB |
0.63 |
0.25 |
Pure |
|
F2 TWCB |
0.75 |
0.44 |
Pure |
|
BC1 SBCH |
0.38 |
0.63 |
The female parent is more dominant or there is contamination |
|
BC1 TWCB |
0.64 |
0.56 |
Pure |
References
- Adiredjo AL. Damanhuri.Respatijarti 2019.Experimental hybridization to produce F 1 from a cross between gogo- dryland and paddy-field rice cultivars subjected to different environmental conditions in Indonesia. Experimental hybridization to produce F 1 from a cross between gogo- dryland and paddy-field rice cultivars subjected to different environmental conditions in Indonesia.
- Adriansyah F, Hanum L. Muharni.Windusari Y 2018.Analisis Polimorfisme Padi Varietas Lokal Sumatera Selatan. Analisis Polimorfisme Padi Varietas Lokal Sumatera Selatan.
- Ardiarini NR. Damanhuri.Adiredjo AL 2022.Genetic Varia-bility and Gene Action for Several Traits in F4 and F5 Population of Rice. Genetic Varia-bility and Gene Action for Several Traits in F4 and F5 Population of Rice.
- Balakrishnan D, Robin S, Rabindran RA. JJ 2016.Molecular and Morphological Characterisation of Back Cross Gen-erations for Yield and Blast Resistance in Rice. Molecular and Morphological Characterisation of Back Cross Gen-erations for Yield and Blast Resistance in Rice.
- Bonato ALV, Calvo ES, Geraldi IO. Arias CAA 2006.Genetic similarity among soybean (Glycine max (L) Merrill) cultivars released in Brazil using AFLP markers. Genetic similarity among soybean (Glycine max (L) Merrill) cultivars released in Brazil using AFLP markers.
- De Vicente M. Fulton T 2003.Using molecular marker tech-nology in studies on plant genetic diversity. Using molecular marker tech-nology in studies on plant genetic diversity.
- Hazmy ZD, Ardiarini NR. Respatjarti.Damanhuri.Adiredjo AL 2018.Phenotypic and Molecular Marker Analysis of F1 Population derived from Crossing of Gogo-Dryland x Paddy-Field Rice Varieties. Phenotypic and Molecular Marker Analysis of F1 Population derived from Crossing of Gogo-Dryland x Paddy-Field Rice Varieties.
- Liu G, Liu L, Gong Y, Wang Y, Yu F, Shen H, et al. 2015. Seed genetic purity testing of F1 hybrid cabbage (Brassica oleracea var. Seed genetic purity testing of F1 hybrid cabbage (Brassica oleracea var . capitata) with molecular marker analysis. Seed Sci. Technol. 35(July 2007). 477-482. https://doi.org/10.15258/sst.2007.35.2.21:
- Surahman M. Mulsanti I W.Wahyuni S 2013.Identifikasi Galur Tetua Padi Hibrida dengan Marka SSR Spesifik dan Pemanfaatannya dalam Uji Kemurnian Benih. Identifikasi Galur Tetua Padi Hibrida dengan Marka SSR Spesifik dan Pemanfaatannya dalam Uji Kemurnian Benih.
- Nugroho K. Slamet.Lestari P 2017.Keragaman Genetik 24 Varietas Padi Sawah dan Padi Gogo (Oryza sativa L. Keragaman Genetik 24 Varietas Padi Sawah dan Padi Gogo (Oryza sativa L.
- Rokhmah N, Wening R. Bobihoe J 2014.Keragaman Genetik 17 Padi Lokal asal Provinsi Jambi berdasarkan Karakteri-sasi Morfologi dan Marka Molekuler. Keragaman Genetik 17 Padi Lokal asal Provinsi Jambi berdasarkan Karakteri-sasi Morfologi dan Marka Molekuler.
- Verma R, Singh S, Singh P. Samantaray S 2017.Genetic purity assessment of indica rice hybrids through DNA finger-printing and grow out test. Genetic purity assessment of indica rice hybrids through DNA finger-printing and grow out test.
- Warsono, Sukirman.2010. Teknik Penyilangan Galur Mandul Jantan dan Pelestarian Galur Pemulih Kesuburan untuk Menghasilkan Padi Hibrida. Buletin Teknik Pertanian 15(2). 41-43..