Abstract
The conventional soybean breeding program by single seed descent method required around 8 to 9 years to develop a cultivar. Through the advancement of breeding techniques, such as marker-assisted selection, required resources could be significantly saved, but the generation advancement step still slows down the entire soybean breeding program time course. In this study, 28 soybean varieties were tested to find the optimal speed breeding conditions for soybeans that could rapidly advance one generation with 2 light sources, 3 light conditions, and 2 planting densities. Plants were kept under short-day conditions (9 hours light/15 hours dark). We optimized the growth conditions for shortening the period of soybean generation progression based on speed breeding. The optimizing conditions are as follows. (1) Irradiation using LED light source for 9 hours, (2) 506 mmol/(m2∙s) of PPFD at 30 cm from the ground, (3) Planting density of 5 cm × 5 cm, (4) temperature of 25℃ ± 2℃ and (5) humidity of 50% ± 10%. If this condition is used, soybeans can be advanced by one generation within an average of 73 days. It is possible to advance five generations a year using only indoor speed-breeding system. Furthermore, if it includes the development of lines in the field, four generation per year, which is advance three generations using indoor speed-breeding system and one generation in the field, is allowed to increase soybean breeding speed with minimum input.
-
Key words: Soybean, Speed breeding system, Single seed descent, Breeding strategy
INTRODUCTION
Soybean [
Glycine max (L.) Merr] is one of the most important crops in Korea. In Korea, soybeans are used as food, such as soybean paste, soy sauce, tofu, soymilk, and oil, and industrially, the remaining stems and pods are used as bio-fuel, feed, and paper. Soybean cultivation area and production were reported to be 54,444 ha and 110,781 tons. The production of soybeans per 10a is continuously increa-sing and is reported to be 147 kg in 2010, 183 kg in 2015, and 203 kg in 2021. However, the soybean produc-tion area continues to decrease, and it was reported from 71,422 ha in 2010 to 56,666 ha in 2015 and 54,444 ha in 2021 (
Statistics Korea 2022). Furthermore, rapid climate change could increase the frequency of unexpected and adverse weather events, and cause yield losses (
Yu et al. 2021). To over-come this, crop breeding is the most effi-cient and economic strategy.
Crop breeding program requires a significant amount of time and labor. Among the various stages in crop breeding program, generation advancement is one of the bottleneck steps to decrease breeding period. There have been various approaches to reduce this, such as marker-assist selection (MAS) (
Johnson 2003;
Eathington et al. 2007), genome- wide or genomic selection (GS) (
Meuwissen et al. 2001), marker-assisted backcrossing (MABC) (
Frisch et al. 1999;
Hospital et al. 1992;
Septiningsih et al. 2009), and doubled- haploid (DH) (
Forster and Thomas 2005) technique. However, even with these methods, the limitations of the method of breeding in the open field were clear, and only two to three generations per year could be advanced. A new breeding method that goes beyond the limitations of these methods was developed, which is a speed breeding (SB) strategy (
O’Connor et al. 2013;
Watson et al. 2018;
Voss-Fels et al. 2019) that breeds variety in an indoor growing room using a light-emitting diode (LED) created in an environment similar to the light conditions in the field. It has been reported that the single seed descent (SSD) method was used to successfully breed spring wheat, durum wheat, and barley during a short breeding period under SB conditions (
Ghosh et al. 2018) and screening of quantitative traits in barley and wheat (
Hickey et al. 2017;
Alahmad et al. 2018), shortening of the breeding period of rice, amaranth, and soybeans using SB (
Jahne et al. 2020) and reducing growth period in wheat and triticale (
Cha et al. 2020;
Cha et al. 2021) were announced. However, only a few researches have published the results of a breeding method using SB. Even in soybeans, it is not known what conditions must be taken to make a variety with a short breeding period. Therefore, this study investigated the condition for shortening the breeding life of soybeans using the SB strategy with minimum input.
MATERIALS AND METHODS
LED module design
LED module manufactured by Wooree Bio (Ansan, Korea) was composed of blue, green, and red LEDs. LED growth shelf was made by alternately installing one lane consisting of red (630 nm), blue (440 nm), and green (530 nm) and the other lane consisting of red (660 nm), blue (440 nm), and green (530 nm). A total of 8 shelves were made, one controller to control 4 shelves were equipped, and one 24V 100A power supply was installed per two shelves (
Fig. 1). And by connecting the controller and the computer with a data cable, it was possible to control light time and strength using the software provided by the manufacturer. The Photosynthetic photon flux density (PPFD) of maxi-mum output was measured at 732.2 ± 19.6 mmol/(m
2∙s) at 30 cm above the ground. For the stability of the LED, 80% of the maximum output was employed to the maximum condition.
A 50-seedling tray measuring 28 × 54 × 11.2 cm was employed in this study. And two planting densities were chosen: 10 cm × 10 cm (low density) and 5 cm × 5 cm (high density) (low density). Conditions of light separated using two sources, LED in the SB growth room and sodium lamp in the glass house (
Fig. 2). LED growth shelves were installed in a room separated from the outside which was maintained at 25℃ ± 2℃ of temperature and humidity of 50% ± 10% using thermo-hygrostat, and a sodium lamp was equipped in the glass house with the air conditioner set to 25℃. PPFD was measured using a PG200N Spectral PAR Meter (UPRtek, Taiwan) at 30 cm above the ground of each growth floor. In the LED growing room, two settings of LED intensity (high; 80% of total output, and low; 40% of total output) were used.
As a result of measuring PPFD under various light conditions, it was measured to average 506.0 ± 7.4 mmol/(m
2∙s), 257.4 ± 10.4 mmol/(m
2∙s) at LED high and low intensity. At sodium lamp conditions, the average was 288.5 ± 6.9 during the day and 188.4 ± 10.8 at night, which was used in this experiment. More detailed information was indicated in
Table 1.
A total of 29 soybean varieties were used in the experi-ment, and 4, 9, 7, 6, and 3 varieties were included in the early, middle, middle-late, late, and unknown maturity groups.
Table 2 provided more comprehensive information.
Two growth periods were measured at R1 stage, which is the beginning bloom, and R6, which is full-seed stage. The number of pods per plants were recorded at R8 stage, which is 95% of pods were mature in color. Three biological replicates were tested in each variety.
Statistical analysis
Analysis of correlation coefficient between 4 maturity groups and 18 phenotypes were performed using R Statistical Software (V4.1.2; R Core Team 2021) and COR R package (
Ihaka and Gentleman 1996).
RESULTS
The period from planting to first blooming (R1) and to full pod (R6)
Under the condition of High PPFD and low density, the mean period to R1 was 27.0 days and the standard deviation was 1.3 days. The shortest period was 26 days for 15 varieties and the longest period was 30 days for one variety. The mean of the period to R6 was 52.5 days and the standard deviation was 5.3 days. The shortest period was 47 days for 7 cultivars, and the longest period was 64 days for 1 cultivar. In the condition of high density, the mean period to R1 was 29.1 days and the standard deviation was 1.4 days. The shortest period for 14 varieties was 28 days, and the longest period for one variety was 32 days. The mean period to R6 was 52.5 days and the standard deviation was calculated as 4.6 days. The shortest period was 49 days for 15 varieties, and the longest period was 63 days for one variety.
At low PPFD and low-density conditions, the mean period to R1 was 27.7 ± 1.7 days. The shortest period was 26 days for 12 varieties, and the longest period for 2 varieties was 31 days. In R6, the mean of the period was 51.0 days and the standard deviation was 4.8 days. The shortest period was 47 days in 10 cultivars, and the longest period was 61 days in 2 cultivars. In the condition of high density, the mean period to R1 was 30.2 days, and the standard deviation was 2.9 days. The shortest period was 28 days for 12 varieties and 41 days for one variety. The mean duration to R6 was 51.0 days and the standard deviation was 4.8 days. The shortest period was 47 days in 10 cultivars, and the longest period was 61 days in 2 cultivars.
Under the conditions of a sodium lamp and a greenhouse of low density, the average cycle to R1 was 37.3 days and the standard deviation was 4.9 days. The shortest period was 30 days for 2 varieties, and the longest period for 4 varieties was 47 days. The mean time to R6 was 74.5 days, and the standard deviation was 5.2 days. The shortest period was 65 days for one cultivar and the longest period was 84 days for one cultivar. The average period from high-density greenhouse to R1 was 41.0 days and the standard deviation was 4.1 days. The shortest period for the two varieties was 35 days, and the longest period for the two varieties was 49 days. The mean of the period to R6 was 75.9 days, and the standard deviation was 4.0 days. The shortest period was 67 days in the second variety, and the longest period was 84 days in the first variety.
Measurement of pod number
Under the high PPFD and high-density conditions, the average number of pods per plant was 4.5 ± 1.9, and under the same light and low-density conditions, the average number was 2.8 ± 1.3. The average number of pods per individual was 2.6 ± 2.0 in the low PPFD and high-density conditions. Under the same light conditions and low- density conditions, the average number was 3.4 ± 1.4. Under sodium lamp conditions, the average number was 2.1 ± 1.6 in high-density and 1.9 ± 1.1 in low-density.
Correlation analysis
There was no significant correlation between phenotypes and maturity group, according to the Pearson correlation coefficient. The highest positive and negative correlation were 0.23 and ‒0.42, respectively (
Supplementary Table S1).
DISCUSSION
Through this study, it was feasible to compare the period of time from planting to harvest as well as the number of pods caused by differences in light source type, intensity, and planting density. According to planting density, there was no apparent change between R1 and R6. The average number of pods per plant, however, differed according to planting density, with 4.5 ± 1.9 being the highest value observed in the high-density, high PPFD condition. Overall, it was determined that growing conditions utilizing LEDs in a closed environment were faster growing than those using sodium lamps in a greenhouse, taking an average of 10.7 days less to reach R1 and 22.6 days less to reach R6 (
Fig. 3).
A further study, studies dealing with different ratios of red and blue LEDs and measuring the phenotypes that appear will be conducted. The results of flowering time and plant height according to three ratios of red and blue LEDs have already been published (
Jahne et al. 2020). Optimal conditions will be evaluated with a red to blue ratio of 5 or more, and the irradiation time will be changed to find the appropriate irradiation conditions. As a result, we establish specific growing conditions for soybean single-seed descent methods. Another perspective, we will apply the speed breeding strategy based on the result that more than 80% of the seeds germinated when freshly sown seeds of R6 were sown (
Fang et al. 2021). We have confirmed that more than 90% of seeds germinate when they are sown after artificially stopping water supply in R7. If the seeds are harvested and sown in R6 using the results of the research above, it is expected that the period from sowing to harvesting can be greatly shortened to about 55 days. Additionally, we confirmed that the period from planting to R6 was similar between High PPFD and Low PPFD under high-density conditions, but there was a significant difference in the length of the stem and the number of pods. Based on this phenotype, it will be possible to identify genes or mechanisms involved in pod formation.
CONCLUSION
We developed the growth conditions for reducing the period of soybean generation progression based on speed breeding. Developed conditions are as follows. (1) 506 mmol/(m
2∙s) of PPFD at 30 cm from the ground, (2) Planting density of 5 cm × 5 cm, (3) irradiation using LED light source for 9 hours, (4) temperature of 25℃ ± 2℃ and (5) humidity of 50% ± 10%. If this condition is used, soybeans can be advanced by one generation within 73 days. It is possible to advance five generations a year using only SB, and if it includes the advancement of breeding lines in the field, it is possible to advance three generations indoors and one generation in the field, for a total of four generations (
Fig. 4).
Supplemental Material
ACKNOWLEDGEMENTS
This research was supported by the project “Develop-ment of a large set of molecular markers associated with major environmental stresses in soybean (No. PJ01577 12022)” in Rural Development Administration (RDA) of Rep. Korea.
-
CONFLICT OF INTEREST
The authors declare that they have no conflict of interest.
Fig. 1Design and actual LED growing shelf, and photosynthetic photon flux density (PPFD) value in relation to output intensity. (A) A figure showing the structure of the LED growing shelf. The width of the shelf is 1.7 m, and the distance from the bottom of the shelf to the LED light source is 0.8 m. (B) Appearance of the actual LED growing shelf. (C) After setting 80% of the total output, the PPFD result was measured 50 cm from the light source (High PPFD condition). (D) After setting 40% of the total output, the PPFD result was measured 50 cm from the light source (Low PPFD condition).
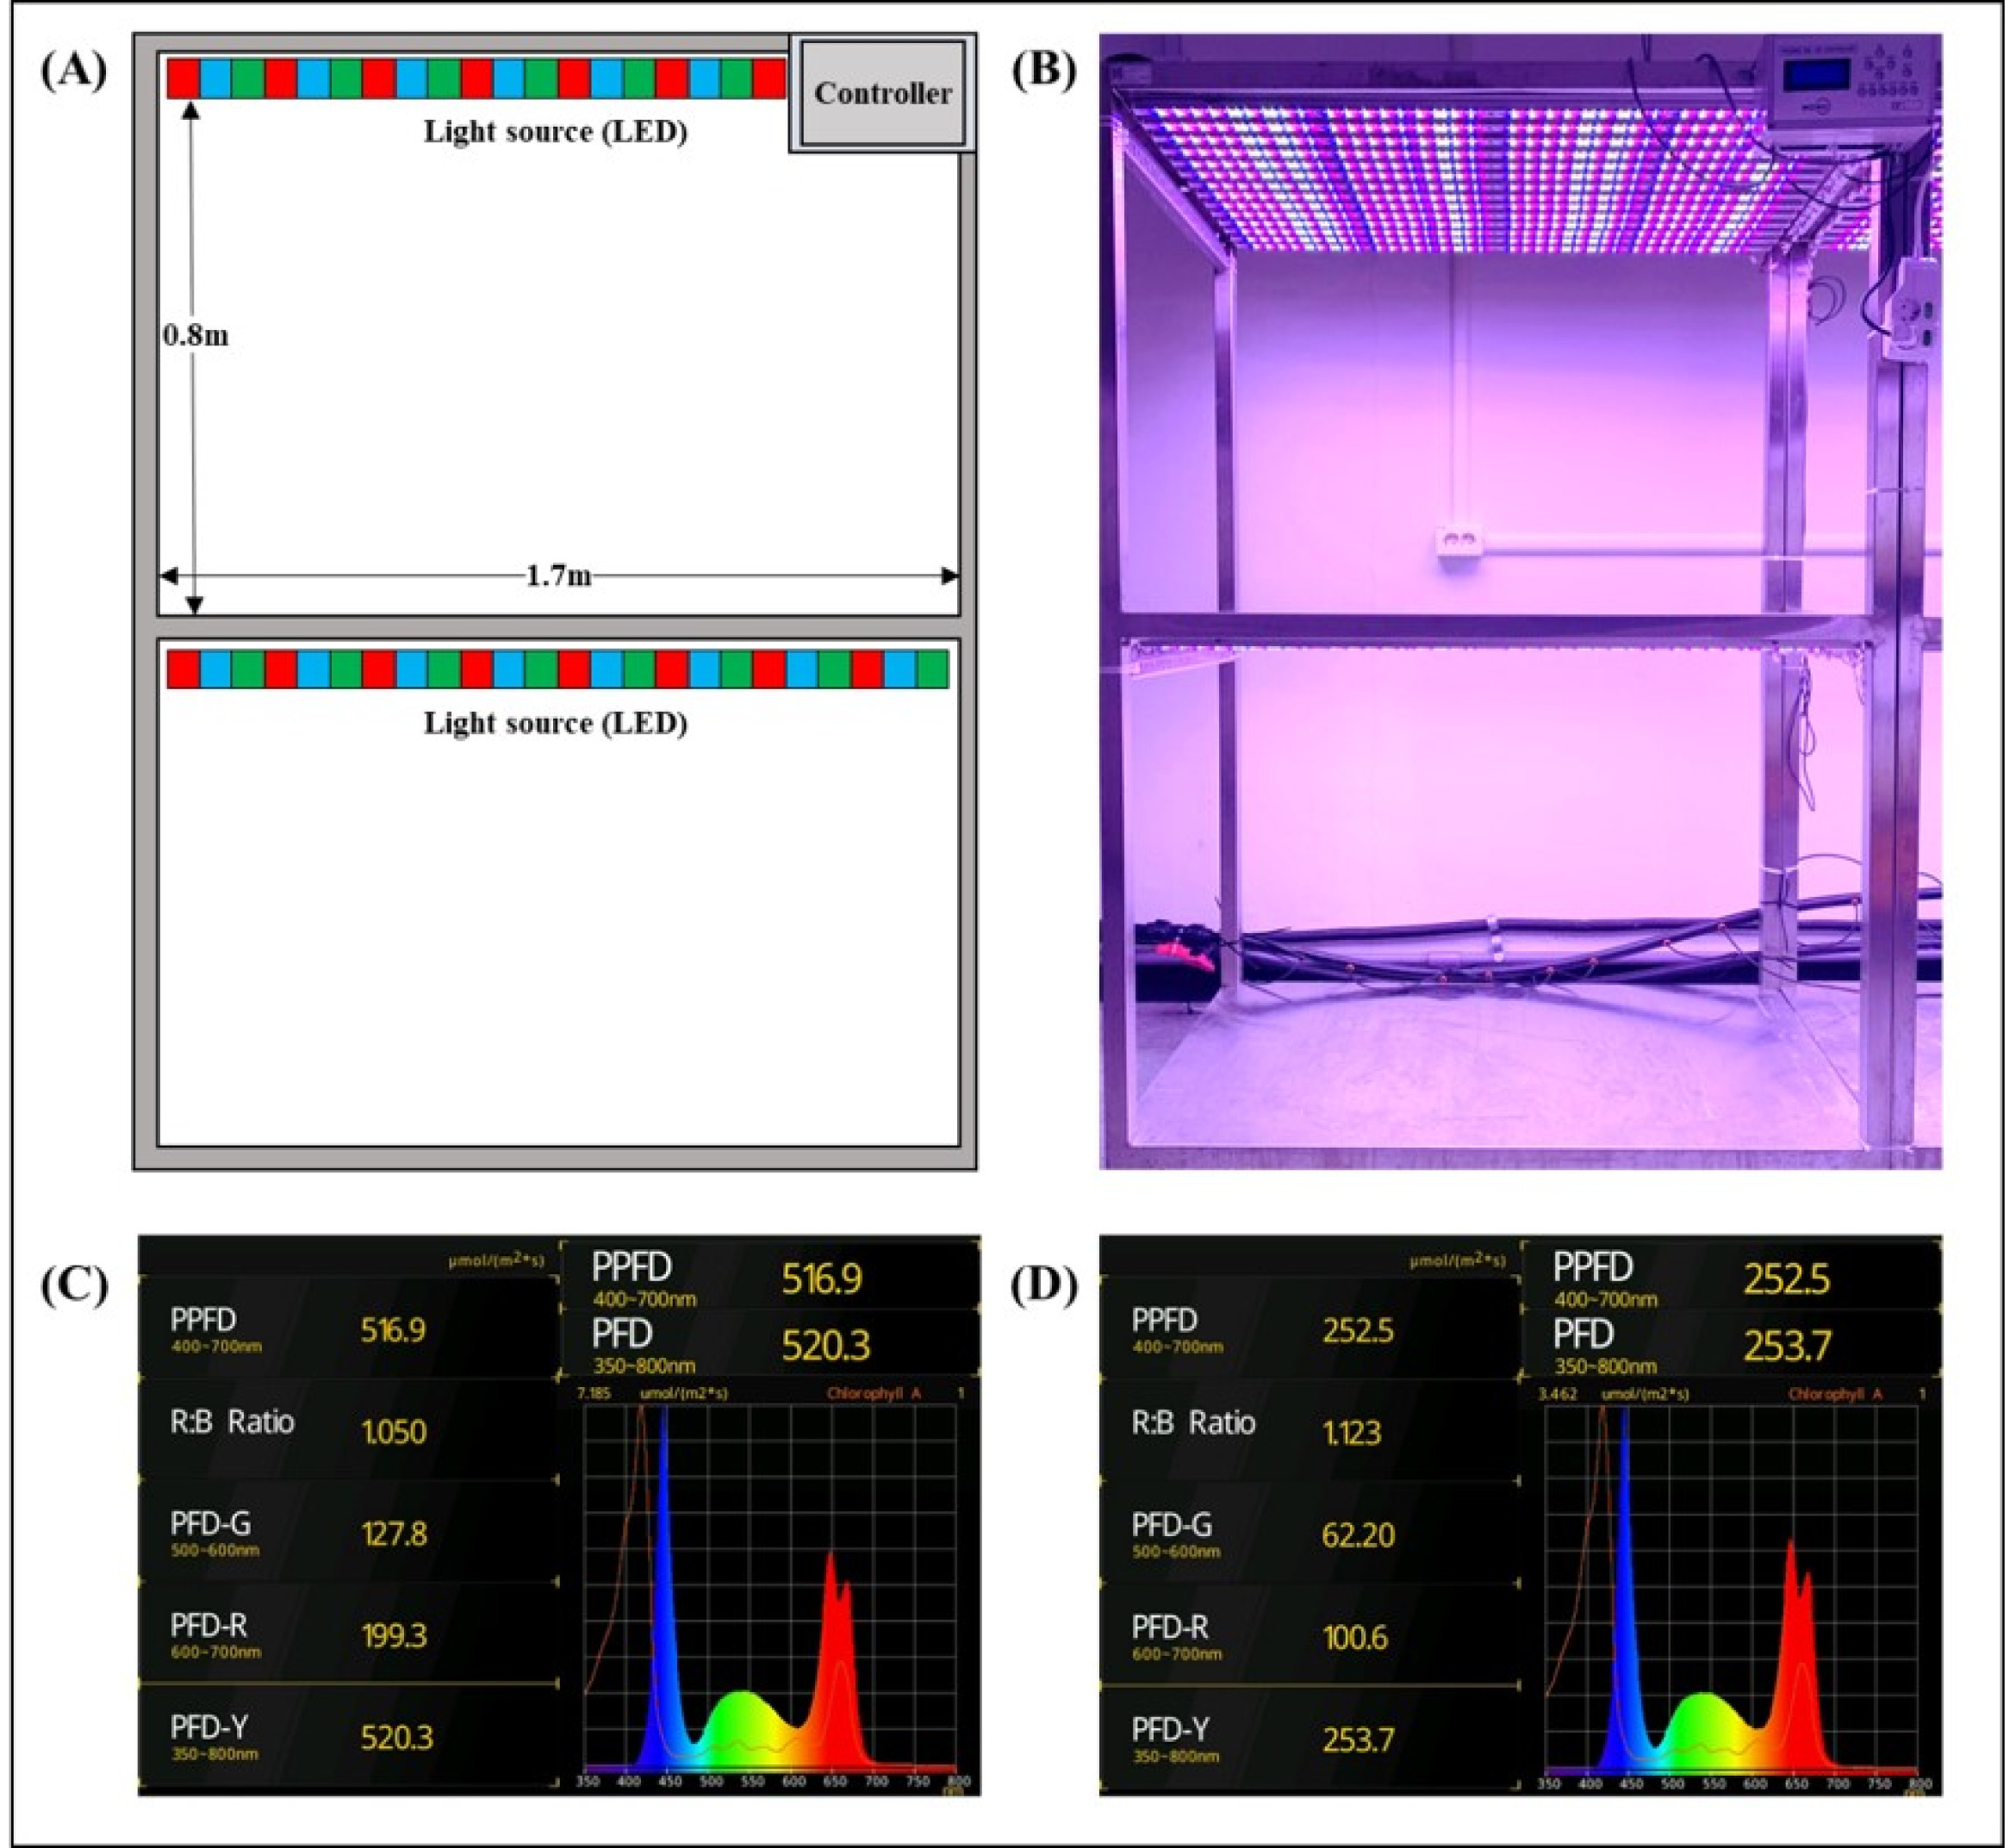
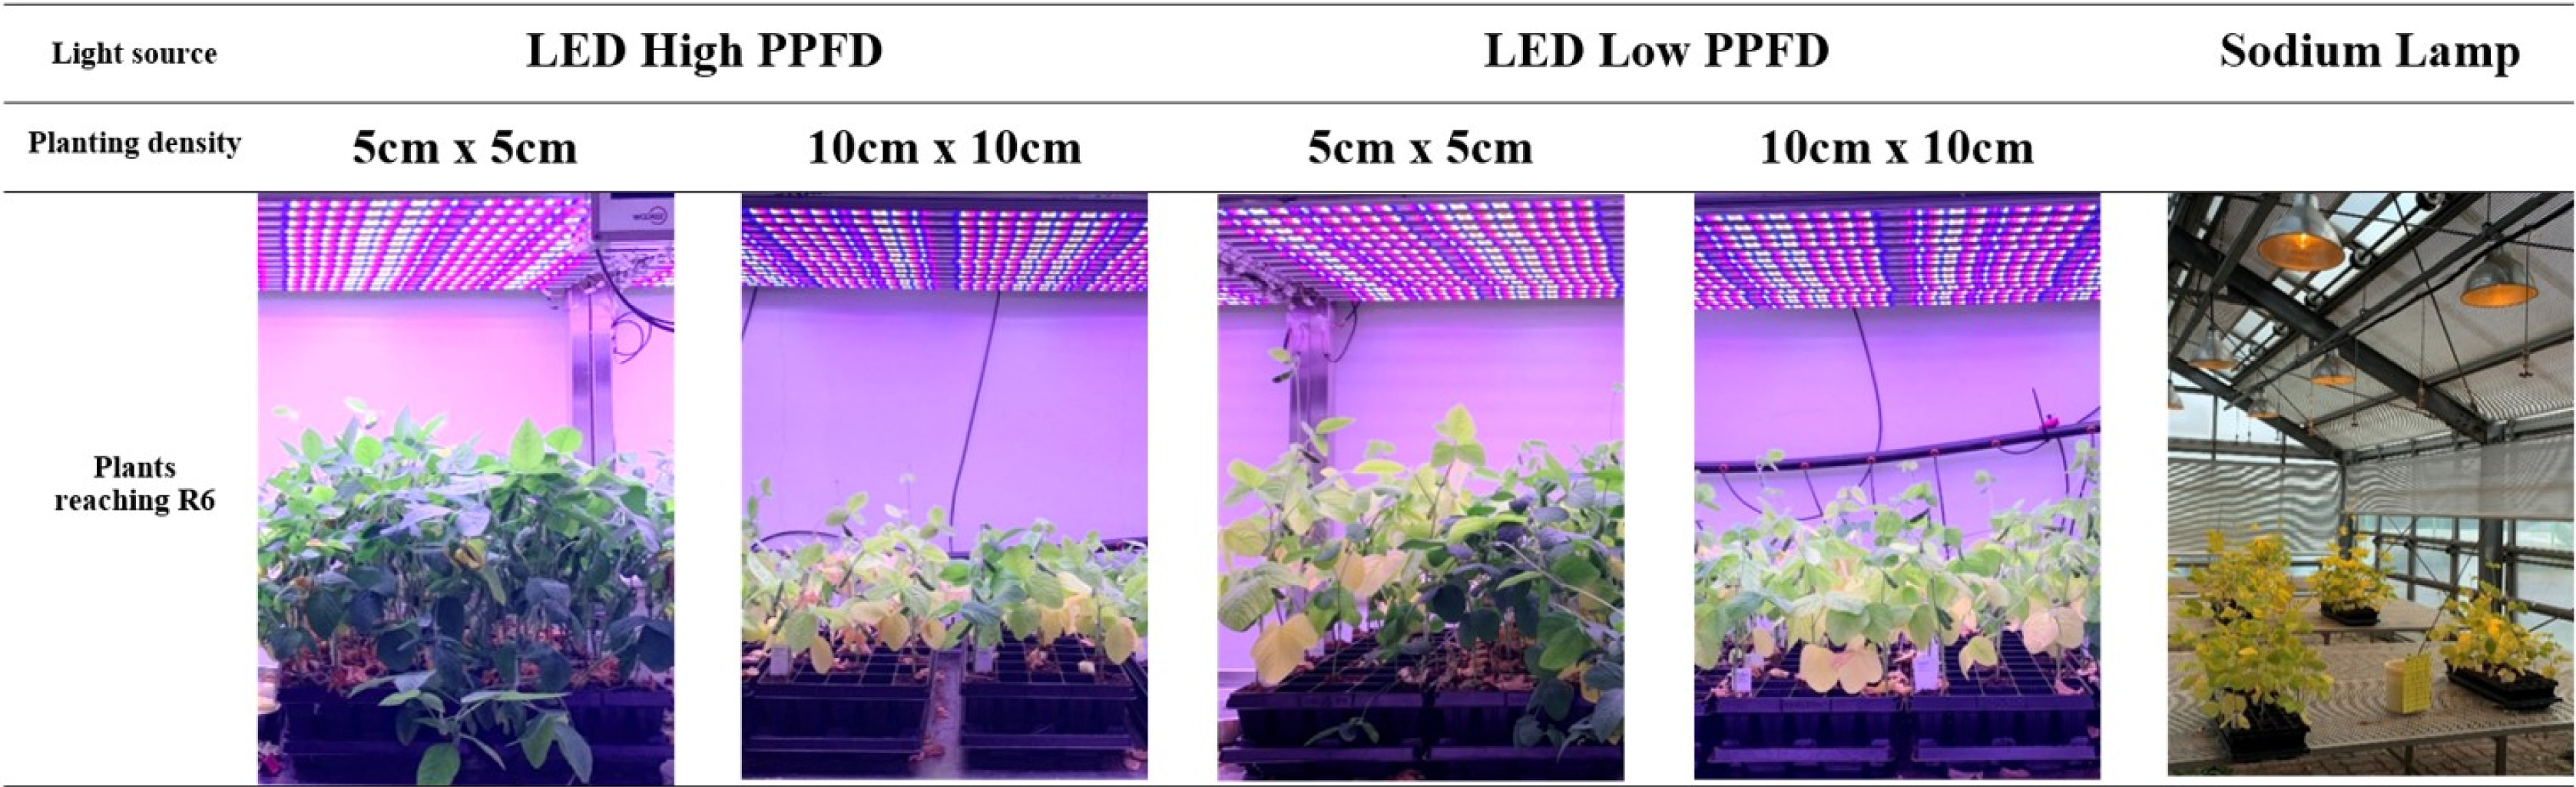
Fig. 2R6 stage plants by planting density and light source.

Fig. 3The average number of days in R1 and R6, as well as the average number of pods per plant, are represented in a bar graph. (A) A bar graph showing the median number of days until R1. An average of 10.7 days was shorter under the LED condition than under the sodium light condition. (B) A bar graph showing the typical number of days till R6. In comparison to sodium lamp conditions, the varieties achieved R6 on average 22.6 days sooner in LED conditions. (C) bar plot of the average number of pods per plant. The number of pods per plant was highest in the high PPFD condition and decreased in the order of low PPFD and sodium lamp.
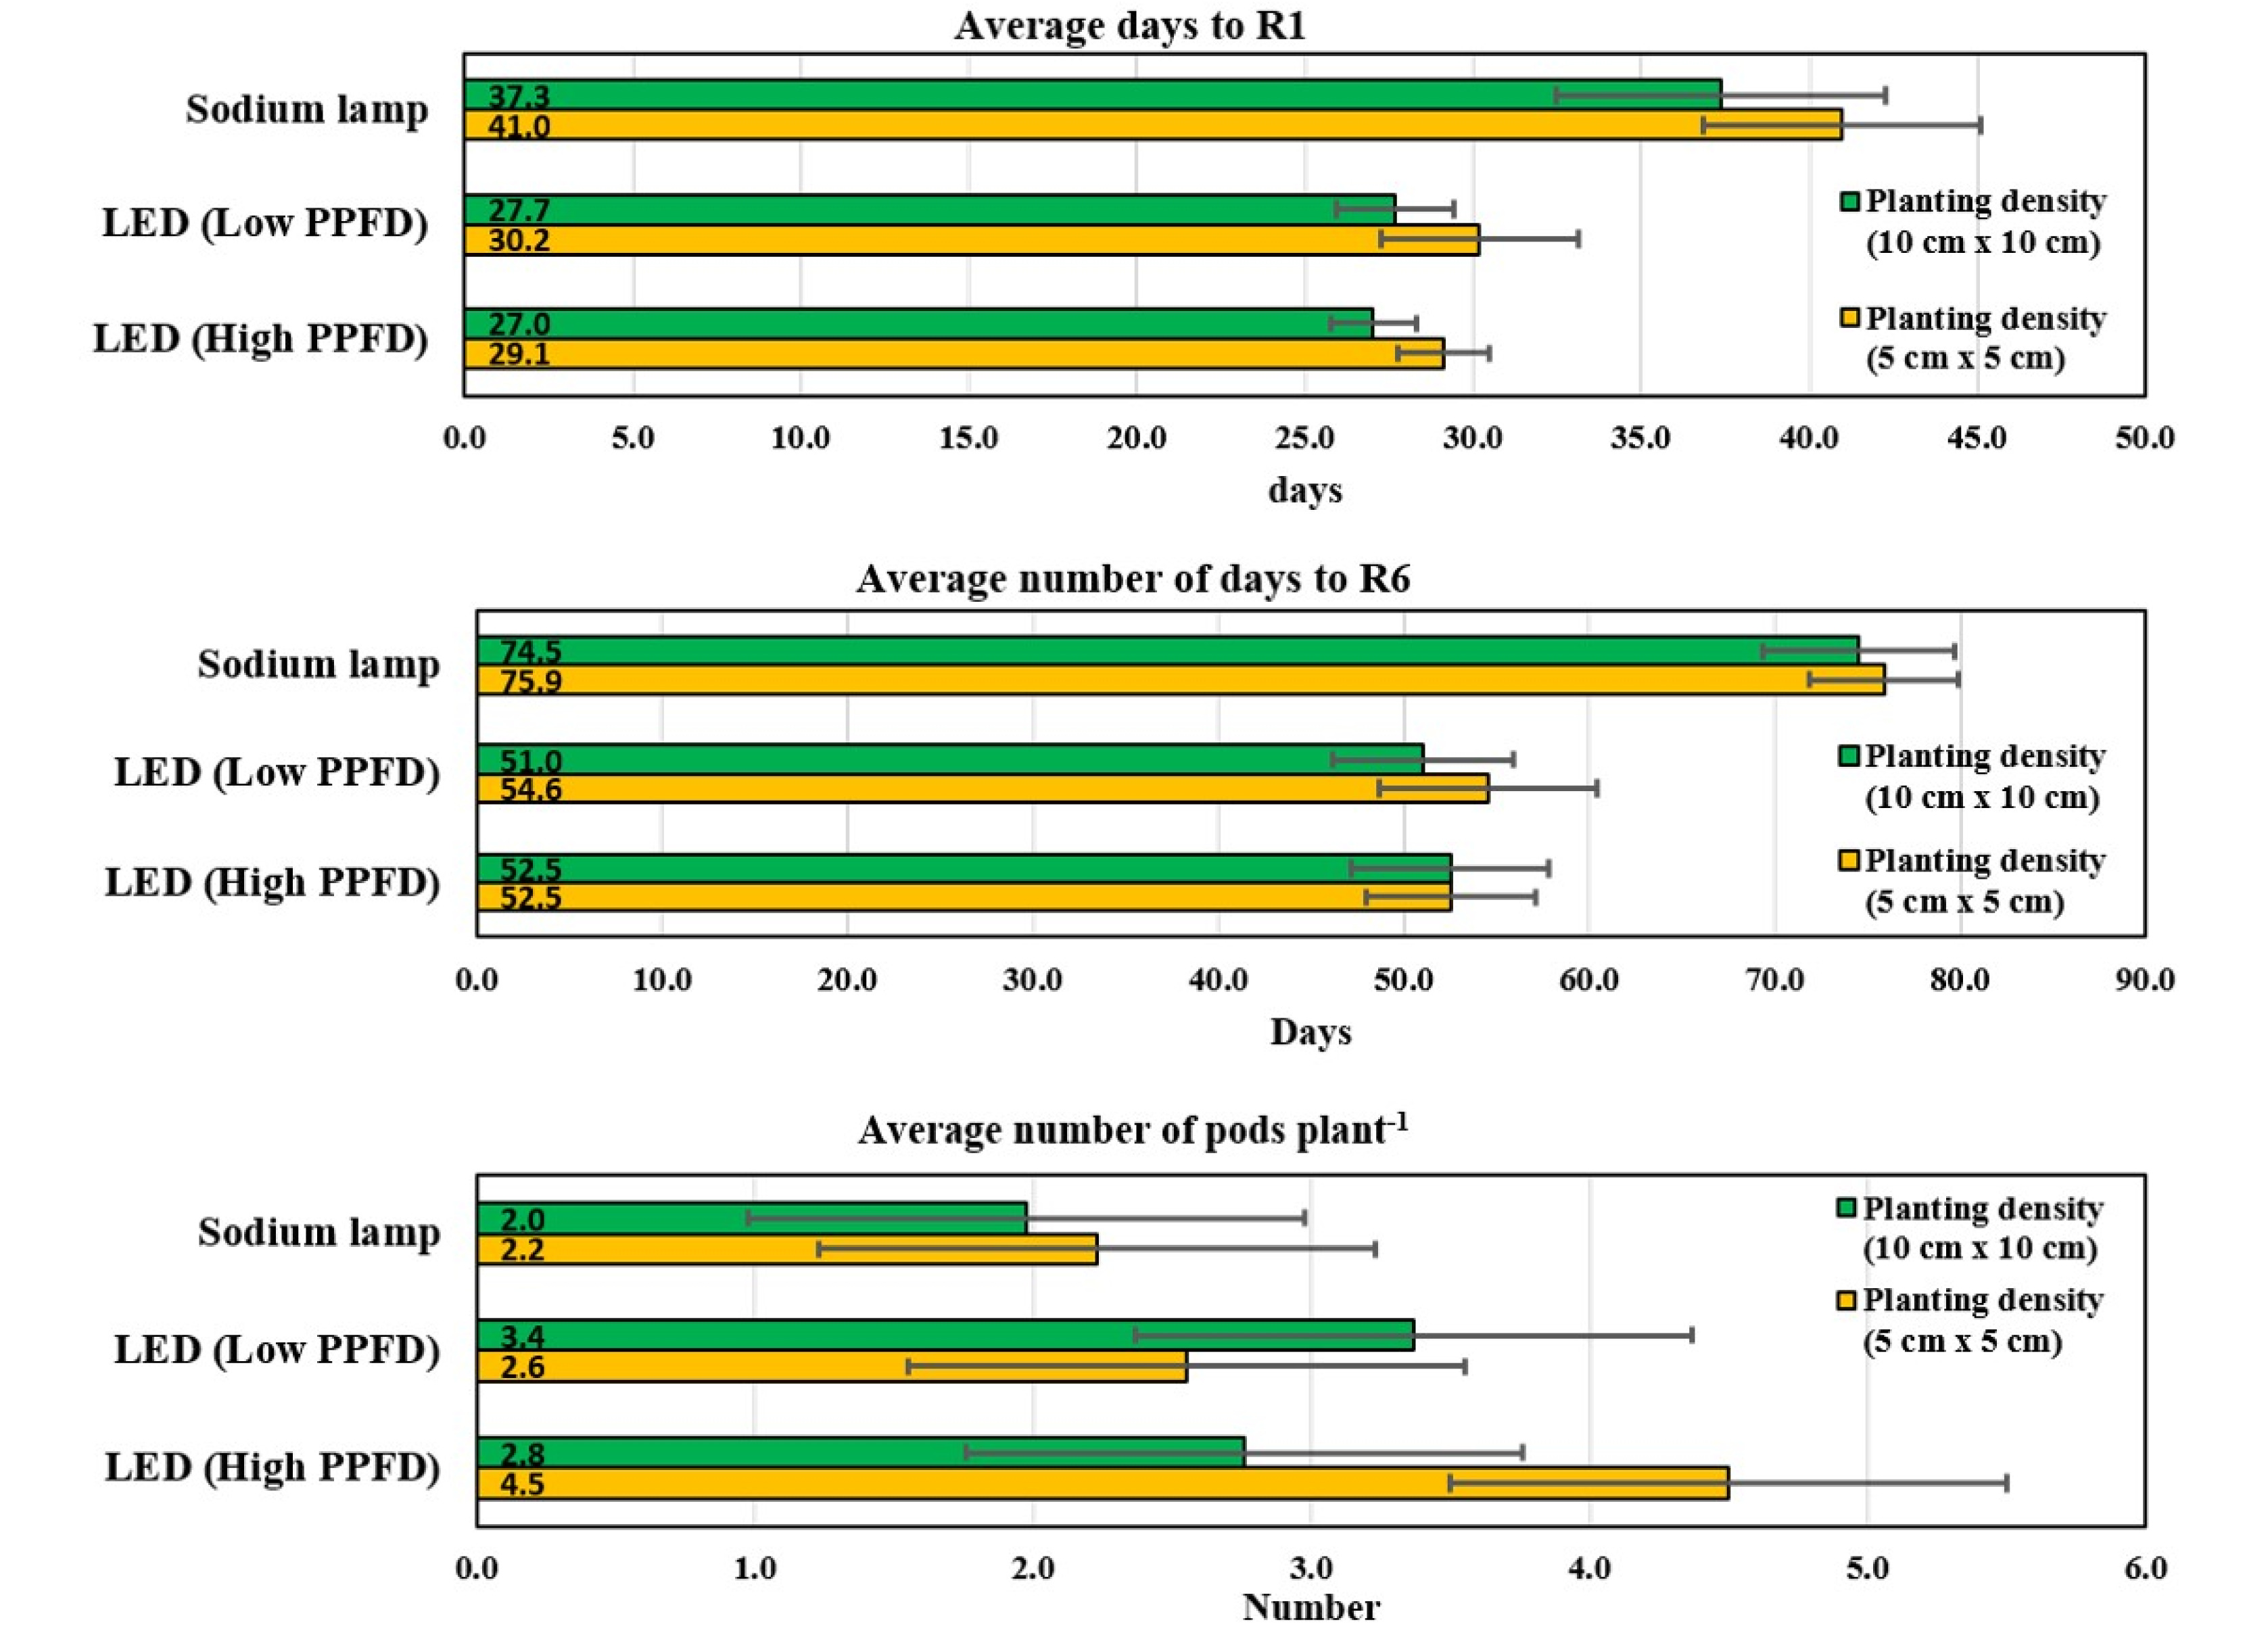
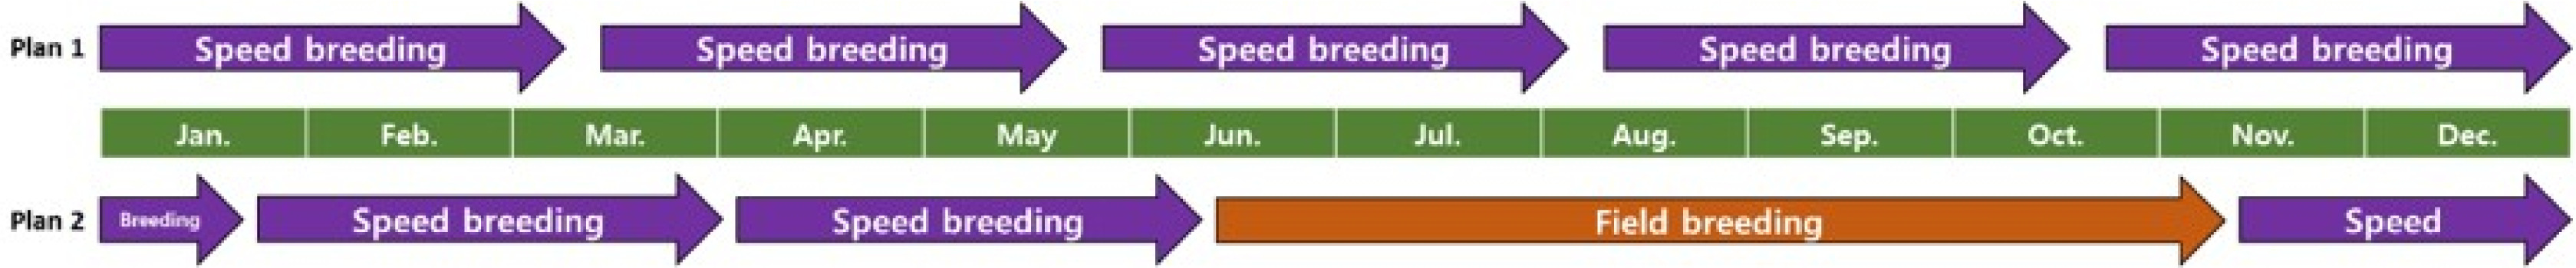
Fig. 4One-year breeding strategy using speed breeding (SB). If employing only SB, it is possible to advance five generations per year. It is feasible to advance three generations indoors and one generation outside, for a total of four generations, if it includes the development of lines in field.

Table 1Summary of photosynthetic photon flux density measurement results under various light conditions.
Table 1
|
Condition |
Point of measurement |
PPFD (mmol/(m2∙s)) |
PFD-B
(mmol/(m2∙s)) |
PFD-G
(mmol/(m2∙s)) |
PFD-R
(mmol/(m2∙s)) |
|
LED (High PPFD) |
30 cm above the ground |
506.0 ± 7.4 |
184.9 ± 4.8 |
126.1 ± 1.2 |
195.1 ± 3.6 |
|
LED (Low PPFD) |
|
257.4 ± 10.4 |
92.9 ± 3.8 |
63.4 ± 3.1 |
101.1 ± 4.0 |
|
Sodium lamp (day) |
|
288.5 ± 6.9 |
35.4 ± 2.6 |
158.2 ± 4.2 |
94.5 ± 4.0 |
|
Sodium lamp (night) |
|
188.4 ± 10.8 |
10.8 ± 6.7 |
126.2 ± 5.7 |
55.5 ± 5.6 |
Table 2List of varieties used in the experiment according to maturity group.
Table 2
|
Maturity group |
List of varieties |
|
Early-maturity group |
Hannam, Ilpumgeomjeong, Josaengseori, Yonpoong |
|
Mid-maturity group |
Pungwon, Galchae, Haman, Williams82, Daewon, Hwangkeum, Cheongja, Socheong 2, Daeheuk |
|
Mid-late-maturity group |
Daepung, Soho, Taekwang, Uram, Danbaek, Saedanbaek, Cheongja 3 |
|
Late-maturity group |
Bangsa, Somyeong, Shinhwa, Pureun, Heukcheong, Seoritae |
|
Unknown maturity group |
PI96983, 1000-al, PI84669 |
References
- Alahmad S, Dinglasan E, Leung KM, Riaz A, Derbal N, Voss-Fels KP, et al. 2018. Speed breeding for multiple quantitative traits in durum wheat. Plant Methods. 14: 36
- Cha J-K, Lee J-H, Lee S-M, Ko J-M, Shin D. 2020. Heading date and growth character of Korean wheat cultivars by controlling photoperiod for rapid generation advancement. Korean J. Breed. Sci.. 52: 20-24.
- Cha J-K, Park M-R, Shin D, Kwon Y, Lee S-M, Ko J-M, et al. 2021. Growth characteristics of triticale under long-day photoperiod for rapid generation advancement. Korean J. Breed. Sci.. 53: 200-205.
- Eathington SR, Crosbie TM, Edwards MD, Reiter RS, Bull JK. 2007. Molecular markers in a commercial breeding program. Crop Sci.. 47: S-154.
- Fang Y, Wang L, Sapey E, Fu S, Wu T, Zeng H, et al. 2021. Speed-breeding system in soybean: integrating off-site generation advancement, fresh seeding, and marker-assisted selection. Front. Plant Sci.. 12: 717077
- Forster BP, Thomas WTB. 2005. Doubled haploids in genetics and plant breeding. J Janick (Ed.). Plant Breed. Rev. pp. 57-88.
- Frisch M, Bohn M, Melchinger AE. 1999. Comparison of selection strategies for marker-assisted backcrossing of a gene. Crop Sci.. 39: 1295
- Ghosh S, Watson A, Gonzalez-Navarro OE, Ramirez-Gonzalez RH, Yanes L, Mendoza-Suarez M, et al. 2018. Speed breeding in growth chambers and glasshouses for crop breeding and model plant research. Nat. Protoc.. 13: 2944-2963.
- Hickey LT, Pereyra SA, Diaz JE, Ziems LA, Fowler RA, et al. Germán SE2017. Speed breeding for multiple disease resistance in barley. Euphytica. 213: 64
- Hospital F, Chevalet C, Mulsa P. 1992. Using markers in gene introgression breeding programs. Genetics. 132: 1199-1210.
- R Core Team.2022. R: A language and environment for statis-tical computing. R Foundation for Statistical Computing. https://www.R-project.org/..
- Ihaka R. Gentleman R. Gentleman R.
- Jahne F, Hahn V, Wurschum T, Leiser WL. 2020. Speed breeding short-day crops by LED-controlled light schemes. Theor. Appl. Genet.. 133: 2335-2342.
- Johnson R. 2003. Marker-assisted selection. Plant Breed. Rev.. 24: 293-309.
- Meuwissen THE, Hayes BJ, Goddard ME. 2001. Prediction of total genetic value using genome-wide dense marker maps. Genetics.. 157: 1819-1829.
- O'Connor DJ, Wrightb GC, Dietersc MJ, Georged DL, Huntere MN, Tatnellf JR, et al. 2013. Development and application of speed breeding technologies in a commer-cial peanut breeding program. Peanut Sci.. 40: 107-114.
- Septiningsih EM, Pamplona AM, Sanchez DL, Neeraja CN, Vergara GV, Heuer S, et al. 2009. Development of submergence-tolerant rice cultivars: the Sub1 locus and beyond. Ann. Bot.. 103: 151-160.
- Statistics Korea.2022. Production of autumn cabbages, autumn radishes, beans, apples and pears in. Production of autumn cabbages. autumn radishes, beans, apples and pears in.
- Voss-Fels KP, Herzog E, Dreisigacker S, Sukumaran S, Watson A, Frisch M, et al. 2019. "SpeedGS" to Accelerate Genetic Gain in Spring Wheat. Miedaner T. Korzun V (eds) Applications of Genetic and Genomic Research in Cereals. pp. 303-327.:
- Watson A, Ghosh S, Williams MJ, Cuddy WS, Simmonds J, Rey MD, et al. 2018. Speed breeding is a powerful tool to accelerate crop research and breeding. Nat. Plants.. 4: 23-29.
- Yu, C., R. R: